Embed Size (px)
Citation preview


Cabras #1 and #2 were installed in 1974 and 1975 respectively (37 and 36 years old respectively)
Two 66 MW reheat units fired with RFO No. 6
TEMES: Plant Performance Management Contractor since 2003
TEMES: Contract requires performance testing every two years
Overhauls: Most Recent & Next Planned Cabras #1 July 2010; July 01 – July 30, 2012
Cabras #2 April 2009; January 08 – February 16, 2012
Contract requirements Effective Availability Factor at 90% minimum
Gross Heat Rate 1st contract year: Within +2% of baseline (baseline from 2005 performance test)
2nd – 5th contract year: ±1% of baseline
For 2nd and 3rd year baseline was from 1st year performance testing
For 4th and 5th year baseline was from 3rd year performance testing
2

McHale and Associates, Inc. - hired to conduct performance testing on the units to gauge efficiency and provide a roadmap and benchmark for improvements
Timeline Testing: May 21 – June 02, 2011 Preliminary Report to TEMES: July 18, 2011 General Comments submitted by TEMES to McHale:
August 16, 2011 Final Report submitted to TEMES by McHale: October
26, 2011 Report submitted to GPA with Comments: October
29, 2011 GPA has not completed review or submitted
comments3

Add O2 analyzer and CO analyzer system - 2010 Bond Funds
Implement fully integrated Distributed Control System (DCS) combined with CO and O2 control ability and Boiler Management System (BMS) –Bond Funds
Vary levels on feedwater heaters to produce the lowest DCA (Drain Cooler Approach). If values do not improve, repair drain cooler section of the feedwaterheater – O&M
Check lift on CWP – O&M (CWP 1B Completed)
Check back wash valve on the condenser water box divider plates – O&M (Unit #2 Completed)
Check vacuum system – O&M (Completed and no leaks found)
Maintain and wash air heater regularly, consider using double seals – O&M
Clean condenser tubes by high pressure jet with brush - O&M
Operate the Cabras units between 48MW and 54MW
Consider separate waste oil treatment facility apart from the Cabras units – CIP 2010 Bond Funds
Reduce station power consumption rates by operating the units at higher levels, and invest in high efficiency motors and a variable frequency drives –O&M and CIP (SAIC Initiative) 4

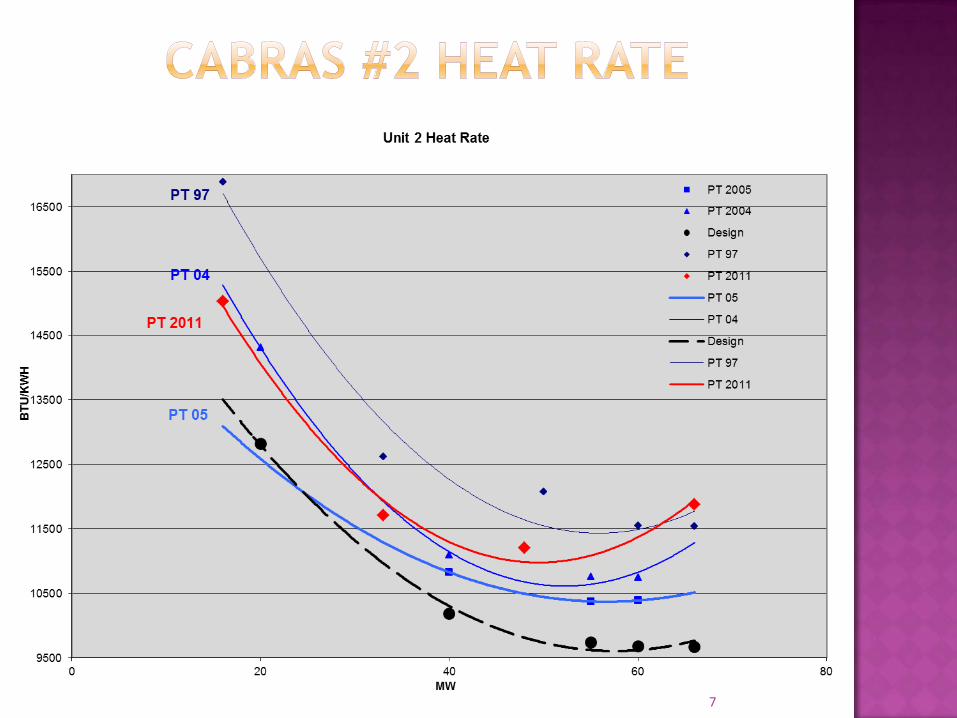
Design curve represents ideal condition 1974/1975 design values will always exceed
actual performance test values There is an impact when fuel consumption
increases for the same MW output. There is natural degradation of performance
as the units ageGPA works to maintain performance levels
near latest performance test values, and to balance reliability and efficiency investments to maximize customer benefits
5

6
7

2008 IRP Original retirement for Cabras #1 & #2 was
2018/2019 Evaluation was conducted on deferring units’
retirement every year until 2035 2027 is recommended retirement year IRP is currently being updated Plant assessment is necessary to determine true
needs for life extension
8

9

10

11
Condenser Water Box
# of tubes = 8,224

INLET
OUTLET
OUTLET
INLET
RETURN
LP TURBINE EXHAUST HOOD
STEAM
SEA WATER
HOTWELL
CONDENSER
SEA WATER
BOX
BOX
BOX
SCHEMATIC OF CONDENSER
12

13
Elevation View of Condenser
Condenser tubes stand 12’8” tall

When unit is online, condenser tubes are surrounded by steam from turbine Temperature of 105◦-110◦
Safety concern – 10 min. limit for maintenance workers in confined high heat box
High pressure jet hose and pressure washer with brush attachment used for cleaning.
Chlorine dioxide for continuous condenser cleaning Previously ruled out by EPA
14
2003-2007 14 sections of tube failures
• Most failures at high heat flux of arch way tubes (8) and side wall tubes (5),
• Caused by water-side corrosion or blisters due to deposits. • Resolution: (1) New water treatment facility (RO+EDI)
commissioned (2) chemical cleaning performed (3) material attenuation examination used on critical areas (high heat flux of arch way and water wall tubes)
75% of high heat flux tubes replaced
2008 - Present 12 sections of tube failures
Most failures located on burner zones of front wall, lower panel of sidewall next to the inlet header, corner of water wall and reheatertubes
15

Cabras 1&2 burns waste oil for the island
Waste oil
• 2 types - processed and unprocessed
• 3% to 7% of total fuel consumed by the plant (1 – 3 million gallons annually)
• Unprocessed waste oil creates heavy deposits on the outer walls of boiler tubes
• Affects good heat transfer
• Damages boiler tubes
Established new procedure for processing of waste oil to minimize damage
16

Performed boiler tube material attenuation examination test - More than 100 sections of tubes replaced
New water treatment facility, RO+EDI established in 2009
Unit 1 cold end and hot end air heater baskets replaced in 2010
Established new procedure for waste oil transferring
Major maintenance outages reduced from 49 days to 35 days - better planning and use of cold stand by days
17

Unit 1 blasting of turbine blades, cleaning and replacing turbine buckets
Units 1 & 2 regular cleaning of condenser tubes
All Units 1 & 2 feed water heaters placed in service
Units 1 & 2 increased combustion air flow by 10%
Unit 2 leakage rate of air heater minimized
Unit 2 water consumption minimized Increased the security of the starting air ejector
Replaced leaking boiler tubes
Boiler continuous blow down(BCBD) of valves
18

Expenses (2010-2011) Amount
1 Services $855,981.66
2 Maintenance $2,714,724.09
3 Parts/Supplies $1,652,683.29
4 Training $91,688.47
5 Admin $27,414.97
TOTAL $5,342,492.48
19
Training activities for GPA employees include:1) Plant Preventive Maintenance2) Control Operations3) Mechanical Maintenance4) Leadership Management

CALENDAR YEAR AMOUNT
1 2005 $2,976,719.98
2 2006-2007 $3,987,559.96
3 2008-2009 $5,365,320.65
4 2010 $754,119.58
TOTAL $13,083,720.17
20

Work Description Project Cost Purpose
1 Unit 1 Condenser retubing $1,049,486.96 Reliability & Efficiency
Addresses McHale recommendation
2 Replace attemperator System $448,059.11 Reliability Addresses McHale recommendation
3 #5 HTR tube bundle replacement $353,636.07 Reliability & Efficiency
Addresses McHale recommendation
4Unit 1 Service water pipe renovation $597,506.00 Reliability
5 Arch tube replacement $201,311.56 Reliability
6 Replace one set of CWP & motor $55,500.02 Reliability
7Replace butterfly valve on CWPsystem $113,625.02 Reliability
8 Boiler refractory renewal $11,450.35 Reliability
9 Economizer replacement $146,144.89 Reliability
TOTAL $ 2,976,719.98
21

Work Description Project Cost Purpose
1Unit 1 upgrde air preheater basket hot-cold $184,248.52 Reliability &
EfficiencyAddress McHale recommendation
2 Unit 2 preheat and heat treatment $28,679.80 Reliability
3 Economizer HDR replacement $15,422.76 Reliability
4 Upgrade control valve $153,714.50 Reliability
5 Replace reheater & S.H. tubes $323,374.19 Reliability & Efficiency
6 Arch tube material replacement $201,913.79 Reliability & Efficiency
7Boiler casing and refractory renewal $670,708.85 Reliability
8 Unit 2 generator rotor rewinding $1,475,045.40 Reliability
9 Unit 2 condenser retubing $934,452.15 Reliability & Efficiency
Address McHale recommendation
TOTAL $ 3,987,559.96
22

2010
Work Description Project Cost Purpose
1Unit 2 service water cooler retubing $408,246.27 Reliability
2 #2 boiler chemical cleaning (Acid) $293,531.30 Reliability & Efficiency
3Install water treatment facility RO+EDI $1,356,766.88 Reliability
4 Arch tube replacement $506,716.09 Reliability & Efficiency
5Replace rear wall & side wall rupture tubes $992,222.49 Reliability &
Efficiency
6 Unit 2 replace air preheater basket $232,716.23 Reliability & Efficiency
Address McHale recommendation
7 Turbine generator overhaul $1,575,121.39 Reliability & Efficiency
Address McHale recommendation
TOTAL $ 5,365,320.65
23

Work Description Project Cost Purpose
1 Unit 1 smoke stack insulation refurbishment $437,748.80 Reliability
2 Unit 2 NDE boiler tube testing and inspection $57,233.18 Reliability
3 Replace air preheater cold end basket $211,478.22 Reliability Address McHale
recommendation
4 Unit 1 RH tube replacement $47,659.38 Reliability & Efficiency
TOTAL $754,119.58
24

Work Description Project Cost Purpose
1 Replace reheater tubes 35 panels $1,113,000.00 Reliability, Efficiency
3 Unit 2 heater drain pump replacement $83,222.00 Reliability
4 Unit 2 BFP motor replacement & fuel oil pump replacement $240,631.00 Reliability
5 DCS/BMS System $5,000,000.00 McHaleRecommendations CIP Bond Funds
6 Waste oil treatment system $150,000.00 Reliability, Efficiency
7 Unit 2 instrument air compressor and dryer replacement $129,856.00 Reliability
TOTAL $ 6,716,709.00
25

26
Project Name Project Cost Purpose
1 Facility Improvements $1,288,000 Address safety/insurance concern and reliability
2 Fire Protection for Transformers and Fire Detection System for Boiler Burner Area $1,400,000 Address safety/insurance concern
and reliability
3 Replace Cabras Unit #2 Hydrogen and CO2 piping $ 75,000
4 Replace Existing Yard Fire Hydrant System $420,000 Address safety/insurance concern and reliability
5 Install Generator On-Line Monitoring System for Unit 1&2 and Provide Electrical Testing and Measuring Equipment $ 228,000 Reliability
6 Waste Oil Facility Improvements $150,000 Reliability, Efficiency
Addresses McHale recommendation
7 Cabras #2 Reheater Tubes Replacement $1,113,000 Reliability
8 Replace Cabras Unit #1 Feedwater Heater #2 and Unit #2 FWH #4 $1,090,000
Reliability, Efficiency
Addresses McHale recommendation
9 Replace Cabras Unit #1 Instrument Air Compressor 1B & Cabras Unit #2 Service Air Compressor $265,000 Reliability
10 Cabras Unit #2 Heater Drain Pump & Motor Replacement $240,000 Reliability
11 Replace one Boiler feed Pump Motor for Cabras Unit #1 $275,000 Reliability
12 Replace One Forced Draft Fan Motor for Cabras Unit #1 $275,000 Reliability, Efficiency
13 Replace Service Water Cooler for Cabras Unit #1 $500,000 Reliability, Efficiency
14 Replace Unit #1 Auxiliary Transformer - Cabras 1&2 $500,000 Reliability
15 Total $7,819,000

27
Work Description Cost Purpose
*1 Replace Unit front Wall Tubes and Lower Hopper Header $870,000.00 Reliability,
Efficiency
*2 Unit 1 boiler feed pump repair $92,073.09 Reliability
3 Unit 2 boiler water wall tubes replacement $740,317.00 Reliability
*4 Unit 2 boiler tubes NDE/Attenuationmeasurement $108,296.00 Reliability
*5 Unit 2 BFP motor replacement $197,683.00 Reliability
6 Air preheater basket replacement $174,392.00 Reliability Addresses Mchalerecommendation
7 Vibration adjustment for unit 1 generator #4 bearing $23,083.39 Reliability
*8 Replace traveling screen wash pump/motor $74,570.00 Reliability
9 Main condenser tube cleaning $10,000.00 Efficiency Addresses McHale recommendation
10 Air preheater basket cleaning $10,000.00 Efficiency Addresses McHale recommendation
11 Replace deaerator pegging steam control. $15,000.00 Reliability Addresses McHale recommendation
12 Adjust feedwater heater operating level and reduce drain cooler approaching temperature Efficiency Addresses Mchale
recommendation
18 Repair temperature control for RH steam and main steam
Reliability, Efficiency
Addresses McHale recommendation
TOTAL COST $2,315,414.48
*Financed Overhaul Activities $1,342,622.09

28PUC Target: Minimum 87%
In Nov-2010, Cabras #2 had furnace repairs and tube leak repairs. In Aug-2011, Cabras #1 had a faulty expansion differential probe . The unit was derated and then came offline to replace faulty parts.

29

GPA’s dispatching efficiencies
One Cabras Unit placed on Cold Standby
Reduced spinning reserve
Reduced reliance on peaking units
More stable generation production
Reduced Daily Fuel Costs
30

31
14.40
14.60
14.80
15.00
15.20
15.40
15.60
15.80
16.00
16.20
Oct-10 Nov-10 Dec-10 Jan-11 Feb-11 Mar-11 Apr-11 May-11 Jun-11 Jul-11 Aug-11 Sep-11
KW
H/G
al
Month
Base Load Gross Heat RateOct 2010 - Sept 2011

System Efficiency = 16.02 kwh/gal
37
37
32
34
31
10
78.5
34
34
31
32
32
10
86.5
32
32
31
32
31
10
91.5
30
30
31
32
30
10
96.5
30
30
29
32
31
10
97.5
30
30
29
32
33
10
95.5
33
33
31
33
32
10
87.5
36
36
31
33
31
10
82.5
38
38
33
35
32
10
73.5
42
42
35
37
32
10
61.5
44
44
37
37
36
10
51.5
44
44
37
37
39
103
45.5
44
44
37
37
39
106
42.5
44
44
37
37
47
10
40.5
44
40
37
37
51
101.6
36.3
44
43
37
37
44
106
44.5
44
44
37
37
50
10
37.5
44
44
37
37
50
10
37.5
44
44
37
37
52
10
35.5
44
44
37
37
58
14
25.5
44
44
37
37
60
10
27.5
44
44
37
37
56
10
31.5
44
44
37
37
44
10
43.8
44
44
36
37
31
10
57.5
0
50
100
150
200
250
300
0:00 1:00 2:00 3:00 4:00 5:00 6:00 7:00 8:00 9:00 10:00 11:00 12:00 13:00 14:00 15:00 16:00 17:00 18:00 19:00 20:00 21:00 22:00 23:00
181 173 168 163 162 164 172 177 186 198 208 214 217 219 220.6 221 222 222 224 234 232 228 216 202
GENERATION LOADING REPORT 24 October, 2011
Spinning
Orote #1
Orote #2
Tango 2
Cabras 1
Cabras 3
Cabras 4
MEC 8
MEC 9

Whenever a baseload unit is unavailable, GPA will need to use Diesel Units to compensate for loss of capacity
Tenjo, MDI and Talofofo units are Peaking Units, used for Peak Hour Demands
To compensate for Cabras 1&2 loss, GPA would need to run YCT, MCT and TEMES
Diff. in efficiency = 2 to 5 kwh/gal
EFFICIENCY GROSS HEAT RATE
kwh/gal btu/kwh
MEC (Piti #9) 44 17.70 8,205 MEC (Piti #8) 44 17.66 8,222 Cabras #3 39 16.88 8,602 Cabras #4 39 16.37 8,871 Cabras #1 66 14.16 10,260 Cabras #2 66 13.33 10,898 Pruvient (Tanguisson #1) 27 11.13 13,049 Pruvient (Tanguisson #2) 27 10.91 13,309 Tenjo #1 4 14.38 9,605 Tenjo #2 4 13.92 9,917 Tenjo #3 4 14.20 9,722 Tenjo #4 4 14.64 9,430 Tenjo #5 4 14.54 9,497 Tenjo #6 4 13.45 10,269 MDI 1 5 14.59 9,467 MDI 2 5 14.62 9,446 Talofofo 1 4 13.23 10,440 Talofofo 2 4 14.85 9,302 Dededo DSL 1 3 12.50 11,048 Dededo DSL 2 3Dededo DSL 3 3 12.50 11,048 Dededo DSL 4 3YCT 22 11.21 12,313 MCT 22 10.22 13,513 TEMES 40 6.57 21,026 DCT 1 23DCT 2 22Marbo 16
GENERATING UNITMAX. CAP.

3 scenarios 1. Cabras #1 online with Cabras #2 on reserve
shutdown (RS)2. Cabras #1 and #2 online3. Cabras #1 and #2 offline
1 - Cabras #1 online Cabras #2 on RS
2 - Cabras #1 & #2 Online
3 - Cabras #1 & #2 Offline
Peak Load 241 MW 241 MW 241 MW
Spinning Reserve 26 MW - 58 MW 85 MW - 157 MW 30 MW - 51 MW
Fuel Cost $796,802.66 $811,511.70 $870,419.48
Savings / (Costs) $(14,709.04) $(58,907.78)
34

35
DATE GROSS GENERATION
FUEL CONSUMPTION
NET FUELEFFICIENCY Cost per KWH % of Generation
from BaseloadsGROSS HEAT
RATE
kWh (Gallons) kwh/gal btu/kWh
1-Oct-11 4,679,700 295,670 15.83 $ 0.1607 100.00% 9,1762-Oct-11 4,251,900 258,264 16.46 $ 0.1538 92.13% 8,8223-Oct-11 4,500,900 284,171 15.84 $ 0.1598 92.22% 9,1704-Oct-11 4,610,700 292,088 15.79 $ 0.1599 97.27% 9,2015-Oct-11 4,696,800 297,305 15.80 $ 0.1596 100.00% 9,1936-Oct-11 4,795,500 305,174 15.71 $ 0.1615 100.00% 9,2437-Oct-11 5,042,700 326,878 15.43 $ 0.1634 100.00% 9,4158-Oct-11 4,931,900 318,979 15.46 $ 0.1630 100.00% 9,3949-Oct-11 4,871,800 302,368 16.11 $ 0.1564 100.00% 9,014
10-Oct-11 4,934,500 310,118 15.91 $ 0.1584 100.00% 9,12811-Oct-11 4,841,300 299,678 16.16 $ 0.1570 99.78% 8,99012-Oct-11 4,491,900 285,807 15.72 $ 0.1639 96.70% 9,24113-Oct-11 4,625,600 295,006 15.68 $ 0.1608 95.73% 9,26314-Oct-11 4,534,500 283,896 15.97 $ 0.1594 95.76% 9,09315-Oct-11 4,667,500 289,744 16.11 $ 0.1581 100.00% 9,01616-Oct-11 4,536,900 279,379 16.24 $ 0.1580 100.00% 8,94417-Oct-11 4,585,900 285,238 16.08 $ 0.1601 100.00% 9,03418-Oct-11 4,704,800 292,467 16.09 $ 0.1567 100.00% 9,02919-Oct-11 4,822,000 302,517 15.94 $ 0.1585 100.00% 9,11220-Oct-11 4,748,600 297,090 15.98 $ 0.1577 100.00% 9,08721-Oct-11 4,472,500 277,252 16.13 $ 0.1577 100.00% 9,00322-Oct-11 4,438,600 280,334 15.83 $ 0.1601 100.00% 9,17323-Oct-11 4,479,200 282,191 15.87 $ 0.1603 100.00% 9,15024-Oct-11 4,809,900 299,845 16.04 $ 0.1597 99.64% 9,05425-Oct-11 4,734,500 296,050 15.99 $ 0.1602 99.66% 9,082
TARGETS
Net Fuel Efficiency
15.1 kWh/gal
% Generation from Base Load
90% Min
Gross Heat Rate9600 btu/kWh

Major Decisions on Horizon (Impacts future use of Cabras and Tanguisson Units)
Alternate fuel source such as LNG Study initiated June 2011; Study completion by January 2012 Conversion estimated to take 5 years Cleaner fuel source therefore new plants easier to permit Higher efficiency machines; lower O&M cost
Alternate fuel source of small modular reactors (SMR) Package modules under development and commercially marketed
within 10 years Demand side management program to reduce consumer
consumption Integrated resource plan update in 2012 Evaluates role of the older Tanguisson and Cabras units Substantial work in progress to reduce consumer rates
36

Generation•Adequate Generation•Preventive Maintenance•Efficient Dispatching•Base Loads before Peaking Units
•Generator Tuning•Automatic Generation Control
Transmission•Preventive Maintenance
•Line Inspection•Tree Trimming•Splice Replacement•Hardware Corrosion
Substation•Preventive Maintenance
•Protective Relaying•N-1 Contingency
Distribution•Preventive Maintenance
•Line Inspection•Tree Trimming•Splice Replacement•Hardware Corrosion
37

38
0.00
5.00
10.00
15.00
20.00
25.00
1-Jan 1-Feb 1-Mar 1-Apr 1-May 1-Jun 1-Jul 1-Aug 1-Sep 1-Oct
ALL OUTAGE CAUSES
DISTRIBUTION CAUSES
DISTRIBUTION CAUSES SUSTAINED OUTAGES
GENERATION CAUSES
TRANSMISSION CAUSES

39
0.00
0.10
0.20
0.30
0.40
0.50
0.60
0.70
0.80
1-Jan 1-Feb 1-Mar 1-Apr 1-May 1-Jun 1-Jul 1-Aug 1-Sep 1-Oct
ALL OUTAGE CAUSES
DISTRIBUTION CAUSES
DISTRIBUTION CAUSES SUSTAINED OUTAGES
GENERATION CAUSES
TRANSMISSION CAUSES


Top 3 known outage causes Vegetation Snakes Lightning arrester (hardware failure)
Outage reduction plan included Engineering and T&D assessment July 2011
Dec 2012 – Target to address assessment findings Use in-house and contract resources
Major types of maintenance activities Vegetation (8,152 man hours) Splices / Hardware to include reconductoring (29,186
man hours) Pole change out (4,447 man hours)
ONE CREW DAY = 18 MAN HOURS
41

U.S. Department of Agriculture Animal & Plant Health Inspection Wildlife Services
$100,000 + annual contract Snake traps, toxicant devices, inspection
servicesOver 10,000 snakes captured
42

0
10
20
30
40
50
60P-
087
P-33
2P-
046
P-08
9P-
250
P-00
5P-
088
P-32
3P-
283
P-30
1P-
331
P-32
2P-
253
P-29
4P-
340
P-00
7P-
221
P-28
0P-
310
P-31
1P-
341
P-26
0P-
330
P-11
1P-
210
P-21
2P-
204
P-26
2P-
261
P-28
1P-
201
P-20
3P-
220
P-24
0P-
223
P-27
1P-
067
P-25
2P-
282
P-25
1P-
213
P-31
2P-
202
P-24
2P-
205
P-27
0P-
400
P-24
5P-
321
P-24
4
Crew
Day
s
43
Total Man Hours = 8,152ONE CREW DAY = 18MHrs
Trimming is effective for only 3-6 monthsActivity must continuously be repeatedHistorical yearly vegetation control cost
2010 = $517,0262011 = $531,429
GPA mitigation efforts• Working with Department of Agriculture for
trimming guidelines and best practices• Propose legislation limiting planting
underneath power lines

0
20
40
60
80
100
120
140
P-28
3P-
212
P-32
2P-
046
P-25
3P-
330
P-34
0P-
271
P-28
0P-
332
P-08
8P-
261
P-21
0P-
251
P-20
3P-
221
P-32
3P-
311
P-00
5P-
201
P-30
1P-
250
P-29
4P-
331
P-24
5P-
087
P-31
2P-
220
P-08
9P-
282
P-06
7P-
260
P-20
2P-
270
P-21
3P-
262
P-20
5P-
204
P-25
2P-
240
P-28
1P-
007
P-20
6P-
272
P-22
3P-
400
P-34
1P-
242
P-00
3P-
310
P-22
2P-
111
P-24
4P-
402
P-32
1
Crew
Day
s
44
TOTAL Man Hours = 29,186ONE CREW DAY = 18 MHrs

45
TOTAL Man Hours = 4,447ONE CREW DAY = 18MHrsTotal # of wood poles = 216
0
5
10
15
20
25
30
35
40
45
50
P- 332
P- 250
P- 260
P- 323
P- 201
P- 005
P- 262
P- 261
P- 294
P- 251
P- 283
P- 202
P- 312
P- 341
P- 203
P- 067
P- 244
P- 280
P- 205
P- 210
P- 212
P- 252
P- 242
P- 281
Crew
Day
s

Continuous Efforts on Outage Reduction T&D System Investments Generation tuning project underway
Conducting necessary plant upgrades Final tuning in first quarter CY 2012 Will reduce outages due to loss of generation Will reduce risk of blackouts
Automatic generation control Project awarded Completion in CY2012 Allows for the real time economic dispatching of units
T&D Outages Tree trimming efforts underway Defective line hardware Replacements Mitigation of snake related outages Investments being made with 2010 bonds
46

47