Embed Size (px)
Citation preview
© 2019 SCTE•ISBE and NCTA. All rights reserved.
Cable 10G Vs. Wireless 5G –
Foe Or Friend? A Survey Of Next Gen Network Directions
A Technical Paper prepared for SCTE•ISBE by
John Ulm Engineering Fellow
CommScope 978-609-6028
Zoran Maricevic Engineering Fellow
CommScope 203-303-6547
© 2019 SCTE•ISBE and NCTA. All rights reserved. 2
Table of Contents Title Page Number Table of Contents .................................................................................................................................... 2
Introduction ............................................................................................................................................. 4
Content ................................................................................................................................................... 5 1. Cable 10G – A journey, not a destination........................................................................................ 5
1.1. Cable 10G Overview.......................................................................................................... 5 1.2. Cable 10G Key Attributes .................................................................................................. 6 1.3. Network Capacity Planning for 10G ................................................................................... 7 1.4. Migrating HFC from DS only 10G to More symmetrical 10G ............................................... 8
1.4.1. Full-Duplex DOCSIS (FDX) ................................................................................ 8 1.4.1. Ultra-High Splits and Soft-FDX ........................................................................... 9
1.5. Cable 10G - Summary ....................................................................................................... 9 2. Gigabit Wireless Technologies – 5G, CBRS, WiFi-6 ..................................................................... 11
2.1. The Outside Inside Discussion ......................................................................................... 12 2.2. The Inside Outside strategy ............................................................................................. 14 2.3. 5G as a Fixed Wireless Access solution........................................................................... 20
2.3.1. FWA Economics .............................................................................................. 20 2.3.2. FWA Summary................................................................................................. 21
2.4. Guiding Wireless Trends for Tomorrow’s Smart Home ..................................................... 21 3. Using Outside HFC Plant for 5G – considerations and logistics .................................................... 23
3.1. Case Study – HFC Power for Wireless Cell sites ............................................................ 23 3.2. Mapping 5G Small Cells to Existing HFC Plant ................................................................ 26 3.3. HFC Adaptibility in a changing World ............................................................................... 33
Conclusion ............................................................................................................................................ 34 4. Cable 10G vs. Wireless 5G – Friend or Foe?................................................................................ 34
Bibliography & References .................................................................................................................... 35
Abbreviations......................................................................................................................................... 36
List of Figures
Title Page Number Figure 1 – Full Duplex DOCSIS (FDX) Spectrum Band Options ............................................................... 8 Figure 2 – Automated Driving, Mobility Services, and Augmented Reality .............................................. 11 Figure 3 – 28 GHz vs. 70 GHz Spectral Efficiency.................................................................................. 12 Figure 4 – 37 GHz System Performance & Spectral Efficiency ............................................................... 12 Figure 5 – Sub 6 GHz with Outside the home antenna ........................................................................... 13 Figure 6 – mmWave Success Requires Roof, Window, and Wall Installations ........................................ 13 Figure 7 – Schema of Inside/Out Propagation Studies for 3.5 GHz CBRS .............................................. 15 Figure 8 – Sub 6 GHz Connections to the Home .................................................................................... 15 Figure 9 – Networks to the Home Cell .................................................................................................... 16 Figure 10 – Home Cell Coverage ........................................................................................................... 16 Figure 11 – LTE Range versus Performance for Inside Out Coverage .................................................... 17 Figure 12 – 1W HaaT Coverage for 25/5 Service (1 x 10-16 Homes) ..................................................... 18

© 2019 SCTE•ISBE and NCTA. All rights reserved. 3
Figure 13 – 4W HaaT Coverage for 25/5 Service (1 x 20-40 Homes) ..................................................... 18 Figure 14 – Service Mounting Potential for Outdoor 4W CBRS Mesh ..................................................... 19 Figure 15 – In Home/Office 60 GHz Coverage ....................................................................................... 19 Figure 16 – Defining the Roaming (Home Exterior) Proposition for CBRS/LTE ....................................... 23 Figure 17 – A N+3 HFC plant example with Power Supplies, Voltages and current draw ........................ 24 Figure 18 – N+3 HFC plant upgraded to FTTLA, with Voltages and current draws .................................. 25 Figure 19 – Median Lot Size, new single-family detached homes started in 2015 ................................... 26 Figure 20 - New England suburb, illustration for variability of lot sizes within .......................................... 27 Figure 21 – Higher density (~190 HP/mile) HFC overlayed with ~200m/150m radius cells ...................... 29 Figure 22 – Higher density (~190 HP/mile) HFC overlayed with ~150m/100m cells ................................ 30 Figure 23 – Higher density (~190 HP/mile) HFC overlayed with 100m cells ............................................ 30 Figure 24 - Lower density (~60 HP/mile) HFC overlayed with ~200m/150m cells.................................... 31 Figure 25 – Lower density (~60 HP/mile) HFC overlayed with ~150m/100m cells ................................... 32 Figure 26 – Lower density (~60 HP/mile) HFC overlayed with 100m cells .............................................. 32
© 2019 SCTE•ISBE and NCTA. All rights reserved. 4
Introduction There has been much hype around 5G in the wireless world for several years now. At the start of this year, the cable industry announced its own 10G vision. Cable 10G and Wireless 5G initiatives offer disruptive, revolutionary technologies that at first glance seem to be at odds. But when combined, they offer an evolutionary strategy with much synergy.
The cable industry has undergone unprecedented technology changes over the last several years. The introduction of DOCSIS 3.1® started this and was quickly followed with development of Distributed Architectures such as Remote-PHY (R-PHY); Full-Duplex (FDX); Low Latency DOCSIS initiative; and now Extended Spectrum efforts. These developments are all building blocks that are a part of reaching 10G goals. The paper will review these goals and what it means for the operator to achieve these.
Gigabit Fixed Wireless technologies are emerging to rival wired services. 5G will be offered across different spectrums with each band having unique capacity/distance tradeoffs. Wi-Fi 6® and CBRS have also entered the fray. Doesn’t this position Wireless as foe to Cable 10G? The technologies actually need each other to make a better system. The future high bandwidth, high frequency wireless systems need small cells with many access points requiring a low latency wired backhaul; and APs positioned inside the home/MDU and outside in every neighborhood for optimum coverage. Cable is ideally suited to support this backhaul and powering infrastructure. Meanwhile, Cable 10G can provide multi-gigabit capacity to the home’s entry point but needs a robust high capacity wireless connection for that final 100 meters inside and around the home to every mobile device.
In the end, we describe how Cable 10G and Wireless 5G/CBRS are much stronger together and are at the core of a next gen network evolution.
© 2019 SCTE•ISBE and NCTA. All rights reserved. 5
Content 1. Cable 10G – A journey, not a destination On January 7, 2019 at the Consumer Electronics Show (CES), NCTA – The Internet & Television Association®, CableLabs®, and Cable Europe® introduced the cable industry’s vision for delivering 10 gigabit networks, or 10G™ – a powerful, capital-efficient technology platform that will ramp up from the 1 gigabit offerings of today to speeds of 10 gigabits per second (Gbps) and beyond – to consumers across the globe in the coming years.
10G is a goal, a lighthouse in the distance towards which all MSOs and vendors can steer their boats. It will take some time to get there. It is just a single point in a continuum of improvements that will occur in the future. And it is not the end-point, it is an interim point. We will likely push on beyond that 10G point in the future. The focus in this paper is on the migration needed over the next 7-10 years using existing technologies to achieve the 10G goals. [CLO_2019] takes a deeper look into the future with some potential new technologies to see where the industry might be in 15-25 years beyond 10G.
But in getting to 10G, what does it take for the DOCSIS/HFC System to deliver on the 10G Service Level Agreement (SLA) promise? Many MSOs do not really know what it takes to do 10 Gbps Downstream, let alone 10 Gbps Symmetrical. To reach 10G goals might require an aggregate of last-hop technologies to accomplish this; HFC, DOCSIS, PON and Wireless are all possible candidate technologies. [ULM_2019] provides a detailed discussion on 10G network capacity planning along with outside plant considerations and logistics. Some highlights from that paper are provided in this section.
1.1. Cable 10G Overview
A quick introduction to 10G can be found on the CableLabs website www.cablelabs.com/10g:
What is 10G?
The 10G platform is a combination of technologies that will deliver internet speeds 10 times faster than today’s networks and 100 times faster than what most consumers currently experience. Not only does 10G provide faster symmetrical speeds, but also lower latencies, enhanced reliability and better security in a scalable manner.
Why do we need the 10G platform?
Our digital future will stall without a platform that can meet our needs. While we don’t know what the next trend will be, we do know the internet will be central to it. By advancing device and network performance to stay ahead of consumer demand, 10G will provide a myriad of new immersive digital experiences and other emerging technologies that will revolutionize the way we live, work, learn and
© 2019 SCTE•ISBE and NCTA. All rights reserved. 6
play. Like the saffron in paella, or the milk in a latte, our industry’s networks and innovations are the crucial ingredients in creating a better future for humanity.
In the downstream (DS) direction, 10G will be helpful in providing delivery of immersive video services (virtual reality & augmented reality for Holodeck experiences). It will also be useful for providing more snappy service. For example, downloading:
• A two-hour HD movie in 3-4 seconds (vs. 5-7 min @ 100 Mbps) • A two-hour 4K UHD movie in 12-15 seconds (vs. 20-25 min @ 100 Mbps) • A large gaming program such as Call of Duty’s Black Ops® (~100 Giga-Bytes) in 90 seconds
o instead of a 2½ hours @ 100 Mbps.
In the upstream (US) direction, it could be used for providing more snappy service again, but it could also prove to be very useful in enabling low-latency transport. The extra bandwidth (BW) helps enable Predictive Grant Services (PGS) to accelerate US delivery. That lower latency can permit 5G backhaul and mid-haul, and if the latencies drop low enough, it could even permit 5G fronthaul.
1.2. Cable 10G Key Attributes
There are four key attributes to the 10G platform:
1. Speed 2. Latency 3. Security 4. Reliability
10G’s promise of faster speeds, more capacity, lower latency and greater security will enable and help fully realize a wide variety of new services and applications that will change the way millions of consumers, educators, businesses and innovators interact with the world. Much of the underlying technology has already been specified or is work in progress.
The speed attribute will leverage technologies such as:
• DOCSIS 3.1 • FDX, Extended Spectrum DOCSIS • PON • Coherent optics • Advanced Wi-Fi including Wi-Fi 6 (a.k.a. 802.11.ax)
Some applications driving the need for Lower Latency DOCSIS include: Gaming; VR/AR (avoiding nausea); CoMP; and autonomous navigation. Latency is a function of packet processing times, queuing times, transmission times, and propagation times. We can improve all areas. CableLab’s Low Latency DOCSIS (LLD) project includes ideas in all these areas. The existence of 10G bandwidth capacity also helps, because higher bandwidth capacity leads to less congestion and permits new techniques like Predictive Grant Service (PGS) to expedite BW Grants in the upstream (US). Work is also being done in low latency mobile X-haul and low latency Wi-Fi.
Security is an integral part of 10G. Work continues at CableLabs in Micronets, secure downloads, & MACsec. This will become part of the new DOCSIS 4.0 specification. Vendors are also working to make more secure systems with separate, isolated processors and memory in chips.

© 2019 SCTE•ISBE and NCTA. All rights reserved. 7
With respect to reliability, new DAA Node designs of the future will likely be adding in redundancy in processing and redundancy in NSI-Side links to Leaf Switches in CIN as Moore’s Law improvements in gate density help. Reliability is being addressed by proactive network maintenance (PNM) and dual channel Wi-Fi. This will improve observability and redundancy and allow A/I monitoring (PNM, more data analytics in DAA nodes, redundancy in ring of DAA).
And for all four 10G attributes (i.e. speed, latency, security, reliability), it is equally important that they scale… on all markets.
1.3. Network Capacity Planning for 10G
The “10G” in the announcement is for 10 Gigabits per sec (Gbps). But what exactly does that mean as there are different ways of measuring capacity? For example, Liberty Global’s Virgin Media division in the U.K. ran tests earlier this year over a 10G EPON network and demonstrated users getting 8.5 Gbps throughput. It turns out that this is extremely close to the theoretical maximum throughput for 10G PON technology. “10G” PON has a raw physical rate of 10 Gbps but there is ~15% overhead from the PHY and MAC layers. So, the customer nets 8.5 Gbps from a 10G PON.
Our analysis first looks at the traffic engineering needed for a common 10G network using both PON and cable systems. Then a closer look is taken at the spectrum planning for an HFC system.
So, what kind of service tiers will subscribers enjoy in this new high 10G bandwidth era? As previously discussed, the 10G PON provides a net downstream capacity of ~8.5 Gbps to the consumer. This capacity might reasonably support a downstream SLA of 8 Gbps. The service group (SG) utilization (i.e. Nsub * Tavg) for a 64 subscriber PON might grow to a bit over 1 Gbps in the 7-8 year window. That means a consumer with a 8 Gbps SLA will have a QoE coefficient of K=0.9 to 1.0 which is reasonable for this relatively small SG size.
Getting to a true 10 Gbps downstream SLA that is equivalent to 10G Ethernet will mean providing slightly greater than 10 Gbps network capacity. This will push the PON networks into next generation PON technology (e.g. 20+ Gbps). Because HFC can incrementally add capacity with additional spectrum, there are certain downstream scenarios that will be discussed where existing 1218 MHz HFC might be able to hit this target. In general, future technologies, such as 1.8 and 3.0 GHz HFC plants, are out of scope for this paper and are discussed further in [CLO_2019].
Choosing the upstream SLA is a more complicated matter. As can be seen with the DS:US consumption ratio, there might be a 20:1 difference between the two. However, in the new 10G era, there may be a need for gigabit US SLA tiers with high burst rates, even if the US consumption might be much lower than downstream.
Looking at PON systems, they offer both symmetric and asymmetric data rates. GPON provides 2.5 Gbps downstream data rates with 1.2 Gbps upstream data rates for a 2:1 ratio. The IEEE 10G EPON downstream might be paired with either a 1G or 10G upstream for 10:1 or 1:1 ratios. In the ITU world, XG-PON pairs 10 Gbps downstream with 2.5 Gbps upstream (i.e. 4:1 ratio) while XGS-PON provides a symmetric 10 Gbps in both directions for 1:1 ratio.
HFC systems have traditionally been extremely asymmetric, but these trends are changing. In the following sections, a range of upstream SLAs are considered to pair with the 8 Gbps DS SLA with a discussion on the technology trade-offs needed for each.
© 2019 SCTE•ISBE and NCTA. All rights reserved. 8
1.4. Migrating HFC from DS only 10G to More symmetrical 10G
HFC systems have traditionally been extremely asymmetric with only 42 to 65 MHz of upstream spectrum compared to downstream spectrum on the order of 700 to 1000 MHz. But these trends are changing. [ULM_2019] and [ALB_2019] look at technologies that cable operators can use to reach the 10G goals.
An 85 MHz upstream split provides the minimum upstream capacity needed to pair with a 10G downstream. This might support DS:US ratios in the 15:1 to 20:1 range. DOCSIS 3.1 also introduced a 204 MHz upstream split option that enables 1 to 1.5 Gbps upstream SLAs, but it is still around a 5:1 ratio. Getting beyond a 1 to 1.5 Gbps US tier will require additional technologies besides the 204 MHz upstream split.
1.4.1. Full-Duplex DOCSIS (FDX)
Some recent work at CableLabs has focused on a new technology called Full Duplex DOCSIS (FDX). FDX leverages echo canceller technology to allow simultaneous upstream and downstream operation in the FDX band. FDX is targeted at a fiber deep Node+0 DAA environment. FDX is now becoming part of the new DOCSIS 4.0 specification [FDX_PHY].
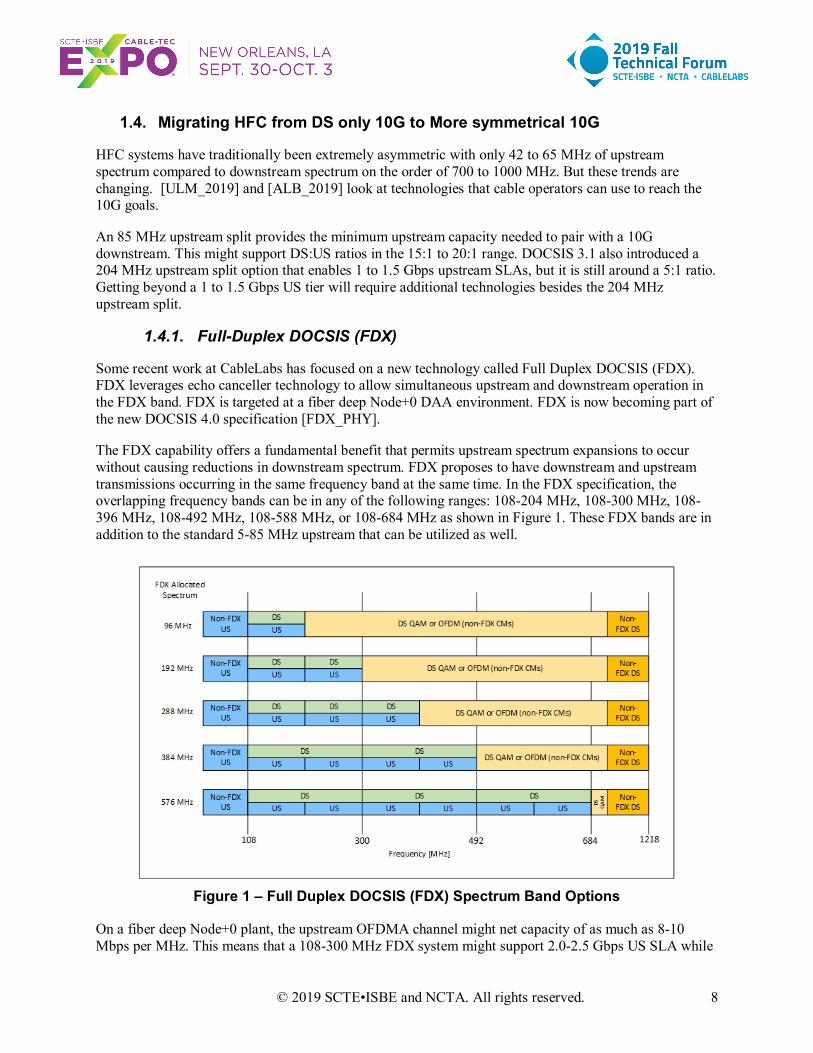
The FDX capability offers a fundamental benefit that permits upstream spectrum expansions to occur without causing reductions in downstream spectrum. FDX proposes to have downstream and upstream transmissions occurring in the same frequency band at the same time. In the FDX specification, the overlapping frequency bands can be in any of the following ranges: 108-204 MHz, 108-300 MHz, 108-396 MHz, 108-492 MHz, 108-588 MHz, or 108-684 MHz as shown in Figure 1. These FDX bands are in addition to the standard 5-85 MHz upstream that can be utilized as well.
Figure 1 – Full Duplex DOCSIS (FDX) Spectrum Band Options
On a fiber deep Node+0 plant, the upstream OFDMA channel might net capacity of as much as 8-10 Mbps per MHz. This means that a 108-300 MHz FDX system might support 2.0-2.5 Gbps US SLA while
© 2019 SCTE•ISBE and NCTA. All rights reserved. 9
the full spectrum 108-684 MHz FDX system might support 5-6 Gbps US SLA. Using the full FDX band would enable the operator to offer such DS/US service tiers as 8 Gbps x 4 Gbps, 7.5 Gbps x 2.5 Gbps or a fully symmetric 5 Gbps x 5 Gbps SLA.
With the Node+0 architecture, the 108-1218 MHz of downstream spectrum might net over 10 Gbps of downstream capacity which means the 1218 MHz FDX system could be pushed to a true 10 Gbps DS SLA with 5 Gbps US SLA. The downstream is now on par with 10G Ethernet while supporting a 2:1 DS:US ratio.
Current FDX work is moving along well. Initial field trials were completed in 2018 and continued in 2019 with very promising results. Real-world deployments are targeted to take place in 2020.
1.4.1. Ultra-High Splits and Soft-FDX
A number of operators are reluctant to jump to N+0 but are still interested in achieving more symmetrical upstream service tiers. Some folks are investigating a simpler approach than FDX by just pushing the upstream split even higher. 300 and 396 MHz upstream splits have been discussed as they add one or two additional 96 MHz OFDMA channels to the upstream capacity. However, this approach eats into the downstream spectrum, so is often considered with extending the downstream higher (e.g. 1.8 or 3.0 GHz).
While FDX should work fine in Node+0 environments, its ability to perform in Node+X environments is still under study. The issues with traditional FDX in this environment and possible alternatives are explored in [ALB_2019]. Because of the FDX challenges in N+X HFC plant, other technologies are under consideration for those scenarios.
A problem called Interference Group Elongation has been identified in [ALB_2019] that causes serious issues with this “FDX in Node+X” proposal. In the end, it causes large Interference Groups to be created that span most of the length of each RF Leg on a Node. This forces that RF leg to operate in more of a Time Division Duplex (TDD) manner. This has led to some new proposals called Soft FDX.
Soft FDX is a special mode where the network is operated with non-overlapping US & DS spectra (just like today!). The ‘soft’ adjective refers to the ability to change the location of the US/DS split easily (potentially via software). Soft FDX helps in supporting high US speeds, which are occasionally demanded by users, without permanently locking the spectrum to the US which can severely affect the valuable DS spectrum that is used to offer many services including video and high DS speeds which are demanded more frequently than the US.
Soft FDX can be either static or dynamic. Static soft FDX refers to the case where the US/DS split location does not change frequently (e.g., on the order of months or years). On the other hand, Dynamic soft FDX refers to the case where the US/DS split location changes in real time based on traffic demand (e.g. on the order of milliseconds or seconds). For instance, in the dynamic soft FDX case, when there is a need for more US spectrum to upload a large file to the cloud or run an US speed test as examples, the split changes to accommodate that and when the need for the added US spectrum goes way, the split changes back to reclaim the valuable DS spectrum. Both static and dynamic soft FDX can be implemented using special assignment of the FDX RBA messages.
1.5. Cable 10G - Summary
As can be seen by these options, an operator can choose how symmetric they want their system to be. This will be driven by competitive market forces as well as new yet unknown upstream applications that may appear in the future.
© 2019 SCTE•ISBE and NCTA. All rights reserved. 10
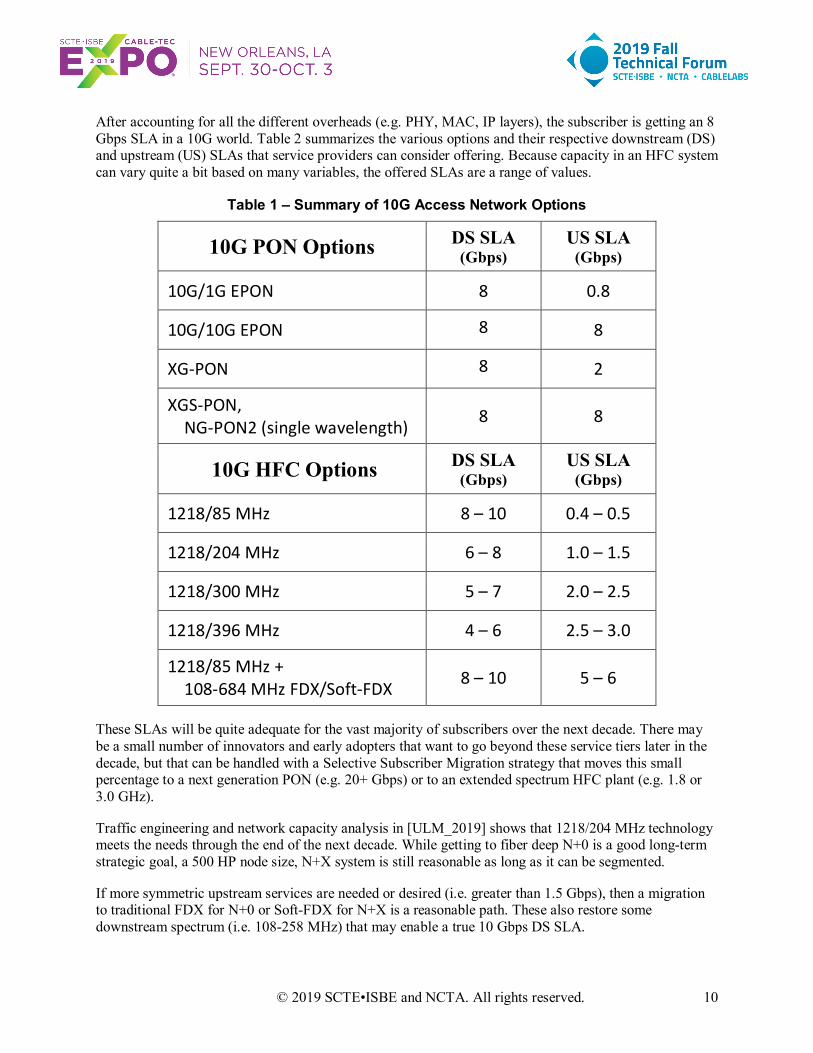
After accounting for all the different overheads (e.g. PHY, MAC, IP layers), the subscriber is getting an 8 Gbps SLA in a 10G world. Table 2 summarizes the various options and their respective downstream (DS) and upstream (US) SLAs that service providers can consider offering. Because capacity in an HFC system can vary quite a bit based on many variables, the offered SLAs are a range of values.
Table 1 – Summary of 10G Access Network Options
10G PON Options DS SLA (Gbps)
US SLA (Gbps)
10G/1G EPON 8 0.8
10G/10G EPON 8 8
XG-PON 8 2
XGS-PON, NG-PON2 (single wavelength) 8 8
10G HFC Options DS SLA (Gbps)
US SLA (Gbps)
1218/85 MHz 8 – 10 0.4 – 0.5
1218/204 MHz 6 – 8 1.0 – 1.5
1218/300 MHz 5 – 7 2.0 – 2.5
1218/396 MHz 4 – 6 2.5 – 3.0
1218/85 MHz + 108-684 MHz FDX/Soft-FDX 8 – 10 5 – 6
These SLAs will be quite adequate for the vast majority of subscribers over the next decade. There may be a small number of innovators and early adopters that want to go beyond these service tiers later in the decade, but that can be handled with a Selective Subscriber Migration strategy that moves this small percentage to a next generation PON (e.g. 20+ Gbps) or to an extended spectrum HFC plant (e.g. 1.8 or 3.0 GHz).
Traffic engineering and network capacity analysis in [ULM_2019] shows that 1218/204 MHz technology meets the needs through the end of the next decade. While getting to fiber deep N+0 is a good long-term strategic goal, a 500 HP node size, N+X system is still reasonable as long as it can be segmented.
If more symmetric upstream services are needed or desired (i.e. greater than 1.5 Gbps), then a migration to traditional FDX for N+0 or Soft-FDX for N+X is a reasonable path. These also restore some downstream spectrum (i.e. 108-258 MHz) that may enable a true 10 Gbps DS SLA.
© 2019 SCTE•ISBE and NCTA. All rights reserved. 11
The investigations into 1 GHz tap technology show that operators can achieve the 10G goals with the existing installed base of taps. This will buy the operator more time before they need to pull the trigger and replace them. Hopefully the 1.8/3.0 GHz future taps will be cost effective by that time.
Finally, fiber deep and Distributed Access Architectures (DAA) become more important technologies at helping operators to achieve the 10G goals.
2. Gigabit Wireless Technologies – 5G, CBRS, WiFi-6 Gigabit Fixed Wireless technologies are emerging to rival wired services. 5G will be offered across different spectrums with each band having unique capacity/distance tradeoffs. WiFi-6 and CBRS have also entered the fray.
5G Wireless Networks are being built to serve new applications. These applications must fund the development of the solutions and the infrastructure. Below are four revenue or new business opportunities that will be key to the deployment of 5G Wireless.
1. Fixed Wireless Access (FWA) – The connection of wireless broadband to homes or other fixed location services. The trend for bringing Gbps speeds to consumers and enterprise is driving to smaller and smaller cell sites.
2. Massive outdoor and indoor Internet of Things (IoT) connectivity – Where everything gets connected. Narrowband IoT (NB-IOT) and existing Category M1 (CAT M1) LTE (Long Term Evolution) services will fill this growing area initially and leveraging technologies such as Long Range (LoRA) using unlicensed spectrum below 1 GHz and LTE-M.
3. High bandwidth and capacity mobile wireless – As silicon technology evolves, there will be increased burst and sustained speed applications to mobile devices.
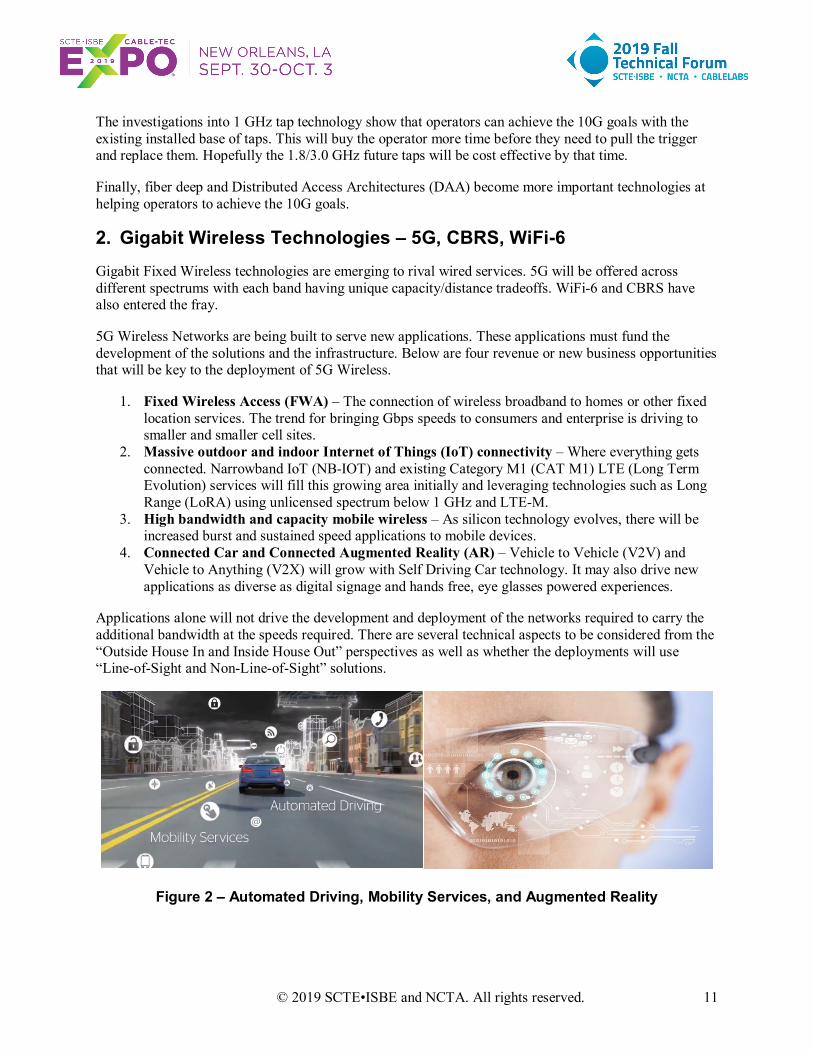
4. Connected Car and Connected Augmented Reality (AR) – Vehicle to Vehicle (V2V) and Vehicle to Anything (V2X) will grow with Self Driving Car technology. It may also drive new applications as diverse as digital signage and hands free, eye glasses powered experiences.
Applications alone will not drive the development and deployment of the networks required to carry the additional bandwidth at the speeds required. There are several technical aspects to be considered from the “Outside House In and Inside House Out” perspectives as well as whether the deployments will use “Line-of-Sight and Non-Line-of-Sight” solutions.
Figure 2 – Automated Driving, Mobility Services, and Augmented Reality
© 2019 SCTE•ISBE and NCTA. All rights reserved. 12
2.1. The Outside Inside Discussion
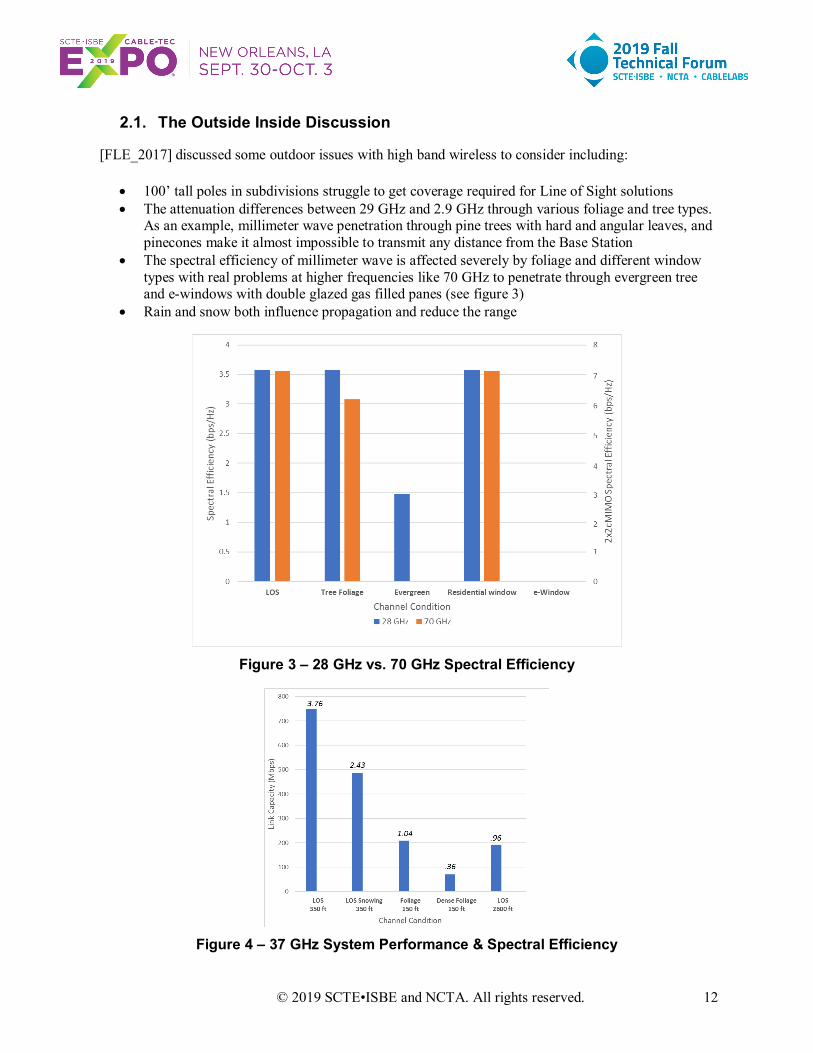
[FLE_2017] discussed some outdoor issues with high band wireless to consider including:
• 100’ tall poles in subdivisions struggle to get coverage required for Line of Sight solutions • The attenuation differences between 29 GHz and 2.9 GHz through various foliage and tree types.
As an example, millimeter wave penetration through pine trees with hard and angular leaves, and pinecones make it almost impossible to transmit any distance from the Base Station
• The spectral efficiency of millimeter wave is affected severely by foliage and different window types with real problems at higher frequencies like 70 GHz to penetrate through evergreen tree and e-windows with double glazed gas filled panes (see figure 3)
• Rain and snow both influence propagation and reduce the range
Figure 3 – 28 GHz vs. 70 GHz Spectral Efficiency
Figure 4 – 37 GHz System Performance & Spectral Efficiency
© 2019 SCTE•ISBE and NCTA. All rights reserved. 13
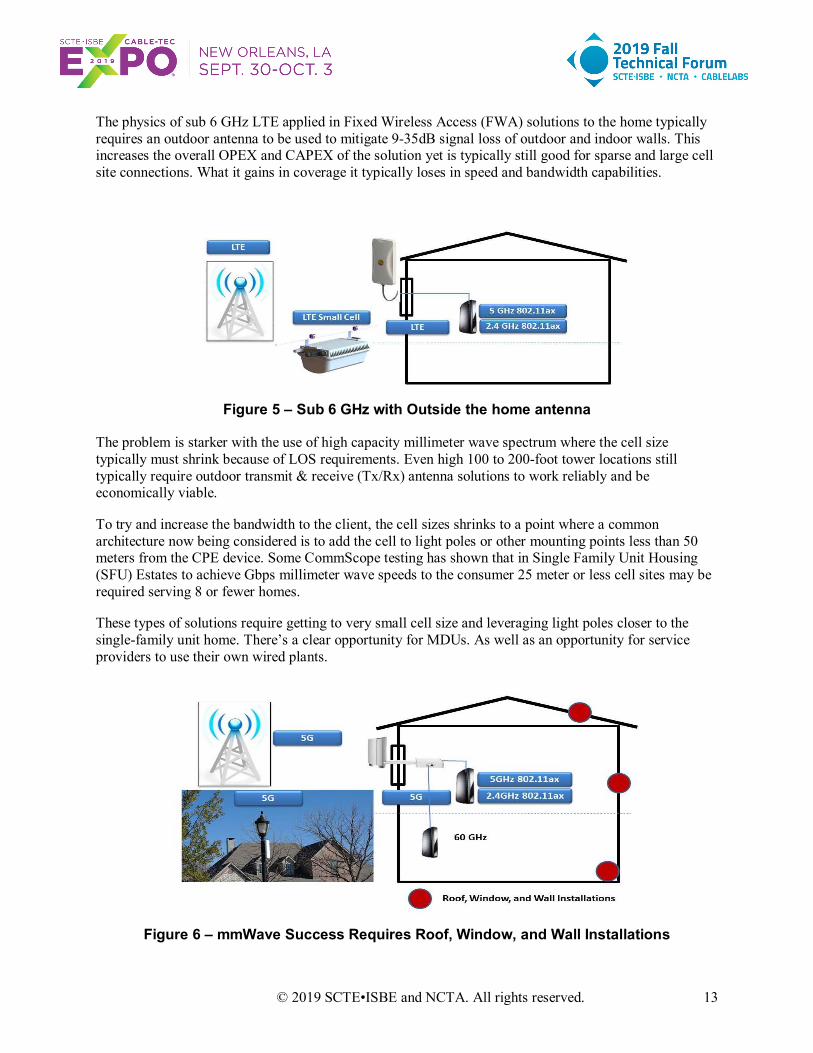
The physics of sub 6 GHz LTE applied in Fixed Wireless Access (FWA) solutions to the home typically requires an outdoor antenna to be used to mitigate 9-35dB signal loss of outdoor and indoor walls. This increases the overall OPEX and CAPEX of the solution yet is typically still good for sparse and large cell site connections. What it gains in coverage it typically loses in speed and bandwidth capabilities.
Figure 5 – Sub 6 GHz with Outside the home antenna
The problem is starker with the use of high capacity millimeter wave spectrum where the cell size typically must shrink because of LOS requirements. Even high 100 to 200-foot tower locations still typically require outdoor transmit & receive (Tx/Rx) antenna solutions to work reliably and be economically viable.
To try and increase the bandwidth to the client, the cell sizes shrinks to a point where a common architecture now being considered is to add the cell to light poles or other mounting points less than 50 meters from the CPE device. Some CommScope testing has shown that in Single Family Unit Housing (SFU) Estates to achieve Gbps millimeter wave speeds to the consumer 25 meter or less cell sites may be required serving 8 or fewer homes.
These types of solutions require getting to very small cell size and leveraging light poles closer to the single-family unit home. There’s a clear opportunity for MDUs. As well as an opportunity for service providers to use their own wired plants.
Figure 6 – mmWave Success Requires Roof, Window, and Wall Installations
© 2019 SCTE•ISBE and NCTA. All rights reserved. 14
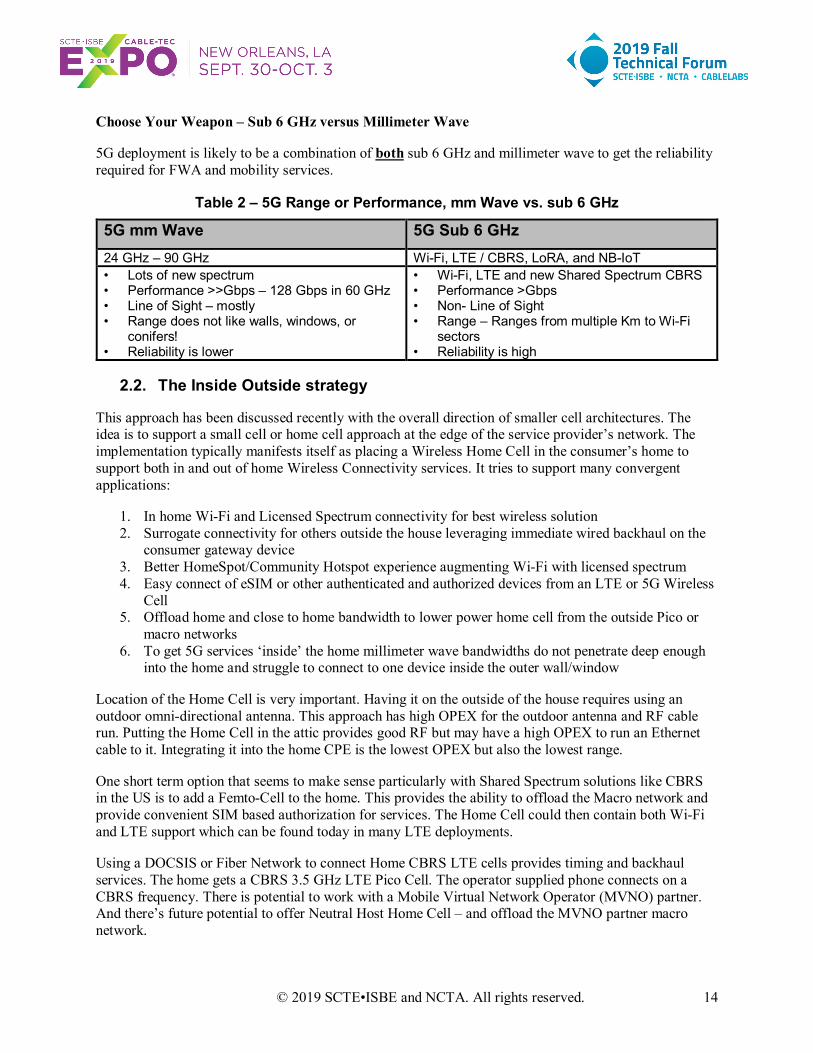
Choose Your Weapon – Sub 6 GHz versus Millimeter Wave
5G deployment is likely to be a combination of both sub 6 GHz and millimeter wave to get the reliability required for FWA and mobility services.
Table 2 – 5G Range or Performance, mm Wave vs. sub 6 GHz
5G mm Wave 5G Sub 6 GHz 24 GHz – 90 GHz Wi-Fi, LTE / CBRS, LoRA, and NB-IoT • Lots of new spectrum • Performance >>Gbps – 128 Gbps in 60 GHz • Line of Sight – mostly • Range does not like walls, windows, or
conifers! • Reliability is lower
• Wi-Fi, LTE and new Shared Spectrum CBRS • Performance >Gbps • Non- Line of Sight • Range – Ranges from multiple Km to Wi-Fi
sectors • Reliability is high
2.2. The Inside Outside strategy
This approach has been discussed recently with the overall direction of smaller cell architectures. The idea is to support a small cell or home cell approach at the edge of the service provider’s network. The implementation typically manifests itself as placing a Wireless Home Cell in the consumer’s home to support both in and out of home Wireless Connectivity services. It tries to support many convergent applications:
1. In home Wi-Fi and Licensed Spectrum connectivity for best wireless solution 2. Surrogate connectivity for others outside the house leveraging immediate wired backhaul on the
consumer gateway device 3. Better HomeSpot/Community Hotspot experience augmenting Wi-Fi with licensed spectrum 4. Easy connect of eSIM or other authenticated and authorized devices from an LTE or 5G Wireless
Cell 5. Offload home and close to home bandwidth to lower power home cell from the outside Pico or
macro networks 6. To get 5G services ‘inside’ the home millimeter wave bandwidths do not penetrate deep enough
into the home and struggle to connect to one device inside the outer wall/window
Location of the Home Cell is very important. Having it on the outside of the house requires using an outdoor omni-directional antenna. This approach has high OPEX for the outdoor antenna and RF cable run. Putting the Home Cell in the attic provides good RF but may have a high OPEX to run an Ethernet cable to it. Integrating it into the home CPE is the lowest OPEX but also the lowest range.
One short term option that seems to make sense particularly with Shared Spectrum solutions like CBRS in the US is to add a Femto-Cell to the home. This provides the ability to offload the Macro network and provide convenient SIM based authorization for services. The Home Cell could then contain both Wi-Fi and LTE support which can be found today in many LTE deployments.
Using a DOCSIS or Fiber Network to connect Home CBRS LTE cells provides timing and backhaul services. The home gets a CBRS 3.5 GHz LTE Pico Cell. The operator supplied phone connects on a CBRS frequency. There is potential to work with a Mobile Virtual Network Operator (MVNO) partner. And there’s future potential to offer Neutral Host Home Cell – and offload the MVNO partner macro network.

© 2019 SCTE•ISBE and NCTA. All rights reserved. 15
Figure 7 – Schema of Inside/Out Propagation Studies for 3.5 GHz CBRS
Figure 8 – Sub 6 GHz Connections to the Home
The Inside Outside Discussion – Home Cell
[FLE_2017] shows there is a choice of power for LTE radios. Two possible examples to consider:
• 125mW EIRP which can cover the home and ~10m outside the home – affording connection to handsets on the street or better performance at range for the consumers LTE enabled devices
• 1W EIRP which can cover the home and 3+ neighboring homes as well as good street coverage
Decisions on what power device to use are determined by the cost, ergonomics of size and complexity of managing the overlapping cells.
Another common technology being explored for Inside Out Networks with limited BW SLAs is LoRA®. It runs in the 900 MHz frequency and affords a low-cost Macro Narrowband IoT solution from the 100

© 2019 SCTE•ISBE and NCTA. All rights reserved. 16
feet + Monopole – and is also capable of being used from the home. A low cost LoRA addition to the home can create a network of connections from 500 meters to 1 kilometer from the home depending on placement of the LoRA device in the home (see figure 9).
Here are some questions to consider regarding Figure 9:
• Can a 5G cell operate inside the home? • Which Sub 6 GHz opportunities like CBRS 3.5 GHz Cell and LoRA can provide outdoor
coverage? • Millimeter Wave potential, but at what cost/range? • Can 60 GHz networks in the home develop >>1 Gbps intra room wireless solutions by leveraging
802.11ay® technology.
Figure 9 – Networks to the Home Cell
Figure 10 – Home Cell Coverage
© 2019 SCTE•ISBE and NCTA. All rights reserved. 17
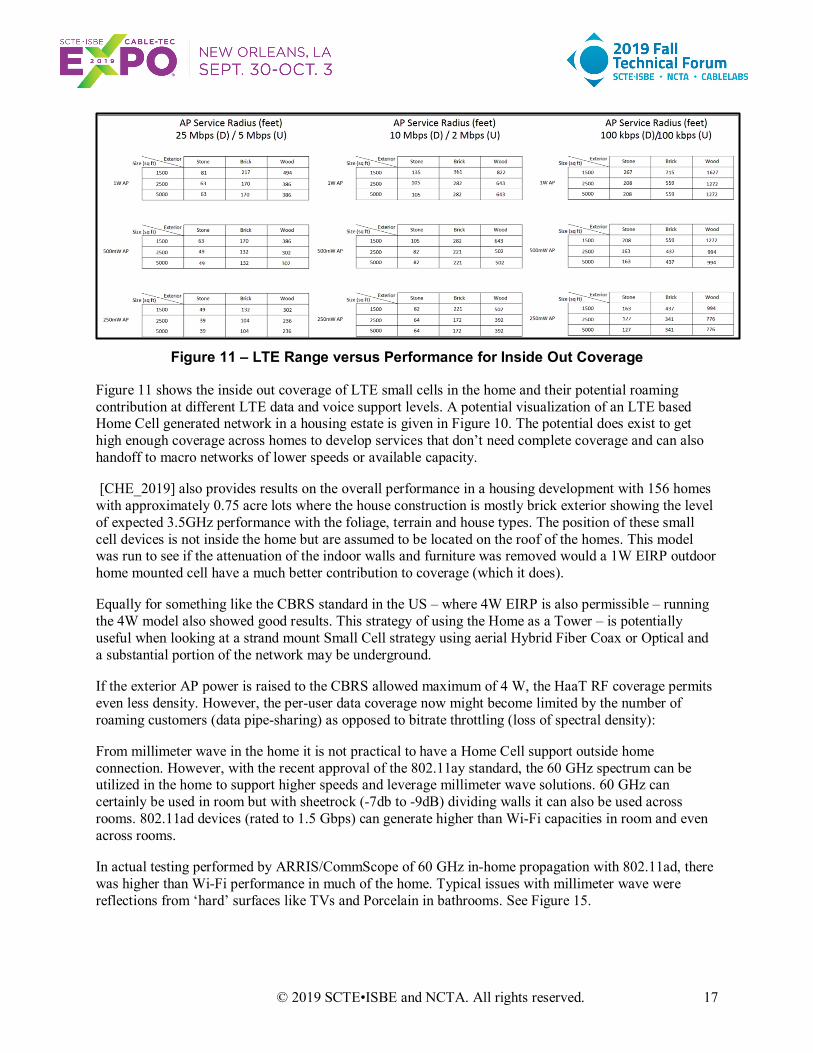
Figure 11 – LTE Range versus Performance for Inside Out Coverage
Figure 11 shows the inside out coverage of LTE small cells in the home and their potential roaming contribution at different LTE data and voice support levels. A potential visualization of an LTE based Home Cell generated network in a housing estate is given in Figure 10. The potential does exist to get high enough coverage across homes to develop services that don’t need complete coverage and can also handoff to macro networks of lower speeds or available capacity.
[CHE_2019] also provides results on the overall performance in a housing development with 156 homes with approximately 0.75 acre lots where the house construction is mostly brick exterior showing the level of expected 3.5GHz performance with the foliage, terrain and house types. The position of these small cell devices is not inside the home but are assumed to be located on the roof of the homes. This model was run to see if the attenuation of the indoor walls and furniture was removed would a 1W EIRP outdoor home mounted cell have a much better contribution to coverage (which it does).
Equally for something like the CBRS standard in the US – where 4W EIRP is also permissible – running the 4W model also showed good results. This strategy of using the Home as a Tower – is potentially useful when looking at a strand mount Small Cell strategy using aerial Hybrid Fiber Coax or Optical and a substantial portion of the network may be underground.
If the exterior AP power is raised to the CBRS allowed maximum of 4 W, the HaaT RF coverage permits even less density. However, the per-user data coverage now might become limited by the number of roaming customers (data pipe-sharing) as opposed to bitrate throttling (loss of spectral density):
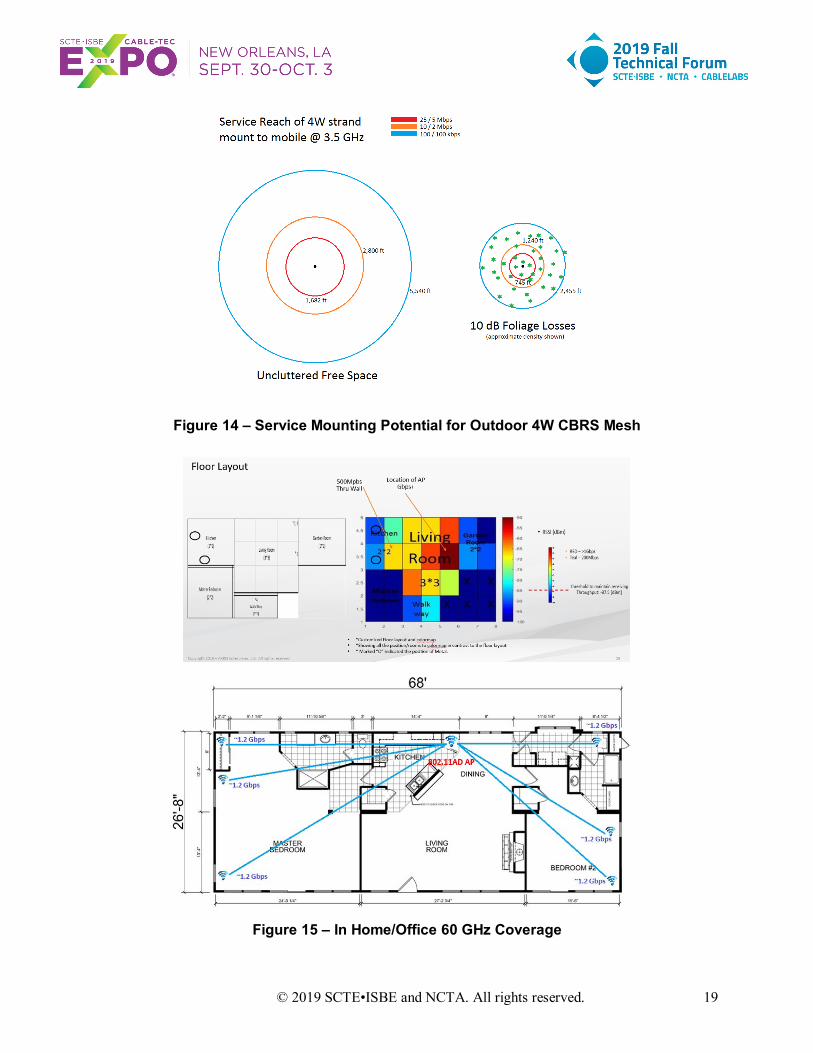
From millimeter wave in the home it is not practical to have a Home Cell support outside home connection. However, with the recent approval of the 802.11ay standard, the 60 GHz spectrum can be utilized in the home to support higher speeds and leverage millimeter wave solutions. 60 GHz can certainly be used in room but with sheetrock (-7db to -9dB) dividing walls it can also be used across rooms. 802.11ad devices (rated to 1.5 Gbps) can generate higher than Wi-Fi capacities in room and even across rooms.
In actual testing performed by ARRIS/CommScope of 60 GHz in-home propagation with 802.11ad, there was higher than Wi-Fi performance in much of the home. Typical issues with millimeter wave were reflections from ‘hard’ surfaces like TVs and Porcelain in bathrooms. See Figure 15.

© 2019 SCTE•ISBE and NCTA. All rights reserved. 18
Figure 12 – 1W HaaT Coverage for 25/5 Service (1 x 10-16 Homes)
Figure 13 – 4W HaaT Coverage for 25/5 Service (1 x 20-40 Homes)
© 2019 SCTE•ISBE and NCTA. All rights reserved. 19
Figure 14 – Service Mounting Potential for Outdoor 4W CBRS Mesh
Figure 15 – In Home/Office 60 GHz Coverage
© 2019 SCTE•ISBE and NCTA. All rights reserved. 20
2.3. 5G as a Fixed Wireless Access solution
For wireless communications, this is an unprecedented time. More licensed and unlicensed radio spectrum between UHF whitespace and millimeter wave mega-block partitions is being made available for commercial interests to invest in and grow business services than at any single prior point in history. The use of millimeter wave spectrum has sparked many debates about its architecture and economics — given the physics restrictions of primarily requiring “Line of Sight” to deliver the promise of multi Gigabits of wireless delivery. It is this non-determinism of signal propagation that has generated lots of research, innovation, and testing of solutions to create and define a deployable architecture that will support both Fixed Wireless Access and mobility uses.
Can a Fixed Wireless Access solution be developed to compete with or augment the wired broadband solutions today? [FLE_20017] looked at using 5G as a Fixed Wireless Access (FWA) solution. It considered the available spectrum options for delivery of a reliable, high-bitrate wireless connection over the last few hundred meters of front-haul as an alternative to wired connections. These are the cases where a newcomer wants to overlay incumbent, existing greenfield opportunities, or CAPEX considerations render the latter alternative unsound. It must leverage of the best attributes of near-line-of-sight (nLOS), non-line-of-sight (NLOS), and line-of-sight (LOS) signaling.
2.3.1. FWA Economics
The economics of Fixed Wireless access lie somewhere in the following parameters:
• Cost of the spectrum used: There are licensed and unlicensed bands to consider. • The size of the cell for bandwidth distribution
o With the migration towards high bandwidth low latency wireless broadband services — the size of the traditional cell size is likely to reduce substantially.
o This is a function of propagation and distance of technologies like millimeter wave as well as a requirement to provision speeds of Gbps burst levels
• The backhaul distribution and connectivity o As the cell size gets smaller it still should deliver multiple Gbps to enough customers to
make it economically viable. This makes the backhaul to the cell important for speed and scaling to meet the front haul costs to consumers.
o The ideal solution is that a fiber connect to every Gbps capacity Small Cell for 5G — likely at least 10 Gbps.
o DOCSIS and Line of Sight wireless are other backhaul options. • The cost of the CPE equipment
o This is one of the main barriers and inertia contributors to using Fixed Wireless Access. It includes costs of outdoor transceivers and external antenna with ergonomic impacts too.
While CBRS 3.5 GHz sub 6 GHz solution is not a solution typically targeted at 5G, there is the likelihood of 5G being a dual PHY or dual standard technology. Millimeter wave is not deterministic in its performance due to the environmental and NLOS issues — and the economics of deploying to the worst condition don’t work, therefore there may be likely solutions that provide Small Cells with both Millimeter wave and sub 6 GHz as well as CPE that support both PHYs. A dual PHY solution will make the solution more expensive, larger in size and higher in power consumption.
Significant roaming coverage gaps for premium data services begin to occur once exterior materials approach the density of brick and become unusable for cases where home placement become spaced by large lots – unless the coverage is augmented by exterior high-power APs.
© 2019 SCTE•ISBE and NCTA. All rights reserved. 21
This leads to a solution where the separation of interior-home and neighborhood roaming coverage by employment of a scaled picocell internal AP in each home (to accept handoff of the mobile from its outside roaming) and a network of outside mast or second-floor mount APs of either 1 or 4 W power (using the acronym “Home as a Tower” or HaaT) every N houses to provide the “outside home” (neighborhood roaming) data coverage.
2.3.2. FWA Summary
The implications of providing a future-proofed wireless bitrate capability to all subscribers beyond the reach of wireline in a cable system requires the analysis of wireless delivery options which include LOS, nLOS and NLOS systems — each of which comprises a mixed bag of capability and compromise. The broader bandwidth of millimeter LOS delivery, with its promise of massive MIMO antenna structures on both base station and client endpoints, unfortunately burdens itself with compromises involving client-side signal recovery costs, short signal throw, aesthetic challenges and perhaps non-deterministic link quality.
nLOS and NLOS sub-6 GHz systems can be made to overcome these challenges. However, the available bandwidth puts considerable pressure on massive MIMO and signal processing upgrades on the base station side to create the scalar benefits which effectively multiply spectral efficiency to levels necessary to anticipate user bitrate consumption a mere 4-5 years in the future. The relentless bitrate consumption growth defined in Cloonan’s Curve suggests that, ultimately, the facility of sub-6 GHz NLOS will be associated with a redundancy role for more LOS-based delivery — or perhaps in an ad hoc augmentation role for temporal housing arrangements.
For MNOs, those that don’t own wired broadband networks, the use of FWA is an opportunity to cherry pick areas for a Fixed Wireless overbuild. Some Wireless ISPs already offer millimeter wave broadband delivery services targeting dense areas with only one incumbent, areas where consumers are deprived of choice of broadband provider. The investment scale which nourishes those shared wireless technical advances applicable to both unlicensed and dynamically licensed space for MSOs (cable, telco, and MNO alike) means that applications of FWA will emerge as we move to mobility on 5G systems.
The economics and the size of the optimum cell is still under debate. What is clear is that the easier direction for FWA is dense MDU environments targeting a single wireless connection to the outside and using other solutions internally, like Ethernet, MoCA and Wi-Fi. The Residential 5G deployments will only emerge driven by the rise of mobile 5G devices which will happen in 2021 at scale and will then see the 5G small cells deploy in ever decreasing cell sizes.
2.4. Guiding Wireless Trends for Tomorrow’s Smart Home
What changes will dominate the home wireless services market in the next five years? Several fundamental trends are emerging that will guide device and solution requirements for next-generation homes. Some driving forces behind these shifts include:
• Higher WAN speeds with Gbps burst modes that will be reflected in home Wi-Fi connections. • Convergence of outdoor 5G wireless services with the indoor overlap of Wi-Fi connections. • Wireless extenders ensuring 500+ Mbps potential coverage to all points of the household:
o Introducing tri-band devices, which use tri-band concurrent (TBC) 2.4 GHz 4×4 and 5 GHz 4×4 in homes that require more premium Wi-Fi services and even higher throughput speeds, ensuring Gbps speeds to all end clients.
© 2019 SCTE•ISBE and NCTA. All rights reserved. 22
• By 2021, the emergence of 6 GHz Wi-Fi applications in the UNII-5 to UNII-8 bands to support high-capacity projects that can be driven by service providers. They include:
o Employing 6 GHz channels in Wi-Fi backhaul applications o 6 GHz STB solutions that enable reliable 8K video applications o Utilizing 6 GHz Wi-Fi in 5G femtocells for reliable connectivity to the primary gateway. o Superior Wi-Fi performance, typically 2×2 in Wi-Fi 6 and up to 4×4 in Wi-Fi 5.
Service providers can complete the new wireless and smart home by considering other trends like LTE™, CBRS, LoRA Alliance™, and 5G. There are several ways to leverage a home — particularly one at the end of a cable or fiber network — and add these technologies to the backhaul of the wired system. Providers can add femtocells connected to the primary fixed wire gateway or access point to provide in-neighborhood or in-home services. They can also offload LTE and 5G handset usage for the home to Wi-Fi, but the licensed spectrum is better for larger homes.
Current 5G applications are focused more on FWA and outside mobility. However, there have been discussions about trying to extend the range of 5G NR signals or applying 5G femtocells in the home. While sub-6 GHz 5G has the scope to be effective for residential use, millimeter wave 5G will suffer high attenuation and propagation loss that may make 6 GHz Wi-Fi the better home high-speed connection.
One view is that the 60 GHz WiGig (802.11ay) standard offers an unlicensed solution to millimeter wave usage in the home that could drive its use for 5G services in a more universal and standardized fashion than licensed frequency band femtocells.
In the next three-to-five years, wireless smart homes will drive new high-speed services by leveraging Wi-Fi 6, 6 GHz and 5G NR and the standards work being done across IEEE®, 3GPP®, Wi-Fi Alliance®, and others.
As cable operators move Fiber Deeper going to an all passive coax network, the ability to deliver multiple Gbps of capacity to a single home seems an easier path than building out an FWA millimeter wave architecture. However, given that 5G POP/Small Cells require wired backhaul, the potential for the MSO to leverage its network for mobile 5G seems to be a more complimentary investment. In discussions with MSOs, who are also MNOs, they struggle now to see an FWA solution to deep residential deployments. They see some potential to use their network to potentially lead to target MDUs served predominantly by their competitors, and often see value in pulling fiber. However, they do see the value of adding 5G and CBRS POPS to their HFC and growing fiber networks for outside mobility applications.
It will be the Wired Backhaul Network that supports these ever-decreasing 5G small cell architectures. Why? Because…
• 5G cannot exist without a Wired Network to backhaul it! • It’s important to go to ground wire as soon as possible to minimize latency • Industry multiple network operator and service provider consolidation are driven by this
requirement and convergence
Because of the latency requirements for 5G Wireless, and the availability of spectrum, it will be increasingly likely that 5G architectures will be many and varied. The likelihood of any sub 6 GHz spectrum being used for 5G services is high and the potential for architectures to have to support both sub 6 GHz for range and millimeter wave for bandwidth is highly probable. There is also scope for adding inside out schemes for leaf Home Cells on wired networks. Whether these deploy as first stage or final stage elements of the new 5G Wireless world, we will see in the coming five years of rollouts.

© 2019 SCTE•ISBE and NCTA. All rights reserved. 23
3. Using Outside HFC Plant for 5G – considerations and logistics Across all the various wireless options just discussed, there is a driving need for much smaller cell sizes. To make this happen requires an infrastructure that supports both the power and the backhaul to the small cells. The cable industry Hybrid Fiber Coax (HFC) networks is ideally positioned to support this. The HFC networks might support the addition of attached in-line small cells at various demarcation points on the HFC plant. These cells can be added to the DOCSIS network to support 5G, Wi-Fi and/or CBRS/LTE over the HFC.
In addition to inside/out possibilities discussed above, figure 16 shows a backbone of 4W strand mount POPs used to extend coverage for the case of neighborhood roaming. This lies within the FCC guidelines of 10W maximum for urban areas and 50W for unpopulated rural tracts.
Figure 16 – Defining the Roaming (Home Exterior) Proposition for CBRS/LTE
The Coax plant also supports powering for attached devices and has built in backhaul capabilities making it a potential low CAPEX and OPEX small cell host. Possible small cell locations include the Fiber Node, Amplifier locations or even at the Tap distributions to 12 or fewer single unit, stand-alone, houses. Expect to see a mix of high monopole and top of MDU cell sites and smaller cell in fill sites to connect to revenue generating services.
3.1. Case Study – HFC Power for Wireless Cell sites
While backhaul challenges seem to generate the most industry discussion, at the end of the day it is the ability to power these small cells that will become very critical. Today’s HFC plant has already put into place an extensive powering infrastructure for enabling active devices out in customer’s neighborhoods. This could become one of the cable industry’s key assets going forward. An example is reviewed to show how much power might be available for powering these wireless small cells.
© 2019 SCTE•ISBE and NCTA. All rights reserved. 24
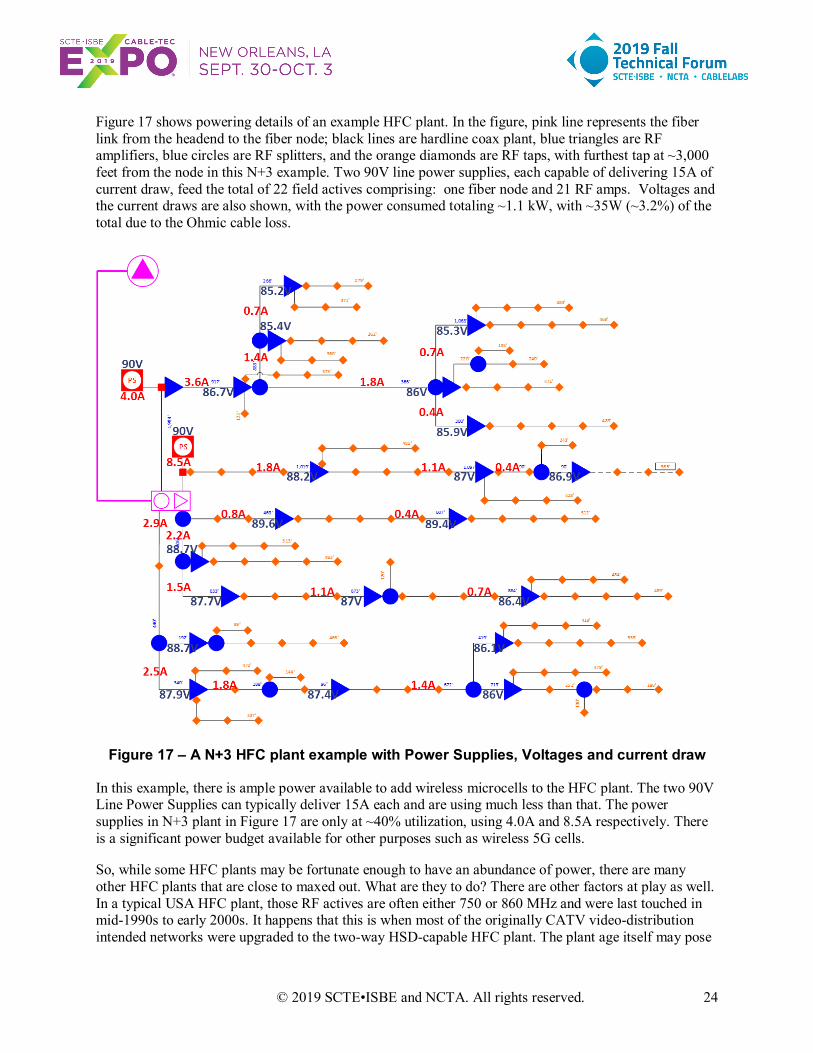
Figure 17 shows powering details of an example HFC plant. In the figure, pink line represents the fiber link from the headend to the fiber node; black lines are hardline coax plant, blue triangles are RF amplifiers, blue circles are RF splitters, and the orange diamonds are RF taps, with furthest tap at ~3,000 feet from the node in this N+3 example. Two 90V line power supplies, each capable of delivering 15A of current draw, feed the total of 22 field actives comprising: one fiber node and 21 RF amps. Voltages and the current draws are also shown, with the power consumed totaling ~1.1 kW, with ~35W (~3.2%) of the total due to the Ohmic cable loss.
Figure 17 – A N+3 HFC plant example with Power Supplies, Voltages and current draw
In this example, there is ample power available to add wireless microcells to the HFC plant. The two 90V Line Power Supplies can typically deliver 15A each and are using much less than that. The power supplies in N+3 plant in Figure 17 are only at ~40% utilization, using 4.0A and 8.5A respectively. There is a significant power budget available for other purposes such as wireless 5G cells.
So, while some HFC plants may be fortunate enough to have an abundance of power, there are many other HFC plants that are close to maxed out. What are they to do? There are other factors at play as well. In a typical USA HFC plant, those RF actives are often either 750 or 860 MHz and were last touched in mid-1990s to early 2000s. It happens that this is when most of the originally CATV video-distribution intended networks were upgraded to the two-way HSD-capable HFC plant. The plant age itself may pose

© 2019 SCTE•ISBE and NCTA. All rights reserved. 25
network reliability issues. That along with an ever-increasing customer bandwidth capacity demand and competitive market mean these aged HFC plants could be due for a refresh real soon. If the HFC plant is going to be refreshed, it should be done with and eye toward improving powering as well.
Many view Fiber to the Premise (FTTP) as the ultimate upgrade, but this can be prohibitively expensive. Nevertheless, due to various tradeoffs, some variants of refurbished actives, node splitting, cascade depth reduction and getting fiber-deeper into the network is what often gets implemented. Per [Ulm_2016], one of those upgrade paths is a fiber-deep, fiber to the last active (FTTLA) approach that yields an upgraded plant shown in Figure 18.
Figure 18 – N+3 HFC plant upgraded to FTTLA, with Voltages and current draws
For FTTLA upgrade, the original node location gets converted to a fiber in / fiber out “VHUB aggregator”, all the RF amplifiers that are feeding customer premises get converted to small fiber nodes, with fiber overlashed to each and every node; where the RF line extenders not feeding customers are no longer required. Total power consumption of such upgraded plant is estimated at ~0.57kW, with only 8W (~1.4%) due to the Ohmic cable loss. This is almost half the power consumption of the original N+3 plant in Figure 17. The power supplies in Figure 17 are using 4.0A and 8.5A respectively while the FTTLA plant in Figure 18 is using an even smaller fraction of it with 1.7A and 4.7A respectively. So, for HFC plant that is short on power, doing a fiber deep upgrade can help find that extra wattage to power those wireless cells. And pulling fiber deeper will help with the backhaul as well!

© 2019 SCTE•ISBE and NCTA. All rights reserved. 26
3.2. Mapping 5G Small Cells to Existing HFC Plant
Densification is a term often used when planning 5G implementations. This is being driven mainly due to the bandwidth demands and the propagation limits of millimeter waves. As seen previously in figures 10 to 14, densification means getting wireless access points into the neighborhoods. Considering existing infrastructure for delivering bandwidth to neighborhoods, what is more appropriate than HFC as the backbone for 5G? Thus, let’s look at some HFC network density characteristics next and see how it might map to a 5G deployment.
Homes-Passed (HP) per mile is a metric that is most-often used to describe HFC network density. It is primarily driven by the density of “developed environments” often classified as urban, suburban and rural. Geography plays a significant role. Figure 19 shows how median lot size of new single-family detached homes sold in 2015 varies across the USA regions. Lot size of 0.19 acres across the whole county is the smallest median size on record since 1992, when Census Bureau Survey of Construction started tracking these statistics [NAHB_2018]. The regional difference can vary by more than three times.
Figure 19 – Median Lot Size, new single-family detached homes started in 2015
The same reference [NAHB_2018] points to a handy analogy in how to envision this size: almost 6 such lots, each ~53 x 160 feet large, would fit in between the goal lines of a 300 x 160 feet football field, itself ~1.1 acre in size. Albeit quite illustrative of regional variability, this turns out to be but a single data point, and does not even include statistics for the custom homes, which tend to have larger lots. Furthermore, older homes are likely to be on even larger lots. From this analysis, one can intuit that across-the-country median size lot gravitates towards a fraction of an acre – 1/5th on the lower end and perhaps 2/3rd on the higher end, without a precise knowledge of what that fraction exactly is.
© 2019 SCTE•ISBE and NCTA. All rights reserved. 27
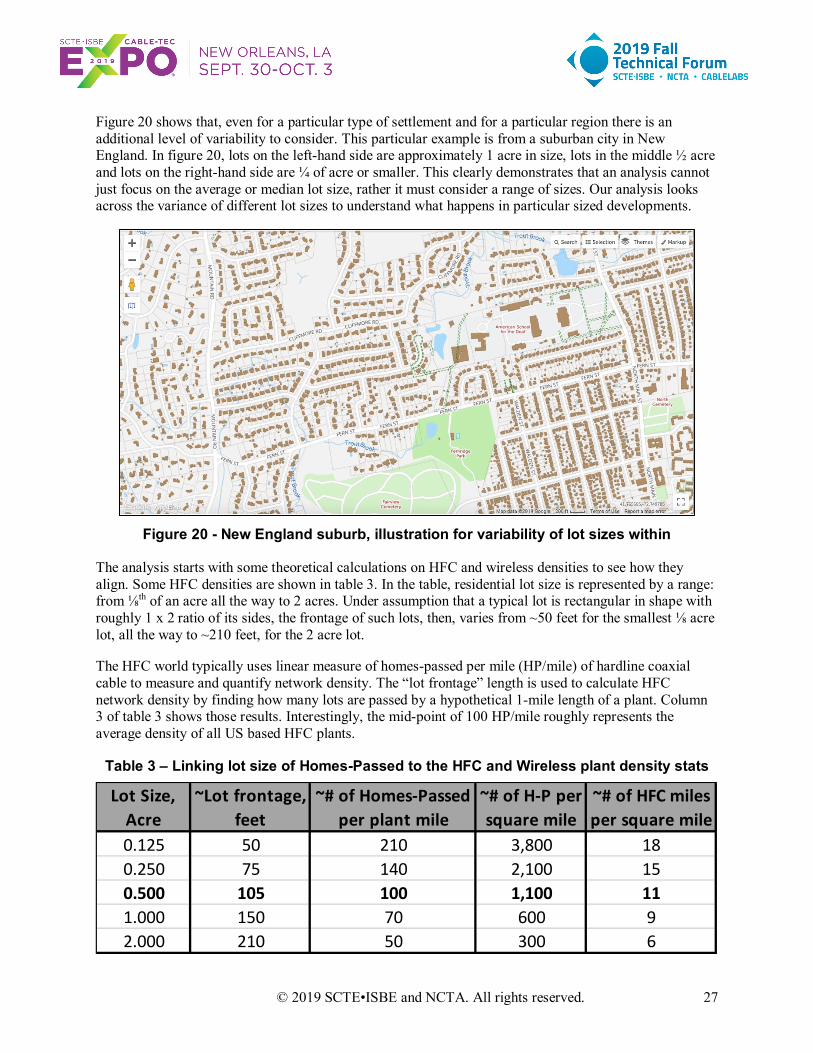
Figure 20 shows that, even for a particular type of settlement and for a particular region there is an additional level of variability to consider. This particular example is from a suburban city in New England. In figure 20, lots on the left-hand side are approximately 1 acre in size, lots in the middle ½ acre and lots on the right-hand side are ¼ of acre or smaller. This clearly demonstrates that an analysis cannot just focus on the average or median lot size, rather it must consider a range of sizes. Our analysis looks across the variance of different lot sizes to understand what happens in particular sized developments.
Figure 20 - New England suburb, illustration for variability of lot sizes within
The analysis starts with some theoretical calculations on HFC and wireless densities to see how they align. Some HFC densities are shown in table 3. In the table, residential lot size is represented by a range: from ⅛th of an acre all the way to 2 acres. Under assumption that a typical lot is rectangular in shape with roughly 1 x 2 ratio of its sides, the frontage of such lots, then, varies from ~50 feet for the smallest ⅛ acre lot, all the way to ~210 feet, for the 2 acre lot.
The HFC world typically uses linear measure of homes-passed per mile (HP/mile) of hardline coaxial cable to measure and quantify network density. The “lot frontage” length is used to calculate HFC network density by finding how many lots are passed by a hypothetical 1-mile length of a plant. Column 3 of table 3 shows those results. Interestingly, the mid-point of 100 HP/mile roughly represents the average density of all US based HFC plants.
Table 3 – Linking lot size of Homes-Passed to the HFC and Wireless plant density stats
Lot Size, Acre
~Lot frontage, feet
~# of Homes-Passed per plant mile
~# of H-P per square mile
~# of HFC miles per square mile
0.125 50 210 3,800 180.250 75 140 2,100 150.500 105 100 1,100 111.000 150 70 600 92.000 210 50 300 6
© 2019 SCTE•ISBE and NCTA. All rights reserved. 28
In these examples, from low to high density, HFC plant is mapped along the streets in a linear / one-dimensional way – that is, a coaxial hardline passes along the streets and serves homes on both sides of the street (this element is used in calculation of HP/mile, in that the 1 mile = 5,280 feet long plant passes by ~50 lots 105 ft wide lots on one side of the street, and as many on the other side – for the total of ~100 HP/mile – as in the middle row of the Table 3).
Wireless plant density metrics, however, are two-dimensional, as is the wireless reach of a cell radius (i.e. circle) around a wireless access point, shown previously in figures 10 to 14. The 4th column of Table 3 links the two-dimensional density, expressed in Homes-Passed per square mile, to the lot size, lot frontage length, and the linear density metrics of HP/mile. An assumption made here is that town blocks are formed by 4x2 = 8 lots, surrounded by ~33 feet wide streets. For ½ acre lots, with ~105 feet frontage, the area of such 4x2 town block is:
(33 + 4 x 105) x (33 + 2 x 207) = 202,491 square feet, or 1/138 of a square mile
Since there are 4x2 = 8 HP per each block, area density calculates as 8 x 138 = ~ 1,100 HP/ mile square, as in the middle row, column 4 of the Table 3. Column 5 of table 3 shows HFC plant length per square mile, required to pass by each lot of a given size.
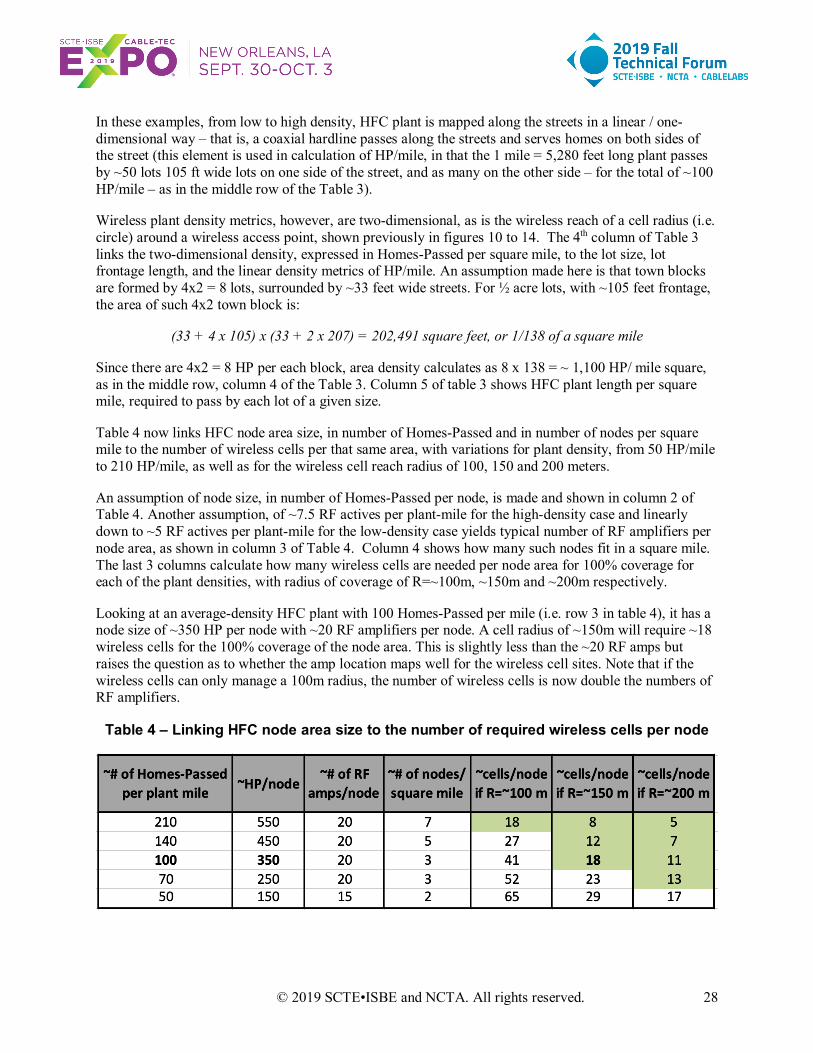
Table 4 now links HFC node area size, in number of Homes-Passed and in number of nodes per square mile to the number of wireless cells per that same area, with variations for plant density, from 50 HP/mile to 210 HP/mile, as well as for the wireless cell reach radius of 100, 150 and 200 meters.
An assumption of node size, in number of Homes-Passed per node, is made and shown in column 2 of Table 4. Another assumption, of ~7.5 RF actives per plant-mile for the high-density case and linearly down to ~5 RF actives per plant-mile for the low-density case yields typical number of RF amplifiers per node area, as shown in column 3 of Table 4. Column 4 shows how many such nodes fit in a square mile. The last 3 columns calculate how many wireless cells are needed per node area for 100% coverage for each of the plant densities, with radius of coverage of R=~100m, ~150m and ~200m respectively.
Looking at an average-density HFC plant with 100 Homes-Passed per mile (i.e. row 3 in table 4), it has a node size of ~350 HP per node with ~20 RF amplifiers per node. A cell radius of ~150m will require ~18 wireless cells for the 100% coverage of the node area. This is slightly less than the ~20 RF amps but raises the question as to whether the amp location maps well for the wireless cell sites. Note that if the wireless cells can only manage a 100m radius, the number of wireless cells is now double the numbers of RF amplifiers.
Table 4 – Linking HFC node area size to the number of required wireless cells per node

© 2019 SCTE•ISBE and NCTA. All rights reserved. 29
For the high density, 210 HP/mile example in row 1, there are more RF amplifiers than wireless cells, even at 100m cell radius. But at the low density, 50HP/mile example in row 5, there are more wireless cells than RF amplifiers even with 200m radius. So, this theoretical analysis clearly shows that the mapping of wireless cells to the HFC will be extremely dependent on the housing density.
Our next step is to look at some actual HFC plant examples and to map some wireless cells to them to see how the real world holds up. Figures 21-23 show a higher density HFC plant example that is ~190 HP/mile. In figure 21, wireless cells with 200m radius are overlaid and placed next to an active amplifier location as to achieve as close to 100% coverage as possible. These RF amp + cell locations are highlighted with a green hexagonal. Other amplifier locations without a wireless cell are shown with a red hexagonal. Since wireless capacity is a function of distance, figure 21 also shows the 150m radius where homes might achieve higher capacities.
Note that figure 21 represents approximately 2 total cell sites (i.e. one full and two partial cells shown for this particular neighborhood), but that there are also 8 RF amplifier locations without a cell. Also note that most homes will be inside the 150m radius and get higher wireless capacities. This result is also reasonably close to our theoretical analysis in table 4.
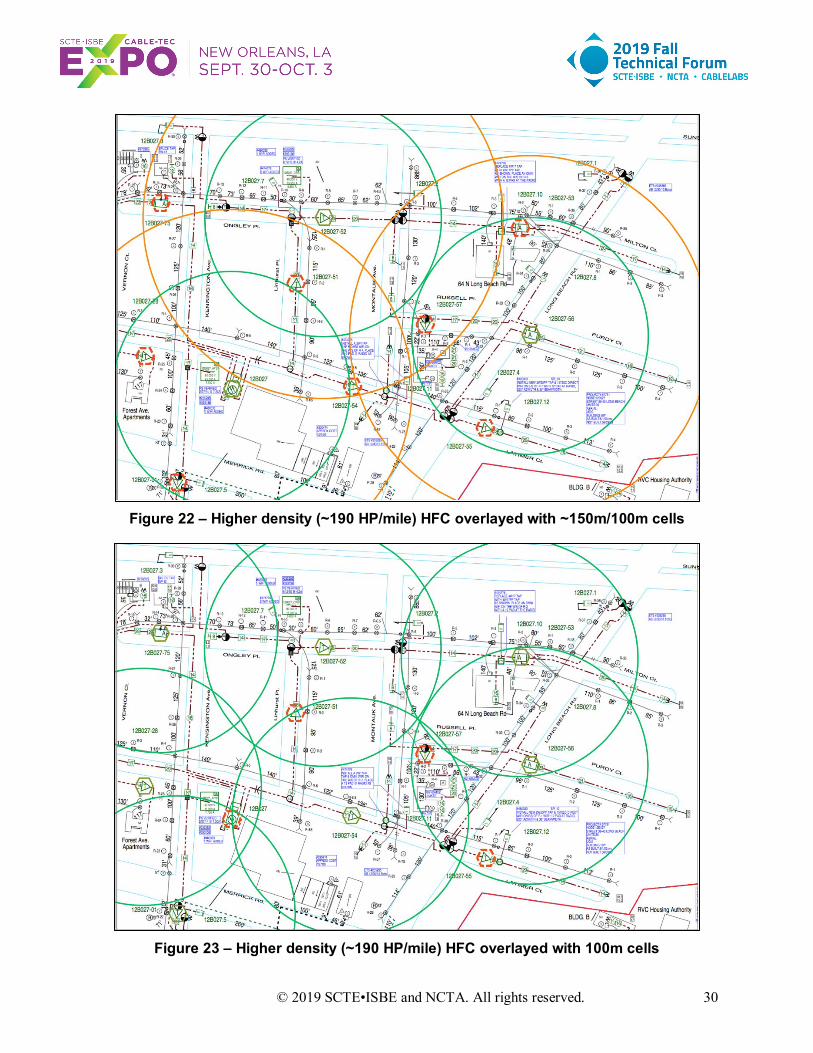
Figure 22 looks at the same high-density neighborhood, but now with 150m cell radius overlaid for close to 100% coverage. The figure also shows the 100m cell radius where higher wireless capacities can be expected. Figure 22 shows almost 3 full cell sites co-located with RF amps, while 7 RF amplifier locations are without a cell. Again, reasonably close to our theoretical analysis in table 4.
Figure 21 – Higher density (~190 HP/mile) HFC overlayed with ~200m/150m radius cells
© 2019 SCTE•ISBE and NCTA. All rights reserved. 30
Figure 22 – Higher density (~190 HP/mile) HFC overlayed with ~150m/100m cells
Figure 23 – Higher density (~190 HP/mile) HFC overlayed with 100m cells
© 2019 SCTE•ISBE and NCTA. All rights reserved. 31
Finally, figure 23 looks at the same high-density neighborhood, but now with 100m cell radius overlaid for close to 100% coverage. Note that this smaller cell radius might be needed if there are dense foliage and/or buildings that impede the wireless millimeter wave signals. Note that figure 23 is showing approximately six wireless cells but there are still 4 RF amplifier locations that are without a cell. This is much better than our analysis in table 4 that predicted most RF amplifiers would have a wireless cell. Overall for the high-density example, co-locating the wireless cells with the HFC RF amplifiers is not a problem at any of the three-cell radii considered.
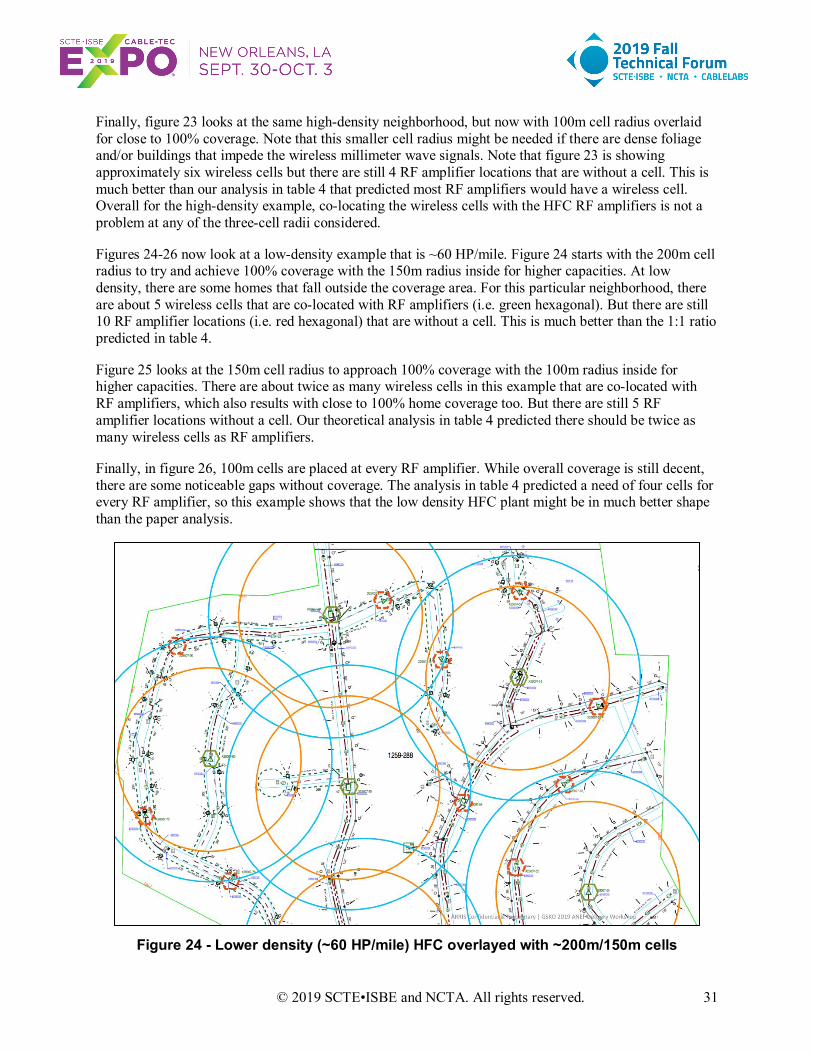
Figures 24-26 now look at a low-density example that is ~60 HP/mile. Figure 24 starts with the 200m cell radius to try and achieve 100% coverage with the 150m radius inside for higher capacities. At low density, there are some homes that fall outside the coverage area. For this particular neighborhood, there are about 5 wireless cells that are co-located with RF amplifiers (i.e. green hexagonal). But there are still 10 RF amplifier locations (i.e. red hexagonal) that are without a cell. This is much better than the 1:1 ratio predicted in table 4.
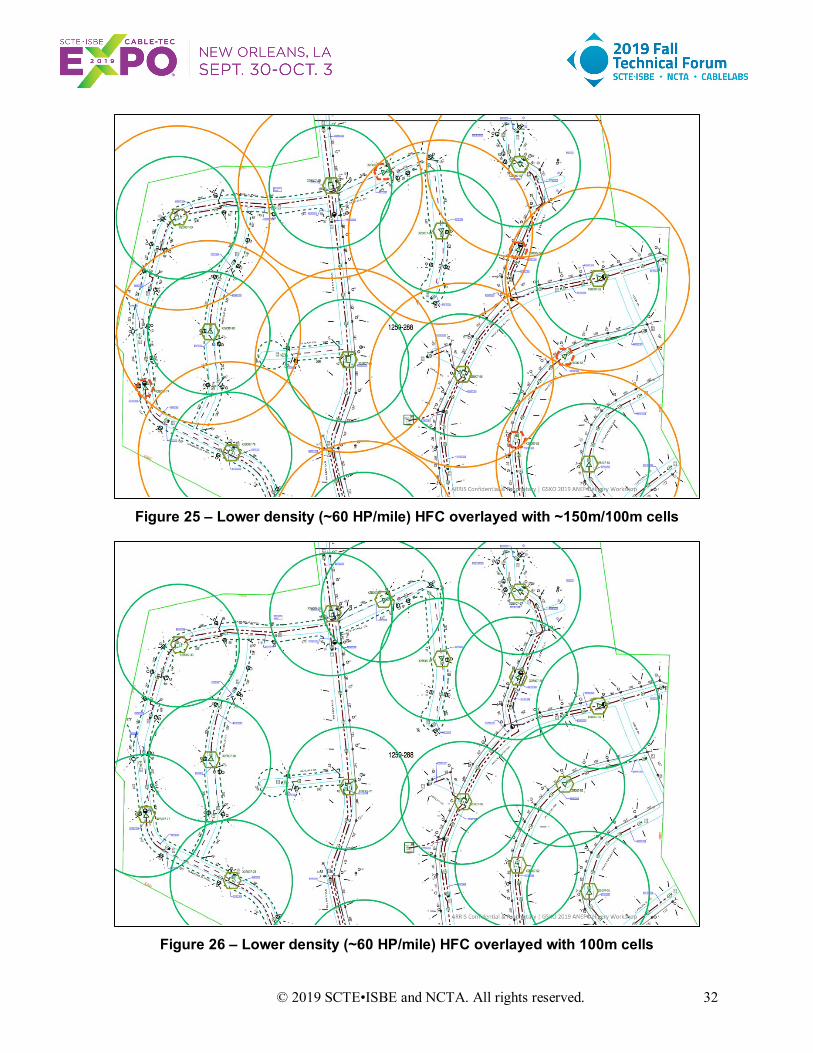
Figure 25 looks at the 150m cell radius to approach 100% coverage with the 100m radius inside for higher capacities. There are about twice as many wireless cells in this example that are co-located with RF amplifiers, which also results with close to 100% home coverage too. But there are still 5 RF amplifier locations without a cell. Our theoretical analysis in table 4 predicted there should be twice as many wireless cells as RF amplifiers.
Finally, in figure 26, 100m cells are placed at every RF amplifier. While overall coverage is still decent, there are some noticeable gaps without coverage. The analysis in table 4 predicted a need of four cells for every RF amplifier, so this example shows that the low density HFC plant might be in much better shape than the paper analysis.
Figure 24 - Lower density (~60 HP/mile) HFC overlayed with ~200m/150m cells
© 2019 SCTE•ISBE and NCTA. All rights reserved. 32
Figure 25 – Lower density (~60 HP/mile) HFC overlayed with ~150m/100m cells
Figure 26 – Lower density (~60 HP/mile) HFC overlayed with 100m cells
© 2019 SCTE•ISBE and NCTA. All rights reserved. 33
Both the high density and low density use cases show that existing HFC amplifier locations can be quite effective for providing 5G millimeter wave coverage, even in the worst case of low home density with a small cell radius (e.g. 100m or less). In these scenarios, it is still possible to add additional cells that are in other locations. It is feasible to add other strand mounted cells that are between RF amplifier locations that get their power from the coax and use DOCSIS over the coax for its backhaul. Another option is the Inside-Outside strategy discussed earlier in this paper. Looking at figure 26, there might only need to be a couple homes selected to install a wireless cell (i.e. Home as a Tower, HaaT).
The previous examples have also shown uniform wireless cell radius. There may be additional optimizations that an operator can make by having wireless cells with different transmit powers. This will allow the operator to maximize coverage for a minimum amount of power consumption.
As time progresses and bandwidth needs continue to rise, an operator might want to migrate from a DOCSIS based backhaul to a fiber backhaul. One solution that supports this is a full fiber deep FTTLA upgrade with its accompanying power reductions. But as our previous case studies have shown, there might not be a cell at every amplifier location. This is especially true in moderate to high density areas. In this scenario, an operator could choose to do a partial FTTLA upgrade where only the RF amplifiers with a small cell adjacent are converted to fiber nodes. This approach is termed FTT5G, or Fiber to the 5G cell.
3.3. HFC Adaptibility in a changing World
One observation is that the HFC plant already is where the customers are; more densely populated square miles have more linear cable miles. Per [NNT_2012], some “things”, both in the nature and in human-made world, benefit from high variability and disorder because of the “thing’s” ability to adapt and gain a competitive advantage in such highly varied and disorderly environment. Could the HFC plant be one of these “things” and if so how?
HFC adaptability is second to none, able to feed consumers from super rural to super urban, whether it is a few homes per square mile up to thousands of homes per square mile. HFC node size and the resulting service group size are highly flexible as well. One node could be 1 or 2 or 4 service groups via node segmentation; then many nodes could be aggregated into a single service group, as in the FTTLA example of Figure 18. A fiber-deep, N+0 last active node could feed just tens of customers directly.
The HFC is extensible. If an adjacent area needs coverage, the operator can build the HFC plant out in a Lego® block like extension. They can add another node, or coax-fed bridger amplifier to connect many dozens of homes or use a line-extender amplifier to do the job if only a few dozen homes. The operator has an unlimited number of combinations of how to form a service group and how to cover an area that is typical or atypical.
The fiber portion of HFC is extensible too. A fiber to the building and FTTP further increases those possibilities. An “inverse node” could take a signal from an RF port, convert it to fiber, then feed a remote housing development that simply was not in any of the plants when the original network was built. The long story short, the more variability encountered in the field, the more the HFC way of serving the customer needs shines.
5G deployment requirements may be yet another “make it shine” aspect of HFC. When comparing various HFC network densities and the 5G access point densities required, it turns out that as many 5G access points are needed per area as there are RF amplifiers in an existing network. In order to deploy efficiently, those access points need backhaul and power supplies nearby. In the near term, DOCSIS 3.1 backhaul will work just fine. Longer term, the FTTLA fiber-deep upgrade of Figure 18, gets fiber within 300 feet of the last tap, and the existing powered hardline coaxial plant now has more kilowatts to spare.

© 2019 SCTE•ISBE and NCTA. All rights reserved. 34
Both backhaul and powering are the two key factors required for the 5G. Densification may be the right term when going from 4G to 5G; right-sizing may be the better term to use when matching the existing HFC plant to the 5G deployment needs.
Conclusion 4. Cable 10G vs. Wireless 5G – Friend or Foe? So, is Wireless 5G a foe or friend to Cable 10G? The bandwidth capacity of 5G high band millimeter waves does enable multi-gigabit per second services to the home. At first glance, using 5G for Fixed Wireless Access (FWA) might appear as potential stiff competition to cable. But in reality, Cable 10G offers two to three times the bandwidth capacity of 5G with a roadmap to even higher capacities in the future [see CLO_2019].
A gigabit per second wireless service is still formidable. However, it may be very tough to make the economics work outside of densely populated areas or select locations like MDUs. With a typical density of 100 HP/mile, the FWA operator might need to deploy a cell for every 10-20 homes. At low 50 HP/mile densities, the cell may only cover 2-5 homes.
In addition to these challenges, the FWA operator will need to come up with both a backhaul and a powering infrastructure. FTTP operators may have the backhaul portion covered, but how do they power their small cells? Developing the backhaul and powering infrastructure will be a daunting task for any potential FWA operator. Anyone that is except a cable operator.
Perhaps a better question to answer is: “Who is strategically in the best position to mesh the capacity advantage of wired and the untethered access advantage of wireless?” and the answer may be cable operators! Because, behind a successful wireless network, there is a wired network, with power and bandwidth capacity to boot.
As shown in our case studies in this paper, the HFC plant aligns quite nicely with the needs for 5G backhaul and powering across a wide variety of housing densities. Some HFC plants may have adequate power today to support a small cell infrastructure. Other HFC plants can address the power issue with fiber deep FTTLA upgrades.
DOCSIS 3.1 provides adequate capacity for 5G backhaul in the near term. A longer-term strategy of fiber deep can eventually convert this to fiber backhaul. One such strategy discussed is FTT5G where fiber is pulled to those actives with a wireless cell adjacent to it.
The wireless and wired technologies need each other to make a better system. The future high bandwidth, high frequency wireless systems need small cells with many access points requiring a low latency wired backhaul; and APs positioned inside the home/MDU and outside in every neighborhood for optimum coverage. Cable is ideally suited to support this backhaul infrastructure. Meanwhile, Cable 10G can provide multi-gigabit capacity to the home’s entry point but needs a robust high capacity wireless connection for that final 100 meters inside and around the home to every mobile device.
In the end, Cable 10G and Wireless 5G/CBRS are much stronger together and are at the core of a next generation network evolution. We think that they will be best friends.
© 2019 SCTE•ISBE and NCTA. All rights reserved. 35
Bibliography & References [ALB_2019] A. Al-Banna et. al., “Operational Considerations and Configurations for FDX & Soft-FDD,” SCTE Cable-Tec 2019, SCTE
[CHE_2018], C. Cheevers, “How will Outdoor and Indoor use of 5G Wireless Services really work?”, IBC 2018
[CLO_2019] T. J. Cloonan et. al., “Capacity Planning, Traffic Engineering, And HFC Plant Evolution For The Next 25 Years,” SCTE Cable-Tec 2019, SCTE
[FDX_PHY] “DOCSIS 4.0 Physical Layer Specification”, CM-SP-PHYv4.0-D01-190628, Cablelabs 2019
[FLE_2017], J.R. Flesch, et. al., “Can a Fixed Wireless Last 100m Connection Really Compete with a Wired Connection and Will 5G Really Enable this Opportunity?”, SCTE Cable-Tec 2017, SCTE
[FLE_2018], J.R. Flesch, C. Cheevers, “The New Home as a Hotspot: Wi-Fi Meet CBRS LTE and Meet Your Long Range Brother LoRa”, SCTE Cable-Tec 2018, SCTE
[NAHB_2018] http://eyeonhousing.org/2018/08/lot-size-remains-record-low/
[NNT_2012] Nassim Nicholas Thaleb, “Antifragile: Things That Gain from Disorder”, Random House, November 27, 2012
[ULM_2019] J. Ulm, T. J. Cloonan, “The Broadband Network Evolution continues – How do we get to Cable 10G?”, SCTE Cable-Tec 2019, SCTE
[ULM_2017] J. Ulm, T. J. Cloonan, “Traffic Engineering in a Fiber Deep Gigabit World”, SCTE Cable-Tec 2019, SCTE
[ULM_2016] “Adding the Right Amount of Fiber to Your HFC Diet: A Case Study on HFC to FTTx Migration Strategies”, John Ulm, Zoran Maricevic; 2016 SCTE Cable-Tec Expo
[ULM_2014] “Is Nielsen Ready to Retire? Latest Developments in Bandwidth Capacity Planning”, John Ulm, T. Cloonan, M. Emmendorfer, J. Finkelstein, JP Fioroni; 2014 SCTE Cable-Tec Expo

© 2019 SCTE•ISBE and NCTA. All rights reserved. 36
Abbreviations 5G 5th generation (wireless) 10G 10 gigabit platform (cable) AP access point bps bits per second AR Augmented reality BW bandwidth CAPEX Capital Expense CBRS Citizens Broadband Radio Service CPE Consumer Premise Equipment DAA Distributed Access Architecture DOCSIS Data Over Cable Service Interface Specification DS Downstream FDX Full Duplex (i.e. DOCSIS) FTTLA Fiber to the Last Active FTTP Fiber to the Premise FTT5G Fiber to the 5G small cell FWA Fixed Wireless Access Gbps Gigabits Per Second GHz Gigahertz HaaT Home as a Tower HD high definition HFC hybrid fiber-coax HP Homes Passed Hz Hertz IoT Internet of things ISBE International Society of Broadband Experts ITU International Telecommunication Union IEEE Institute of Electrical and Electronics Engineers LLD Low latency DOCSIS LoRa Long Range LOS Line of sight LTE Long term evolution MAC Media Access Control interface MDU Multiple Dwelling Unit MHz Megahertz MIMO multiple-input and multiple-output MoCA Multimedia over Coax Alliance MSO Multiple System Operator MVNO Mobile Virtual Network Operator N+0 Node+0 actives NCTA National Cable and Telecommunications Association nLOS Near line of sight NSI Network Side Interface Nsub Number of subscribers
© 2019 SCTE•ISBE and NCTA. All rights reserved. 37
OFDMA Orthogonal Frequency Division Multiplexing Access (Upstream) OFDM Orthogonal Frequency Division Multiplexing OPEX Operating Expense PGS Predictive Grant Service (DOCSIS) PHY Physical interface PNM Proactive Network Maintenance PON Passive Optical Network QoE Quality of Experience RF Radio frequency R-PHY Remote PHY Rx Receive SCTE Society of Cable Telecommunications Engineers SFU Single family unit SG Service Group SLA Service level agreement Tavg Average throughput per subscriber Tx Transmit UHD Ultra-high definition (4K, 8K) US Upstream VR Virtual reality CommScope and ARRIS are trademarks of CommScope, Inc. and/or its affiliates. DOCSIS is a trademark of Cable Television Laboratories, Inc. All other trademarks are the property of their respective owners.