Embed Size (px)
Citation preview
* Corresponding author: [email protected]
C Stock of Top Soil and It Spatial Distribution in Mangrove Community of Trimulyo, Semarang City
Dhita Prasisca Mutiatari1*, Rudhi Pribadi1, Nana Kariada Tri Martuti2 1Magister Program of Environmental Science, School of Postgraduate Studies, Universitas Diponegoro, Semarang - Indonesia 2Department of Biology, Faculty of Mathematics and Science, Universitas Negeri Semarang, Semarang – Indonesia
Abstract. Mangrove ecosystem plays important role as carbon sink, not only on mangrove community but also on the top soil. The purposes of this research were 1) to estimates and compare C-stocks in vegetation and non-vegetation mangrove soils (represented by aquaculture ponds and mudflats); 2) modeling the spatial distribution of soil C-stocks in the study area. The purposive sampling method was used to determine 16 sample plots representing vegetation and non-vegetation mangroves. In each plot, the soil samples were taken on top soil layer (0-10 cm). For general display of spatial distribution maps of soil C-stocks, spatial interpolation is used by the Ordinary Kriging method. The result showed that total of soil C-stocks in coastal area of Trimulyo was 148.53 MgC ha-1, with composition of 53.59% in mangrove vegetation, 38.82% and 7.57% in cultivation pond and mudflat, respectively. Statistical analysis with ANOVA test showed no significant difference (ρ = 0.972) between soil C stock in vegetation and non-vegetation mangrove. It shows that the water column on the coast of Trimulyo has great potential as a carbon store.
Keywords: Mangrove. Carbon Stock, Soil C-Stock, Land use, Spatial modelling
1. Introduction The mangrove ecosystem is very important to
reducing carbon emissions because it can absorb carbon up to 75-150 tC ha-1y-1 [1]. However, the contribution of mangrove forest carbon emissions is also high because ecosystem damage. The mangrove forest area is rapidly converted to establish fishery cultivation activity and development center area [2-4]. In general, mangrove waters release the amount of CO2 to atmosphere more than 2.5 times (-42.8 TgC yr-1) emitted from all other subtropical and tropical coastal waters [5]. Mangrove deforestation releases CO2 stored from soil up to ~7.0 Tg CO2e yr-1 and Indonesia becomes the country with the highest carbon emission potential (3.410 Gg CO2e yr-1) [6].
In tropical areas, soil ground in the mangrove forest ecosystem is able to preserve carbon up to 49-98% [2], greater than the carbon stocks above the surface and when compared with other land use such as peat swamp and marshes ecosystem (784.5 ± 73.5, 722.2 ± 63.6 and 336.5 ± 38.3 MgC / ha, respectively) [7-9].
Previous research on the value of soil C-stock has been widely used, comparing the value of C-stocks to the variation of species and age of vegetation, ecosystem variation, land use variation, and based on the difference in soil depth [10-12]. A recent study of [7] by comparing soil C-stocks in mangrove forests and other land uses from mangrove land conversion, with variations in
sample depth intervals, then soil C-stock values are spatially displayed for distribution.
Information related to distribution of spatial map of soil C-stocks in top soil coatings in Indonesia is still rare. In the last 20 years, the effects of climate change (accretion and abrasion) have damaged and eliminated mangrove forests and fish ponds in Trimulyo Coast [13]. Then, the last decade of society and Semarang City government re-rehabilitate the area, through mangrove planting, hydrological system improvement and mangrove seedling.
On this basis, this research purposes to estimates and compare soil C-stock in vegetation and non-vegetation mangrove (represented by aquaculture ponds and mudflats) and to modelling the distribution spatial of soil C-stock in mangrove communities in Trimulyo, Genuk Sub-district, Semarang City.
2. Method
2.1 Study Site
This research was conducted at the mangrove community in Trimulyo, precisely at the Babon River estuary of Semarang (6°56'44" S - 6°55'56" S and 110° 27'39" E - 110°28'42" E). The maximum average sea level per month reached 0.87 m [14]. Field observations found several types of mangroves that comprise this
https://doi.org/10.1051/e3sconf/2018730 , 0 (2018)E3S Web of Conferences 73ICENIS 2018
300 30066
© The Authors, published by EDP Sciences. This is an open access article distributed under the terms of the Creative Commons Attribution License 4.0 (http://creativecommons.org/licenses/by/4.0/).
region include Rhizhopa apiculata, Rhizhopora stylosa, Avicennia marina, and Sonneratia spp.
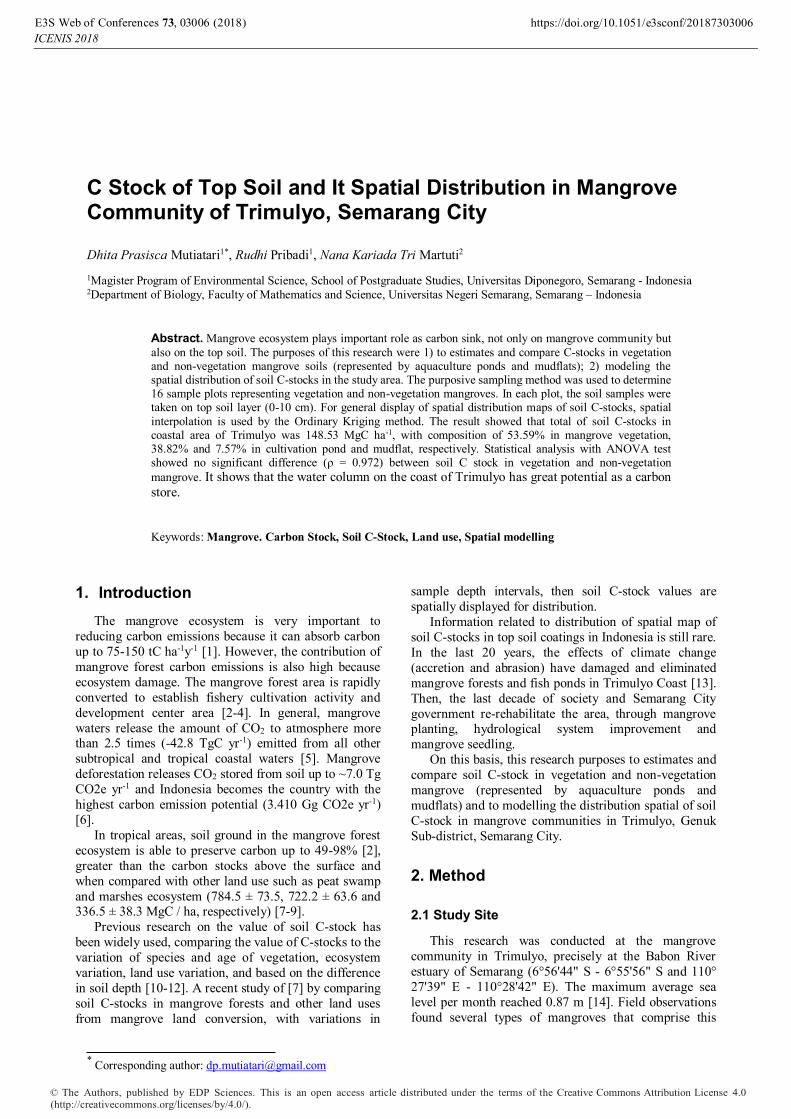
The research area is 45 ha with land use, consisting of mangrove forest, fish pond, mudflat, and river. The following is a map of the research sites covering land use and the location of sample points.
2.2 Research Design
The location of the study was determined based on land use on vegetation and non-vegetation mangrove represented fish pond and mudflat. By purposive sampling determined 16 plot representing land use in vegetation and non-vegetation mangrove. Distribution of plots at each location, i.e., mangrove vegetation (8 plot) and non-mangrove vegetation, including 4 plot fish pond and 4 plot mudflats (Figure 1).
Collection of soil samples was performed in each plot, following methods in previous studies [15-17] i.e., take a soil sample with a composite method of 5 points, on all four directions of the wind and in the middle of the plot. The soil samples were taken at a depth of 0-10 cm with a soil sampler ring and put the soil sample into plastic, then weighed the wet weight in the field. Put the soil sample into the cool box for temporary storage before being analyzed in the laboratory. Measure the soil pH using soil tester and salinity using a refractometer (Table 1). All values are measured average and standard error.
2.3 Laboratory Analysis
Laboratory analysis was performed to measured Bulk Density (BD) and Organic Carbon (OC). For BD calculation the first step by measuring the volume of ring soil sampler to know the volume of soil. The soil sample was dried at 105°C. for 6 hours, measuring dry weight. The drying process is carried out with the dry weight of the soil not experiencing shrinkage (constant). BD is determined following the following equation:
BD (g cm-3) = (1)
Meanwhile, OC calculations were performed using the Walkley-Black method. Laboratory analysis was conducted at Soil Laboratory in Assessment Institute for Agricultural Technology (BPTP), Central Java.
2.4 Soil Carbon Estimation
Measurement of soil C-stock (MgC ha-1) based on interval of depth following procedure [16], calculated as product of BD (g cm-3), OC (%C), Soil Depth (SD) (cm).
Figure 1. The coastal land use and study site in Trimulyo village, Genuk District, Semarang City
https://doi.org/10.1051/e3sconf/2018730 , 0 (2018)E3S Web of Conferences 73ICENIS 2018
300 30066
2
Soil C Stock = BD*OC*SD (2)
Meanwhile, total soil C-stocks (MgC) was calculated on the study site as a product of soil C-stocks (MgC ha-1) and area (ha).
2.5 Data Analysis
Differences in soil C-stocks between vegetation and non-vegetation mangroves were analyzed using the Analysis of Variance (ANOVA) test. Meanwhile, correlation analysis with pearson correlation was done to find out the relationship between BD, OC, SD and soil C-stocks. Statistical analysis using IBM SPSS 20 software.
2.6 Spatial Models
To produce distribution of spatial map and variability of soil C-stock for all research sites, by using Ordinary
Kriging method. Non-mangrove vegetation land uses that were not studied, such as built areas and others, were excluded in interpolation and assessed by "No Data". Spatial modeling and analysis was performed with ArcMap 10.1 (ESRI) software with an imagery source from google earth. The procedure of the spatial model in this study follows [7], expressed in the equation:
(3)
where Z(Xo) is the estimate of soil C-stock (MgC ha-
1) at location Xo; Z (Xi) is the measured value of soil C stock at Xi locations; and λi are weights of measured Xi locations surrounding location Xo.
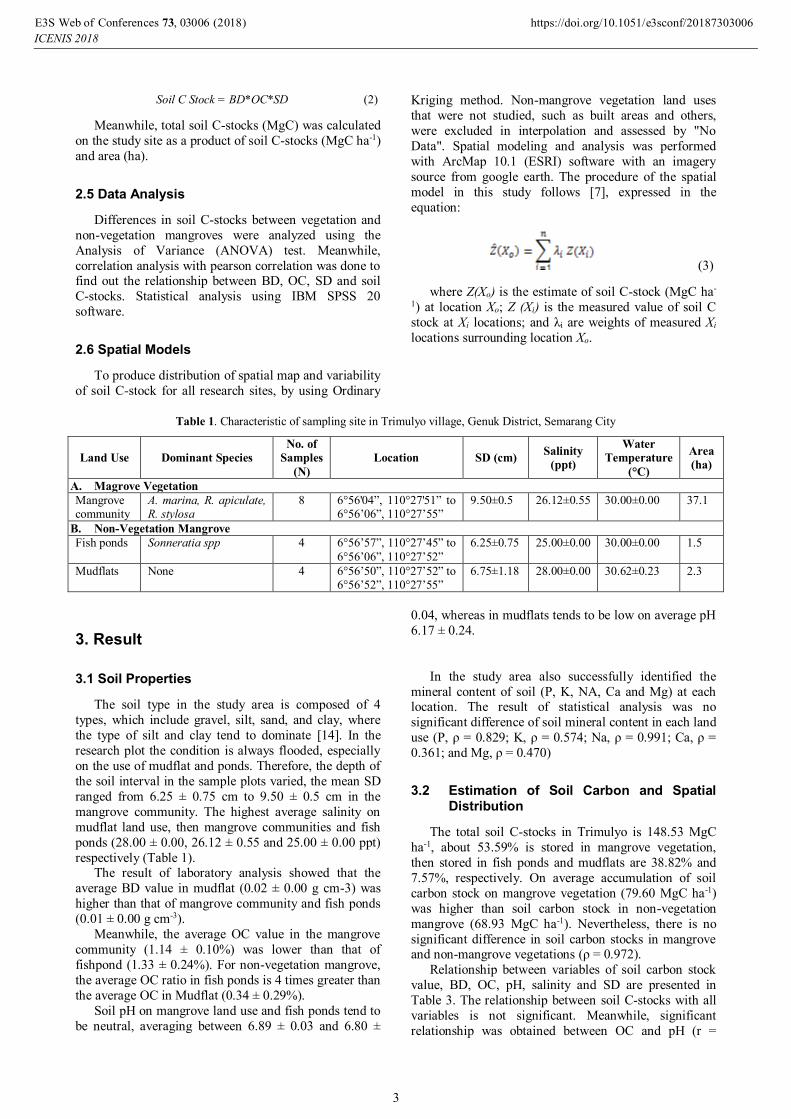
Table 1. Characteristic of sampling site in Trimulyo village, Genuk District, Semarang City
Land Use Dominant Species No. of
Samples (N)
Location SD (cm) Salinity (ppt)
Water Temperature
(°C)
Area (ha)
A. Magrove Vegetation Mangrove community
A. marina, R. apiculate, R. stylosa
8 6°56'04”, 110°27'51” to 6°56’06”, 110°27’55”
9.50±0.5
26.12±0.55 30.00±0.00 37.1
B. Non-Vegetation Mangrove Fish ponds Sonneratia spp 4 6°56’57”, 110°27’45” to
6°56’06”, 110°27’52” 6.25±0.75 25.00±0.00 30.00±0.00 1.5
Mudflats None 4 6°56’50”, 110°27’52” to 6°56’52”, 110°27’55”
6.75±1.18 28.00±0.00 30.62±0.23 2.3
3. Result
3.1 Soil Properties
The soil type in the study area is composed of 4 types, which include gravel, silt, sand, and clay, where the type of silt and clay tend to dominate [14]. In the research plot the condition is always flooded, especially on the use of mudflat and ponds. Therefore, the depth of the soil interval in the sample plots varied, the mean SD ranged from 6.25 ± 0.75 cm to 9.50 ± 0.5 cm in the mangrove community. The highest average salinity on mudflat land use, then mangrove communities and fish ponds (28.00 ± 0.00, 26.12 ± 0.55 and 25.00 ± 0.00 ppt) respectively (Table 1).
The result of laboratory analysis showed that the average BD value in mudflat (0.02 ± 0.00 g cm-3) was higher than that of mangrove community and fish ponds (0.01 ± 0.00 g cm-3).
Meanwhile, the average OC value in the mangrove community (1.14 ± 0.10%) was lower than that of fishpond (1.33 ± 0.24%). For non-vegetation mangrove, the average OC ratio in fish ponds is 4 times greater than the average OC in Mudflat (0.34 ± 0.29%).
Soil pH on mangrove land use and fish ponds tend to be neutral, averaging between 6.89 ± 0.03 and 6.80 ±
0.04, whereas in mudflats tends to be low on average pH 6.17 ± 0.24.
In the study area also successfully identified the
mineral content of soil (P, K, NA, Ca and Mg) at each location. The result of statistical analysis was no significant difference of soil mineral content in each land use (P, ρ = 0.829; K, ρ = 0.574; Na, ρ = 0.991; Ca, ρ =
0.361; and Mg, ρ = 0.470)
3.2 Estimation of Soil Carbon and Spatial Distribution
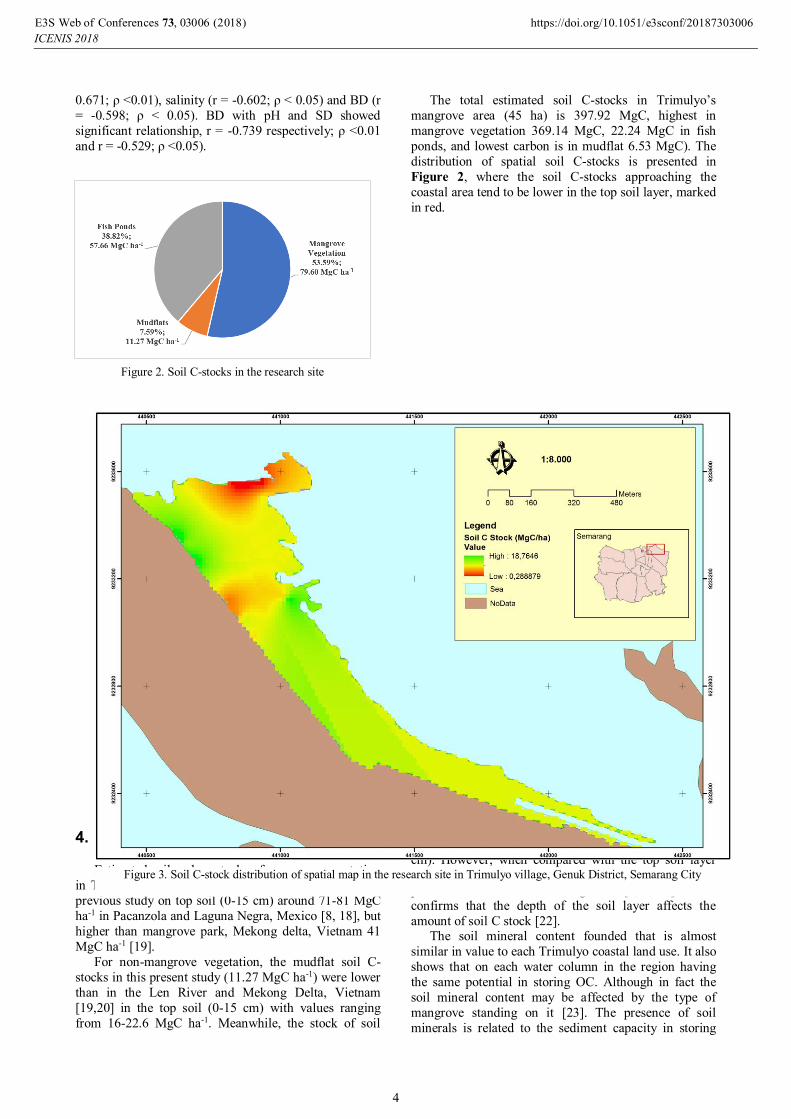
The total soil C-stocks in Trimulyo is 148.53 MgC ha-1, about 53.59% is stored in mangrove vegetation, then stored in fish ponds and mudflats are 38.82% and 7.57%, respectively. On average accumulation of soil carbon stock on mangrove vegetation (79.60 MgC ha-1) was higher than soil carbon stock in non-vegetation mangrove (68.93 MgC ha-1). Nevertheless, there is no significant difference in soil carbon stocks in mangrove and non-mangrove vegetations (ρ = 0.972).
Relationship between variables of soil carbon stock value, BD, OC, pH, salinity and SD are presented in Table 3. The relationship between soil C-stocks with all variables is not significant. Meanwhile, significant relationship was obtained between OC and pH (r =
https://doi.org/10.1051/e3sconf/2018730 , 0 (2018)E3S Web of Conferences 73ICENIS 2018
300 30066
3
0.671; ρ <0.01), salinity (r = -0.602; ρ < 0.05) and BD (r = -0.598; ρ < 0.05). BD with pH and SD showed significant relationship, r = -0.739 respectively; ρ <0.01
and r = -0.529; ρ <0.05).
The total estimated soil C-stocks in Trimulyo’s
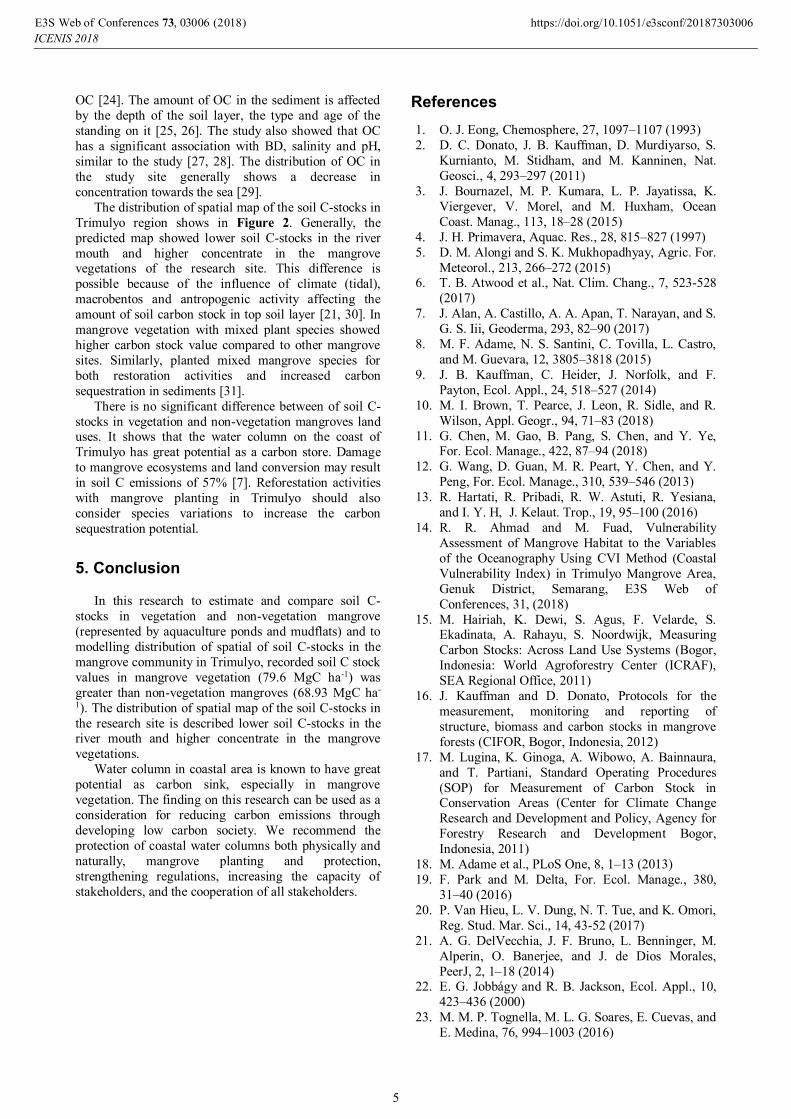
mangrove area (45 ha) is 397.92 MgC, highest in mangrove vegetation 369.14 MgC, 22.24 MgC in fish ponds, and lowest carbon is in mudflat 6.53 MgC). The distribution of spatial soil C-stocks is presented in Figure 2, where the soil C-stocks approaching the coastal area tend to be lower in the top soil layer, marked in red.
4. Discussion
Estimated soil carbon stocks of mangrove vegetation in Trimulyo is 79.6 MgC ha-1. This result is similar to previous study on top soil (0-15 cm) around 71-81 MgC ha-1 in Pacanzola and Laguna Negra, Mexico [8, 18], but higher than mangrove park, Mekong delta, Vietnam 41 MgC ha-1 [19].
For non-mangrove vegetation, the mudflat soil C-stocks in this present study (11.27 MgC ha-1) were lower than in the Len River and Mekong Delta, Vietnam [19,20] in the top soil (0-15 cm) with values ranging from 16-22.6 MgC ha-1. Meanwhile, the stock of soil
carbon in fish ponds in this study (57.66 MgC ha-1), there is no comparison database on top soil layer (0-10 cm). However, when compared with the top soil layer (0-100 cm) in fish ponds, our result is lower than previous research of 95-454 MgC ha-1 [7, 9, 21]. It also confirms that the depth of the soil layer affects the amount of soil C stock [22].
The soil mineral content founded that is almost similar in value to each Trimulyo coastal land use. It also shows that on each water column in the region having the same potential in storing OC. Although in fact the soil mineral content may be affected by the type of mangrove standing on it [23]. The presence of soil minerals is related to the sediment capacity in storing
Figure 3. Soil C-stock distribution of spatial map in the research site in Trimulyo village, Genuk District, Semarang City
Figure 2. Soil C-stocks in the research site
https://doi.org/10.1051/e3sconf/2018730 , 0 (2018)E3S Web of Conferences 73ICENIS 2018
300 30066
4
OC [24]. The amount of OC in the sediment is affected by the depth of the soil layer, the type and age of the standing on it [25, 26]. The study also showed that OC has a significant association with BD, salinity and pH, similar to the study [27, 28]. The distribution of OC in the study site generally shows a decrease in concentration towards the sea [29].
The distribution of spatial map of the soil C-stocks in Trimulyo region shows in Figure 2. Generally, the predicted map showed lower soil C-stocks in the river mouth and higher concentrate in the mangrove vegetations of the research site. This difference is possible because of the influence of climate (tidal), macrobentos and antropogenic activity affecting the amount of soil carbon stock in top soil layer [21, 30]. In mangrove vegetation with mixed plant species showed higher carbon stock value compared to other mangrove sites. Similarly, planted mixed mangrove species for both restoration activities and increased carbon sequestration in sediments [31].
There is no significant difference between of soil C-stocks in vegetation and non-vegetation mangroves land uses. It shows that the water column on the coast of Trimulyo has great potential as a carbon store. Damage to mangrove ecosystems and land conversion may result in soil C emissions of 57% [7]. Reforestation activities with mangrove planting in Trimulyo should also consider species variations to increase the carbon sequestration potential.
5. Conclusion
In this research to estimate and compare soil C-stocks in vegetation and non-vegetation mangrove (represented by aquaculture ponds and mudflats) and to modelling distribution of spatial of soil C-stocks in the mangrove community in Trimulyo, recorded soil C stock values in mangrove vegetation (79.6 MgC ha-1) was greater than non-vegetation mangroves (68.93 MgC ha-
1). The distribution of spatial map of the soil C-stocks in the research site is described lower soil C-stocks in the river mouth and higher concentrate in the mangrove vegetations.
Water column in coastal area is known to have great potential as carbon sink, especially in mangrove vegetation. The finding on this research can be used as a consideration for reducing carbon emissions through developing low carbon society. We recommend the protection of coastal water columns both physically and naturally, mangrove planting and protection, strengthening regulations, increasing the capacity of stakeholders, and the cooperation of all stakeholders.
References 1. O. J. Eong, Chemosphere, 27, 1097–1107 (1993) 2. D. C. Donato, J. B. Kauffman, D. Murdiyarso, S.
Kurnianto, M. Stidham, and M. Kanninen, Nat. Geosci., 4, 293–297 (2011)
3. J. Bournazel, M. P. Kumara, L. P. Jayatissa, K. Viergever, V. Morel, and M. Huxham, Ocean Coast. Manag., 113, 18–28 (2015)
4. J. H. Primavera, Aquac. Res., 28, 815–827 (1997) 5. D. M. Alongi and S. K. Mukhopadhyay, Agric. For.
Meteorol., 213, 266–272 (2015) 6. T. B. Atwood et al., Nat. Clim. Chang., 7, 523-528
(2017) 7. J. Alan, A. Castillo, A. A. Apan, T. Narayan, and S.
G. S. Iii, Geoderma, 293, 82–90 (2017) 8. M. F. Adame, N. S. Santini, C. Tovilla, L. Castro,
and M. Guevara, 12, 3805–3818 (2015) 9. J. B. Kauffman, C. Heider, J. Norfolk, and F.
Payton, Ecol. Appl., 24, 518–527 (2014) 10. M. I. Brown, T. Pearce, J. Leon, R. Sidle, and R.
Wilson, Appl. Geogr., 94, 71–83 (2018) 11. G. Chen, M. Gao, B. Pang, S. Chen, and Y. Ye,
For. Ecol. Manage., 422, 87–94 (2018) 12. G. Wang, D. Guan, M. R. Peart, Y. Chen, and Y.
Peng, For. Ecol. Manage., 310, 539–546 (2013) 13. R. Hartati, R. Pribadi, R. W. Astuti, R. Yesiana,
and I. Y. H, J. Kelaut. Trop., 19, 95–100 (2016) 14. R. R. Ahmad and M. Fuad, Vulnerability
Assessment of Mangrove Habitat to the Variables of the Oceanography Using CVI Method (Coastal Vulnerability Index) in Trimulyo Mangrove Area, Genuk District, Semarang, E3S Web of Conferences, 31, (2018)
15. M. Hairiah, K. Dewi, S. Agus, F. Velarde, S. Ekadinata, A. Rahayu, S. Noordwijk, Measuring Carbon Stocks: Across Land Use Systems (Bogor, Indonesia: World Agroforestry Center (ICRAF), SEA Regional Office, 2011)
16. J. Kauffman and D. Donato, Protocols for the measurement, monitoring and reporting of structure, biomass and carbon stocks in mangrove forests (CIFOR, Bogor, Indonesia, 2012)
17. M. Lugina, K. Ginoga, A. Wibowo, A. Bainnaura, and T. Partiani, Standard Operating Procedures (SOP) for Measurement of Carbon Stock in Conservation Areas (Center for Climate Change Research and Development and Policy, Agency for Forestry Research and Development Bogor, Indonesia, 2011)
18. M. Adame et al., PLoS One, 8, 1–13 (2013) 19. F. Park and M. Delta, For. Ecol. Manage., 380,
31–40 (2016) 20. P. Van Hieu, L. V. Dung, N. T. Tue, and K. Omori,
Reg. Stud. Mar. Sci., 14, 43-52 (2017) 21. A. G. DelVecchia, J. F. Bruno, L. Benninger, M.
Alperin, O. Banerjee, and J. de Dios Morales, PeerJ, 2, 1–18 (2014)
22. E. G. Jobbágy and R. B. Jackson, Ecol. Appl., 10, 423–436 (2000)
23. M. M. P. Tognella, M. L. G. Soares, E. Cuevas, and E. Medina, 76, 994–1003 (2016)
https://doi.org/10.1051/e3sconf/2018730 , 0 (2018)E3S Web of Conferences 73ICENIS 2018
300 30066
5
24. P. Pardon et al., Agric. Ecosyst. Environ., 247, 98–
111 (2017) 25. G. Chen, M. Gao, B. Pang, S. Chen, and Y. Ye,
For. Ecol. Manage., 422, 87–94 (2018) 26. T. O. Ferreira, X. L. Otero, V. S. de Souza Junior,
P. Vidal-Torrado, F. Macías, and L. P. Firme, J. Soils Sediments, 10, 995–1006 (2010)
27. N. Matsui, W. Meepol, and J. Chukwamdee, Mar. Sci. Eng., 3, 1404–1424 (2015)
28. L. E. Urrego, E. C. Molina, and J. a. Suárez, Aquat. Bot., 114, 42–49 (2014)
29. J. F. Machiwa, Ambio, 27, 740–744 (1998) 30. A. Andreetta, M. Fusi, I. Cameldi, F. Cimò, S.
Carnicelli, and S. Cannicci, J. Sea Res., 85, 524–
533 (2014) 31. L. Chen et al., For. Ecol. Manage., 284, 222–229
(2012)
https://doi.org/10.1051/e3sconf/2018730 , 0 (2018)E3S Web of Conferences 73ICENIS 2018
300 30066
6