Embed Size (px)
Citation preview
Critical Assessment of the Delta Smelt Population!in the San Francisco Estuary, California
William A. Bennett!John Muir Institute of the Environment, Bodega Marine Laboratory!University of California, [email protected]
ABSTRACT
The delta smelt (Hypomesus transpacificus) is a small and relatively obscure fish that has recently risen to become a major focus of environmental concern in California. It was formally abundant in the low-salinity and freshwater habitats of the northeastern San Francisco Estuary, but is now listed as threatened under the Federal and California State Endangered Species Acts. In the decade following the listings scientific understanding has increased substantially, yet several key aspects of its biology and ecological relationships within the highly urbanized estuary remain uncertain. A key area of con-troversy centers on impacts to delta smelt associated with exporting large volumes of freshwater from the estuary to supply California’s significant agricultural and urban water demands. The lack of appro-priate data, however, impedes efforts to resolve these issues and develop sound management and restoration alternatives.
Delta smelt has an unusual life history strategy relative to many fishes. Some aspects of its biology are similar to other coastal fishes, particularly salmonids. Smelts in the genus, Hypomesus, occur through-out the Pacific Rim, have variable life history strategies, and are able to adapt rapidly to local environ-ments. By comparison, delta smelt has a tiny geographic range being confined to a thin margin of low salinity habitat in the estuary. It primarily lives only a year, has relatively low fecundity, and pelagic lar-vae; life history attributes that are unusual when compared with many fishes worldwide. A small pro-portion of delta smelt lives two years. These individuals are relatively highly fecund but are so few in number that their reproductive contribution only may be of benefit to the population after years of extremely poor spawning success and survival. Provisioning of reproductive effort by these older fish may reflect a bet-hedging tactic to insure population persistence.
Overall, the population persists by maximizing growth, survival, and reproductive success on an annual basis despite an array of limiting factors that can occur at specific times and locations. Variabil-ity in spawning success and larval survival is induced by climate and other environmental and anthro-pogenic factors that operate between winter and mid-summer. However, spawning microhabitats with egg deposition have not been discovered. Spawning success appears to be timed to lunar periods within a water temperature range of about 15 to 20°C. Longer spawning seasons in cooler years can produce more cohorts and on average higher numbers of adult delta smelt. Cohorts spaced in time have different probabilities of encountering various sources of mortality, including entrainment in fresh-water export operations, pulses of toxic pesticides, food shortages and predation by exotic species. Density dependence may provide an upper limit on the numbers of juvenile delta smelt surviving to the adult stage. This may occur during late summer in years when juvenile abundance is high relative to habitat carrying capacity. Factors defining the carrying capacity for juvenile delta smelt are unknown, but may include a shrinking volume of physically suitable habitat combined with a high density of com-peting planktivorous fishes during late summer and fall.
Understanding the relative importance of anthropogenic effects on the population can be improved through better estimates of abundance and measurements of potentially limiting processes. There is little information on losses of larval delta smelt (<20 mm fork length, FL) to the export facilities. Use of a population model suggests that water export operations can impact the abundance of post-larval (about 20 mm FL) delta smelt, but these effects may not reflect on adult abundance due to other pro-cesses operating in the intervening period. Effects from changes to the estuarine food web by exotic species and toxic chemicals occur but measuring their influence on population abundance is difficult.
Although delta smelt recently performed well enough to meet the current restoration criteria, analyses presented here suggest that there is still a high probability that the population will decline in the near future; the most recent abundance index (2004) is the lowest on record. Overall, the limited distribu-tion, short life span and low reproductive capacity, as well as relatively strict physical and feeding requirements, are indications that delta smelt is at risk to catastrophe in a fluctuating environment. Unfortunately, options for avoiding potential declines through management and restoration are cur-rently limited by large gaps in knowledge. Monitoring of spring water temperatures, however, may pro-vide a useful tool for determining when to reduce entrainment in water export facilities. Actions that target carrying capacity may ultimately provide the most benefit, but it is not clear how that can be achieved given the current state of knowledge, and the limited tools available for restoration. Overall, a better understanding of the life history, habitat requirements, and limiting factors will be essential for developing tools for management and restoration. Therefore, given the implications for managing Cal-ifornia water supply and the current state of population abundance, a good investment would be to fill the critical data gaps outlined here through a comprehensive program of research.
KEYWORDS
San Francisco Estuary, California, endangered fishes, Hypomesus, fish ecology, life history strategies, ecotoxicology, water management, non-native invasive species, stage-structured population models, population viability analysis
INTRODUCTION
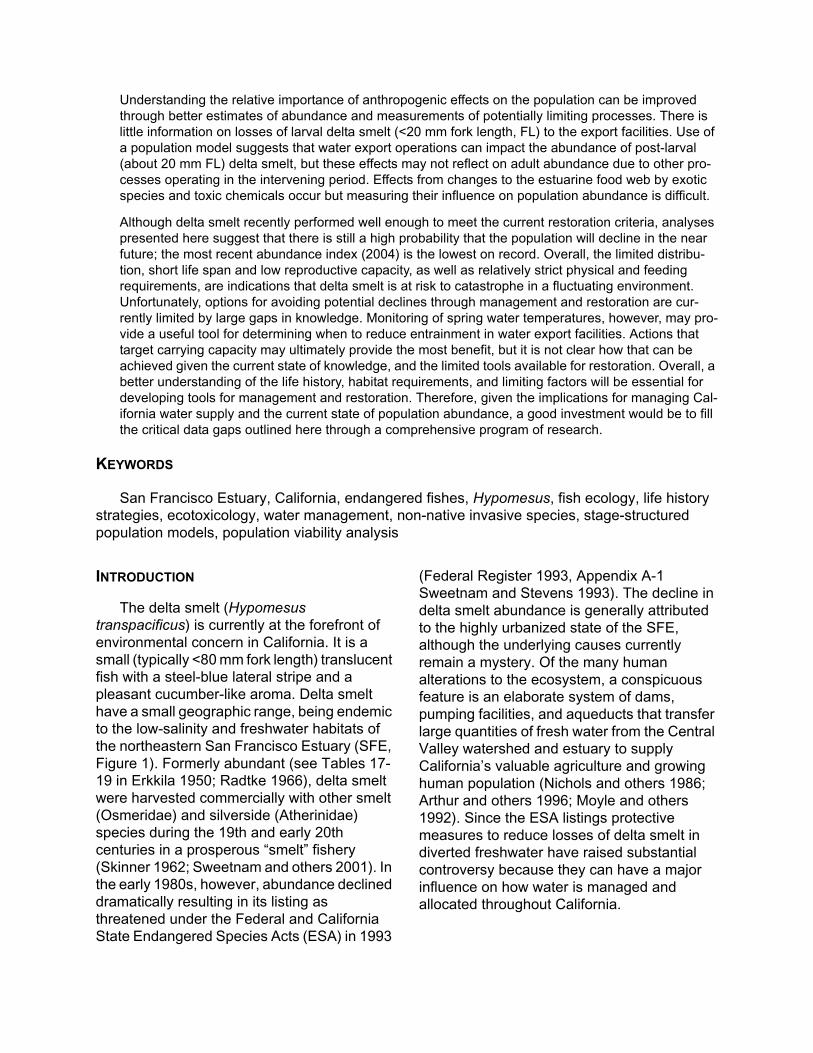
The delta smelt (Hypomesus transpacificus) is currently at the forefront of environmental concern in California. It is a small (typically <80 mm fork length) translucent fish with a steel-blue lateral stripe and a pleasant cucumber-like aroma. Delta smelt have a small geographic range, being endemic to the low-salinity and freshwater habitats of the northeastern San Francisco Estuary (SFE, Figure 1). Formerly abundant (see Tables 17-19 in Erkkila 1950; Radtke 1966), delta smelt were harvested commercially with other smelt (Osmeridae) and silverside (Atherinidae) species during the 19th and early 20th centuries in a prosperous “smelt” fishery (Skinner 1962; Sweetnam and others 2001). In the early 1980s, however, abundance declined dramatically resulting in its listing as threatened under the Federal and California State Endangered Species Acts (ESA) in 1993
(Federal Register 1993, Appendix A-1 Sweetnam and Stevens 1993). The decline in delta smelt abundance is generally attributed to the highly urbanized state of the SFE, although the underlying causes currently remain a mystery. Of the many human alterations to the ecosystem, a conspicuous feature is an elaborate system of dams, pumping facilities, and aqueducts that transfer large quantities of fresh water from the Central Valley watershed and estuary to supply California’s valuable agriculture and growing human population (Nichols and others 1986; Arthur and others 1996; Moyle and others 1992). Since the ESA listings protective measures to reduce losses of delta smelt in diverted freshwater have raised substantial controversy because they can have a major influence on how water is managed and allocated throughout California.
Figure 1. Known distribution of Hypomesus throughout the Pacific Rim. Six species are currently recognized including wakasagi (H. nipponensus, red shading), chishima wakasagi or Kunashir smelt (H. chishimaensis, green shading), ishikariwakasagi or pond smelt (H. olidus, blue shading), chika or silver smelt (H. japonicus, purple shading), and surf smelt (H. pretiosus, cyan shading). Inset displays the distribution of delta smelt (H. transpacificus, yellow shading) and the Delta (dotted oval) in the San Francisco Estuary.
New information on delta smelt has increased substantially since the ESA listing. Aspects of their biology and ecology were first compiled by Moyle (1976; Moyle and others 1992) and then by the resource management
agencies (Stevens and others 1990; Sweetnam and Stevens 1993; DWR–USBR 1993; Sweetnam 1999). Since then much has been learned about delta smelt biology and ecology, prompting the need for
3
Bennett: Critical assessment of the delta smelt population
Produced by eScholarship Repository
comprehensive synthesis. Even with this new information, three fundamental questions remain:
1. Should the species continue to be listed under the ESA, or, what is the probability of extinction?
2. What is the impact of human activities, particularly water export operations, on population abundance?
3. Are there potential avenues for resto-ration and recovery?
My primary objective is to review and synthesize what is known about delta smelt, and to provide an ecological foundation for addressing the above questions. However, little is known and published about delta smelt relative to other fishes in the SFE. As a result, I rely heavily on grey literature, pre-published results and personal communications, as well as extensive analysis of unpublished data. Synthesis of this information raises a variety of questions and key uncertainties rather than conclusive statements regarding delta smelt ecology. Thus, the current state of knowledge will hopefully evolve rapidly as a result of this work. The paper is organized into sections describing delta smelt biology and natural history, factors influencing annual abundance, and implications for restoration. Finally, major uncertainties impeding progress in answering the above questions are summarized as key issues for future research. Overall, this synthesis indicates that significant advances have been made in understanding delta smelt, however, the current level of this knowledge and research effort is fragmented. Delta smelt is a fish species unique to the SFE. Therefore, to develop a solid understanding of human activities and natural perturbations on the population will require a significant and coordinated research effort to develop fundamental aspects of its population ecology. This knowledge will be essential for future management actions and the development and evaluation of sound restoration alternatives.
POPULATION ABUNDANCE
Limited understanding of delta smelt abundance over time remains the most critical obstacle to effective management and restoration. Most of what we know is derived from long-term sampling programs conducted by the Interagency Ecological Program for the San Francisco Estuary (IEP). At least eight such surveys regularly collect delta smelt during routine sampling, providing extremely valuable sources of long-term information. Detailed descriptions and methodology are well described elsewhere (Stevens and others 1990; Herbold and others 1992; Moyle and others 1992; DWR–USBR 1993) and key aspects are shown in Table 1. The surveys vary considerably in sampling methodology, the life stage they collect, spatiotemporal coverage, as well as calculations used to construct indices of abundance (Table 1), but all show a dramatic decline in delta smelt in the early 1980s that eventually prompted the ESA listings (Figure 2). The majority of sampling surveys employ some type of net, however, estimates of fish entrained in water export flows also provide an extensive time series for individuals over about 20 mm in length. Although such “sampling” is fixed at the south Delta export facilities, annual trends in fish entrained also indicate a decline in the population during the early 1980s (Figure 2F). Therefore, trends in the population are well represented by all sampling gears and life stages of delta smelt.
The trustworthiness of the abundance indices is essential for understanding the population ecology and appropriate ESA status of delta smelt. In this review I focus primarily on data from four surveys; the catch data from two are compiled into abundance indices. The Summer Tow-Net Survey (TNS, Figure 2C) samples primarily the juvenile life stage during July and August, whereas the Fall Midwater Trawl Survey (MWT, Figure 2A) collects primarily pre-adults from September through December (Table 1). Although these monitoring programs were initially devised for
4
San Francisco Estuary and Watershed Science Vol. 3, Iss. 2 [September 2005], Art. 1
http://repositories.cdlib.org/jmie/sfews/vol3/iss2/art1

sampling young striped bass (Morone saxatilis), they provide the most extensive spatiotemporal records for delta smelt. From these surveys, abundance indices are calculated for juveniles (TNS) and pre-adults (MWT) by extrapolating the numbers of fish caught at 30 to 80 fixed stations using a weighting factor that accounts for differences in water volume in various sub-regions from San Pablo Bay through the Delta. Temporally, stations are sampled at roughly bi-weekly intervals throughout the summer and fall months (Table 1). A subset of stations and months sampled in the MWT survey are also used to calculate the Recovery Index: the measure of delta smelt performance used in the original ESA recovery criteria (Figure 2B, Moyle and others 1996). I also examine data from the 20-mm Survey that has been sampling larvae and post-larvae (defined on page 16) during spring (April–June) since 1995, and the Spring Kodiak Trawl survey that
has sampled adults during the spawning season (March–June) since 2002. These are the only two surveys designed specifically for sampling delta smelt.
Moderate increases in the Recovery Index from 1998–2002 (Figure 2A, B) were sufficient to satisfy the original recovery criteria (Moyle and others 1996). However, these criteria were developed at a time when little was known about the biology or ecology of delta smelt. Thus, following the apparent recovery, the ESA listing of delta smelt was challenged by stakeholder groups, leading to a formal revision of the Biological Opinion (http://sacramento.fws.gov/ea/news_releases/2004%20News%20Releases/Delta_Smelt_OCAP_NR.htm) undertaken in a collaborative effort by the U.S. Fish and Wildlife Service (USFWS), U.S. Bureau of Reclamation (USBR), NOAA Fisheries Service, California Department of Water
Table 1. Key aspects of monitoring surveys that sample delta smelt in the San Francisco Estuary
Survey / Gear Type
(Institutiona)
a. All monitoring surveys are coordinated under the cooperative Interagency Ecological Program (IEP) for the San Francisco Estuary. California Department of Fish and Game (DFG); University of California, Davis (UCD); California Department of Water Resources (DWR); U.S. Bureau of Reclamation (USBR); U.S. Fish and Wildlife Service (USFWS).
YearMonths (Frequency) Locations (Stations) Life Stages
Fall Midwater Trawl!(MWT, DFG)
1967-present
September–March (monthly) San Pablo Bay–Delta (53–113) Juvenile–adult
Summer Tow-Net!(TNS, DFG)
1959-present
June–August!(bi-weekly) Suisun Bay–Delta (~30) Juvenile–adult
20-mm Tow-Net!(DFG)
1995-present
March–June!(bi-weekly) Napa River–Delta (~30) Larvae–juvenile
Spring Kodiak Trawl!(DFG)
2002-present
March–May!(~bi-weekly) Suisun Bay–Delta (30–40)
Maturing–spawning
Bay Study Midwater Trawl (DFG)
1980-present
January–December!(monthly)
So. San Francisco Bay–Suisun Bay (42) Juvenile–adult
Otter Trawl!(UCD)
1979-present
January–December!(monthly) Suisun Marsh (~18) Juvenile–adult
SWP / CVP Water Projects (DWR, USBR)
1979-present
January–December!(daily) South Delta near Tracy (2)
20-mm post larvae–adult
Midwater Trawl!(USFWS)
1976-present
April–June!(~dailly) Chipps Island (1) Juvenile–adult
Beach Seine!(USFWS)
1977-present
~January–June!(~bi-weekly) Delta–Sacramento River (23) Juvenile–adult
5
Bennett: Critical assessment of the delta smelt population
Produced by eScholarship Repository

Figure 2. Indices of abundance from five monitoring programs that regularly collect delta smelt including the Fall Midwater Trawl Survey (MWT) (A), the delta smelt Recovery Criteria Index based on a subset of MWT samples (B), the Summer Tow-Net Survey (TNS) (C), the Bay Study Midwater Trawl Survey that collects age-0 and age-1 fish (D), the UC Davis Suisun Marsh Survey (E), and fish entrainment monitoring at the Federal Central Valley Project (CVP) and California State Water Project (SWP) facilities. These and other surveys that intermittently collect delta smelt are summarized in Table 1.
60 70 80 90 000.0
0.2
0.4
0.6
Cat
ch p
er t
raw
l
60 70 80 90 000
450
900
1350
1800
FE
DC
B
A
bu
nd
ance
ind
ex A
60 70 80 90 000
20
40
60
Ab
un
dan
ce in
dex
60 70 80 90 000
200
400
600
Rec
ove
ry in
dex
60 70 80 90 000
1700
3400
5100
Ab
un
dan
ce in
dex
Age 0 Age 1
60 70 80 90 000
30
60
90
120
Years
Den
sity
(m
3 10-6
) SWP CVP
6
San Francisco Estuary and Watershed Science Vol. 3, Iss. 2 [September 2005], Art. 1
http://repositories.cdlib.org/jmie/sfews/vol3/iss2/art1
Resources (DWR), and the California Department of Fish and Game (DFG). The opinion concluded that the status of population abundance and poor understanding of limiting factors still justified the listing of delta smelt as a threatened species. During this process the population experienced three consecutive years of low abundance, including the lowest ever recorded in the indices (MWT = 74, in 2004).
Recently, the sampling design, methodology, and calculations used to develop the TNS and MWT abundance indices have been called into serious question by scientists and stakeholders. The fundamental limitation with these abundance indices is that they are dimensionless numbers, thus it is unclear what any particular index means in terms of population abundance. In addition, there is no way to compare among life stages (i.e. TNS and MWT indices) to examine population vital rates (e.g. mortality), or to measure the variation in abundance estimated by each index. Therefore, it is unclear how well one year compares with a previous year. Although these problems have been recognized before, using the indices to reflect abundance has persisted in part because of several logistical problems with applying conventional abundance estimation methodologies to the extremely fragile delta smelt (Herbold 1996).
There is also little confidence in the effectiveness of the sampling gears used in the various surveys. For instance, Kodiak trawls tow a net between two vessels sampling the top half of the water column. They consistently appear to out-fish (in terms of catch per unit volume sampled) the traditional midwater trawls that tow a net directly behind a single craft. However, this knowledge is based on only personal observations, two sampling days, and 12 concurrent samples in September 1994 (Sweetnam 1994). All sampling gear used also have a size-selection bias. In another pilot study, the effectiveness of the standard MWT net (12.7-mm mesh) was examined by covering it with a 3.2-mm mesh net, that retained fish passing through the
larger mesh (Sweetnam and Stevens 1993). In August 1991, the standard MWT net was only about 30% effective for delta smelt and 80% for striped bass, whereas in January 1992, effectiveness improved to about 55% for delta smelt and 100% for striped bass presumably because the fishes had grown larger (Sweetnam and Stevens 1993). Although preliminary, the study suggests that estimates of abundance based on catch alone in the MWT would be highly biased, and overall points to considerable uncertainty underlying the effectiveness of sampling gears used for delta smelt. Resolving these biases, however, will require a considerable effort (Miller 2000; Brown and Kimmerer 2002). Nonetheless, developing an abundance estimate and addressing sampling effectiveness will be crucial for improving our understanding of the population status, as well as the limitations on delta smelt abundance.
To address the need for more quantitative abundance estimates and facilitate synthesis of the available information, I estimated delta smelt abundance using the methodology developed by Kimmerer and others (2000, 2001) for young striped bass. Essentially, abundance estimates for delta smelt in the TNS, MWT, and 20-mm (post-larvae) surveys were calculated by dividing the raw catch of delta smelt at each station by the estimated volumes of water sampled, using an overall mean of 865 m3 for the 20-mm Survey, 700 m3 for the Summer Tow-Net Survey, and 7,000 m3 for the Fall Midwater Trawl Survey. These estimates were then weighted by the total volume of the delta smelt habitat including Suisun Bay and the Delta. Volume estimates were compiled using bathymetric information developed by the U.S. Geological Survey (http://sfbay.wr.usgs.gov/access/Bathy/index.html). The “first-order” abundance estimates and 95% confidence limits derived by this method (Figure 3) are based on the unrealistic assumption that delta smelt occupy a constant volume of habitat at different life stages and among years, and do not account for size-selectivity by the sampling gears. However, because they are based on the raw
7
Bennett: Critical assessment of the delta smelt population
Produced by eScholarship Repository
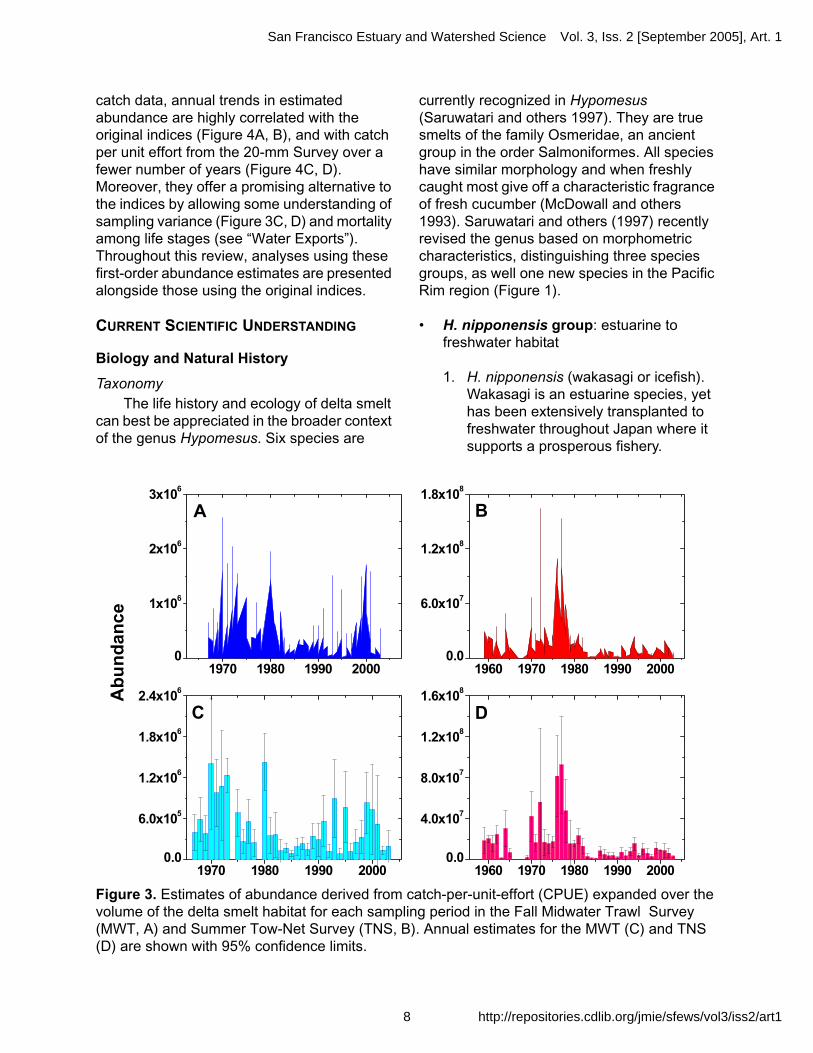
catch data, annual trends in estimated abundance are highly correlated with the original indices (Figure 4A, B), and with catch per unit effort from the 20-mm Survey over a fewer number of years (Figure 4C, D). Moreover, they offer a promising alternative to the indices by allowing some understanding of sampling variance (Figure 3C, D) and mortality among life stages (see “Water Exports”). Throughout this review, analyses using these first-order abundance estimates are presented alongside those using the original indices.
CURRENT SCIENTIFIC UNDERSTANDING
Biology and Natural History
Taxonomy The life history and ecology of delta smelt
can best be appreciated in the broader context of the genus Hypomesus. Six species are
currently recognized in Hypomesus (Saruwatari and others 1997). They are true smelts of the family Osmeridae, an ancient group in the order Salmoniformes. All species have similar morphology and when freshly caught most give off a characteristic fragrance of fresh cucumber (McDowall and others 1993). Saruwatari and others (1997) recently revised the genus based on morphometric characteristics, distinguishing three species groups, as well one new species in the Pacific Rim region (Figure 1).
• H. nipponensis group: estuarine to freshwater habitat
1. H. nipponensis (wakasagi or icefish). Wakasagi is an estuarine species, yet has been extensively transplanted to freshwater throughout Japan where it supports a prosperous fishery.
Figure 3. Estimates of abundance derived from catch-per-unit-effort (CPUE) expanded over the volume of the delta smelt habitat for each sampling period in the Fall Midwater Trawl Survey (MWT, A) and Summer Tow-Net Survey (TNS, B). Annual estimates for the MWT (C) and TNS (D) are shown with 95% confidence limits.
1970 1980 1990 20000
1x10⁶
2x10⁶
3x10⁶
1970 1980 1990 20000.0
6.0x10⁵
1.2x10⁶
1.8x10⁶
2.4x10⁶
1960 1970 1980 1990 20000.0
4.0x10⁷
8.0x10⁷
1.2x10⁸
1.6x10⁸
1960 1970 1980 1990 20000.0
6.0x10⁷
1.2x10⁸
1.8x10⁸
DC
B
A
Ab
un
dan
ce
8
San Francisco Estuary and Watershed Science Vol. 3, Iss. 2 [September 2005], Art. 1
http://repositories.cdlib.org/jmie/sfews/vol3/iss2/art1
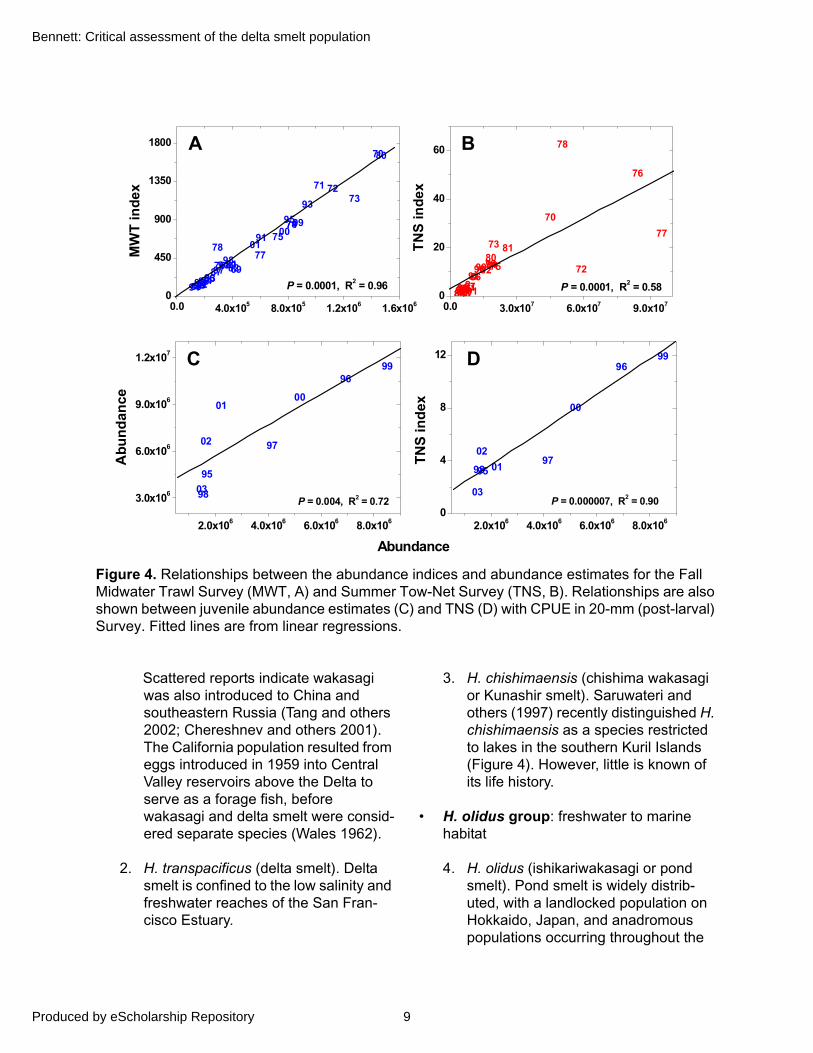
Figure 4. Relationships between the abundance indices and abundance estimates for the Fall Midwater Trawl Survey (MWT, A) and Summer Tow-Net Survey (TNS, B). Relationships are also shown between juvenile abundance estimates (C) and TNS (D) with CPUE in 20-mm (post-larval) Survey. Fitted lines are from linear regressions.
Scattered reports indicate wakasagi was also introduced to China and southeastern Russia (Tang and others 2002; Chereshnev and others 2001). The California population resulted from eggs introduced in 1959 into Central Valley reservoirs above the Delta to serve as a forage fish, before wakasagi and delta smelt were consid-ered separate species (Wales 1962).
2. H. transpacificus (delta smelt). Delta smelt is confined to the low salinity and freshwater reaches of the San Fran-cisco Estuary.
3. H. chishimaensis (chishima wakasagi or Kunashir smelt). Saruwateri and others (1997) recently distinguished H. chishimaensis as a species restricted to lakes in the southern Kuril Islands (Figure 4). However, little is known of its life history.
• H. olidus group: freshwater to marine habitat
4. H. olidus (ishikariwakasagi or pond smelt). Pond smelt is widely distrib-uted, with a landlocked population on Hokkaido, Japan, and anadromous populations occurring throughout the
69
70
71 72
73
7475
76
77
78
7980
81
82
838485
86
87888990919293
94
95
96
9798
99012
3
69
70
71 7273
7475
7677
78
79
80
8182
838485
8687
88
8990
91
92
93
94
95
96
9798
9900
01
0203
0.0 3.0x10⁷ 6.0x10⁷ 9.0x1070
20
40
60
P = 0.0001, R2 = 0.58
TN
S in
dex
0.0 4.0x10⁵ 8.0x10⁵ 1.2x10⁶ 1.6x1060
450
900
1350
1800
P = 0.0001, R2 = 0.96
MW
T in
dex
95
96
9798
99
00
01
02
03
95
96
97
98
99
0001
02
03
2.0x10⁶ 4.0x10⁶ 6.0x10⁶ 8.0x1060
4
8
12
P = 0.000007, R2 = 0.90
TN
S in
dex
2.0x10⁶ 4.0x10⁶ 6.0x10⁶ 8.0x10⁶
3.0x10⁶
6.0x10⁶
9.0x10⁶
1.2x10⁷
P = 0.004, R2 = 0.72
Ab
un
dan
ce
Abundance
A B
C D
9
Bennett: Critical assessment of the delta smelt population
Produced by eScholarship Repository

Pacific Rim to Alaska and the Yukon River (Platts and Millard 1995).
• H. japonicus group: marine to estuarine habitat
5. H. japonicus (chika or silver smelt). H. japonicus occurs in the coastal ocean and bays off Japan, as well as estuaries and rivers entering the Sea of Okhotsk and Bering Sea in south-eastern Russia (Chereshnev and oth-ers 2001).
6. H. pretiosus (surf smelt). Surf smelt is common along the western coast of North America, supporting important fisheries from the Alaskan Peninsula south to about Long Beach, California. Surf smelt is caught infrequently in the fish monitoring surveys in the SFE.
The similar morphology and variable life-history strategies imply that Hypomesus species can adapt rapidly to local environments. Wakasagi, by far the most thoroughly studied species, occurs with genetically distinct sub-populations and several life-history strategies throughout Japan (Katayama and others 2001). Most wakasagi are annuals with a few individuals living two years (Katayama and Kawasaki 1994). Coastal lakes often harbor a small resident form coexisting with a large, genetically indistinguishable, anadromous form that migrates to the ocean and then returns to spawn (Katayama and others 1998, 2000, 2001; Kudo and Mizuguchi 2000). Similar population substructure and life history variability is widespread among other smelts, salmonids and sticklebacks (Hutchings and Morris 1985; Snyder 1991; Mingelbier and others 2001).
The prevalence of life-history variability in Hypomesus and recent genetic information suggest delta smelt may have evolved from a group of surf smelt that became isolated as the SFE was forming over the past 8,000 years. Delta smelt, however, was not officially
recognized as a distinct species in the U.S. until 1970 (Moyle 1976; Stanley and others 1995). It was originally considered a disjunct population of pond smelt, and then later as a subspecies of H. transpacificus, with wakasagi (McAllister 1963; Moyle 1976). Russian scientists, however, regarded delta smelt as a separate species before 1970, although their work was not appreciated until the end of the Cold War (Moyle 1976). Soon after the ESA listing their complicated taxonomic status and the recent expansion of wakasagi to the Delta prompted genetic investigations comparing delta smelt with wakasagi, surf smelt, and sympatric longfin smelt (Spirinchus thaleichthys). The genetic studies confirmed that delta smelt is a distinct species and more closely related to surf smelt than wakasagi (Stanley and others 1995; Trenham and others 1998).
Population Distribution and Fundamental Eco-logical Niche
Delta smelt occur from western San Pablo Bay east to the freshwater rivers and sloughs of the Delta (Figure 1). Previous accounts indicate they are found at 0 to about 18 practical salinity units (psu) surface salinity (Baxter and others 1999), although most are caught from about 0.2 to 2.0 psu, with older juveniles and adults being found at the higher end of that gradient (DWR–USBR 1993). Laboratory studies indicate delta smelt cannot tolerate salinities above 19 psu (Swanson and others 2000).
Cumulative distributions of salinities and water temperatures from the TNS and MWT indicate that over 70% of juvenile and 60% of pre-adult delta smelt are caught at salinities less than 2 psu, with over 90% occurring at less than 7 psu (Figure 5A). Thus, delta smelt abundance tends to be centered near or slightly upstream of 2 psu, in the entrapment, or low-salinity, zone (Bennett and others 2002). Water temperatures over about 25°C are also lethal, and can constrain delta smelt habitat especially during summer and early fall (Swanson and others 2000). Overall, the
10
San Francisco Estuary and Watershed Science Vol. 3, Iss. 2 [September 2005], Art. 1
http://repositories.cdlib.org/jmie/sfews/vol3/iss2/art1

majority of juveniles and adults in the TNS and MWT have been caught at water temperatures less than 22°C (Figure 5). Temperatures above 20°C during spring can also lead to higher mortality of newly spawned larvae (see “Spawning and Egg Stages”). Nevertheless, salinity appears to be the key environmental feature most often defining the physical scope of delta smelt habitat, or fundamental ecological niche (Hutchinson 1957).
The close association with salinity implies that distribution is determined by complex interactions among fish behavior, tidal currents, freshwater outflow, and diffusive movements rather than by geographical features per se. Thus actual distribution can fluctuate by many kilometers in a day due to tidal forcing. Similarly, while life-stages have specific seasonal and behavioral characteristics that are tied to location, overall geographical distribution can also vary dramatically in years of low versus high river discharge. In years of low discharge, delta smelt occur primarily in the lower Sacramento River and northern Delta. In contrast, high river discharge expands their distribution throughout Suisun Bay, Suisun Marsh channels, and into San Pablo Bay and the Napa River (Sweetnam 1999). They are also widely dispersed throughout Suisun Bay in moderate outflow years. Overall, however, the historical sampling record indicates they have remained several fold more abundant in northern Suisun Bay and Suisun Marsh channels than southern Suisun Bay and Delta, with the highest catches consistently occurring near Sherman Island and Decker Island in the lower Sacramento River (Figure 1, Errikla 1950; Radkte 1966; Bennett and others 2002). Thus, the highly persistent but variable size and location of the delta smelt habitat may also explain why the population appears largely panmictic, as indicated by genetic studies (Trenham and others 1998). In the past, some have attempted to distinguish between annual trends in a south Delta “population” and a north
Figure 5. Cumulative percent of delta smelt catch in relation to salinity and temperature in the Fall (pre-adult) Midwater Trawl Survey (blue line) and Summer (juvenile) Tow-Net Survey (red line). Over 90% of delta smelt are caught at salinities <6 psu, and at water temperatures <20°C.
Delta or Suisun Bay “population” (DWR–USBR 1993, Sweetnam and Stevens 1993). The high spatial lability and genetic contiguity of delta smelt indicate the futility of haphazardly subdividing the population based on geography.
Conceptual Life History Model
Information on delta smelt biology and life history is accumulating rapidly. In the following discussion a conceptual life-history model organizes this information to identify key areas of uncertainty. Delta smelt has a primarily annual life cycle with rapid growth and high mortality occurring during recruitment, defined here as survival of eggs and newly hatched fish to the next reproductive season each year. A
5 10 15 20 250
20
40
60
80
100
0 2 4 6 8 10 120
20
40
60
80
100
Water temperature (oC)
Cu
mu
lati
ve p
erce
nt
Salinity (psu)
11
Bennett: Critical assessment of the delta smelt population
Produced by eScholarship Repository

hypothetical pattern of recruitment is depicted by plotting egg mortality per female throughout the annual sequence of delta smelt life stages (Figure 6A). Recently estimated individual
growth and mortality among life stages are also shown (Figures 6B and 6C, Bennett and Hobbs, unpublished data).
Figure 6. Conceptual model of delta smelt life history. A hypothetical pattern of mortality (dark blue line) for young produced by a female is shown with the approximate life stage durations (A). Also shown is a pattern of individual growth calculated from 144 otoliths during 1999 (B), and mortality as represented by the slope of regression lines (M) among different life stages (C) (Bennett and Hobbs, in prep.).
0
400
800
1200
1600
~ 60 d. Jan - Apr
Eggs
9 - 14 d. Mar - June
Yolk-
Sac Larvae
5mm
4 - 5 d.
Feeding-
Larvae
6-15mm
25 - 30 d.May - June
Post-
Larvae
15-25 mm
25 - 40 d.June
Juveniles
25-50mm
~ 150 d. July - Nov
Adults
50-80mm Maturity
~ 60 d.Nov- Jan
Stage-Duration
A
0 100 200 300 400
105
106
107
108
109
Ab
un
dan
ce
Days from January 1st
Eggs Larvae-20mm Juveniles Adults
M = -0.014
M = -0.006
0 20 40 60 80 100
10
20
30
40
50
Bo
dy
len
gth
(m
m)
Age (days)
Yolk-sac Feeding larvae Post-larvae Juvenile
B
C
12
San Francisco Estuary and Watershed Science Vol. 3, Iss. 2 [September 2005], Art. 1
http://repositories.cdlib.org/jmie/sfews/vol3/iss2/art1

Overall, delta smelt appear to have a life history strategy that is relatively unusual. Several life history attributes such as small size and short life span classify delta smelt as “opportunistic” under the classification scheme derived by Winemiller and Rose (1992) for North American fishes, as well as in a similar version recently developed by Vila-Gispert and others (2002) that also includes fishes from Europe and South America. Other aspects of delta smelt life history, however, such as low fecundity, spawning frequency, and a protracted spawning season classify it as an “equilibrium” species (Winemiller and Rose 1992; Vila-Gispert and others 2002). Delta smelt also fit well with a distinct salmonid life history strategy (Winemiller and Rose 1992; McCann and Shuter 1997). But by comparison, delta smelt invest far less into each offspring, having pelagic larvae rather than benthic and relatively well-developed elvers produced by salmonids. Therefore, the information outlined below indicates delta smelt are a small, primarily annual species, but with a reproductive strategy more like a perennial, as well as several other very specific environmental requirements that may render the species susceptible to catastrophe in a fluctuating environment.
Spawning and Egg Stages. Delta smelt are semi-anadromous, spawning in the freshwater reaches of the SFE and primarily in the Delta (Figure 1). However, actual spawning locations are unknown and inferred from catches of very young larvae and fish as they transition from ripe or spent condition. In years of low freshwater discharge, most ripe females and yolk-sac larvae are found in the Sacramento River and particularly around Prospect Island and the Barker-Lindsey slough complex (Figure 1, 7). For example, about 75% of all yolk-sac larvae were caught in this region in 1991 (a drought year; Wang and Brown 1991). In years of high freshwater discharge spawning distribution is broader, encompassing most of the Delta, Suisun Marsh channels, and the Napa River (Sweetnam 1999). Investigations during the wet spring of 2002 placed the majority of spent
females in the Sacramento River, even though the majority of maturing fish were in Suisun Marsh (Sousa 2002). In early 2003, the majority of females appear to have been spawning around Prospect Island and the Barker-Lindsey slough complex: a pattern consistent with a dryer year scenario (Figures 1 and 7, K. Sousa, DFG, pers. comm.).
Spawning can occur from late February to June, although larvae are typically most abundant from mid-April through May. In March 2002, 89% of females examined were still maturing and were not ready to spawn (Sousa 2002). Wang (1986) first observed larvae from February to mid-July, and suggested that delta smelt may spawn at water temperatures between 7 to 15°C, whereas in aquaculture spawning is observed at temperatures between 12 to 22°C (B. Baskerville-Bridges, UCD, pers. comm., Lindberg and others 1997).
Lunar phase can also be an important cue for spawning, particularly for fish depositing eggs in tidal or intertidal habitat (Moyle and Cech 1996). For example, spawning is closely tied to lunar phases in coastal silversides (Atherinidae), most notably for grunion (Leuresthes tenuis) that spawn en-masse at night on California coastal beaches. Peak spawning in H. japonicus also occurs at night during full moons (Hirose and Kawaguchi 1998a), whereas surf smelt are reported by local fishermen to spawn on beaches at night during new moons (Bennett, pers.obs.). Spawning of delta smelt in aquaculture also occurs at night with several males attending females as they broadcast eggs on the bottom of laboratory tanks (Mager 1996; Lindberg and others 1997; Mager and others 2004).
To examine a potential lunar influence on spawning, I compared the frequency of spawning for delta smelt in aquaculture with the lunar influence on tidal velocity occurring nearby (Figure 8A). In 2000–2002, more than 75% of successful spawns (Chi-square = 33.2, df = 7, P < 0.0001) occurred on spring tides as indexed by a root-mean-square (RMS) of tidal
13
Bennett: Critical assessment of the delta smelt population
Produced by eScholarship Repository

Figure 7. Maturity status of female delta smelt from the spring Kodiak trawl survey in 2003. Graphs courtesy of K. Sousa, DFG. (See also Sousa 2002).
14
San Francisco Estuary and Watershed Science Vol. 3, Iss. 2 [September 2005], Art. 1
http://repositories.cdlib.org/jmie/sfews/vol3/iss2/art1
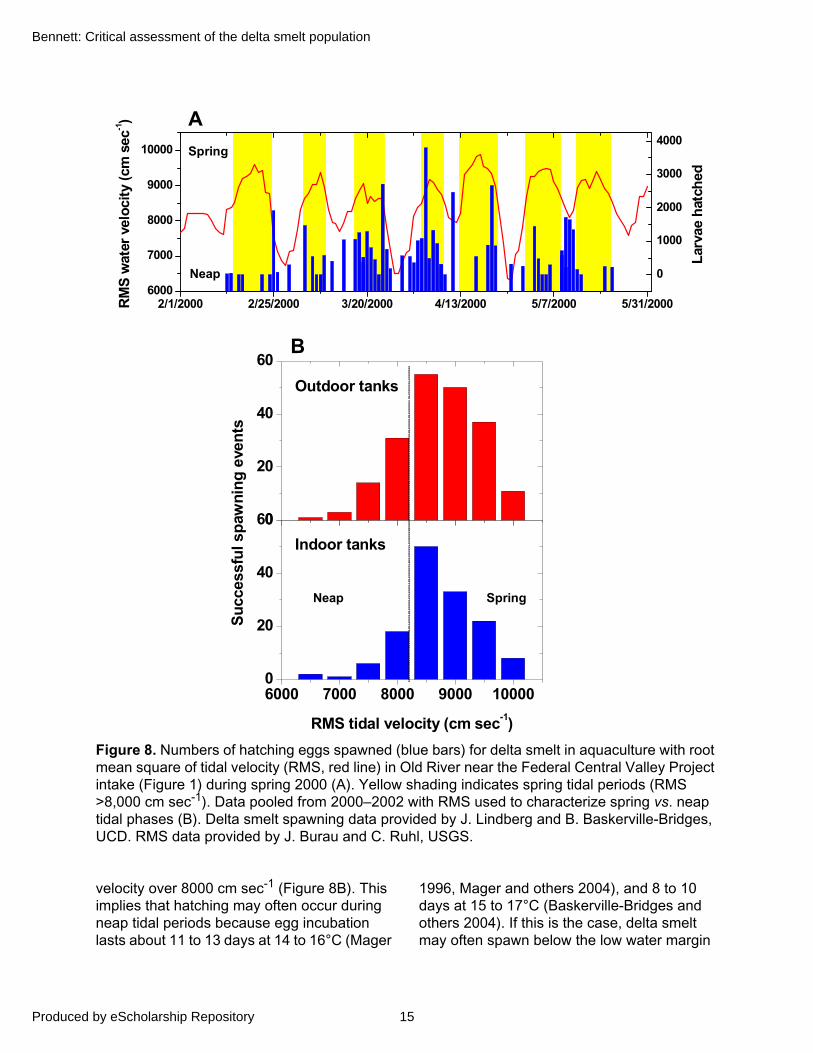
Figure 8. Numbers of hatching eggs spawned (blue bars) for delta smelt in aquaculture with root mean square of tidal velocity (RMS, red line) in Old River near the Federal Central Valley Project intake (Figure 1) during spring 2000 (A). Yellow shading indicates spring tidal periods (RMS >8,000 cm sec-1). Data pooled from 2000–2002 with RMS used to characterize spring vs. neap tidal phases (B). Delta smelt spawning data provided by J. Lindberg and B. Baskerville-Bridges, UCD. RMS data provided by J. Burau and C. Ruhl, USGS.
velocity over 8000 cm sec-1 (Figure 8B). This implies that hatching may often occur during neap tidal periods because egg incubation lasts about 11 to 13 days at 14 to 16°C (Mager
1996, Mager and others 2004), and 8 to 10 days at 15 to 17°C (Baskerville-Bridges and others 2004). If this is the case, delta smelt may often spawn below the low water margin
6000 7000 8000 9000 100000
20
40
60
Indoor tanks
RMS tidal velocity (cm sec-1)
0
20
40
60
Outdoor tanks
Su
cces
sfu
l sp
awn
ing
eve
nts
2/1/2000 2/25/2000 3/20/2000 4/13/2000 5/7/2000 5/31/20006000
7000
8000
9000
10000
RM
S w
ater
vel
oci
ty (
cm s
ec-1)
0
1000
2000
3000
4000
Lar
vae
hat
ched
A
B
Spring
Neap
SpringNeap
15
Bennett: Critical assessment of the delta smelt population
Produced by eScholarship Repository
during spring tidal phases (potentially new moon phases) to minimize stranding eggs in intertidal habitats, or because peak tidal flows provide optimal egg aeration during incubation. Hatching during periods of low tidal velocity may then reduce dispersion and help larvae to remain near spawning locations. Considering that a spring-neap tidal cue would be partially obscured in spawning tanks, lunar periodicity in spawning may be more pronounced in the wild. However, there is currently no field information to support whether lunar phase influences spawning.
Early studies suggested that females may spawn over a brief period as one-year-olds before dying (Moyle and others 1992), however, observations from aquaculture suggest a capacity to spawn twice during a season (Mager 1996; B. Baskerville-Bridges, UCD, pers. comm.). Female gonads ripen during winter and early spring. The paired gonads are asymmetric such that the left gonad is typically larger, containing about 1,000 eggs (Mager 1996). Asynchronous development of ovaries and within-season iteropary also occurs in wakasagi, as well as in
a variety of other fishes (Katayama and others 1999).
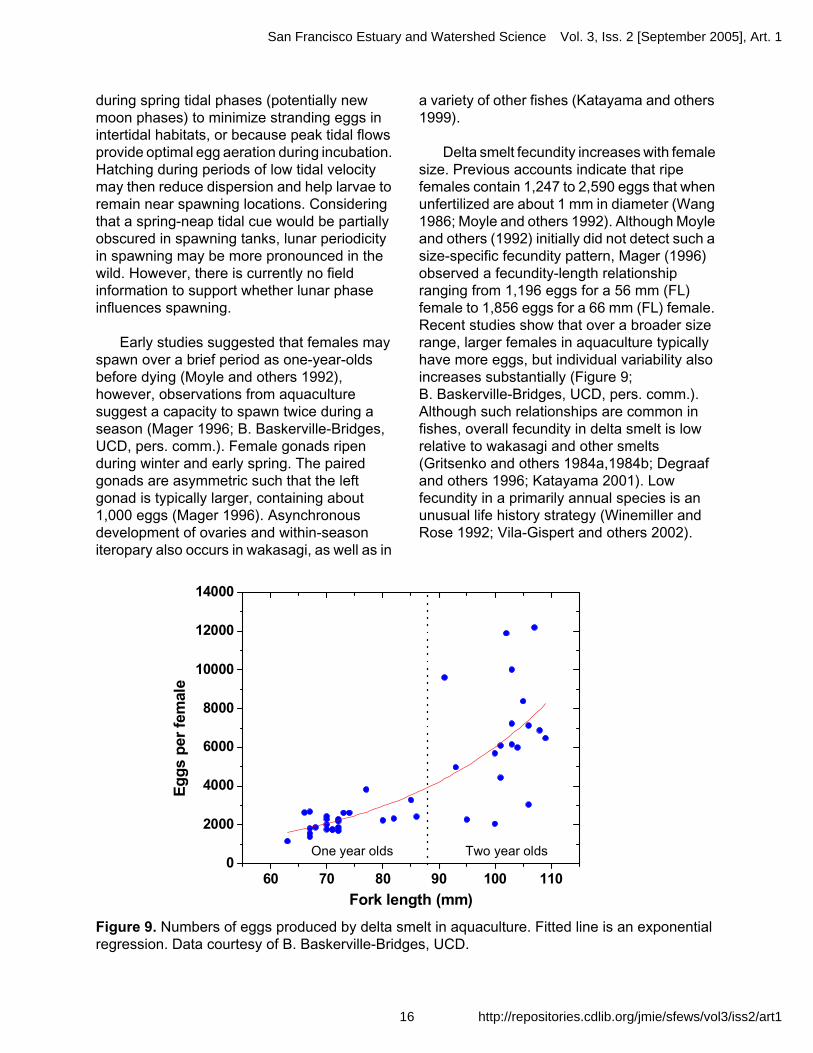
Delta smelt fecundity increases with female size. Previous accounts indicate that ripe females contain 1,247 to 2,590 eggs that when unfertilized are about 1 mm in diameter (Wang 1986; Moyle and others 1992). Although Moyle and others (1992) initially did not detect such a size-specific fecundity pattern, Mager (1996) observed a fecundity-length relationship ranging from 1,196 eggs for a 56 mm (FL) female to 1,856 eggs for a 66 mm (FL) female. Recent studies show that over a broader size range, larger females in aquaculture typically have more eggs, but individual variability also increases substantially (Figure 9; B. Baskerville-Bridges, UCD, pers. comm.). Although such relationships are common in fishes, overall fecundity in delta smelt is low relative to wakasagi and other smelts (Gritsenko and others 1984a,1984b; Degraaf and others 1996; Katayama 2001). Low fecundity in a primarily annual species is an unusual life history strategy (Winemiller and Rose 1992; Vila-Gispert and others 2002).
Figure 9. Numbers of eggs produced by delta smelt in aquaculture. Fitted line is an exponential regression. Data courtesy of B. Baskerville-Bridges, UCD.
60 70 80 90 100 1100
2000
4000
6000
8000
10000
12000
14000
Two year oldsOne year olds
Eg
gs
per
fem
ale
Fork length (mm)
16
San Francisco Estuary and Watershed Science Vol. 3, Iss. 2 [September 2005], Art. 1
http://repositories.cdlib.org/jmie/sfews/vol3/iss2/art1

The spawning microhabitat for delta smelt is unknown; eggs have not been found in the field. Laboratory observations indicate delta smelt spawn primarily at night as they swim against a slight current, broadcasting their eggs a few centimeters above the substratum (Mager 1996; Lindberg and others 1997). Spawned eggs are demersal and adhesive, attaching to substratum with an adhesive stalk formed by the outer layer (chorion) of the egg. Moyle (1976) suggested that suitable substrata are most likely submerged vegetation, rocks, or tree roots. However, Lindberg and others (1997) found few eggs attached to vertical substrata (plants, tank sides) in her studies. Recent experiments offered delta smelt six potential spawning substrata in high (8.8 cm sec-1) and low (1.4 cm sec-1) velocity flows (J. Lindberg, UCD, pers. comm.; Brown and Kimmerer 2002). In each of two trials, females deposited 84% and 54% of their eggs on gravel in high flow. Although the closely related surf smelt, wakasagi, and H. japonicus are known to select similar, primarily sandy, spawning substrata (Hirose and Kawaguchi 1998b; Katayama and others 1999), gravel beds are rare in the areas that delta smelt presumably spawn in the SFE. It will be interesting to determine whether sandy beaches such as used by most Hypomesus spp., or larger rock rubble, rip-rap, that has been used to strengthen the sides of many Delta levees also serve as viable spawning substrate. Studies such as these will be crucial for eventually defining delta smelt spawning habitat and whether it is limited in the estuary.
Fertilization and hatching success for delta smelt are highly variable and sharply defined by water temperature. From 1994–1996, fertilization success in aquaculture ranged from 21% to 40%, whereas hatching success varied from 29% to 81% (Mager 1996). Similar variability was observed by Lindberg and colleagues (1997). Recent studies show that optimal hatching success and larval survival in aquaculture occurs at 15 to 17°C (Figure 10; B. Baskerville-Bridges, UCD, pers. comm.). While incubation temperatures below 15°C have generally lower hatching success,
temperatures exceeding 20°C decrease the egg incubation period, mean hatch length, time to first-feeding, as well as larval feeding success, leading to overall higher mortality (Figure 10; B. Baskerville-Bridges, UCD, Davis, pers. comm.).
Figure 10. Influence of water temperature on proportion of larvae hatching (A), larval length at hatch (B), larval length at first-feeding (C), days to first-feeding (D), and incubation time (E) for delta smelt in aquaculture. Data courtesy of B. Baskerville-Bridges, UCD.
10 12 14 16 18 20
8
12
16
Water temperature ( oC)
Da
ys
Y= 28.1 - 1.1 X
4
6
8
Da
ys
Y = 12 - 0.4 X
5.0
5.2
5.4L
eng
th (
mm
)
Y = 5.92 - 0.05 X
6.0
6.3
6.6
E
D
C
B
Len
gth
(m
m)
Y = 7.53 - 0.08 X
0.2
0.4
0.6
0.8A
Pro
po
rtio
n
Y = -2.35 + 0.45X - 0.016X2
17
Bennett: Critical assessment of the delta smelt population
Produced by eScholarship Repository

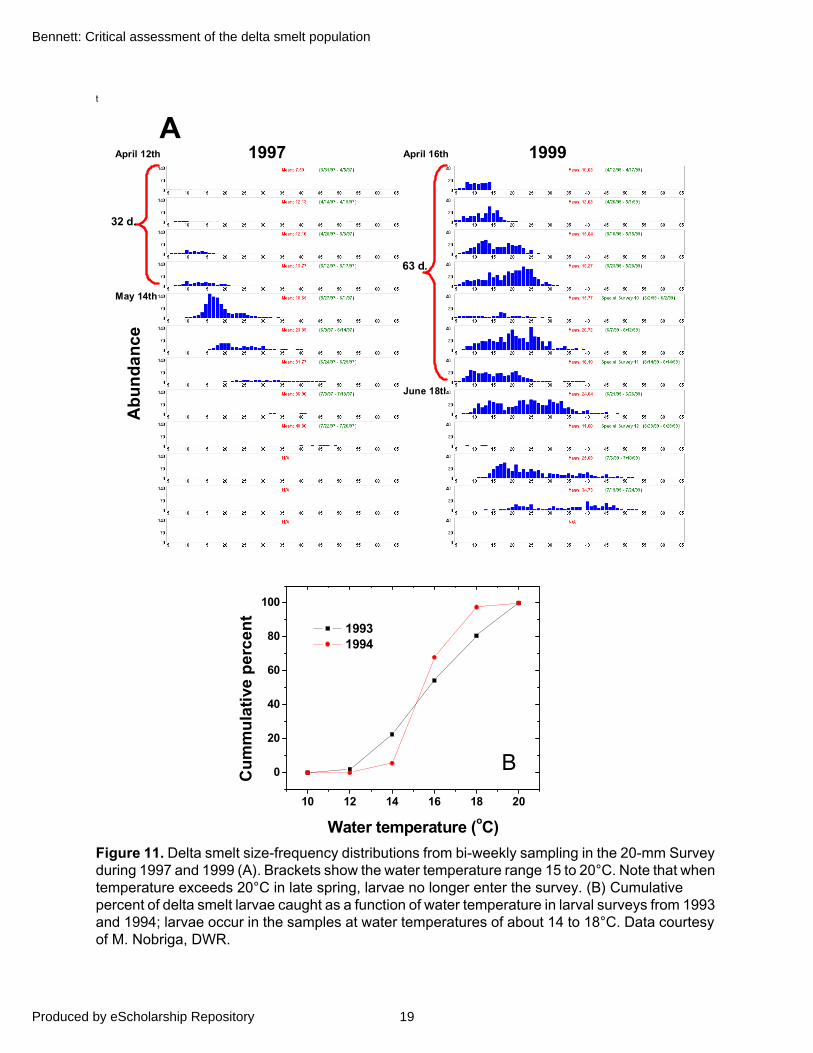
Therefore, delta smelt spawning success may be variable when temperatures fall below 15°C, but appears more sharply limited by those above 20°C. Although extrapolating from laboratory studies to field conditions can be problematic, temperatures within 15 to 20°C appear to limit the number of cohorts comprising size-frequency distributions of post-larvae (Defined in “Swim Bladder Development and Post-Larval Stage”) from the 20-mm Survey (Figure 11A). Furthermore, larval surveys during 1993–1994 suggest a similar temperature window of spawning success with a possible refinement to about 14 to 18°C (Figure 11B).
Yolk-Sac and First-Feeding Larval Development. Larvae hatch at 4.5 to 6 mm total length and are transparent with an oval-shaped yolk-sac containing an oil globule (Figure 6, Wang 1986; Wang and Brown 1991; Mager 1996; Mager and others 2004). During the next 4 to 6 days the young larvae swim continuously and are positively phototactic, remaining near the water surface in aquaria. They grow very little as they absorb the yolk sac and oil globule but develop jaw and mouth parts (Figure 6; Mager 1996; Mager and others 2004). When the yolk sac is almost fully absorbed, the larvae begin exogenous feeding. In aquaculture, first-feeding larvae only ate unicellular algae and rotifers presented to them in turbid conditions (Baskerville-Bridges and others 2004; Mager and others 2004). In the field, however, an evaluation of gut contents in nearly 1,500 young delta smelt showed that feeding was size-based with first-feeding larvae (5 to 8 mm SL) consuming sub-adult cyclopoid and calanoid copepods (Nobriga 2002). Larvae swim continuously, and feeding success requires practically bumping into prey items rather than a coordinated attack behavior (Bennett, pers. obs.). Thus, the stochastic nature of co-occurring with, and capturing, food implies that feeding success is related to prey densities (Nobriga 2002). In 1999, larvae in the wild grew at about 0.35 mm per day, although with typically high variability among individuals (Bennett and Hobbs, unpublished
data; Figure 6B). Actual growth rates for larvae among cohorts and years are extremely difficult to determine, because field samples typically only represent those individuals that have survived the first-feeding period.
All remaining life stages of delta smelt consume adult copepods. Older larvae (10 to 15 mm) begin to consume adult copepods and may select the cosmopolitan calanoid copepod, Eurytemora affinis (Nobriga 1998). However, since the dramatic decline of E. affinis in 1989 (Kimmerer and others 1994), it becomes locally and intermittently abundant only during early spring. When available, larvae and juveniles appear to utilize E. affinis, but gradually they include the exotic calanoid copepod, Pseudodiaptomus forbesi, as this prey item increases in abundance during late spring. As a result, P. forbesi has been the dominant prey item for delta smelt since the decline in E. affinis at all but the earliest feeding life stages (Moyle and others 1992; Lott and Nobriga 1998). However, P. forbesi abundance has been declining in recent years concurrent with a rise in the abundance of another exotic copepod, Limnoithona tetraspina, that is apparently too small to be consumed by delta smelt (Bouley 2004; Hobbs 2004; L. Mecum, DFG, pers. comm.).
Swim Bladder Development and Post-Larval Stage. Delta smelt swim bladders finish developing and fin-folds begin to appear in the 14 to 20 mm size range, or at about 25 to 40 days post-hatch (Figure 6; Wang and Brown 1991; Bennett, pers. obs.). However, Mager and others (2004) didn’t observe this until 40 to 60 days post-hatch. Here I refer to this life-stage as post-larvae, because these milestones of development influence their behavior and distribution. For example, in the 20-mm Survey the post-larvae are generally caught in the western Delta and Suisun Bay where they accumulate at the landward margin of the low salinity zone (Grimaldo and others 1998). Juveniles (20 to 40 mm) are generally more widely distributed, but also maintain an association with the low salinity zone.
18
San Francisco Estuary and Watershed Science Vol. 3, Iss. 2 [September 2005], Art. 1
http://repositories.cdlib.org/jmie/sfews/vol3/iss2/art1
t
Figure 11. Delta smelt size-frequency distributions from bi-weekly sampling in the 20-mm Survey during 1997 and 1999 (A). Brackets show the water temperature range 15 to 20°C. Note that when temperature exceeds 20°C in late spring, larvae no longer enter the survey. (B) Cumulative percent of delta smelt larvae caught as a function of water temperature in larval surveys from 1993 and 1994; larvae occur in the samples at water temperatures of about 14 to 18°C. Data courtesy of M. Nobriga, DWR.
April 12th
May 14th
April 16th
June 18th
63 d.
32 d.
Ab
un
da
nce
1997 1999
A
10 12 14 16 18 20
0
20
40
60
80
100
Cu
mm
ula
tive
per
cen
t
Water temperature (oC)
1993 1994
B
19
Bennett: Critical assessment of the delta smelt population
Produced by eScholarship Repository

Several young fishes appear to employ behavioral strategies to prevent advection seaward and remain in the low-salinity zone after they develop swim bladders (Kimmerer and others 1998; Bennett and others 2002). During June 1996, Bennett and others (2002) sampled young fishes at three discrete depths in northern (Suisun Cut, adjacent to the southeastern corner of Grizzly Bay) and southern (ship) channels of Suisun Bay (Figure 1). Sampling encompassed the low-salinity zone as it passed fixed stations over three complete tidal cycles (about 30 hr) during spring and neap tidal phases. Abundance at the Suisun Cut location, however, was about !eight-fold higher than at the Ship Channel and consisted of relatively larger individuals (Figure 12A; Aasen 1999). In the Ship channel, most fishes and zooplankton appeared to undergo tidal vertical migrations, occurring near the surface during flood tides and at depth on ebbs (Figure 12B; Bennett and others 2002; Kimmerer and others 1998, 2002). Tidal migrations may reduce advection seaward as well as facilitate feeding success (Bennett and others 2002). However, in Suisun Cut some fishes, including delta smelt, appeared to undergo reverse diel migrations, remaining near the surface during the day and at depth during the night (Figure 12B; Bennett and others 2002). This behavior also may have facilitated retention by promoting horizontal exchange with shallow-water habitats in Grizzly Bay and Honker Bay (Figure 1). Also, gut fullness and individual condition measures were considerably higher for delta smelt in Suisun Cut than in the Ship channel (Hobbs 2004). At both locations successful feeding appeared to be restricted to daylight hours during flood tides (Hobbs 2004), a pattern also observed for rainbow smelt (Osmerus mordax) in the St. Lawrence Estuary (Sirois and Dodson 2000). Overall, the close association with the low salinity zone and dense patches of zooplankton may help to explain rapid growth (about 0.5 mm per day) observed during the post-larval period in 1999 (Figure 6B). These findings support the hypothesis that the low-salinity and shallow-water areas of Suisun Bay constitute vital nursery habitat for delta smelt
and other young fishes during years of moderate to high outflow (Herbold and others 1992; Moyle and others 1992).
Less is understood concerning the vertical distribution of delta smelt in other locations in the SFE. Rockriver (2004) examined vertical distribution for post-larval smelt in the lower Sacramento River and San-Joaquin River in 2000–2001. Although the results indicate that in the freshwater portions of these rivers post-larvae were significantly more abundant at depth during the day relative to night, the results are difficult to interpret without accompanying hydrodynamic information. The pattern may also have been influenced by the very low abundance of delta smelt in the catch.In general, young delta smelt appear to be more dispersed in the water column during hours of darkness. Indeed, higher dispersion during night also may have contributed to the pattern of reverse diel migration identified by Bennett and others (2002), as well as to higher entrainment of delta smelt in an agricultural diversion siphon observed by Nobriga and others (2004). Overall, however, more work is needed to fully understand vertical and horizontal distribution patterns, as well as their underlying mechanisms. Such work is especially needed in the vicinity of the water export facilities in the south Delta.
Juvenile and Adult Stage. Juvenile delta smelt finish developing fins and the majority of adult morphological characteristics by about 25 to 30 mm (Figure 6A). As a result they have the swimming ability to select habitats and are generally more widely distributed. Growth continues during the summer months (at about 0.35 mm d-1) and then slows as average fork lengths reach 40 to 50 mm in September (Figure 6B; see Tables 17-19 in Erkkila and others 1950; Ganssle 1966; Radtke 1966; Moyle and others 1992). Mortality is typically inversely associated with fish size, thus it tends to be considerably lower during the transition from juvenile to adult stage than in egg and larval stages (Figure 6C).
20
San Francisco Estuary and Watershed Science Vol. 3, Iss. 2 [September 2005], Art. 1
http://repositories.cdlib.org/jmie/sfews/vol3/iss2/art1
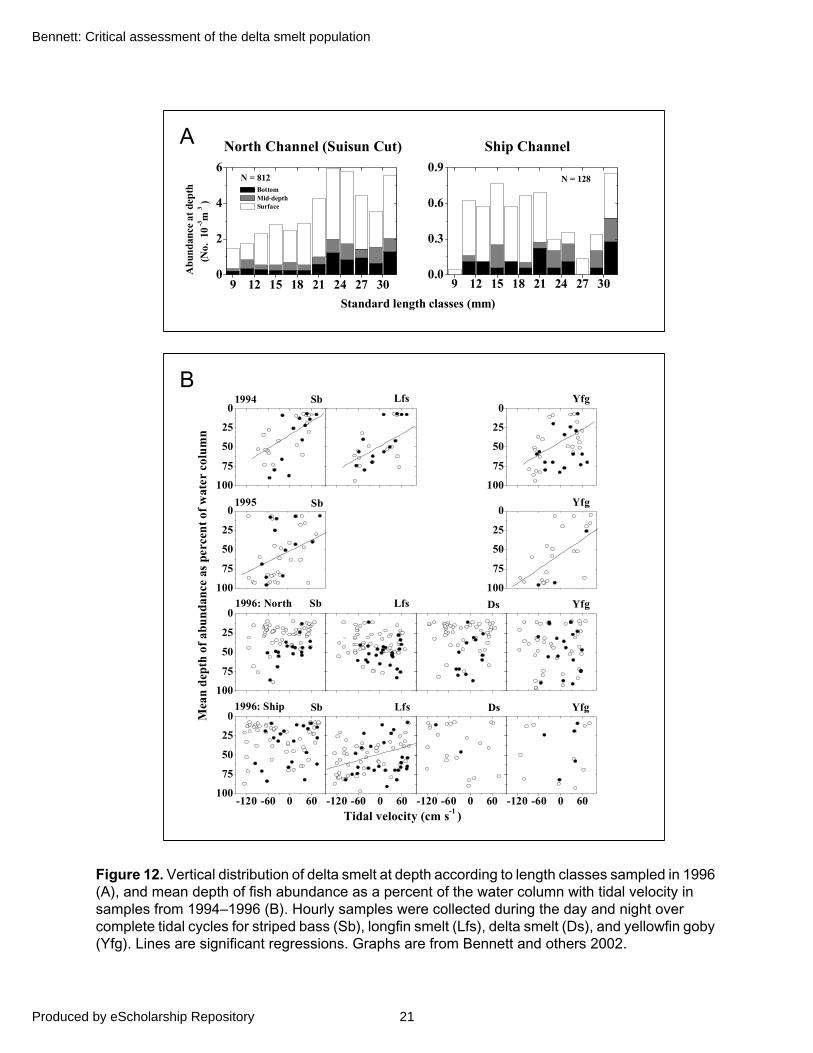
Figure 12. Vertical distribution of delta smelt at depth according to length classes sampled in 1996 (A), and mean depth of fish abundance as a percent of the water column with tidal velocity in samples from 1994–1996 (B). Hourly samples were collected during the day and night over complete tidal cycles for striped bass (Sb), longfin smelt (Lfs), delta smelt (Ds), and yellowfin goby (Yfg). Lines are significant regressions. Graphs are from Bennett and others 2002.
100
75
50
25
0
100
75
50
25
0
100
75
50
25
0
100
75
50
25
0
Mea
n de
pth
of a
bund
ance
as
perc
ent
of w
ater
col
umn
1996: Ship
1996: North
Tidal velocity (cm s-1 )
1995
Ds
-120 -60 0 60100
75
50
25
0
Sb
-120 -60 0 60
Lfs
Lfs
-120 -60 0 60
Yfg
YfgDs
-120 -60 0 60
100
75
50
25
0
Sb
YfgSb
1994 YfgLfsSb
B
9 12 15 18 21 24 27 300
2
4
6
Bottom Mid-depth Surface
Abu
ndan
ce a
t de
pth
(
No.
10 -
3 m 3 )
N = 812
9 12 15 18 21 24 27 300.0
0.3
0.6
0.9 N = 128
Standard length classes (mm)
North Channel (Suisun Cut) Ship ChannelA
21
Bennett: Critical assessment of the delta smelt population
Produced by eScholarship Repository

Juveniles and adults may occur in loose aggregations rather than tight schools, judging from the patchiness of fish catch in the monitoring surveys (Bennett, pers. obs.). This may result from their unique swimming behavior. Laboratory flume studies of swimming performance (Swanson and others 1998) indicate that while 58% (N = 109) of juvenile-adult fish were capable of maintaining moderately high swimming velocities!(27 cm s-1, for 10 min), the remaining 42% were unable or unwilling to swim at velocities of 10 to 20 cm s-1. At velocities below 10 cm s-1, delta smelt employed an irregular stroke-and-glide swimming behavior. The extent to which this swimming behavior occurs in the wild is unknown. If so, such a swimming strategy appears to be adaptive for an estuarine planktivore, helping to conserve energy and maintain position in favored habitat. Irregular swimming and a translucent body may also help them to be cryptic.
During the fall, delta smelt gradually begin a diffuse migration landward to the freshwater portion of the Delta, and during wetter years to channels and sloughs in Suisun Marsh and the lower Napa River. Growth during this period is very slow and difficult to measure in otoliths (J. Hobbs, UCD, pers. comm.), implying that energy may be allocated to gonad development before the spawning season.
Longevity. The majority of adult delta smelt (50 to 80 mm) live one year. A few adults live two years, and may spawn in one or both years. Length-frequency data suggest that adults become rare during spring, with juveniles dominating summer catches in the TNS (Erkkila and others 1950; Radtke 1966; Moyle 1976; Stevens and others 1990; Moyle and others 1992). Otoliths from some individuals over 70 mm (FL) in the summer have distinct annual rings, confirming that a few fish do live beyond a year (Figure 13A). In addition, fish over 80 mm in length comprised 2.3% and 9.3% of the individuals in mature spawning condition collected in 2002 and 2003 respectively (Figure 13B). However, some of these larger individuals do not appear in
reproductive condition on the spawning grounds (K. Sousa, DFG, pers. comm.). In Japan, a similar proportion of wakasagi typically live two years and are iteroparous, spawning in both years (Katayama and Kawasaki 1994; Katayama and others 1999).
Figure 13. (A) Length of young of the year and 1+ year adults as determined from otolith evaluations (N = 876) in 1999–2000 (Bennett and Hobbs, in prep.). (B) Size-frequency distributions of delta caught during the spawning season by the spring Kodiak Trawl Survey in 2002–2003.
May
2Ju
n 21
Aug
10
Sep
29N
ov 1
8Ja
n 7
Feb
26Ap
r 16
Jun
5
20
30
40
50
60
70
80
90
100
Young of yearAge one-plus year
Fo
rk L
eng
th
50 60 70 80 90 1000
40
80
120
160
200
Length bin (mm)
50 60 70 80 90 1000
100
200
300
400
2002 Spring Kodiak Survey
N
um
ber
of
fish
n = 896>80mm = 21
2.3% > 80mm
n = 1438>80mm = 134
9.3% > 80mm
2003 Spring Kodiak Survey
A
B
22
San Francisco Estuary and Watershed Science Vol. 3, Iss. 2 [September 2005], Art. 1
http://repositories.cdlib.org/jmie/sfews/vol3/iss2/art1

Two-year-old females could have an important influence on population dynamics by augmenting spawning success after years of poor recruitment. In most fishes, older females are also known to have more eggs of higher quality, and improved reproductive success by provisioning eggs well in select microhabitats or at optimal times during the spawning season (Chambers and Lambert 1996; Brooks and others 1997). One-year-old delta smelt females in aquaculture produce about 2,000 eggs, whereas two-year-old females in aquaculture can produce more than twice this number (Figure 9). In addition, wakasagi fecundity is known to increase with fish size, with two-year-old females also producing larger and more eggs than one-year-old females (Katayama and others 1999). If employed by delta smelt, such a tactic would enable their unusual life history strategy to persist, and thus reduce the probability of extinction. Reproductive tactics that spread reproduction over time are typically termed bet-hedging (Stearns 1992), and are a common response employed by fishes to compensate for poor recruitment or high adult mortality (Wootten 1984; Rochet 2000). Therefore, research is needed to identify the proportion of two-year-old fish, their reproductive capacity, and spawning strategies to determine the potential significance of bet-hedging for delta smelt population dynamics.
Implications and Uncertainties
The current information on delta smelt biology and life history suggests it is an unusual species. Several aspects of their life history are similar to those of other coastal fishes. However, delta smelt are not well classified into any of three basic life history strategies employed by many fishes worldwide (Winemiller and Rose 1992; McCann and Shuter 1997; Vila-Gispert and others 2002). It is a small and primarily annual species but with low fecundity and a protracted spawning season: key traits that are typically associated with a perennial life history strategy. Delta smelt also do not appear to compensate for their limited reproductive capacity by having
precocious offspring like most salmonids. This contradiction renders the species at risk to extinction because it occurs in a fluctuating environment, has relatively low reproductive output, but must have successful recruitment each year.
Delta smelt is also highly susceptible to local environmental catastrophes because it has a tiny geographic range compared with most Hypomesus, occurring only within a thin margin of low salinity habitat in the northeastern SFE (Figure 1). In addition, spawning success may be successful only within particular lunar phases, a specific temperature range, as well as for eggs deposited on suitable substrate. Moreover, feeding is almost exclusively restricted to copepods that must become abundant at the appropriate life stages spatiotemporally with those of delta smelt. Therefore, because of these unique and very specific requirements, delta smelt may employ a bet-hedging tactic in which a small proportion of individuals survive, become highly fecund, and spawn in a second year. Such a tactic would help to compensate for years of poor recruitment success and maintain population persistence.
Several aspects of the above conceptual model for delta smelt are uncertain. Key issues in need of resolution include the following, listed by life sequence rather than relative importance.
Fecundity and Reproductive Success. Currently there are no field-based data on
the size-specific patterns of fecundity, spawning cues and microhabitats, or spawning success in under different environmental conditions. Such information is essential for understanding the life history strategy and developing population models for delta smelt.
Feeding Success. Information on the mechanisms underlying first-feeding success for delta smelt on recently introduced copepods is necessary for evaluating the suitability of the ever-changing feeding environment.
23
Bennett: Critical assessment of the delta smelt population
Produced by eScholarship Repository

Swimming Behavior. The patterns and processes that determine delta smelt spatial distribution at meso-scales (meters, hours) have been explored in detail only within the low salinity zone. Similar information is lacking for other regions of the delta smelt habitat, specifically in the south Delta and in vicinity of the major water export facilities.
Longevity. The numbers, fecundities, and reproductive success of two-year-old fish during spawning seasons with different environmental conditions needs to be resolved. This information is crucial for assessing the potential importance and processes underlying a possible bet-hedging tactic that may enhance persistence of the delta smelt population.
Influences on Annual Abundance
Understanding what factors limit delta smelt abundance remains a challenging and urgent concern. Despite intensive monitoring of distribution and abundance, relatively little work has been directed at specific processes that may determine annual abundance. A short life span and low fecundity implies that maximizing recruitment success, or survival of eggs and newly hatched fish to the next reproductive season each year, is vital because the majority of adults does not spawn in multiple years; there is little population carryover among years (Warner and Chesson 1985). However, teasing apart the factors regulating recruitment has proven to be a frustrating if not intractable pursuit for fishes (Houde 1989; Lawrence 1990; Leggett and Deblois 1994; Cowan and others 1996). This is because recruitment is regulated by complex interactive mechanisms that can change in importance episodically, or as subtle processes (Bender and others 1984; Houde 1989; Bennett and Moyle 1996). Nonetheless, measuring and predicting recruitment success is crucial for devising effective management strategies for delta smelt.
As a first-step toward understanding the importance of potential processes limiting delta
smelt, long term trends in abundance can be explored with various environmental factors. Although statistical relationships can be identified with this approach, the results cannot reliably demonstrate causation. In addition, key mechanisms may be difficult to measure (e.g. toxic chemical concentrations; Bennett 1996; Moon and others 2000), may not be recognized (e.g. climate change; Bennett and Moyle 1996), or have synergistic effects that require including several factors in analyses that can outstrip the statistical power of the data (Jassby 2000). Exploratory data analyses can provide a valuable service, however, by sharpening the scope of questions that should then be addressed as part of a comprehensive program of research. With these caveats in mind, various analyses are presented below and compared with direct measurements where possible. The objective is to develop a conceptual model that conveys what is currently known, as well as to highlight some of the likely factors limiting delta smelt abundance.
Generation Time
Previously the question was posed whether two-year-old fish may spawn successfully and influence the dynamics of the population. However, if two-year-old females have higher fecundity but are so few in number, can they influence population dynamics? I examined the potential influence of these fish using the auto-correlation structure of the abundance indices and abundance estimates. Auto-correlation functions (Chatfield 1984) correlate a time series with itself at different time lags. For delta smelt, significant auto-correlation occurs in the TNS and juvenile abundance estimates at lags of one and two years and in the MWT and pre-adult abundance at a lag of two years (Figure 14). Although these patterns could arise from autocorrelation in other mechanisms that are closely tied to abundance, a more likely explanation is that the relationships arise from interactions within a biological population (Hare and Francis 1995; Downton and Miller 1998). As shown
24
San Francisco Estuary and Watershed Science Vol. 3, Iss. 2 [September 2005], Art. 1
http://repositories.cdlib.org/jmie/sfews/vol3/iss2/art1

Figure 14. Auto-correlation relationships for juvenile (TNS) and pre-adult (MWT) delta smelt abundance indices (A, B) and abundance estimates (C, D) at years lagged one and two years. Fitted lines are linear regressions. Plotted numbers represent years before (<1982, red) and after (>1981, blue) the decline in delta smelt.
2.1 2.4 2.7 3.0 3.3
2.1
2.4
2.7
3.0
3.3
2.1 2.4 2.7 3.0 3.3
0.0 0.4 0.8 1.2 1.6 2.0
0.0
0.4
0.8
1.2
1.6
2.0
0.0 0.4 0.8 1.2 1.6 2.0
82
83
84
85
8687
88
89 90
91
92
93
94
95
96
97
98
9900
01
02
03
6869
70717273
7475
7677
78
79
80
8169
7071 7273
7475
7677
78
79
80
8182
83
84
85
8687
88
8990
91
92
93
94
95
96
97
98
9900
01
02
03
70
7172
73
7475
76
77
78
798081
82
83
8485
86
8788
89 909192
93
94
95
96
9798
9900
0102
03
71 72
73
74 75
76
77
78
79 8081
82
83
8485
86
87 88
8990 9192
93
94
95
96
9798
9900
0102
03
Lo
g M
WT
Log MWT
y = 1.3 + 0.5x
P = 0.003, R2 = 0.23
y = 0.34 + 0.58x
P = 0.0004, R2 = 0.32
Lo
g T
NS
Log TNS
y = 0.38 + 0.51xP = 0.002, R2 = 0.27
6.5 7.0 7.5 8.06.0
6.5
7.0
7.5
8.0
6.5 7.0 7.5 8.0
4.8 5.2 5.6 6.0 6.44.8
5.2
5.6
6.0
6.4
4.8 5.2 5.6 6.0 6.4
70
71
72
737475
76 77
78
798081
82
83
8485
86
878889
90
91
92
93
94
95
96
97
98
990001
02
03
71
72
73 7475
7677
78
798081
82
83
8485
86
878889
90
91
92
93
94
95
96
97
98
9900 01
02
70
717273
7475
76
77
78
79
80
8182
8384
85
8687
88
8990
91
92
93
94
95
96
9798
99 00
01
02
03
71 7273
7475
76
77
78
79
80
81 82
8384
85
8687
88
8990
91
92
93
94
95
96
9798
9900
01
02
03
y = 3.0 + 0.57xP = 0.0003, R2 = 0.34L
og
juve
nile
ab
un
dan
ce
Log juvenile abundance
y = 3.74 + 0.46xP = 0.005, R2 = 0.23
Lo
g a
du
lt a
bu
nd
ance
Log adult abundance
y = 2.7 + 0.51x
P = 0.002, R2 = 0.26
1 year lag 2 year lag
A
B
C
D
25
Bennett: Critical assessment of the delta smelt population
Produced by eScholarship Repository

below, few exogenous factors are closely tied to delta smelt abundance. Thus, the autocorrelation at a two-year lag may reflect a small or intermittent, but important, influence of two-year-old females.
The number of two-year-old females in a given year may reflect variability in the timing and duration of the spawning season in the previous year: one possible alternative to a bet-hedging tactic. Delta smelt spawning success appears to be confined to water temperatures between about 15 to 20°C (Figures 10, 11). When a cool year is followed by a warm year, fish that are spawned late in the cool year may not reach reproductive maturity by the time water temperatures reach 20°C in the following warm year. These fish may then wait until year two to spawn. To explore this question, I estimated the number of two-year-old adults and the daily average temperature for Suisun Bay and the Delta during spring. The proportion of delta smelt over 80 mm FL in the MWT was used to represent two-year-old adults (Figure 15). Temperature data were then compiled from five DWR monitoring stations (1983–2002) and from the IEP zooplankton survey (1969–2002). Daily averages from the two data sources were highly correlated in overlapping years (r = 0.85, P < 0.0001), justifying use of both data sources in a single time series. The length of each annual spawning season for delta smelt was then estimated using the number of days water temperatures ranged from 15 to 20°C during spring. A plot of the range in days between 15 to 20°C shows that the timing and duration of the estimated spawning season has varied widely since the late 1960s (Figure 16). During the 1990s spawning seasons frequently extended into early June. During El Niño years, however, they can be constrained by rapidly rising water temperatures (e.g. 1983), and they are also typically preceded by an extended spawning season in the previous year (Figure 16). However, the estimated proportion of two-year-old fish is not associated with this spawning index. This analysis points to the need for field studies to determine the numbers and reproductive potential of two-year-old
females during the spawning season to understand their potential importance for delta smelt population dynamics.
Stock-Recruit Relationships and Density Dependence
Stock-recruit analysis is a traditional approach for exploring the relative influences of density-dependent and density-independent limitations on population size. Density dependence occurs when population vital rates (per capita birth, death, fecundity) vary with the density of individuals. Organism density is expressed in units of the numbers of individuals per a measure of habitat, or space, and can only be equated with abundance if the amount of suitable habitat remains constant. Thus a population may experience density-dependent limitation at the same or lower abundance if the amount of suitable habitat shrinks. Density dependence is considered compensatory if population growth rate is negatively related to population density, meaning the population is limited at high density and a resilient growth response occurs at low densities. Density independent effects result from environmental influences on populations irrespective of their density; that is, with no feedbacks exerted at high densities to limit the population. Although density dependence would eventually provide an ultimate constraint on populations, its effects can be subtle and difficult to identify in many cases amidst high variability induced by environmental effects and sampling error (Strong 1986; Shepard and Cushing 1990; Dennis and Taper 1994). As a result, stock-recruit relationships typically exhibit considerable variability (see Myers and others 1995 for a catalogue of 274 relationships). Despite these inherent problems, identifying if and when density dependence occurs in a life cycle can have important implications for management and restoration. For example, compensatory density-dependent responses are a necessary condition for sustainable fishing (Sissenwine 1984; Shepard and Cushing 1990; Rose and others 2001).
26
San Francisco Estuary and Watershed Science Vol. 3, Iss. 2 [September 2005], Art. 1
http://repositories.cdlib.org/jmie/sfews/vol3/iss2/art1

Figure 15. Annual catch (A) and proportion (B) of >80 mm delta smelt from the Midwater Trawl Survey.
Figure 16. Range in daily of water temperature between 15 to 20°C averaged over Suisun Bay and the Delta during spring from 1969–2002. Red bars indicate El Niño years. Data for years 1983–present are from five DWR monitoring stations. Data for prior years are from the IEP Zooplankton Survey.
75 80 85 90 95 000.0
0.3
0.6
0.9
Pro
po
rtio
n >
80m
m (
10-1)
Year
0
10
20
30
40
Cat
ch >
80m
m (
FL
) A
B
1965 1970 1975 1980 1985 1990 1995 2000 2005
28
June 8
May 19
29
April 9
March 1
20
Year
Dat
e
27
Bennett: Critical assessment of the delta smelt population
Produced by eScholarship Repository
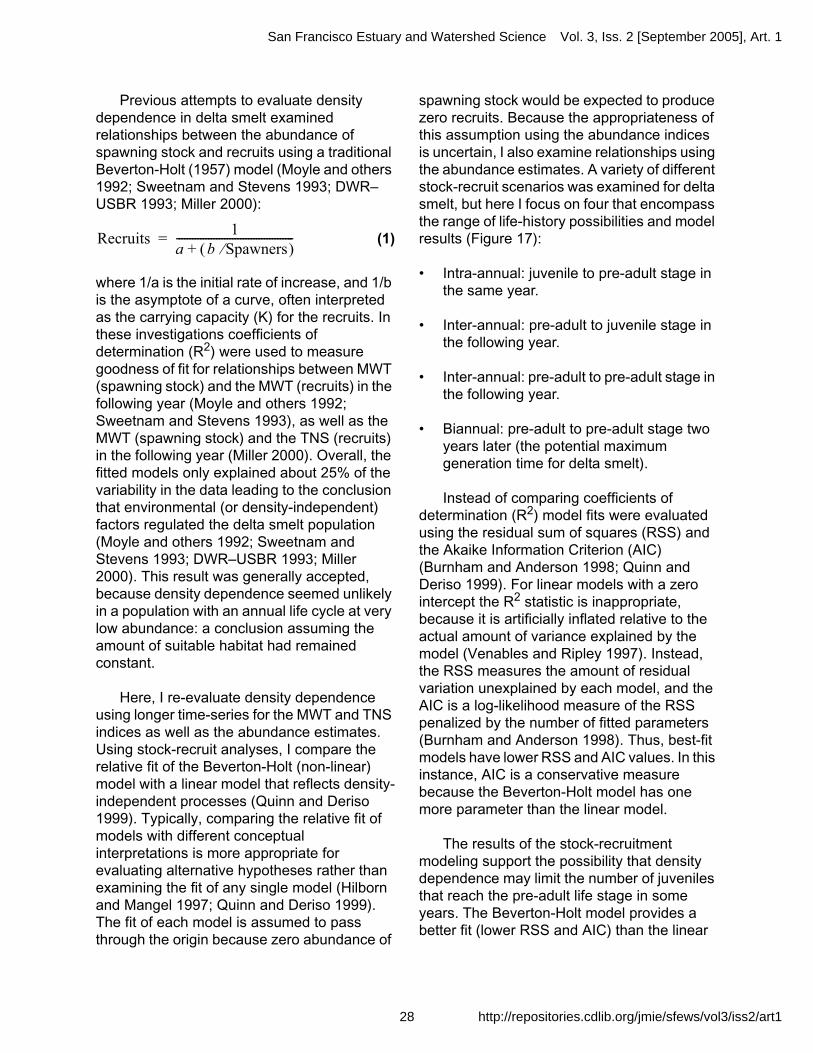
Previous attempts to evaluate density dependence in delta smelt examined relationships between the abundance of spawning stock and recruits using a traditional Beverton-Holt (1957) model (Moyle and others 1992; Sweetnam and Stevens 1993; DWR–USBR 1993; Miller 2000):
(1)
where 1/a is the initial rate of increase, and 1/b is the asymptote of a curve, often interpreted as the carrying capacity (K) for the recruits. In these investigations coefficients of determination (R2) were used to measure goodness of fit for relationships between MWT (spawning stock) and the MWT (recruits) in the following year (Moyle and others 1992; Sweetnam and Stevens 1993), as well as the MWT (spawning stock) and the TNS (recruits) in the following year (Miller 2000). Overall, the fitted models only explained about 25% of the variability in the data leading to the conclusion that environmental (or density-independent) factors regulated the delta smelt population (Moyle and others 1992; Sweetnam and Stevens 1993; DWR–USBR 1993; Miller 2000). This result was generally accepted, because density dependence seemed unlikely in a population with an annual life cycle at very low abundance: a conclusion assuming the amount of suitable habitat had remained constant.
Here, I re-evaluate density dependence using longer time-series for the MWT and TNS indices as well as the abundance estimates. Using stock-recruit analyses, I compare the relative fit of the Beverton-Holt (non-linear) model with a linear model that reflects density-independent processes (Quinn and Deriso 1999). Typically, comparing the relative fit of models with different conceptual interpretations is more appropriate for evaluating alternative hypotheses rather than examining the fit of any single model (Hilborn and Mangel 1997; Quinn and Deriso 1999). The fit of each model is assumed to pass through the origin because zero abundance of
spawning stock would be expected to produce zero recruits. Because the appropriateness of this assumption using the abundance indices is uncertain, I also examine relationships using the abundance estimates. A variety of different stock-recruit scenarios was examined for delta smelt, but here I focus on four that encompass the range of life-history possibilities and model results (Figure 17):
• Intra-annual: juvenile to pre-adult stage in the same year.
• Inter-annual: pre-adult to juvenile stage in the following year.
• Inter-annual: pre-adult to pre-adult stage in the following year.
• Biannual: pre-adult to pre-adult stage two years later (the potential maximum generation time for delta smelt).
Instead of comparing coefficients of determination (R2) model fits were evaluated using the residual sum of squares (RSS) and the Akaike Information Criterion (AIC) (Burnham and Anderson 1998; Quinn and Deriso 1999). For linear models with a zero intercept the R2 statistic is inappropriate, because it is artificially inflated relative to the actual amount of variance explained by the model (Venables and Ripley 1997). Instead, the RSS measures the amount of residual variation unexplained by each model, and the AIC is a log-likelihood measure of the RSS penalized by the number of fitted parameters (Burnham and Anderson 1998). Thus, best-fit models have lower RSS and AIC values. In this instance, AIC is a conservative measure because the Beverton-Holt model has one more parameter than the linear model.
The results of the stock-recruitment modeling support the possibility that density dependence may limit the number of juveniles that reach the pre-adult life stage in some years. The Beverton-Holt model provides a better fit (lower RSS and AIC) than the linear
Recruits1
a b Spawners"# $+--------------------------------------------=
28
San Francisco Estuary and Watershed Science Vol. 3, Iss. 2 [September 2005], Art. 1
http://repositories.cdlib.org/jmie/sfews/vol3/iss2/art1
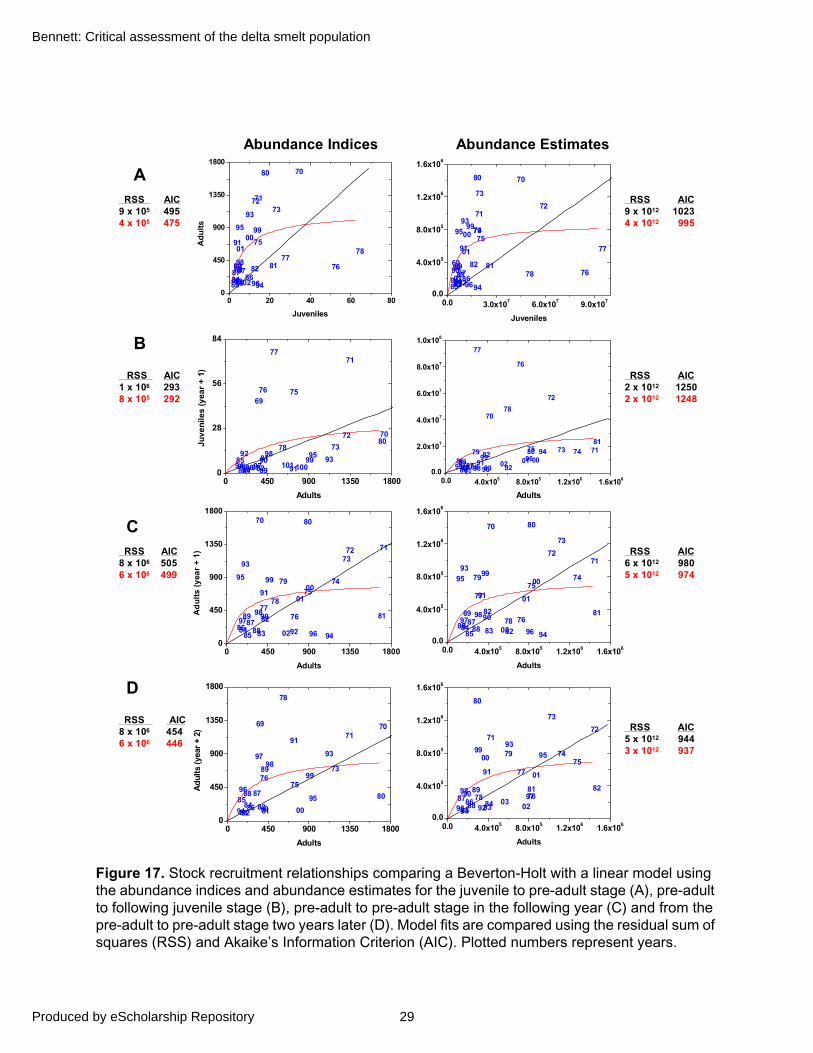
Figure 17. Stock recruitment relationships comparing a Beverton-Holt with a linear model using the abundance indices and abundance estimates for the juvenile to pre-adult stage (A), pre-adult to following juvenile stage (B), pre-adult to pre-adult stage in the following year (C) and from the pre-adult to pre-adult stage two years later (D). Model fits are compared using the residual sum of squares (RSS) and Akaike’s Information Criterion (AIC). Plotted numbers represent years.
0 450 900 1350 18000
450
900
1350
180070
717273
7475
7677
78
79
80
8182
838485
8687
88
89 90
91
92
93
94
95
96
9798
9900
01
02
Ad
ult
s (
yea
r +
1)
Adults
0 20 40 60 800
450
900
1350
1800
69
70
717273
75
7677
78
80
8182
838485
868788
8990
91
92
93
94
95
96
9798
9900
01
102
Ad
ult
s
Juveniles
0 450 900 1350 18000
450
900
1350
1800
69 7071
73
7576
78
80
818283
8485
86
8788
89
90
91
92
93
94
9596
9798
99
00
Ad
ults
(yea
r +
2)
Adults
0 450 900 1350 18000
28
56
84
69
70
71
72
73
7576
77
7880
81828384
85868788 89
9091
9293
94
95
96 97
9899
100101
Juve
nile
s (y
ear
+ 1
)
Adults
RSS AIC8 x 106 4546 x 106 446
RSS AIC1 x 106 2938 x 105 292
RSS AIC9 x 105 4954 x 105 475
0.0 4.0x10⁵ 8.0x10⁵ 1.2x10⁶ 1.6x1060.0
2.0x10⁷
4.0x10⁷
6.0x10⁷
8.0x10⁷
1.0x10⁸
70
71
72
73 7475
76
77
78
79 80
81
82
83848586
878889 9091
9293
94
9596
9798
99 00010203
Adults
0.0 3.0x10⁷ 6.0x10⁷ 9.0x1070.0
4.0x10⁵
8.0x10⁵
1.2x10⁶
1.6x10⁶
69
70
7172
73
7475
76
77
78
79
80
8182
838485
868788
8990
91
92
93
94
95
96
9798
9900
01
0203
Juveniles
0.0 4.0x10⁵ 8.0x10⁵ 1.2x10⁶ 1.6x1060.0
4.0x10⁵
8.0x10⁵
1.2x10⁶
1.6x10⁶
70
7172
73
7475
76
77
78
79
80
8182
838485
86 8788
89 90
91
92
93
94
95
96
9798
9900
01
023
Adults
0.0 4.0x10⁵
8.0x10⁵
1.2x10⁶
1.6x10⁶
0.0
4.0x10⁵
8.0x10⁵
1.2x10⁶
1.6x10⁶
7172
73
7475
76
77
78
79
80
81 82
838485
868788
8990
91
92
93
94
95
96
9798
9900
01
0203
Adults
Abundance Indices Abundance Estimates
ARSS AIC
9 x 10¹² 10234 x 1012 995
B
RSS AIC2 x 1012 12502 x 1012 1248
CRSS AIC
6 x 10¹² 9805 x 1012 974
RSS AIC8 x 106 5056 x 106 499
RSS AIC5 x 1012 9443 x 1012 937
D
29
Bennett: Critical assessment of the delta smelt population
Produced by eScholarship Repository

model for the intra-annual relationship between the TNS and MWT as well as a similar relationship using abundance estimates (Figure 17A). In contrast, model fits are equivalent for the scenario using the MWT and TNS in the following year (Figure 17B), suggesting that environmental factors dominant during the spawning and larval rearing stages. In the inter-annual and biannual scenarios, the Beverton-Holt model again explains a higher proportion of the variation between pre-adults (spawning stock) and pre-adults (recruits) one or two years later (Figures 17C, 17D). By using scenarios that reflect different periods in the entire life-cycle, it appears that density dependence may occur in some years during late summer when juveniles are recruiting to the pre-adult stage.
Although use of the entire data-record suggests density dependence may have occurred mostly during the 1970s, it is still detectable in recent years. High juvenile abundances, primarily in the 1970s, are a strong influence on the stock-recruit relationships; subsequent years tend to fall below the inflection point of model fits (Figure 17A). To address this issue, the previous analyses were repeated separating the data into pre- and post-decline periods, with 1969–1981 reflecting the pre-decline and 1982–2002 representing the post-decline period. Comparisons of model fits for each period indicate that the density-dependent models again have lower AIC values than the density-independent models (Figure 18). Therefore, these analyses support the possibility that density dependence also may have limited abundance in recent years. Moreover, comparison of Beverton-Holt model fits between the pre- and post-decline periods indicate that carrying capacity may have declined by about one-half between the two time periods (Figure 18). In the pre-decline period, the fitted curve begins to asymptote at MWT values between 600 to 800 and abundance estimates of about 8 x 10⁶ fish, whereas in the post-decline period the curve asymptotes somewhere between 400 and 450 and an abundance estimate of about 4 x 10⁶
fish (Figure 18). Thus, density dependence may be occurring in some recent years at lower levels of abundance than before the population declined. The potential occurrence of density dependence for delta smelt seems unlikely because a straightforward mechanism is not apparent for how a threatened fish could be limited by feedbacks on density. Although delta smelt are relatively rare, the population may still be limited by a critical resource, or suitable habitat may have declined over time. Habitat loss is a reasonable possibility for delta smelt given our limited knowledge of the ecology and the dramatic hydrological and food web changes that have occurred within its range over the past several decades. Overall, evidence for density dependence is most clearly observed in spatially-limited systems; for example, where abundance overwhelms available spawning habitat or territories (e.g. salmonids, Elliot 1994; Rose and others 2001). This is a possibility for delta smelt that appear to have specific spawning habitat requirements (see “Spawning and Egg Stages”), however, the various stock-recruit scenarios examined above imply that density dependence most likely occurs in the juvenile stage during the late summer: a pattern observed in a variety of other fish species (Cowan and others 2000). This issue is further addressed in the section describing “Carrying Capacity.”
While somewhat preliminary, the evidence for density dependence outlined above begs the question regarding mechanisms of population regulation. Further understanding of this mechanism is essential because density dependence implies a surplus of juveniles may occur in years of relatively high abundance. Thus it has major implications for assessing and managing the influences of human activities on the population, particularly losses of fish to the water export facilities. In addition, density dependence also has important implications for determining restoration options, especially if the capacity of low-salinity habitat to support delta smelt has declined in recent years. However, measuring the magnitude of density dependence is not easy, and will require field measurements of fish
30
San Francisco Estuary and Watershed Science Vol. 3, Iss. 2 [September 2005], Art. 1
http://repositories.cdlib.org/jmie/sfews/vol3/iss2/art1
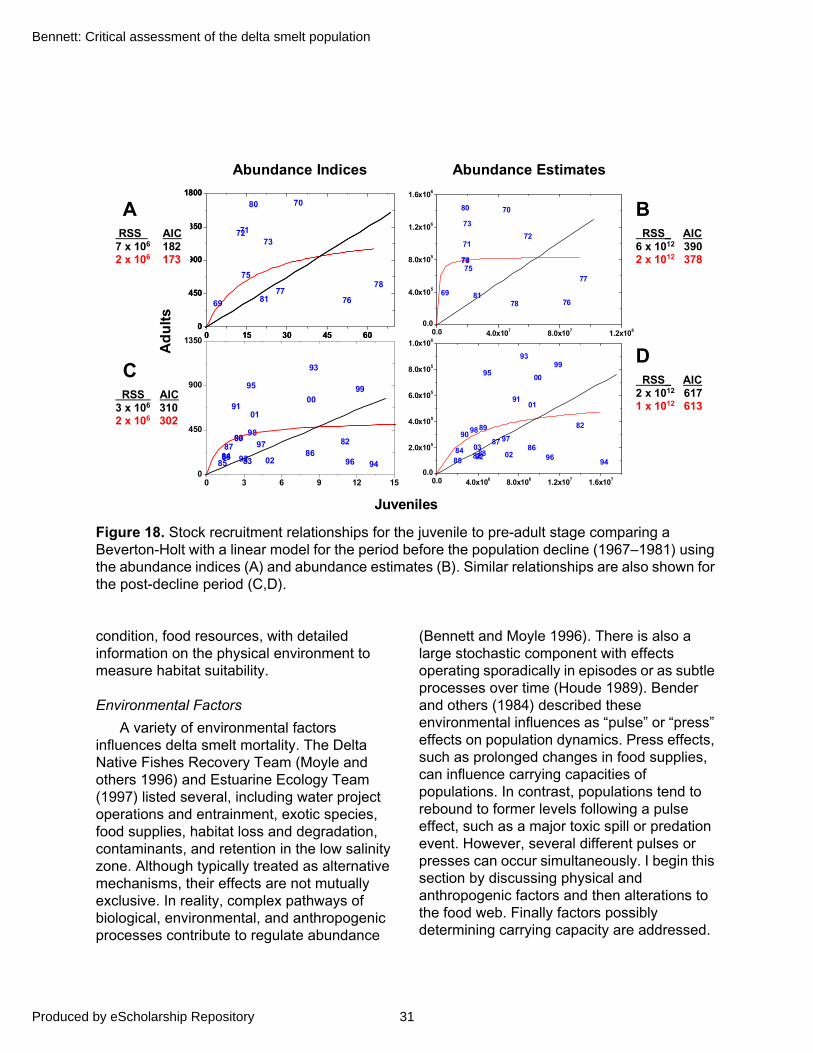
Figure 18. Stock recruitment relationships for the juvenile to pre-adult stage comparing a Beverton-Holt with a linear model for the period before the population decline (1967–1981) using the abundance indices (A) and abundance estimates (B). Similar relationships are also shown for the post-decline period (C,D).
condition, food resources, with detailed information on the physical environment to measure habitat suitability.
Environmental Factors
A variety of environmental factors influences delta smelt mortality. The Delta Native Fishes Recovery Team (Moyle and others 1996) and Estuarine Ecology Team (1997) listed several, including water project operations and entrainment, exotic species, food supplies, habitat loss and degradation, contaminants, and retention in the low salinity zone. Although typically treated as alternative mechanisms, their effects are not mutually exclusive. In reality, complex pathways of biological, environmental, and anthropogenic processes contribute to regulate abundance
(Bennett and Moyle 1996). There is also a large stochastic component with effects operating sporadically in episodes or as subtle processes over time (Houde 1989). Bender and others (1984) described these environmental influences as “pulse” or “press” effects on population dynamics. Press effects, such as prolonged changes in food supplies, can influence carrying capacities of populations. In contrast, populations tend to rebound to former levels following a pulse effect, such as a major toxic spill or predation event. However, several different pulses or presses can occur simultaneously. I begin this section by discussing physical and anthropogenic factors and then alterations to the food web. Finally factors possibly determining carrying capacity are addressed.
82
8384
8586
8788
8990
91
92
93
94
95
96
9798
9900
01
02
69
70
717273
75
7677
78
80
81
0 3 6 9 12 150
450
900
1350
Ad
ult
s
Juveniles
0 15 30 45 600
450
900
1350
1800
0 15 30 45 600
450
900
1350
1800
RSS AIC3 x 106 3102 x 106 302
A B
0.0 4.0x10⁶ 8.0x10⁶ 1.2x10⁷ 1.6x1070.0
2.0x10⁵
4.0x10⁵
6.0x10⁵
8.0x10⁵
1.0x10⁶
0.0 4.0x10⁷ 8.0x10⁷ 1.2x1080.0
4.0x10⁵
8.0x10⁵
1.2x10⁶
1.6x10⁶
82
838485
8687
88
8990
91
92
93
94
95
96
9798
99
00
01
0203
69
70
7172
73
7475
76
77
78
79
80
81
CD
RSS AIC7 x 106 1822 x 106 173
RSS_ AIC6 x 1012 3902 x 1012 378
RSS_ AIC2 x 1012 6171 x 1012 613
Abundance Indices Abundance Estimates
31
Bennett: Critical assessment of the delta smelt population
Produced by eScholarship Repository

Habitat Volume. Delta smelt habitat extends from the tidal freshwater reaches of the Delta seaward to about 19 psu salinity at water temperatures lower than 25°C. The volume and shape of this habitat is determined by climate, anthropogenic regulation of freshwater discharge, tidal forcing, and bathymetry. Inter-annual abundances of various biota are explained by the amount of freshwater outflow as indexed by X2, defined as the average distance (km) of 2 psu bottom salinity from the Golden Gate Bridge (Stevens 1977; Jassby and others 1995; Kimmerer 2002, 2004). Numerous mechanisms may underlie these relationships (Kimmerer 2002). However, unlike many other species, the abundance of delta smelt is not easily explained by this indicator or its analogue, freshwater flow (Figure 11, Stevens and Miller 1983; Kimmerer 2002).
Overall, delta smelt recruitment success is poor during drought and flood years, and highly variable during intermediate flow years when low salinity habitat is located in Suisun Bay (Figure 19A, Moyle and others 1992). This observation was first formalized by Obrebski (1993) who identified a significant relationship between the MWT index and the position of the low salinity zone in Suisun Bay. Herbold (1994) then found a significant relationship between the number of spring days X2 was located in Suisun Bay and adult abundance; a relationship that underlies the logic for the current salinity standards. However, this correlation no longer holds for the MWT index (r = 0.30, P = 0.08) or adult abundance (r = 0.31, P = 0.06, Figure 19C). In several recent years (since 1993) adult abundance remained fairly low even though X2 frequently was located in Suisun Bay (Figure 19C). Although recent abundances have been lower than anticipated, adult abundance is always low when X2 is located in the lower Sacramento and San Joaquin rivers (Figure 19A).
One possibility driving the confusion may be that delta smelt are responding differently to X2 since the population declined, or that other
changes to the physical habitat have overridden the influence of freshwater discharge. Recently, Kimmerer (2002) found a positive relationship between juvenile smelt abundance and X2 position before the decline occurred in 1982, and a negative trend (recalculated here including 2003 data; !r = –0.39, P = 0.07) since that time (Figure 19B). Similarly dividing the data into pre- and post-decline years for juvenile abundance and the number of days X2 was located in Suisun Bay, does not improve these relationships (Figure 19D). While these findings are puzzling, the differences in the trends suggest that spawning or rearing habitat in the lower rivers and Delta may have been more favorable for delta smelt before the 1982 than over the last two decades.
The importance of spawning and rearing habitat in Suisun Bay is also suggested by the analyses of Unger (1994). He showed that the overall surface area of habitat bounded by 0.3 to 1.8 psu was maximized with X2 positioned in Suisun Bay. When this habitat measure was weighted by the average monthly occurrence of larval and juvenile smelt he found a significant correlation with adult abundance. This finding is provocative, although it is preliminary and based on a fairly loose definition of delta smelt habitat. Changing habitat volume may be a key mechanism underlying density dependence. MacCall (1990) formalized this process using habitat selection models for pelagic fish. Larger habitat volume reduces crowding and provides opportunities to avoid localized sources of mortality, allowing for the “spreading-of-risk” over space (den Boer 1968). A potential change in habitat volume may underlie the observation that juvenile delta smelt are now rarely caught in the south Delta (DWR–USBR 1993, Sweetnam and Stevens 1993). Thus, it would be worthwhile to revisit this idea using current knowledge of the delta smelt habitat and newer modeling capabilities.
32
San Francisco Estuary and Watershed Science Vol. 3, Iss. 2 [September 2005], Art. 1
http://repositories.cdlib.org/jmie/sfews/vol3/iss2/art1
Figure 19. Various relationships between delta smelt abundance and position of the low salinity zone as indexed by X2. Delta smelt pre-adults (MWT index and abundance) with the average position of X2 during spring (A, X2 positions within vertical dotted lines reflect Suisun Bay), and for juveniles (TNS) by dividing the time series into before (1967–1981) and post-decline periods (B). Similar relationships are shown using the number of days during spring that X2 is located in Suisun Bay (C, D).
0 40 80 120 160
0
400
800
1200
1600
0 40 80 120 1606.0
6.4
6.8
7.2
7.6
8.0
0 40 80 120 1600.0
4.0x10⁵
8.0x10⁵
1.2x10⁶
1.6x10⁶
50 60 70 80 90 100
0.0
0.8
1.6
2.4
50 60 70 80 906.0
6.4
6.8
7.2
7.6
8.0
0 40 80 120 160
0.5
1.0
1.5
2.0
50 60 70 80 90 100
0.0
4.0x10⁵
8.0x10⁵
1.2x10⁶
1.6x10⁶
50 60 70 80 90 1000
450
900
1350
1800
67
68
69
70
717273
75
7677
78
80
818283 8485
868788
8990
91
92
93
94
95
9697
98
9900
01
02 03
69
70
71
72
7374 75
7677
78
798081
82
83
8485
8687
88 89
90
91
92
93
94
95
9697
98
99000102
03
67
68
69
70
717273
7475
76
77
78
79
80
8182
83 8485
868788
8990
91
92
93
94
95
9697
98
9900
01
02 03
69
7071
72
737475
76 7778
798081
82
83
84 85
86
87 8889
90
91
92
9394
95
96
9798
9900
0102
0369
70
71
72
737475
76 77
78
798081
82
83
84 85
86
878889
90
91
92
93
94
95
96
97
98
9900 0102
03
69
70
7172
7374
75
76
77
78
79808182
83
8485
86
8788
8990 9192
9394
95
96
9798
9900
0102
03
67
68
69
70
7172
73
7475
76
77
78
79
80
8182
83 8485
86 8788
89 90
91
92
93
94
95
969798
9900
01
020367
68
69
70
71 7273
75
7677
78
80
8182
83 84 8586 87
88
89 90
91
92
93
94
95
9697
98
9900
01
0203
Ad
ult
s
Days X2 in Suisun Bay
Lo
g ju
ven
iles
Lo
g ju
ven
iles
Abundance estimates
X2 (km)
Abundance indices
Days X2 in Suisun Bay
X2 (km)
D
C
B
Ad
ult
s
A
33
Bennett: Critical assessment of the delta smelt population
Produced by eScholarship Repository

Indeed, habitat within Suisun Bay is not of the same quality. Moyle and others (1992, 1996) originally suggested that low salinity habitat distributed over shoal areas was more productive and provided better rearing conditions than habitat confined to deeper channels. This idea is appearing to hold true. In the low salinity zone studies, delta smelt were 8 times more abundant in northern Suisun Bay and adjoining shallows in Honker Bay and Grizzly Bay than in the deeper Ship channel to the south (Bennett and others 2002). Recent evaluations of these samples are also showing that post-larvae were on average larger and had higher feeding success in the north shoal area than in the Ship channel (Hobbs and others 2004). Therefore, several lines of evidence indicate that maintaining low salinity habitat in Suisun Bay during spring can be beneficial for delta smelt. This does not guarantee recruitment success, but may increase its probability.
Climate Change and Spawning Success. Longer spawning seasons can also increase the potential for high recruitment success. More opportunities for spawning can result in more cohorts (Figure 11), spreading the risk from various sources of mortality over time (den Boer 1968). The potential benefits of longer spawning seasons may be also enhanced if delta smelt spawn more than once in a single season (see “Generation Time”). Several mechanisms affecting recruitment have a temporal component (e.g. co-occurrence with food supplies, predators, or pulses of toxic chemicals) thus the probability of encountering an adverse condition will differ for fish spawned at different times. Estimated spawning season durations (Figure 16) show a positive trend with post-larval (20 mm) abundance, although only seven data points were available, and they do not explain juvenile abundance (Figure 20). However, they are significantly associated with adult abundance, especially since the decline occurred (Figure
20). This demonstrates that spreading cohorts in time may increase the probability of high adult abundance.
Duration of the spawning season is a function of climate and thus may be affected by extreme climatic events. As shown before (Figure 16), many spawning seasons appear to have ended relatively early in spring, especially during El Niño episodes. To examine this, I developed an index of climate change calculated as the first principle component of three environmental variables, sea surface temperature and sea level at Fort Point (entrance to the SFE at the Golden Gate Bridge) and the Pacific Decadal Oscillation (PDO), an index of inter-decadal climate regimes (Mantua and others 1997). The derived index is negatively associated with the last day of spawning season (Julian date water temperature reaches 20°C, Figure 21A), indicating that the delta smelt habitat warms faster during El Niños. The climate index is also negatively associated with juvenile and adult abundance (Figures 21B and 21C). Thus, spring water temperatures may provide an early indication of when to expect good versus poor recruitment success. Moreover, long-term climatic warming may be expected to have negative effects on delta smelt abundance by marginalizing spawning in the future.
Water Exports. Water project operations are by far the most conspicuous and controversial factor contributing to mortality in delta smelt. Overall, however, their impact on the population is a fundamental gap in knowledge. Large numbers of smelt are lost to the CVP and SWP water export facilities located in the south Delta, various smaller facilities (e.g. North Bay Aqueduct, PG&E powerplant), as well as about 2,200 agricultural diversions in the Delta (Herren and Kawasaki 2001). Relative to other factors, reasonably accurate estimates of delta smelt
34
San Francisco Estuary and Watershed Science Vol. 3, Iss. 2 [September 2005], Art. 1
http://repositories.cdlib.org/jmie/sfews/vol3/iss2/art1
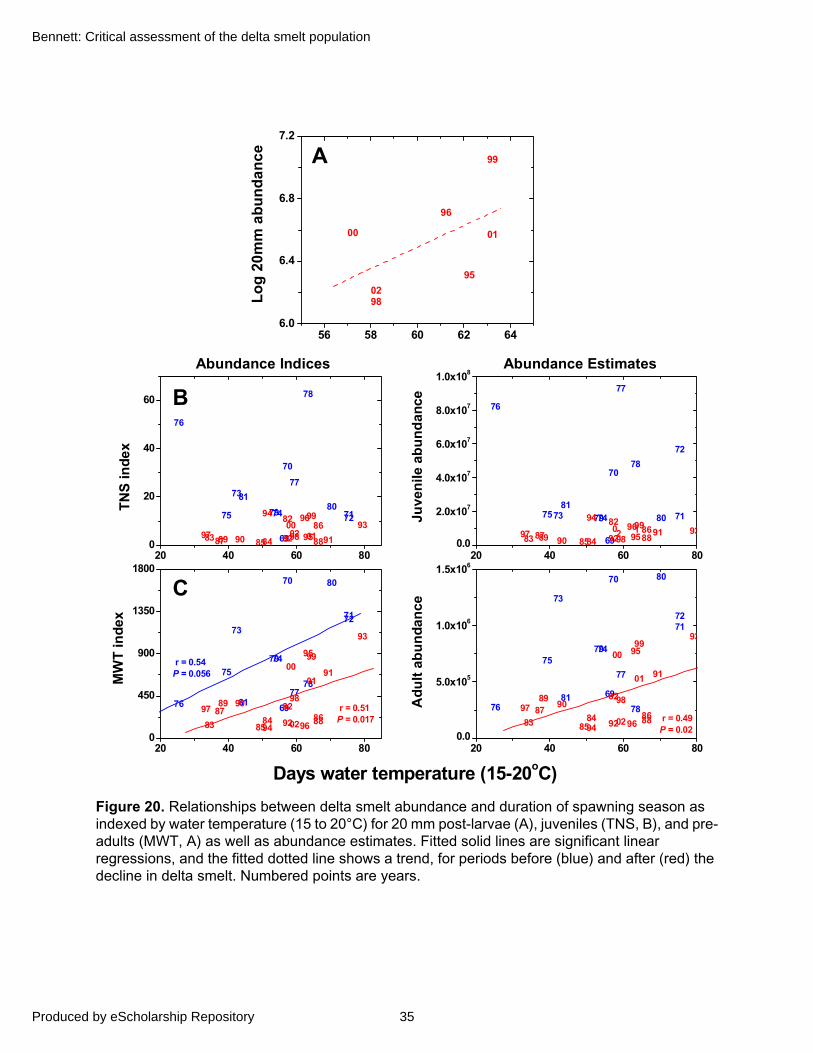
Figure 20. Relationships between delta smelt abundance and duration of spawning season as indexed by water temperature (15 to 20°C) for 20 mm post-larvae (A), juveniles (TNS, B), and pre-adults (MWT, A) as well as abundance estimates. Fitted solid lines are significant linear regressions, and the fitted dotted line shows a trend, for periods before (blue) and after (red) the decline in delta smelt. Numbered points are years.
20 40 60 800.0
5.0x10⁵
1.0x10⁶
1.5x10⁶
20 40 60 800
450
900
1350
180020 40 60 80
0
20
40
60
20 40 60 800.0
2.0x10⁷
4.0x10⁷
6.0x10⁷
8.0x10⁷
1.0x10⁸
69
70
7172
73
7475
76
77
78
79
80
81 82
83 8485
8687
88
8990
91
92
93
94
95
96
9798
9900
01
02
69
70
717273
74
75
7677
78
79
80
81 82
83 8485
8687
88
89 90
91
92
93
94
95
96
9798
9900
01
02
69
70
7172
73
7475
76
77
78
7980
81
82
83 8485
86
87 8889 90 9192
9394
95
96
97 98
9900
010269
70
71
72
73 7475
76
77
78
79 80
81
82
83 848586
87 8889 9091
9293
94
9596
9798
990 12
Ad
ult
ab
un
dan
ce
r = 0.49P = 0.02
r = 0.54P = 0.056
MW
T in
dex
Days water temperature (15-20oC)
r = 0.51P = 0.017
TN
S in
de
x
Juve
nile
ab
un
dan
ce
56 58 60 62 646.0
6.4
6.8
7.2
95
96
98
99
00 01
02
Lo
g 2
0m
m a
bu
nd
an
ce A
B
C
Abundance Indices Abundance Estimates
35
Bennett: Critical assessment of the delta smelt population
Produced by eScholarship Repository
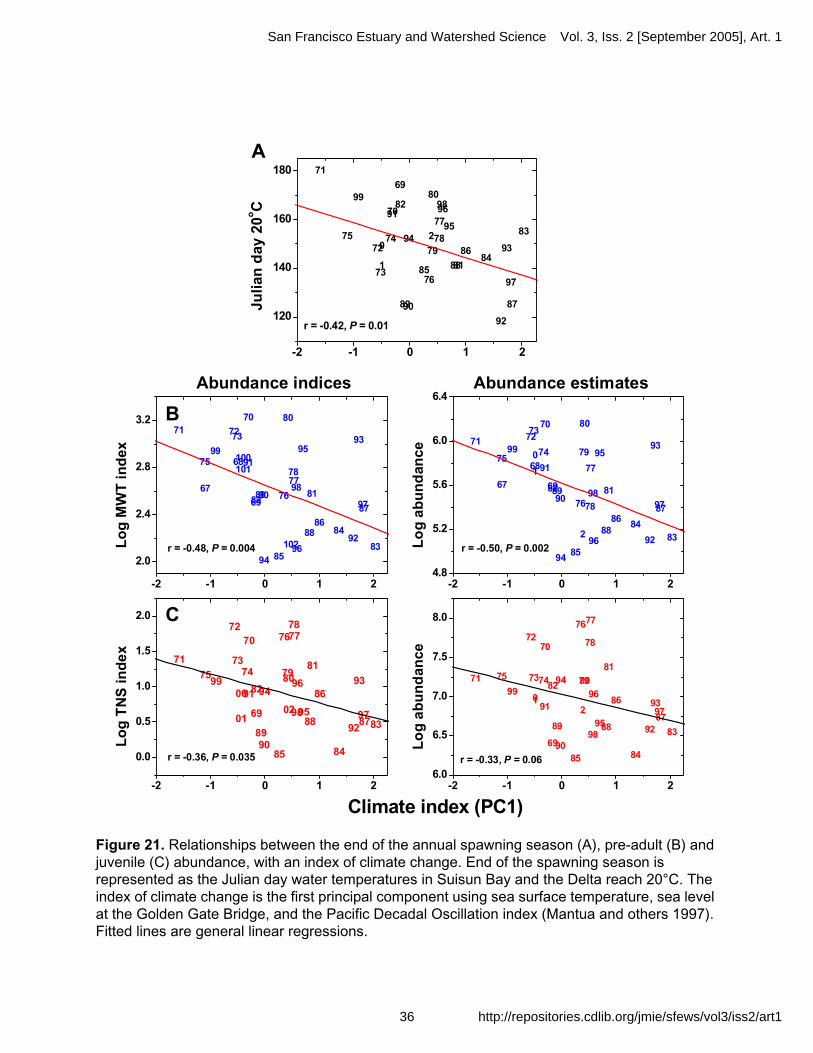
Figure 21. Relationships between the end of the annual spawning season (A), pre-adult (B) and juvenile (C) abundance, with an index of climate change. End of the spawning season is represented as the Julian day water temperatures in Suisun Bay and the Delta reach 20°C. The index of climate change is the first principal component using sea surface temperature, sea level at the Golden Gate Bridge, and the Pacific Decadal Oscillation index (Mantua and others 1997). Fitted lines are general linear regressions.
-2 -1 0 1 2
120
140
160
18069
70
71
72
73
7475
76
77
7879
80
81
82
83
8485
86
87
88
8990
91
92
9394
95
96
97
9899
0
1
2
r = -0.42, P = 0.01
Juli
an d
ay 2
0oC
-2 -1 0 1 2
2.0
2.4
2.8
3.2
-2 -1 0 1 2
0.0
0.5
1.0
1.5
2.0
-2 -1 0 1 26.0
6.5
7.0
7.5
8.0
-2 -1 0 1 24.8
5.2
5.6
6.0
6.4
67
68
69
7071 7273
75
76
7778
80
8182
83
84
85
86
87
88
8990
91
92
93
94
95
96
97
98
99100101
102
69
70
71
72
737475
767778
798081
82
83
8485
86
87888990
91
92
9394
95
96
9798
9900
0102
69
70
71
72
737475
7677
78
7980
81
82
83
8485
86
878889
90
91
92
93
94
95
96
97
98
9901
2
67
68
69
70
71 7273
7475
76
77
78
79
80
8182
8384
85
8687
88
8990
91
92
93
94
95
96
9798
990
1
2
r = -0.33, P = 0.06
r = -0.50, P = 0.002
r = -0.36, P = 0.035
Lo
g M
WT
in
dex
r = -0.48, P = 0.004
Lo
g T
NS
ind
ex
Lo
g a
bu
nd
ance
Climate index (PC1)
Lo
g a
bu
nd
ance
A
B
C
Abundance indices Abundance estimates
36
San Francisco Estuary and Watershed Science Vol. 3, Iss. 2 [September 2005], Art. 1
http://repositories.cdlib.org/jmie/sfews/vol3/iss2/art1

lost to the major facilities are recorded for fish larger than about 20 mm FL (Figure 2). Although there has been an effort to salvage these fish and return them to the system, delta smelt are very fragile and most of them die druing the salvage process. Losses of fish smaller than about 20 mm (larvae) can not be determined and are a key uncertainty for evaluating the effects of water operations. In addition, the numbers of fish entrained in the many smaller, mostly agricultural, diversions are also unknown. Understanding total entrainment losses is essential. For example, juvenile abundance (TNS) is positively associated with the salvage of fish >20 mm, but negatively associated with total water exported from the south Delta water facilities (Figure 22). Thus, the number salvaged merely tracks the abundance of juveniles, but total water exported may serve as a proxy describing losses of larvae <20 mm, as well as juveniles. In several respects, losses to the water export facilities are analogous to harvest in a fishery, with the main exception that “harvest” in this case includes all life stages (except eggs).
As first step, assessing the potential impacts of the water project operations on delta smelt requires estimating the proportion lost relative to population abundance. Initial attempts to examine proportional losses were sparked by high entrainment of juveniles in May–June 1999. Entrainment at the CVP and SWP exceeded the Federal incidental takelimits by nearly seven-fold (Nobriga and others 1999). (Incidental take limits are specified by the USFWS to avoid jeopardizing the persistence of the species.) Ensuing restrictions on freshwater export pumping may have curbed further mortality, but raised serious questions over the potential impacts to the delta smelt population. As a result, three abundance estimates were independently commissioned for delta smelt located in the vicinity of the pumping facilities’ intakes by the USFWS, DWR, and stakeholders (Z. Hymanson, DWR, and C. Hanson, pers. comm.). These approaches similarly extrapolated densities of fish from the
monitoring surveys to the volume of habitat in the south Delta region, and provided estimates of abundance ranging from 4 to 7 million individuals. Although the relative merits of each estimate were subsequently debated, they all fell within an order of magnitude indicating some degree of precision with the extrapolation approach (similar to the one employed here, Figure 3).
Recently, an alternative analysis suggested that water exports can have high impacts on post-larval and juvenile delta smelt. Kimmerer (San Francisco State University, pers. comm.) calculated the flux of post-larvae from the south Delta as a fraction of the total daily catch in the 20-mm Survey. Estimates of the percent of post-larvae exported per day from the Delta and Suisun Bay were generally negligible ranging from 0 for most days to about 4.5% in the peak episode during 1999 (Figure 23A). At first glance this suggests that impacts on post-larvae may have been very low since the survey began in 1995. Kimmerer then estimated the daily number of juveniles exported from the south Delta as a proportion of total caught in the TNS (Figure 23B). Although these estimates also suggest daily export rate is minor (ranging from about 0 to 0.6% per day), the percent lost can be quite large if they accumulate over the duration of each survey. For example, estimated cumulative impacts of exports have ranged from 0 in 1995 to about 60% in 1999 for post-larvae. For juveniles, average daily export rates were about 0.4% during 1985, however over a 60-day period the cumulative impact on juveniles would about 24% (Figure 23B). Yet, losses of this magnitude have been intermittent and primarily during the early part of the time series. In addition, they also decline abruptly during each season as the population distribution shifts away from the south Delta, indicating that losses have been higher for earlier spawned fish (Figure 23). However, these results should be viewed as speculative considering the large uncertainties associated with the sampling efficiencies of the monitoring surveys (see “Population Abundance”).
37
Bennett: Critical assessment of the delta smelt population
Produced by eScholarship Repository

Figure 22. Relationships between juvenile abundance (TNS) with the estimated number of fish lost in water project operations (salvage) (A) and total water exported by the California State Water Project (SWP) and Federal Central Valley Project (CVP) (B). Fitted lines are linear regressions.
In reality, however, estimating the proportion lost to exports misrepresents their actual impact on the population, especially during years if and when other sources of mortality (e.g. density dependent effects) are important at later life stages. As in many fisheries, estimates of “harvest” by the water export facilities also need to be evaluated in the context of other sources of mortality. In years of high juvenile abundance, density dependent effects may minimize the impact of export losses. For example, even though an estimated 73,380 juveniles were lost during spring 1999 (Nobriga and others 1999), adult abundance later in the year (MWT = 864) was one of the highest recorded since the
population declined. Thus, fish lost to entrainment in export facilities in some years may not have survived anyway. Conversely, in years when few cohorts are spawned (e.g., during warm years such as 1983; Figures 11, 16), entrainment losses may severely affect year-class success. However, even in years of low abundance it is possible that many fish lost in the water exports were weak and destined to die after exposure to toxic chemicals or low feeding success. Thus it is unlikely that losses of young fish to the export facilities consistently reflect a direct impact on recruitment success later in the year. These issues cannot be resolved without a comprehensive program to investigate the delta smelt population.
3.0 3.5 4.0 4.5 5.0 5.5
6.3
6.6
6.9
7.2
7.5
3.0 3.5 4.0 4.5 5.0 5.5
0.0
0.3
0.6
0.9
1.2
1.5
2.0x10⁴ 4.0x10⁴ 6.0x10⁴ 8.0x10⁴ 1.0x1056.0
6.5
7.0
7.5
8.0
2.0x10⁴ 4.0x10⁴ 6.0x10⁴ 8.0x10⁴ 1.0x10⁵
0.0
0.5
1.0
1.5
2.0
79 80
81
82
83
8485
86
87
8889
90
91
92
93
94
95
96
97
98
9901
2
7980
81
82
83
8485
86
8788
89 909192
93
94
95
96
9798
99
0
12
69
70
71
72
73 74 75
7677
78
7980
81
82
83
84 85
86
8788 89
90
91
92
93
94
95
96
97
98
9901
2
69
70
71 72
73
74 75
76
77
78
7980
81
82
83
8485
86
8788
89909192
93
94
95
96
9798
99
0
12
r = 0.47P = 0.02
Log total salvage
r = 0.36P = 0.08
Lo
g a
bu
nd
ance
Lo
g a
bu
nd
ance
Total exports (cm sec-1)
r = -0.35P = 0.04
Lo
g T
NS
ind
ex
r = -0.34P = 0.05
Lo
g T
NS
ind
ex
A
B
Abundance indices Abundance estimates
38
San Francisco Estuary and Watershed Science Vol. 3, Iss. 2 [September 2005], Art. 1
http://repositories.cdlib.org/jmie/sfews/vol3/iss2/art1
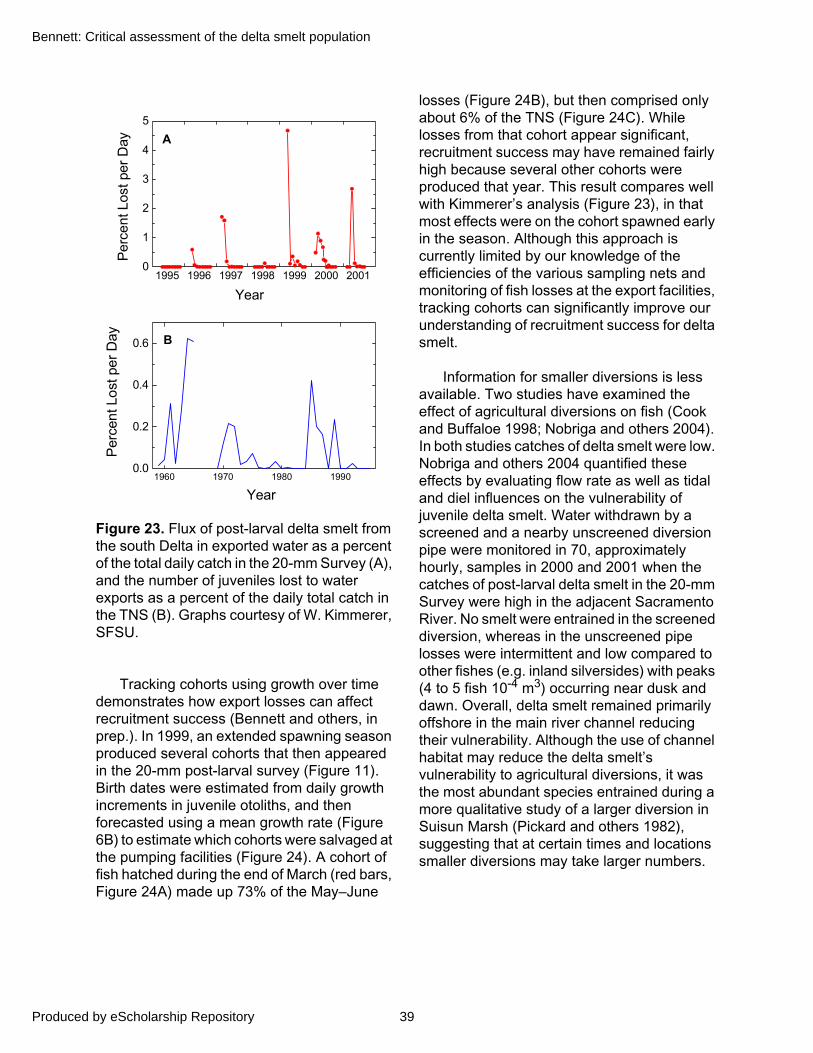
Figure 23. Flux of post-larval delta smelt from the south Delta in exported water as a percent of the total daily catch in the 20-mm Survey (A), and the number of juveniles lost to water exports as a percent of the daily total catch in the TNS (B). Graphs courtesy of W. Kimmerer, SFSU.
Tracking cohorts using growth over time demonstrates how export losses can affect recruitment success (Bennett and others, in prep.). In 1999, an extended spawning season produced several cohorts that then appeared in the 20-mm post-larval survey (Figure 11). Birth dates were estimated from daily growth increments in juvenile otoliths, and then forecasted using a mean growth rate (Figure 6B) to estimate which cohorts were salvaged at the pumping facilities (Figure 24). A cohort of fish hatched during the end of March (red bars, Figure 24A) made up 73% of the May–June
losses (Figure 24B), but then comprised only about 6% of the TNS (Figure 24C). While losses from that cohort appear significant, recruitment success may have remained fairly high because several other cohorts were produced that year. This result compares well with Kimmerer’s analysis (Figure 23), in that most effects were on the cohort spawned early in the season. Although this approach is currently limited by our knowledge of the efficiencies of the various sampling nets and monitoring of fish losses at the export facilities, tracking cohorts can significantly improve our understanding of recruitment success for delta smelt.
Information for smaller diversions is less available. Two studies have examined the effect of agricultural diversions on fish (Cook and Buffaloe 1998; Nobriga and others 2004). In both studies catches of delta smelt were low. Nobriga and others 2004 quantified these effects by evaluating flow rate as well as tidal and diel influences on the vulnerability of juvenile delta smelt. Water withdrawn by a screened and a nearby unscreened diversion pipe were monitored in 70, approximately hourly, samples in 2000 and 2001 when the catches of post-larval delta smelt in the 20-mm Survey were high in the adjacent Sacramento River. No smelt were entrained in the screened diversion, whereas in the unscreened pipe losses were intermittent and low compared to other fishes (e.g. inland silversides) with peaks (4 to 5 fish 10-4 m3) occurring near dusk and dawn. Overall, delta smelt remained primarily offshore in the main river channel reducing their vulnerability. Although the use of channel habitat may reduce the delta smelt’s vulnerability to agricultural diversions, it was the most abundant species entrained during a more qualitative study of a larger diversion in Suisun Marsh (Pickard and others 1982), suggesting that at certain times and locations smaller diversions may take larger numbers.
1995 1996 1997 1998 1999 2000 20010
1
2
3
4
5
Year
Per
cent
Los
t per
Day
1960 1970 1980 19900.0
0.2
0.4
0.6
Year
Per
cent
Los
t per
Day
A
B
39
Bennett: Critical assessment of the delta smelt population
Produced by eScholarship Repository

Figure 24. Potential loss of juvenile cohorts to the water export facilities in 1999. (A) Birth dates back-calculated from juvenile (TNS) otoliths (colored bars) with RMS tidal velocity (black line) and water temperature (blue line) during spring 1999. (B) Size-frequency distributions of fish lost to the water export facilities (salvage) and that subsequently appear in the (C) juvenile TNS.
0
1
2
3
4
5
La
rvae
hat
ched
24
30
36
RM
S (
cm s
ec-1 1
0-3)
15
20
25
Tem
per
atu
re (
oC
)Otolith Birth Dates
April 1 April 20 May 15 June 9 June 14
A
20 30 40 50 600
153045
July 1-13
Size class (FL, mm)
4080
120June 16-30
60120180
Ab
un
dan
ce
June 1-15
125250375
May 17-31
15304560
May 1-17
BSalvage Facilities Tow Net Survey
0
9
18
27
36
August 04
July 21
Ab
un
dan
ce
60 50 40 30 2006
121824
Size class (FL, mm)
C
40
San Francisco Estuary and Watershed Science Vol. 3, Iss. 2 [September 2005], Art. 1
http://repositories.cdlib.org/jmie/sfews/vol3/iss2/art1
If juveniles are vulnerable to many sources of mortality, should adults be given higher priority for protection? Intuitively it makes sense that adults would be worth more to the population because they have successfully avoided many risks. Previous analyses identified significant relationships between losses of pre-spawning adults in winter salvage and subsequent year class success, suggesting it may be beneficial to reduce water project impacts on this life stage (Bennett, unpublished analyses). However, relationships between pre-spawning adults and winter salvage no longer hold with more recent data included in the analyses.
Population modeling may be the best way to evaluate the potential impacts of water export operations relative to other sources of mortality. Here, I develop a stage-structured population model to examine potential tradeoffs among sources of mortality acting on different cohorts and life stages (Bennett, in prep.). These deterministic linear models incorporate relative survival and fecundity among life stages, assuming that all individuals in an age-class are identical and that the vital rates remain constant over time (Caswell 2001). Because delta smelt is primarily an annual species where seasonal processes dominate, I developed a periodic-stage model (Caswell 2001) that projects population abundance among years based on the dynamics of several seasonal matrices. I then use this modeling approach as a heuristic tool to analyze (1) model sensitivity (elasticities) as measured by the proportional contribution of each cohort and life stage to population growth (intrinsic rate of growth, r), and (2) simulations of the effect of changing key parameters on “r” for models with and without mortality due to water exports.
The model is composed of three seasonal matrices that roughly represent spring (March–June), summer (July–September), and fall-winter (October–February). Because this is a
stage-model it is not necessary for each season to be of equal length (Caswell 2001). Among each season the model tracks the relative survival of two cohorts of individuals that were born early versus late in spring (Figure 25). The cohorts are represented as large (early-spawned) and small (late-spawned) individuals because at the time of transition to the next season (June 30) many fishes spawned early would be larger than those born later. Survival estimates were calculated as the average slope of fitted regression lines from catch curves between the abundance estimates for eggs, larvae (20-mm abundance), juveniles (TNS abundance), and adults (MWT abundance) from 1995–2003 (Figure 26). Egg abundances were calculated by weighting adult abundance by the average fecundity of females <80 mm FL from aquaculture (2,100 eggs, Figure 9; B. Baskerville-Bridges, UCD, pers. comm.) assuming a 50:50 sex ratio. Apparent size-selective bias of post-larvae by the sampling gear early in the season produced abundance estimates that were lower than those for juveniles in the TNS survey: a biological impossibility that would severely bias survival estimates. To help account for this, post-larval abundances were calculated using only surveys in which the mean length of fish was >20 mm FL, but even with this adjustment the estimates still contain size-selective bias.
The model requires two fecundity and five survival parameters to estimate the transition probabilities between successive seasons (Table 2). Large larvae are assumed to transition into large juveniles and adults, whereas small larvae transition as 25% large and 75% small juveniles and adults. Large adults are then assumed to spawn primarily early in the season producing 75% large and 25% small larvae, whereas small adults spawn evenly throughout the season producing 50% large and 50% small larvae. These proportions were chosen to reflect the potential that large
41
Bennett: Critical assessment of the delta smelt population
Produced by eScholarship Repository
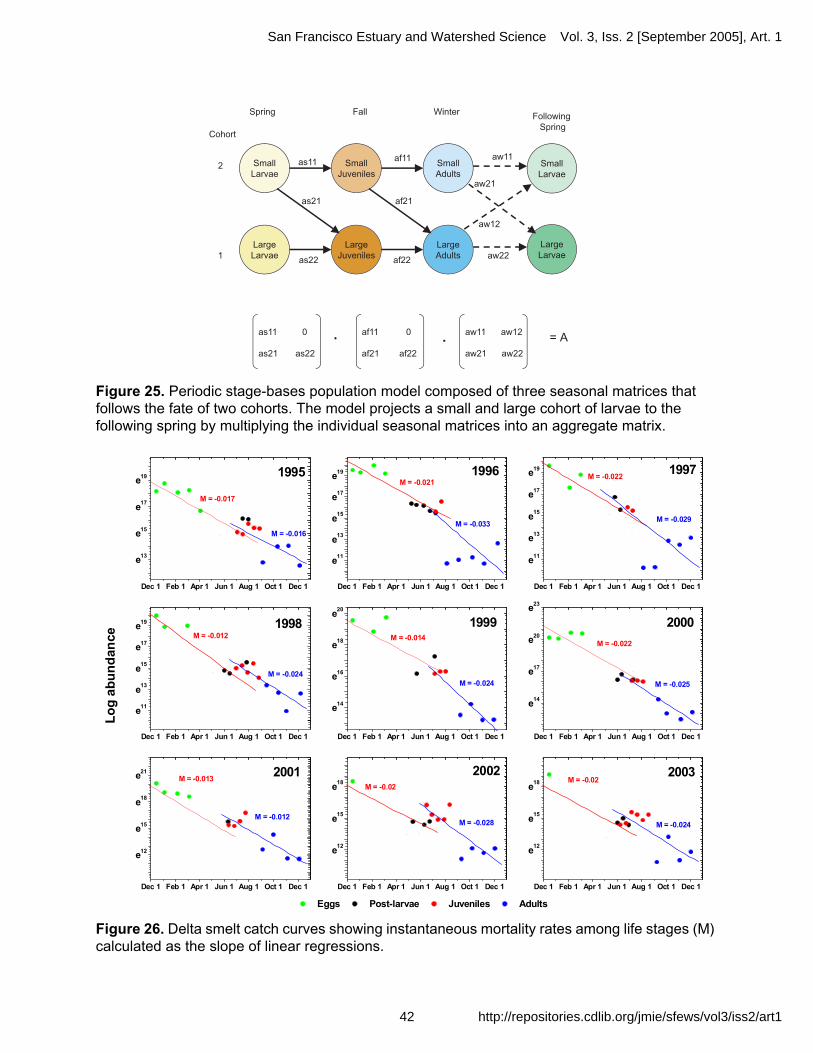
Figure 25. Periodic stage-bases population model composed of three seasonal matrices that follows the fate of two cohorts. The model projects a small and large cohort of larvae to the following spring by multiplying the individual seasonal matrices into an aggregate matrix.
Figure 26. Delta smelt catch curves showing instantaneous mortality rates among life stages (M) calculated as the slope of linear regressions.
Dec 1 Feb 1 Apr 1 Jun 1 Aug 1 Oct 1 Dec 1
e13
e15
e17
e19
Dec 1 Feb 1 Apr 1 Jun 1 Aug 1 Oct 1 Dec 1
e11
e13
e15
e17
e19
Dec 1 Feb 1 Apr 1 Jun 1 Aug 1 Oct 1 Dec 1
e11
e13
e15
e17
e19
Dec 1 Feb 1 Apr 1 Jun 1 Aug 1 Oct 1 Dec 1
e11
e13
e15
e17
e19
Dec 1 Feb 1 Apr 1 Jun 1 Aug 1 Oct 1 Dec 1
e14
e16
e18
e20
Dec 1 Feb 1 Apr 1 Jun 1 Aug 1 Oct 1 Dec 1
e14
e17
e20
e23
Dec 1 Feb 1 Apr 1 Jun 1 Aug 1 Oct 1 Dec 1
e12
e15
e18
e21
Dec 1 Feb 1 Apr 1 Jun 1 Aug 1 Oct 1 Dec 1
e12
e15
e18
Dec 1 Feb 1 Apr 1 Jun 1 Aug 1 Oct 1 Dec 1
e12
e15
e18
M = -0.017
19971996
M = -0.016
1995M = -0.021
M = -0.033
Eggs Post-larvae Juveniles Adults
M = -0.022
M = -0.029
M = -0.012
M = -0.024
Lo
g a
bu
nd
ance
19991998
M = -0.014
M = -0.024
2001
2000
M = -0.022
M = -0.025
M = -0.02
M = -0.012
M = -0.0132003
M = -0.028
2002
M = -0.02
M = -0.024
42
San Francisco Estuary and Watershed Science Vol. 3, Iss. 2 [September 2005], Art. 1
http://repositories.cdlib.org/jmie/sfews/vol3/iss2/art1

adults may mature earlier in the season than small adults. In the future, model sensitivity to changes in these proportions would be worthwhile to examine, but for this example they remain fixed. Large adults were also assumed to produce more eggs!(median = 3,283; 77 to 93 mm FL) than small adults (median = 1,870; <75 mm FL) again based on Baskerville-Bridges’ relationship (Figure 9). Export losses of fish were assumed
to affect only large (early-spawned) post-larvae and were calculated from estimated losses per day in spring 1999 (Figure 23A, W. Kimmerer, San Francisco State University, pers. comm.).
Separate models, with and without export mortality, project the numbers of large and small larvae from spring to the following spring by calculating the product of the three seasonal
Table 2. The definition and estimates of parameters and transitions used in the periodic stage model for the delta smelt population
Transitions / Definition Estimate
Parameters
Fecundity small female eggs 1870/2 = 935
Fecundity large female eggs 3283/2 = 1642
Survival
Fall adult to spring adult 0.59
Spring egg abundance to larvae 0.018
Larvae to juvenile 0.83
Exports during larval stage 0.40
Juvenile to fall adult 0.09
Spring
as11 – Probability of small larvae becoming a small juvenile 0.83 x 0.75 = 0.62
as21 – Probability of small larvae becoming a large juvenile 0.83 x 0.25 = 0.21
as22 – Probability of large larvae becoming a large juvenile 0.83
as22 – Probability of large larvae becoming a large juvenile with!export mortality 0.83 x 0.40 = 0.332
Fall
af11 – Probability of small juvenile becoming a small adult 0.09 x 0.75 = 0.067
af21 – Probability of small juvenile becoming a large adult 0.09 x 0.25 = 0.023
af22 – Probability of large juvenile becoming a large adult 0.09
Winter
aw11 – Number of small larvae produced by small adults 935 x 0.018 x 0.59 x 0.5 = 4
aw21 – Number of large larvae produced by small adults 935 x 0.018 x 0.59 x 0.5 = 4
aw22 – Number of large larvae produced by large adults 1642 x 0.018 x 0.59 x 0.75 = 13
aw12 – Number of small larvae produced by large adults 1642 x 0.018 x 0.59 x 0.25 = 4
43
Bennett: Critical assessment of the delta smelt population
Produced by eScholarship Repository
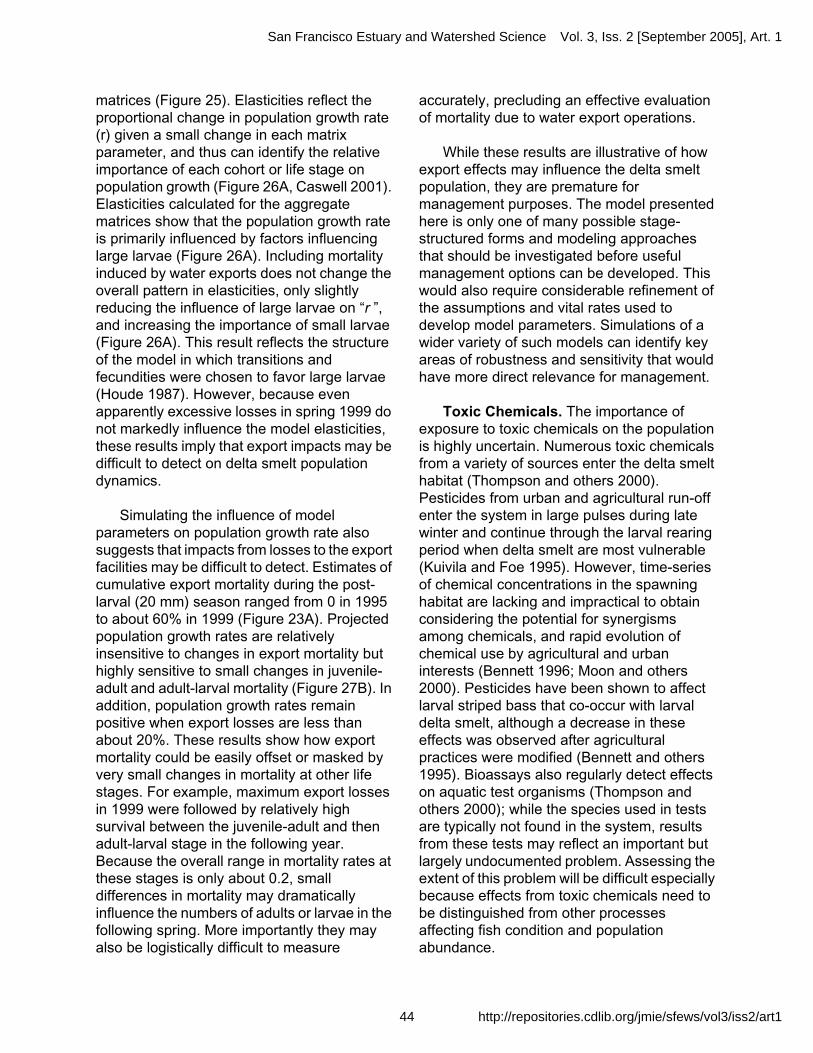
matrices (Figure 25). Elasticities reflect the proportional change in population growth rate (r) given a small change in each matrix parameter, and thus can identify the relative importance of each cohort or life stage on population growth (Figure 26A, Caswell 2001). Elasticities calculated for the aggregate matrices show that the population growth rate is primarily influenced by factors influencing large larvae (Figure 26A). Including mortality induced by water exports does not change the overall pattern in elasticities, only slightly reducing the influence of large larvae on “r ”, and increasing the importance of small larvae (Figure 26A). This result reflects the structure of the model in which transitions and fecundities were chosen to favor large larvae (Houde 1987). However, because even apparently excessive losses in spring 1999 do not markedly influence the model elasticities, these results imply that export impacts may be difficult to detect on delta smelt population dynamics.
Simulating the influence of model parameters on population growth rate also suggests that impacts from losses to the export facilities may be difficult to detect. Estimates of cumulative export mortality during the post-larval (20 mm) season ranged from 0 in 1995 to about 60% in 1999 (Figure 23A). Projected population growth rates are relatively insensitive to changes in export mortality but highly sensitive to small changes in juvenile-adult and adult-larval mortality (Figure 27B). In addition, population growth rates remain positive when export losses are less than about 20%. These results show how export mortality could be easily offset or masked by very small changes in mortality at other life stages. For example, maximum export losses in 1999 were followed by relatively high survival between the juvenile-adult and then adult-larval stage in the following year. Because the overall range in mortality rates at these stages is only about 0.2, small differences in mortality may dramatically influence the numbers of adults or larvae in the following spring. More importantly they may also be logistically difficult to measure
accurately, precluding an effective evaluation of mortality due to water export operations.
While these results are illustrative of how export effects may influence the delta smelt population, they are premature for management purposes. The model presented here is only one of many possible stage-structured forms and modeling approaches that should be investigated before useful management options can be developed. This would also require considerable refinement of the assumptions and vital rates used to develop model parameters. Simulations of a wider variety of such models can identify key areas of robustness and sensitivity that would have more direct relevance for management.
Toxic Chemicals. The importance of exposure to toxic chemicals on the population is highly uncertain. Numerous toxic chemicals from a variety of sources enter the delta smelt habitat (Thompson and others 2000). Pesticides from urban and agricultural run-off enter the system in large pulses during late winter and continue through the larval rearing period when delta smelt are most vulnerable (Kuivila and Foe 1995). However, time-series of chemical concentrations in the spawning habitat are lacking and impractical to obtain considering the potential for synergisms among chemicals, and rapid evolution of chemical use by agricultural and urban interests (Bennett 1996; Moon and others 2000). Pesticides have been shown to affect larval striped bass that co-occur with larval delta smelt, although a decrease in these effects was observed after agricultural practices were modified (Bennett and others 1995). Bioassays also regularly detect effects on aquatic test organisms (Thompson and others 2000); while the species used in tests are typically not found in the system, results from these tests may reflect an important but largely undocumented problem. Assessing the extent of this problem will be difficult especially because effects from toxic chemicals need to be distinguished from other processes affecting fish condition and population abundance.
44
San Francisco Estuary and Watershed Science Vol. 3, Iss. 2 [September 2005], Art. 1
http://repositories.cdlib.org/jmie/sfews/vol3/iss2/art1

Figure 27. (A) Model sensitivity as represented by the elasticities, or proportional contribution of small and large larvae to the intrinsic population growth rate, using the aggregate matrices for models with and without mortality due to exports. (B) Influence on the population growth rate of variations in mortality due to exports, as well as between the juvenile to adult, and adult to larvae in the following spring. Years represent the range mortalities observed since 1994 as well as 1999.
Small Large Small Large0.0
0.1
0.2
0.3
0.4
0.5
0.6
Ch
an
ge
in
ra
te o
f in
cre
as
e,
r without exports with exports
Survival & reproductionfrom small larvae to
Survival & reproductionfrom large larvae to
larvae larvae larvae larvae
0.0 0.2 0.4 0.6 0.8 1.0
-0.9
-0.6
-0.3
0.0
0.3
0.6
0.9
-0.9
-0.6
-0.3
0.0
0.3
0.6
0.91995
1999
1999
2000
1995
1994
1995
Large juv-adult
Intr
ins
ic r
ate
of
inc
rea
se, r
Mortality
1999
Exports
Large adult-larvae
A
B
45
Bennett: Critical assessment of the delta smelt population
Produced by eScholarship Repository
Recent investigations demonstrate that an integrated application of toxicological and ecological techniques can be useful for evaluating chemical effects on delta smelt (Bennett and others, in prep.). Numerous pesticides were found to occur where post-larval delta smelt were collected in 1998–2000 (Moon and others 1999; Kuivila and Moon 2002, 2004; Figure 28A). Examinations of these specimens using two biomarker approaches, the “comet” assay and histopathology, indicated that about 10% had fragmented DNA in blood cells (Figure 28B), as well as cancerous cells and abnormalities in the organelle structure of livers (Figure 28C). These biomarkers can reliably detect exposure and organ damage that can impair reproductive success and survival (Anderson and Wild 1994; Teh and others 1997). Furthermore, the liver biomarkers indicated that 30% of the individuals were undernourished but were not affected by the pesticides (Figure 28C). Laboratory experiments show that undernourished individuals lack glycogen in their livers, whereas those damaged by toxic chemicals also have a variety of other abnormalities (Bennett and others, in prep.). Although the extent of impairment due to toxic exposure appeared minor using these techniques on samples taken in 1999–2000, the high variability in toxic exposure among years suggests this may not always be the case. Current applications of pyrethroid pesticides pose an important threat, because they are known to cause DNA fragmentation and interfere with endocrine development in fishes exposed to very low doses (in the g L-1 range, Capana and others 1999). Methods to detect concentrations of pyrethroid pesticides in the delta smelt habitat are currently under development (K. Kuivila, USGS, pers. comm.).
Larval Feeding Success and Exotic Species. As discussed previously, delta smelt consume copepods almost exclusively throughout their life history. Dramatic changes have occurred in the composition and abundance of delta smelt food resources particularly following invasions by exotic
species. E. affinis was historically the dominant food resource for all life stages of delta smelt. Following the invasion of the overbite clam, Potamocorbula amurensis, in 1987–1988, several copepod species declined sharply, with E. affinis bring replaced over much of its distribution by the exotic copepod, P. forbesi. (Moyle and others 1992; Kimmerer and others 1994; Kimmerer and Orsi 1996). Seasonally, E. affinis is abundant during early to mid-spring and declines in late spring apparently from recruitment failure (W. Kimmerer, SFSU, pers. comm.) and is soon replaced by P. forbesi. This transition period results in a seasonal low in total copepod abundance.
It is reasonable to expect that a decline in overall food supplies would affect delta smelt. Several relationships indicate the declining abundance of E. affinis is associated with delta smelt abundance. For example, Stevens and others (1990) found a significant correlation between total copepod and delta smelt abundance in the MWT. A decade later, Miller (2000) identified a similar relationship between the abundance of E. affinis and the residuals from a stock-recruitment model encompassing the period between the MWT and the following TNS. Average lengths of delta smelt also dropped sharply following the changes in abundance and composition of copepods (Figure 29; Sweetnam 1999). Fish size may have been compromised by an overall reduction in food supplies, or because fish were younger due to shifts of the spawning season into June (Figure 16). However, declines in overall densities of E. affinis are significantly associated with mean lengths in both the MWT and Bay Study surveys (Figure 30), but similar relationships with the estimated end of the spawning season (date of water temperature = 20°C) are not significant. Nonetheless, without information on fish size-at-age derived from otoliths or the efficiencies of the sampling nets we cannot distinguish between these potential reasons for declining fish size.
%
46
San Francisco Estuary and Watershed Science Vol. 3, Iss. 2 [September 2005], Art. 1
http://repositories.cdlib.org/jmie/sfews/vol3/iss2/art1
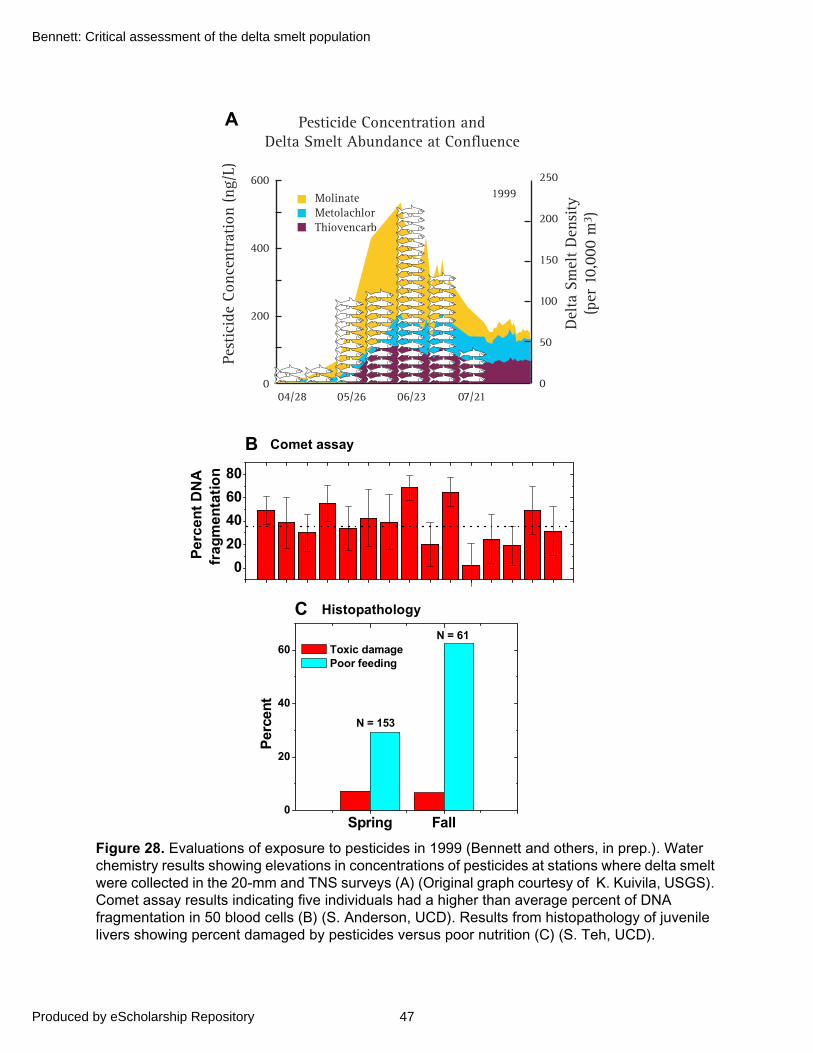
Figure 28. Evaluations of exposure to pesticides in 1999 (Bennett and others, in prep.). Water chemistry results showing elevations in concentrations of pesticides at stations where delta smelt were collected in the 20-mm and TNS surveys (A) (Original graph courtesy of K. Kuivila, USGS). Comet assay results indicating five individuals had a higher than average percent of DNA fragmentation in 50 blood cells (B) (S. Anderson, UCD). Results from histopathology of juvenile livers showing percent damaged by pesticides versus poor nutrition (C) (S. Teh, UCD).
A
Spring Fall0
20
40
60N = 61
N = 153
Per
cen
t
S
Toxic damage Poor feeding
0
20
40
60
80
Per
cen
t D
NA
fr
agm
enta
tio
n
Comet assay
Histopathology
B
C
47
Bennett: Critical assessment of the delta smelt population
Produced by eScholarship Repository
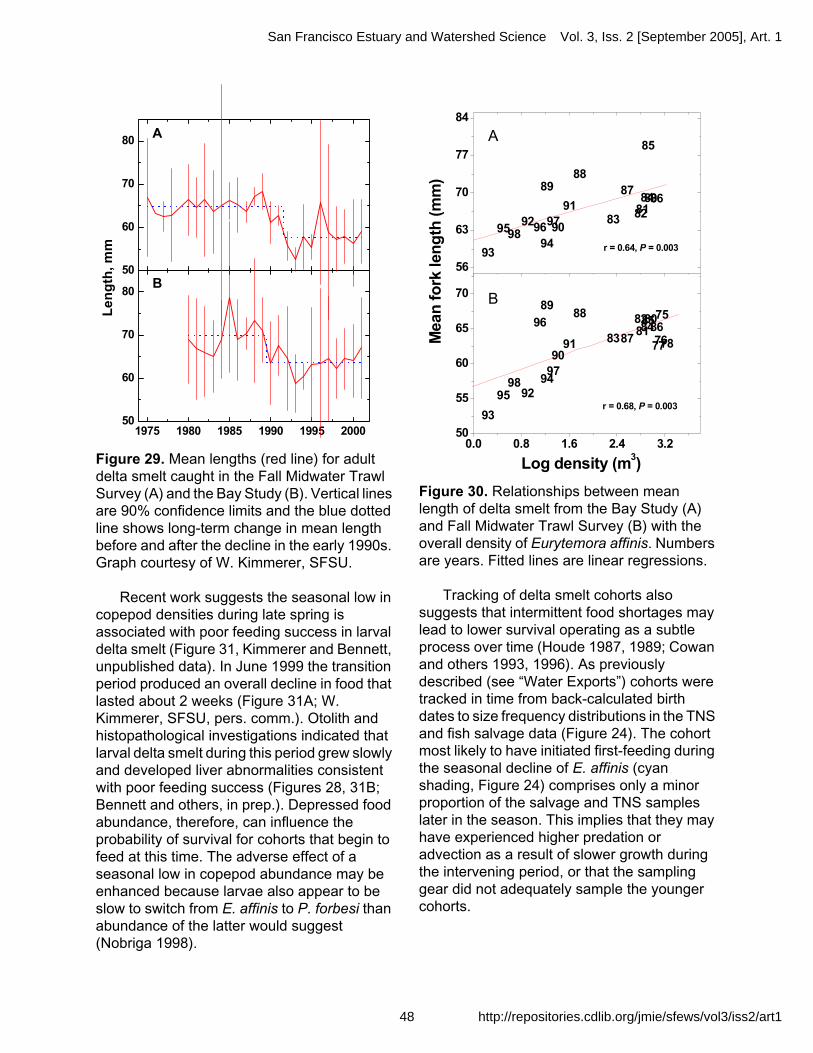
Figure 29. Mean lengths (red line) for adult delta smelt caught in the Fall Midwater Trawl Survey (A) and the Bay Study (B). Vertical lines are 90% confidence limits and the blue dotted line shows long-term change in mean length before and after the decline in the early 1990s. Graph courtesy of W. Kimmerer, SFSU.
Recent work suggests the seasonal low in copepod densities during late spring is associated with poor feeding success in larval delta smelt (Figure 31, Kimmerer and Bennett, unpublished data). In June 1999 the transition period produced an overall decline in food that lasted about 2 weeks (Figure 31A; W. Kimmerer, SFSU, pers. comm.). Otolith and histopathological investigations indicated that larval delta smelt during this period grew slowly and developed liver abnormalities consistent with poor feeding success (Figures 28, 31B; Bennett and others, in prep.). Depressed food abundance, therefore, can influence the probability of survival for cohorts that begin to feed at this time. The adverse effect of a seasonal low in copepod abundance may be enhanced because larvae also appear to be slow to switch from E. affinis to P. forbesi than abundance of the latter would suggest (Nobriga 1998).
Figure 30. Relationships between mean length of delta smelt from the Bay Study (A) and Fall Midwater Trawl Survey (B) with the overall density of Eurytemora affinis. Numbers are years. Fitted lines are linear regressions.
Tracking of delta smelt cohorts also suggests that intermittent food shortages may lead to lower survival operating as a subtle process over time (Houde 1987, 1989; Cowan and others 1993, 1996). As previously described (see “Water Exports”) cohorts were tracked in time from back-calculated birth dates to size frequency distributions in the TNS and fish salvage data (Figure 24). The cohort most likely to have initiated first-feeding during the seasonal decline of E. affinis (cyan shading, Figure 24) comprises only a minor proportion of the salvage and TNS samples later in the season. This implies that they may have experienced higher predation or advection as a result of slower growth during the intervening period, or that the sampling gear did not adequately sample the younger cohorts.
1975 1980 1985 1990 1995 200050
60
70
80
50
60
70
80
Le
ng
th, m
m
A
B
75
767778
808182
83848586
87
8889
9091
92
93
9495
96
9798
80818283
84
85
8687
8889
90
9192
9394
95 969798
0.0 0.8 1.6 2.4 3.250
55
60
65
70
Log density (m3)
56
63
70
77
84
r = 0.68, P = 0.003
r = 0.64, P = 0.003
Mea
n f
ork
len
gth
(m
m)
A
B
48
San Francisco Estuary and Watershed Science Vol. 3, Iss. 2 [September 2005], Art. 1
http://repositories.cdlib.org/jmie/sfews/vol3/iss2/art1
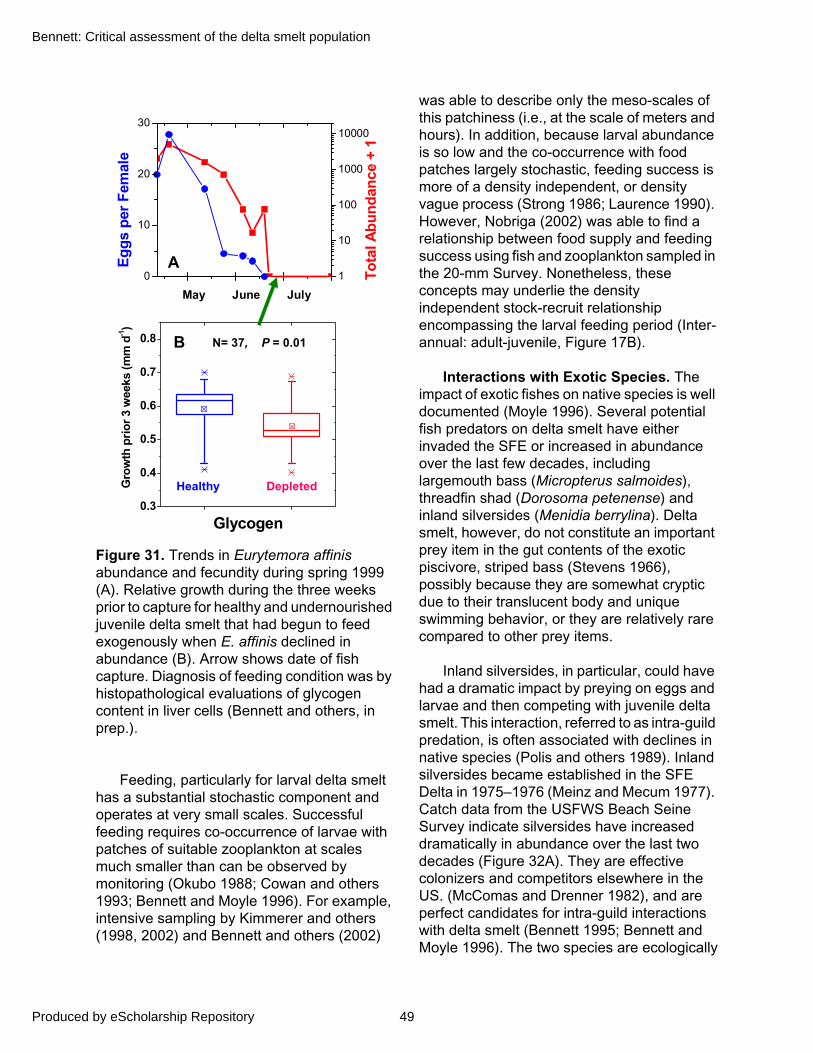
Figure 31. Trends in Eurytemora affinis abundance and fecundity during spring 1999 (A). Relative growth during the three weeks prior to capture for healthy and undernourished juvenile delta smelt that had begun to feed exogenously when E. affinis declined in abundance (B). Arrow shows date of fish capture. Diagnosis of feeding condition was by histopathological evaluations of glycogen content in liver cells (Bennett and others, in prep.).
Feeding, particularly for larval delta smelt has a substantial stochastic component and operates at very small scales. Successful feeding requires co-occurrence of larvae with patches of suitable zooplankton at scales much smaller than can be observed by monitoring (Okubo 1988; Cowan and others 1993; Bennett and Moyle 1996). For example, intensive sampling by Kimmerer and others (1998, 2002) and Bennett and others (2002)
was able to describe only the meso-scales of this patchiness (i.e., at the scale of meters and hours). In addition, because larval abundance is so low and the co-occurrence with food patches largely stochastic, feeding success is more of a density independent, or density vague process (Strong 1986; Laurence 1990). However, Nobriga (2002) was able to find a relationship between food supply and feeding success using fish and zooplankton sampled in the 20-mm Survey. Nonetheless, these concepts may underlie the density independent stock-recruit relationship encompassing the larval feeding period (Inter-annual: adult-juvenile, Figure 17B).
Interactions with Exotic Species. The impact of exotic fishes on native species is well documented (Moyle 1996). Several potential fish predators on delta smelt have either invaded the SFE or increased in abundance over the last few decades, including largemouth bass (Micropterus salmoides), threadfin shad (Dorosoma petenense) and inland silversides (Menidia berrylina). Delta smelt, however, do not constitute an important prey item in the gut contents of the exotic piscivore, striped bass (Stevens 1966), possibly because they are somewhat cryptic due to their translucent body and unique swimming behavior, or they are relatively rare compared to other prey items.
Inland silversides, in particular, could have had a dramatic impact by preying on eggs and larvae and then competing with juvenile delta smelt. This interaction, referred to as intra-guild predation, is often associated with declines in native species (Polis and others 1989). Inland silversides became established in the SFE Delta in 1975–1976 (Meinz and Mecum 1977). Catch data from the USFWS Beach Seine Survey indicate silversides have increased dramatically in abundance over the last two decades (Figure 32A). They are effective colonizers and competitors elsewhere in the US. (McComas and Drenner 1982), and are perfect candidates for intra-guild interactions with delta smelt (Bennett 1995; Bennett and Moyle 1996). The two species are ecologically
May June July
N= 37, P = 0.01
Healthy Depleted
1
10
100
1000
10000
To
tal A
bu
nd
ance
+ 1
0
10
20
30
Eg
gs
per
Fem
ale
A
0.3
0.4
0.5
0.6
0.7
0.8
Gro
wth
pri
or
3 w
eeks
(m
m d
-1)
Glycogen
B
49
Bennett: Critical assessment of the delta smelt population
Produced by eScholarship Repository
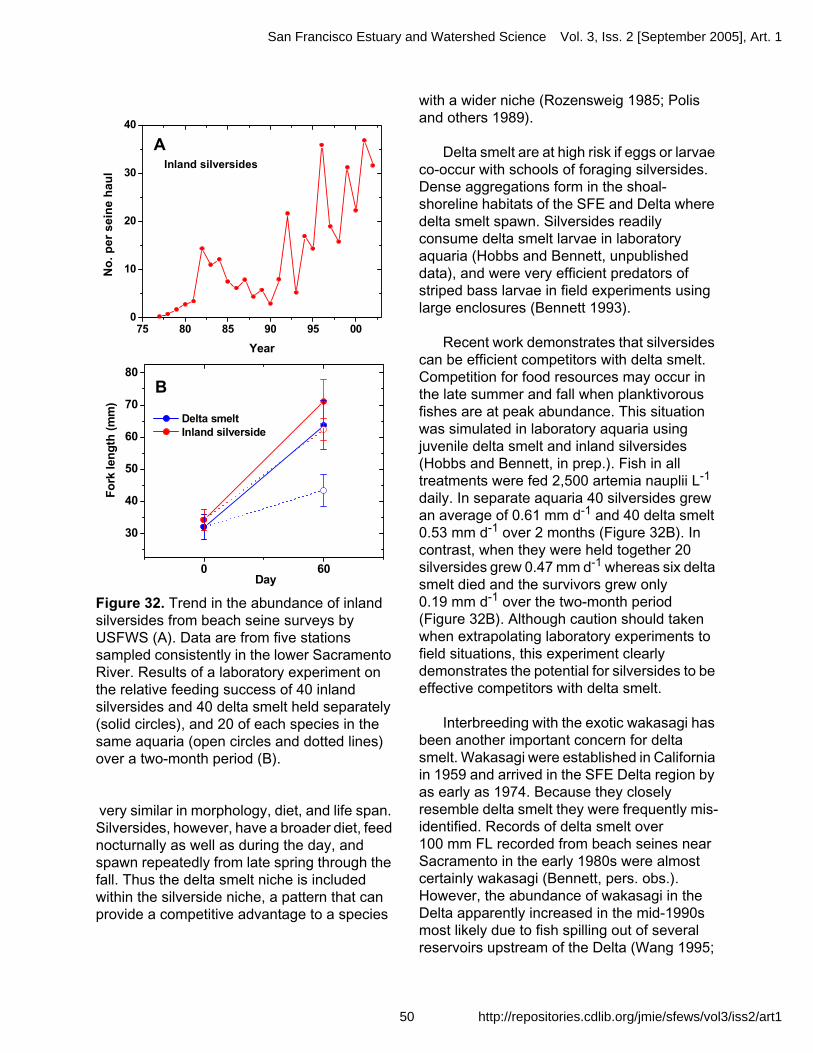
Figure 32. Trend in the abundance of inland silversides from beach seine surveys by USFWS (A). Data are from five stations sampled consistently in the lower Sacramento River. Results of a laboratory experiment on the relative feeding success of 40 inland silversides and 40 delta smelt held separately (solid circles), and 20 of each species in the same aquaria (open circles and dotted lines) over a two-month period (B).
very similar in morphology, diet, and life span. Silversides, however, have a broader diet, feed nocturnally as well as during the day, and spawn repeatedly from late spring through the fall. Thus the delta smelt niche is included within the silverside niche, a pattern that can provide a competitive advantage to a species
with a wider niche (Rozensweig 1985; Polis and others 1989).
Delta smelt are at high risk if eggs or larvae co-occur with schools of foraging silversides. Dense aggregations form in the shoal-shoreline habitats of the SFE and Delta where delta smelt spawn. Silversides readily consume delta smelt larvae in laboratory aquaria (Hobbs and Bennett, unpublished data), and were very efficient predators of striped bass larvae in field experiments using large enclosures (Bennett 1993).
Recent work demonstrates that silversides can be efficient competitors with delta smelt. Competition for food resources may occur in the late summer and fall when planktivorous fishes are at peak abundance. This situation was simulated in laboratory aquaria using juvenile delta smelt and inland silversides (Hobbs and Bennett, in prep.). Fish in all treatments were fed 2,500 artemia nauplii L-1 daily. In separate aquaria 40 silversides grew an average of 0.61 mm d-1 and 40 delta smelt 0.53 mm d-1 over 2 months (Figure 32B). In contrast, when they were held together 20 silversides grew 0.47 mm d-1 whereas six delta smelt died and the survivors grew only 0.19 mm d-1 over the two-month period (Figure 32B). Although caution should taken when extrapolating laboratory experiments to field situations, this experiment clearly demonstrates the potential for silversides to be effective competitors with delta smelt.
Interbreeding with the exotic wakasagi has been another important concern for delta smelt. Wakasagi were established in California in 1959 and arrived in the SFE Delta region by as early as 1974. Because they closely resemble delta smelt they were frequently mis-identified. Records of delta smelt over 100 mm FL recorded from beach seines near Sacramento in the early 1980s were almost certainly wakasagi (Bennett, pers. obs.). However, the abundance of wakasagi in the Delta apparently increased in the mid-1990s most likely due to fish spilling out of several reservoirs upstream of the Delta (Wang 1995;
75 80 85 90 95 000
10
20
30
40
N
o.
per
sei
ne
hau
l
Year
Inland silversides
A
B
0 60
30
40
50
60
70
80
Day
Delta smelt Inland silverside
Fo
rk le
ng
th (
mm
)
50
San Francisco Estuary and Watershed Science Vol. 3, Iss. 2 [September 2005], Art. 1
http://repositories.cdlib.org/jmie/sfews/vol3/iss2/art1

Aasen and others 1998). Subsequent concerns of introgression between wakasagi and delta smelt arose after Wang (1995) identified hybrids between the two species, which were later confirmed by genetic analyses (Moyle 1995). Fortunately, the probability of wakasagi undermining the genetic integrity of delta smelt appears small, because only F1 hybrids have been found and the two species are not closely related genetically (Stanley and others 1995; Trenham and others 1998). However, if abundances increase substantially in the delta smelt habitat, introgression and competition with wakasagi may again be a cause for concern.
Carrying Capacity
All populations are ultimately limited by the capacity of ecosystems to support additional individuals. The stock-recruit relationships (Figures 17 and 18) suggest that density dependence may limit the number of juveniles recruiting to the adult stage in some years during late summer. The asymptotes of the stock-recruit relationships portray long-term average carrying capacities (Figures 17 and 18). Residual values from the fitted lines reflect inter-annual variation in carrying capacity as well as density-independent effects on abundance and sampling error. A variety of prolonged perturbations to the ecosystem may fluctuate in intensity over time to alter carrying capacity for delta smelt, including climate change, water export operations, changes in food resources, and invasions of exotic species.
Density dependence has been most frequently observed in populations where space is limited for reproduction or living space (Elliot 1994; Rose and others 2001). Food limitation is also a likely mechanism for density dependence and may be associated with declining habitat space to define carrying capacity (Cowan and others 2000; Rose and others 2001). Typically, food shortages result in reduced condition, growth rate, or fecundity. Limited evidence for this in delta smelt was observed in 1999–2001, when juvenile
abundance was near the inflection point in the stock-recruit relationship spanning the entire date record (Figure 17), and higher than this level during the post-decline period (Figure 18), i.e. approaching and exceeding carrying capacity. Histopathology and otolith investigations from this time showed that about 60% of 61 juveniles were undernourished with poor glycogen reserves and had slow growth at this time (Figures 28 and 33; Bennett and others, in prep.).
The extent to which delta smelt habitat volume decreases during late summer and fall, however, is unknown. One possibility is that seasonally low outflow and warm water temperatures contribute to concentrate delta smelt in habitat with other planktivorous fishes that are at peak abundance during late summer. The combined effects of all planktivorous fishes on food supplies (i.e. diffuse, or community competition) may then exert density dependent effects and define carrying capacity for delta smelt during late
Figure 33. Relative growth during the 3 weeks prior to capture for healthy and undernourished juvenile delta smelt in August and September 2000. Diagnosis of feeding condition was by histopathological evaluations of glycogen content in liver cells (Bennett and others, in prep.).
0.1
0.2
0.3
0.4
Gro
wth
(m
m d
-1)
Glycogen
N = 42, P = 0.02
51
Bennett: Critical assessment of the delta smelt population
Produced by eScholarship Repository

summer. Droughts may further reduce food availability and heighten these effects. Although this is speculation, it may be worth further examination because the cumulative effects of common species on rare ones can be strong, as was shown by the seminal studies of Zaret and Rand (1971) for fishes in Panamanian streams, as well as in plant communities (Goldberg and others 2001).
Overall, the stock recruit analyses suggest that carrying capacity may currently limit the delta smelt population at lower levels of density than before the population declined in the early 1980s (Figures 17 and 18). This has important implications for restoring the population to historic levels of abundance (see Tables 17-19 in Errkila 1950; Radtke 1966). Given the complex and dramatic changes that have occurred in the food web over the last several decades (Nichols and others 1986; Hollibaugh 1996) this is a reasonable possibility. Unfortunately, there are currently few tools available to management for enhancing carrying capacity. A first step would require investigating potential processes producing density dependence and defining carrying capacity during late summer as juveniles recruit to the pre-adult life stage.
Probability of Extinction
Underlying any decision to remove a species from threatened ESA status is a basis for claiming the probability for further decline, or even extinction, has been reduced since the species was originally listed. A variety of tools has been developed to estimate this potential, collectively called population viability analyses (PVA, Morris and Doak 2002). Here, I provide an analysis of extinction probability for delta smelt using the method developed by Dennis and others (1991). The method assumes that abundance over time in a stochastically changing environment will have a lognormal distribution. For such a population, the time until a defined threshold of abundance will be reached can then be determined by two parameters. The parameter determines the rate at which the mean of the distribution
increases, whereas is a measure of how fast the variance increases over time. Dennis and others (1991) outlined a straightforward method for estimating these parameters using linear regression with zero intercept and a simple transformation of count data that describes the relative amount of change in abundance between successive years:
(2)
(3)
The slope of this regression then is an estimate of and the mean squared residual is an estimate of . From these parameters a variety of measures of population viability can be estimated, particularly the average growth rate, and the median time until abundance will reach an extinction threshold. Typically, these are summarized in the cumulative distribution function (CDF) of the times to extinction at a specified abundance level. Thus, the CDF describes the probability that a population at a particular abundance level in year, t, will hit a specified extinction threshold at a certain time in the future (Dennis and others 1991; Morris and Doak 2002).
Using the abundance estimates for pre-adult delta smelt, I calculated and using regression (as above) over the entire time series (1967–2003, Figure 34A), as well as for the post-decline period (1982–2003, Figure 34B). I then specified three extinction levels 80,000, 8,000, and 800, chosen because the lowest MWT index on record (102 in 1994) corresponds to a calculated abundance level of 86,203 fish. I then calculated the CDFs using these three extinction thresholds for the entire and post-decline time series as well as bootstrap estimates of 95% confidence limits using 1000 iterations (Figure 35). From each CDF plot, I then obtained the median time in years to which 50% of the extinction probabilities would be realized, as well as the probability that a particular extinction level would be reached within 20 years (Morris and Doak 2002).
%
&2
x t2 t1–=
y ln N2 N1"# $ t2 t1–"=
%&2
% &2
52
San Francisco Estuary and Watershed Science Vol. 3, Iss. 2 [September 2005], Art. 1
http://repositories.cdlib.org/jmie/sfews/vol3/iss2/art1

Figure 34. Population Viability Analysis using delta smelt abundance estimates for the entire data record and post-decline period (1982–2003). (A) Regressions used to estimate the rate ( ) and variance (MS) parameters for projecting the probability of future population levels reaching three quasi-extinction levels. (B) Cumulative Probability Distributions of times to quasi-extinction at 80,000, 8,000, and 800 fish. Arrows show the number of years within which 50% of the extinction probabilities occur, or the percent probability of extinction within 20 years.
0 20 40 60 80 100
0.2
0.4
0.6
0.8
1.0
0.0
0.2
0.4
0.6
0.8
1.0
0 20 40 60 80 100
0.0
0.2
0.4
0.6
0.8
1.0
Cu
mm
ula
tiv
e p
rob
ab
ility
of
qu
asi
-ext
inc
tio
n
Time (years)
0.0 0.5 1.0 1.5-3
-2
-1
0
1
2
3
0.0 0.5 1.0 1.5
Ln
(Nt+
1/Nt)/
(t+
1-t)
1/2
mu = -0.0057MS = 1.15375
(ti+1
- ti)1/2
mu = -0.0262MS = 1.2648
A B
C D
E F
G H
1967- 2003 1982- 2003
85%
1.5 yrs.
87%
1.2 yrs.
20 yrs., 50%16 yrs.
26%
55 yrs.
30%
42 yrs.
55%
%
53
Bennett: Critical assessment of the delta smelt population
Produced by eScholarship Repository

Figure 35. Trends in seasonal loss of delta smelt >20 mm to water export facilities (salvage) and estimated duration of spawning seasons.
Overall, the results using each extinction level were similar using either the entire time series or the post-decline period (Figure 34). The median time to when 50% of the extinction probabilities fall below the lowest calculated level recorded for delta smelt (about 80,000 fish) was only 1.2 to 1.5 years from the present, whereas 85% to 87% of these probabilities would be realized within 20 years (Figure 34C, 34D). Confidence limits on these estimates do not change the time to 50% extinction, but show a 40% to 100% probability that this level would be reached within 20 years (Figure 34C, 34D). Lowering the extinction level naturally decreases extinction risk as well as the levels of confidence associated with those estimates. However, lowering by one order of magnitude (8,000 fish) predicts that the median time to 50% extinction would occur in only 20 years (Figures 34E, 34F), whereas lowering by an additional order of magnitude (800 fish) extends this time to 42 to 55 years, with a 26% to 30% probability of encountering such low abundance within 20 years (Figures 34G, 34H).
The Dennis and others (1991) method for assessing population viability has become a
standard conservation tool widely applied to a variety of organisms worldwide; the results rest on two main assumptions (Morris and Doak 2002). First and foremost is that estimates of abundance accurately reflect population size. Given that the estimates used here represent a first-order attempt to evaluate abundance for delta smelt suggests that these extinction probabilities be revised based on future refinements of this, or an alternative method. Second, the model assumes that abundance is not influenced by population density. This further indicates the importance of understanding the potential for density dependent processes to influence delta smelt abundance.
Overall, however, the results of this PVA indicate that ESA listing of delta smelt is justified under the extinction criteria adopted by the International Union for Conservation of Nature and Natural Resources (IUCN). The IUCN (2001) has adopted the use of such quantitative criteria where it exists over semi-quantitative assessments for evaluating extinction risk for a variety of organisms. Listing a species as Endangered under IUCN criteria requires a quantitative analysis
80 85 90 95 1000
100
200
300
Ab
un
dan
ce in
sal
vag
e (1
03 )
Year
Spring Summer Fall-Winter
30
45
60
75
Sp
awn
ing
day
s
54
San Francisco Estuary and Watershed Science Vol. 3, Iss. 2 [September 2005], Art. 1
http://repositories.cdlib.org/jmie/sfews/vol3/iss2/art1

showing a probability of extinction that is at least 20% within 20 years or five generations, whereas Vulnerable status (similar to the USFWS Threatened status) requires a 10% chance within 100 years. Given these criteria, the results from the PVA indicate delta smelt qualifies for Endangered rather than Vulnerable status, and thus provides quantitative support for upholding the ESA listing for delta smelt.
Scenario of Population Decline
What caused the decline of the delta smelt population? Because abundance dropped suddenly some sort of episodic event may be responsible, yet the following years of prolonged low abundance implies some combination of “press” environmental influences has been responsible. Entrainment in water exports and sea surface temperatures appear to be the most conspicuous extreme
events during 1981–1983 and may have contributed to the sudden drop in abundance observed at that time (Figure 36). High entrainment of all life stages occurred in 1981, and was immediately followed by the extreme El Niño of 1982–1983. Some have speculated that young delta smelt were washed out of the system during the flood produced by the El Niño (DWR–USBR 1993). Instead, it is more likely that the spawning season, which was constrained by warm water to only one month in 1983, allowed few opportunities for spawning (Figure 16). Although the decline could have been caused by a variety of other factors, it is reasonable to propose it was produced by some combination of these extreme events. The factors responsible for the ensuing years of low abundance have been the topic of much of this review, and continue to be a critical uncertainty for delta smelt.
Figure 36. Conceptual model of factors influencing abundance (boxes) at key periods in the life cycle. Thick red circle represents one-year cycle, and thin red circle reflects the small proportion of adults that survive two years. Ovals show the timing of the primary monitoring surveys.
55
Bennett: Critical assessment of the delta smelt population
Produced by eScholarship Repository

Implications and Uncertainties: A Conceptual Model
Numerous uncertainties underlie the previous sections summarizing the factors limiting the delta smelt population. Here these are organized with those outlined under previous sections describing biology and life history using a conceptual model that points to key periods in the life cycle where these occur (shown in boxes on the life-cycle diagram, Figure 36). Overall, the ecology of delta smelt appears unusual compared with many fishes. Persistence of the population occurs by maintaining growth, survival, and reproductive competence within a primarily annual life cycle in a fluctuating environment. Throughout this process a diverse array of limiting factors appear to interact episodically or as subtle processes (Houde 1989) among seasons, various geographical locations, and years in the delta smelt habitat. A fundamental uncertainty is whether the few fish that survive two years constitute a key life history tactic to ensure population persistence after years of poor recruitment success (Figure 36).
The period between winter and summer appears to be dominated by environmental factors operating in a density independent fashion (Figure 17B). Spawning success during this period appears to be driven by water temperatures between about 15 to 20°C. Longer spawning seasons in cooler years produce more cohorts (Figure 11) and on average higher annual recruitment (Figure 20). Within this temperature range, spawning in aquaculture is coordinated with lunar periodicity such that spawning occurs at or near spring tidal phases. Cohorts spaced in time have different probabilities of encountering favorable food supplies as well as various sources of mortality including entrainment in water export facilities, pulses of toxic pesticides, and predation (Figure 36). Threats posed by water project operations are highly uncertain with losses of fish under 20 mm FL largely unaccounted for, but appear greatest during early spring given the limited information available from the 20 mm survey
(Figure 23). Simulations of these losses in a population model, however, imply that their influence on annual abundance may be difficult to detect compared to small changes in survival during late summer as juveniles advance into the pre-adult life stage. Overall, extended spawning seasons during spring provide better opportunities for recruitment success (Figure 20).
Between late-summer and fall, the transition of juveniles to the pre-adult stage may be limited by density dependence in years when abundance exceeds population carrying capacity, as well as from toxic chemicals, or other mechanisms operating in a density independent fashion. Although speculative, carrying capacity during late summer may be defined by declining size in suitable habitat and seasonally high abundances of planktivorous fishes.
Overall, annual variability in delta smelt recruitment success appears to be induced by the prevailing climate during the spawning season, combined with various environmental and anthropogenic factors during spring and early summer. During late-summer some of this variation appears to be dampened in years of high juvenile abundance relative to the prevailing carrying capacity of the delta smelt habitat. In years of poor recruitment success the small proportion of fish that survive two years may help the population to persist, thus providing some insurance to prevent extinction. Clearly, this conceptual model is based on numerous uncertainties and leaps-of-faith. At this point in our level of knowledge, this was deemed necessary to bring together somewhat disparate fragments of information into a working blueprint to serve as a guide for future investigations of the delta smelt population.
IMPLICATIONS FOR RESTORATION
Currently, humans have only four options for delta smelt restoration, reflecting our limited ability to control the ecosystem. These include controls on the amount freshwater discharge,
56
San Francisco Estuary and Watershed Science Vol. 3, Iss. 2 [September 2005], Art. 1
http://repositories.cdlib.org/jmie/sfews/vol3/iss2/art1

quality of estuarine water, amount of water exported, and physical rejuvenation of shoreline and shallow-water habitats. The question for restoration, therefore, is how to devise ways to use these options to the benefit of the delta smelt population?
Freshwater Discharge
Freshwater discharge to the estuary is currently managed in an environmentally friendly manner using the X2 standard. This action assumes that maintaining the low salinity zone in Suisun Bay during spring will benefit delta smelt (see Kimmerer 2002, 2004). Although there is no statistical relationship justifying its usefulness (Figure 20, Kimmerer 2002), the X2 standard remains a worthwhile management action, because the abundance of delta smelt is elevated only in years when the low salinity zone is located in Suisun Bay; and, from an ecosystem perspective, the abundances of a variety of organisms are enhanced with X2 in Suisun Bay (Jassby and others 1995; Kimmerer 2002, 2004).
Water Quality
Numerous toxic chemicals, primarily pesticides from urban and agricultural run-off enter the delta smelt habitat (Thompson and others 2000). Considerable vigilance is required to monitor water quality and diagnose the large variety of chemicals, their concentrations, and potential harm to the biota including delta smelt (Kuivila and Foe 1995). However, these efforts are very difficult and expensive. Population level effects from exposure to toxic chemicals are possible (Kuivila and Moon 2002, 2004), but with the limited information available they have not been shown to occur (Figure 28; Bennett 1995; Bennett and others, in prep.). Given the potential for population level effects, however, monitoring pesticide concentrations in the delta smelt habitat is necessary. Monitoring is especially needed considering the increasing applications of a new type of pesticide, pyrethroids, known to cause endocrine disruption in fishes at very low concentrations.
Water Export Operations
Actions to reduce the losses of delta smelt in water export operations are the most controversial. The export incidental “take” limits clearly provide benefits to individual delta smelt, yet there does not appear to be a defensible biological basis for the levels chosen. Over the past five years, the take limits have become an integral part of the California Bay-Delta Authority’s (CBDA) Environmental Water Account (EWA) designed to alleviate the uncertainty of water use, as well as to provide benefits to delta smelt and other fishes of special concern. Environmental water is acquired and “banked” and used for fish protection, primarily by reducing water exports at critical times when delta smelt “take” at the major facilities is elevated. For delta smelt, however, it has never been established that reducing water exports at the critical times has any benefit for the population. In the future, successful use of EWA water will rely on a better understanding of the overall impacts of the water exports on delta smelt, as well as a process-oriented understanding of the mechanisms influencing entrainment at and near the facilities. For example, fish saved by EWA action in one week may remain vulnerable to exports soon after the protective measure has been relaxed.
A related tactic has been to devise effective fish screens and handling procedures. By many, the perception is that more effective screening and fish handling capabilities would augment EWA expenditures to provide benefits for delta smelt. Unfortunately, there is no scientific evidence supporting this expensive proposition. What is clear, however, is that delta smelt caught in the wild are extremely fragile and many do not survive even the most well prepared attempt to handle them in the laboratory (Swanson and others 1996, Bennett, personal observations). Moreover, it is currently unclear if losses to the water projects are a major impact on their abundance. Further evaluation of these losses and the processes influencing entrainment should be carefully examined before a major
57
Bennett: Critical assessment of the delta smelt population
Produced by eScholarship Repository
effort to “improve” the fish screening and salvaging operations at the facilities is undertaken. Similarly, there has been a consistent effort to install fish screens on the numerous small agricultural diversions in the Delta. Again, however, the benefits of fish screening have never been established for delta smelt, and the added structural complexity to these diversions may provide habitat harboring predatory fishes. What little is known indicates their effect is small (Nobriga and others 2004). Moreover, the installation of fish screens involves significant capitol investment that is then unavailable to other environmental uses.
Two relationships emerging from this review may provide additional opportunities for guiding the use of water as a management and restoration option. The first is the length of the spawning season. Although this relationship only crudely predicts delta smelt abundance overall, it is a very reliable predictor of recruitment success in years with either very wide or narrow spawning seasons (Figure 20). Spawning seasons spanning less than 60 days, or ending before Julian day 160 are likely to result in lower abundance, in which case protective measures such as use of EWA may be of higher value. Unfortunately, releases of environmental water are insufficient to maintain appropriate spawning temperatures. In the future, the duration of the spawning season may be a significant concern for the persistence of delta smelt, because of the trend in climate toward earlier snow melt and warmer air temperature during spring (Dettinger and Cayan 1995). The second, carrying capacity may limit adult recruitment in years of high juvenile abundance. However, it is less obvious how to alleviate density dependence, especially by using controls on fresh water discharge, considering that we need to learn much more about how often and why it occurs. Density dependence deserves further examination because it may preclude the benefits of current restoration actions.
Shallow-Water Habitat and Marshes
Increasing delta smelt habitat by rehabilitation or creation of shallow habitat is an intuitively appealing notion, and several projects are currently underway to provide benefits to delta smelt, perceived as spawning and rearing habitat. Studies of the Yolo Bypass clearly show the benefits of flooding shallow areas for Sacramento splittail (Pogonichthys macrolepidotus) and Chinook salmon (Oncorhynchus tshawytscha) smolts (Sommer and others 2001), thus delta smelt may also receive benefits from additional spawning habitat and rearing areas of high productivity. For example, delta smelt in northern Suisun Bay adjacent to shoal habitats have higher feeding success (Hobbs 2004). However, what constitutes spawning habitat for delta smelt is currently uncertain, and there is little monitoring associated with such restoration projects to ascertain whether they have any benefit to the population. One can speculate that the cumulative influences of many restored habitat areas may help to raise overall system productivity and potential carrying capacity for delta smelt. However, the vast uncertainties of these perceived benefits need to be weighed against the high cost of rehabilitation, and the potential for constructed habitats to foster exotic species (Grimaldo and others 1998) as well as re-mobilize toxic chemicals (Suchanek and others 1999).
RESEARCH NEEDS
I began this review by posing three questions for which numerous data gaps impede progress toward answering:
1. Should the species continue to be listed under the ESA, or what is the probability of extinction?
2. What is the impact of human activities, particularly water export operations, on population abundance?
3. Are there potential avenues for resto-ration and recovery?
58
San Francisco Estuary and Watershed Science Vol. 3, Iss. 2 [September 2005], Art. 1
http://repositories.cdlib.org/jmie/sfews/vol3/iss2/art1

This synthesis of the available information cannot answer these vital management questions, but it is hoped that some insight or progress toward their resolution has been achieved. The most compelling observation from this review is the large number of fundamental data gaps and fragmented progress research has made in the decade since the species was listed under the ESA. To provide the types of options needed to simultaneously manage California’s water supply and ensure the persistence of delta smelt, there is an urgent need for a significant and comprehensive program of research. Such a program needs to address the many gaps in knowledge in an organized fashion so that it may be effectively synthesized into tools for management and restoration. This could be effectively accomplished as part of an ambitious series of whole-system experiments in which freshwater discharge and export operations are systematically and dramatically altered. Although such experiments are improbable, significant research programs are routinely commissioned worldwide to investigate major fishery stocks that are arguably worth less in terms of dollars than California water. This section addresses some of the key research areas that such a program should target. Many of these recommendations have not received adequate attention since initially posed in the first Delta Smelt Study Plan (Sweetnam and Stevens 1991), and are also in accord with a more recent IEP Delta Smelt Research Strategy (see Brown and Kimmerer 2002). Similar views were also expressed by an independent group of experts forming the CBDA Environmental Water Account Technical Review Panel !(http://science.calwater.ca.gov/pdf/EWAReviewFinal_1-27-03.pdf).
Monitoring and Abundance
A trustworthy measure of delta smelt abundance is probably the most critical information gap as noted throughout this review. However, quantifying abundance for delta smelt is not a straightforward task (Herbold 1995). Two options appear worth
pursuing. The first would be to continue investigating statistical estimates based on raw catch and effort records as used in this paper. To achieve this, size-selective biases associated with each of the sampling gears need to be estimated with field-based measurements, and work is needed to better quantify the volume of suitable habitat for delta smelt. Second, novel technologies may facilitate development of mark-recapture or hydroacoustic protocols that can be routinely applied. A program integrating these options would provide the best results.
Life History
As also noted under the section on delta smelt biology, there are several aspects of the life history that remain uncertain or unknown. For example, spawning areas and microhabitats, size-specific fecundity and within-season reproductive strategies are all poorly known and critical for developing population models and identifying potential habitat areas for restoration. A key uncertainty is longevity, and the potential importance of bet-hedging as a tactic for provisioning reproduction; such a strategy could be fundamental to how delta smelt avoid extinction.
Effective Population Size
At what level of abundance is the population unable to recover? Understanding risk of extinction also requires a quantitative measure defining effective population size, or the abundance at which significant genetic diversity is lost due to inbreeding (Falconer and Mackay 1996). Various genetic tools are available and should be applied to this important gap in knowledge.
Growth and Mortality
Estimates of stage-specific growth and mortality are fundamental for understanding, and predicting recruitment success in fishes. Currently little is known of these important vital parameters and the fish caught during the course of monitoring provide an economy of
59
Bennett: Critical assessment of the delta smelt population
Produced by eScholarship Repository

effort to estimate birth dates and locations, growth, as well as mechanisms of potential mortality. Synthesizing this information with effective abundance measures will be required to estimate these parameters for the population.
Density Dependence and Carrying Capacity
Evidence for density dependence identified in this paper is not by itself convincing. Density dependence is important because it regulates abundance, and has major implications for understanding the impacts of human activities on the population. Further study is needed to measure the potential strength, and identify the underlying mechanisms of density dependence before useful management and restoration options can be devised.
Interactions with Exotic Species
Exotic species are an ever increasing component of the delta smelt habitat, influencing the abundance and composition of the delta smelt food supply, potential predators, and competitors, at several life stages. The mechanisms by which exotic species interfere with delta smelt recruitment are complex and will continue to be an uncertainty into the future as new species invade at rates faster than research can unravel their effects.
Toxic Chemicals
As long as human land use occurs, concern over chemicals washing into the delta smelt habitat will remain important. However, identifying and understanding the impacts of toxic chemicals, and primarily pesticides, is costly and difficult to assess at the population level. Limited work to date has not shown a significant impact of toxic chemicals on delta smelt, however, the threat is real especially considering the rapidly evolving development and use of new pesticides. One way to approach this complex problem is to use various biomarkers (Anderson and Wild 1994; Bennett and others 1995; Teh and others
1997) as screening techniques to identify effects on individual fish caught during routine monitoring before embarking on a comprehensive effort. Water quality monitoring is also useful in this regard to narrow down the choices of specific biomarkers to be applied to individual fish.
Water Project Operations
As stated several times before, little is known about the impacts of water export operations on the delta smelt population. The uncertainties range from limited knowledge of the numbers of larvae lost in exported water, and impacts of predators near the facilities, to the conditions promoting significant entrainment events at all life stages. A better understanding of the interactions among the local hydrodynamics, fish behavior, and design of the pumping facilities would provide managers with potential options for project operations or design modifications that may reduce export losses. Studies would require intensive monitoring of hydrodynamics and fish distribution over tidal time scales at key locations near the facilities. However, even with better knowledge of these factors, their impacts need to be evaluated in a similar context with other known sources of mortality in population models. Numerous data gaps will need to be filled before we can understand the impacts of water export operations on the delta smelt population.
DELTA SMELT IN OUR FUTURE?
In several regards, the uniqueness of delta smelt as a species, and as an environmental concern constitutes a critical test case, or “canary in the coal mine,” for environmental issues in California and beyond for the future. The institutional infrastructure associated with managing and marketing California water is immense with increasing pressures from a rapidly growing human population and world class economy. The “Achilles heel” in this scenario are the environmental impacts to ESA listed species, and primarily delta smelt, due to the CVP and SWP in the south Delta that
60
San Francisco Estuary and Watershed Science Vol. 3, Iss. 2 [September 2005], Art. 1
http://repositories.cdlib.org/jmie/sfews/vol3/iss2/art1

transfer a significant portion of the State water supply from northern to central and southern California. The current state of knowledge suggests a high probability that delta smelt abundance will decline in the future; as this paper enters publication the population is currently at record low abundance. Considering the rate at which water demands have intensified, relative to the rate at which scientific understanding of delta smelt has advanced over the last decade, it will interesting to observe whether we will be able to answer the questions posed here in time to circumvent an environmental catastrophe.
ACKNOWLEDGEMENTS
I thank the many people who provided data, pre-published results, advice, and comments on presentations throughout the evolution of this project. Helpful comments or conversations on one or more earlier drafts were provided by Randy Brown, Central Valley Bay-Delta Branch DFG, Jim Cowan, Bruce Herbold, Jim Hobbs, Kristen Honey, Zach Hymanson, Les Kaufman, Wim Kimmerer, Matt Nobriga, Laura Rogers-Bennett, and three anonymous reviewers. I also thank Randy Brown, Sam Luoma, and Kim Taylor for their dedication to this project and keeping me on task. Finally, I am grateful to Peter Moyle for initially encouraging me to investigate delta smelt, and to Brian and Lucy for reminding me to say it like I see it. This project was funded by the CALFED Ecosystem Restoration Program, and is contribution No. 2237 from the Bodega Marine Laboratory, University of California, Davis.
REFERENCES
Aasen GA, Sweetnam DA, and Lynch LM. 1998. Establishment of the wakasagi in the Sacramento-San Joaquin Estuary. California Fish and Game 84:31-35.
Aasen GA. 1999. Juvenile delta smelt use of shallow-water and channel habitats in California’s Sacramento-San Joaquin estuary. California Fish and Game 85:161-169.
Anderson SL, Wild GC. 1994. Linking genotoxic responses and reproductive success in ecotoxicology. Environmental Health Perspectives 102 (Suppl 12):9-12.
Arthur JF, Ball MD, Baughman SY. 1996. Summary of federal and state water project environmental impacts in the San Francisco Bay-Delta estuary, California. In: Hollibaugh JT, editor. San Francisco Bay: the ecosystem. San Francisco (CA): Pacific Division of the American Association for the Advancement of Science. p 445-496.
Baskerville-Bridges B, Lindberg JC, Doroshov SI. 2002. The effect of light intensity, alga concentration, and prey density on the feeding behavior of delta smelt larvae. In: Freyer F, Brown LR, Brown RL, Orsi JJ, editors. Early life history of fishes in the San Francisco Estuary and watershed. American Fisheries Society Symposium 39. Bethesda (MD): American Fisheries Society. p 219-228.
Baxter R, Hieb K, DeLeon S, Flemming K, Orsi J. 1999. Report on the 1980-1995 fish, shrimp, and crab sampling in the San Francisco estuary, California. IEP Technical Report 63. Sacramento, CA: California Dept. of Water Resources.
Bender EA, Case TJ, Gilpin ME. 1984. Perturbation experiments in community ecology: theory and practice. Ecology 65:1-13.
Bennett WA. 1993. Interaction of food limitation, predation, and anthropogenic intervention on larval striped bass in the San Francisco Bay estuary [PhD dissertation]. Available from: University of California, Davis.
61
Bennett: Critical assessment of the delta smelt population
Produced by eScholarship Repository
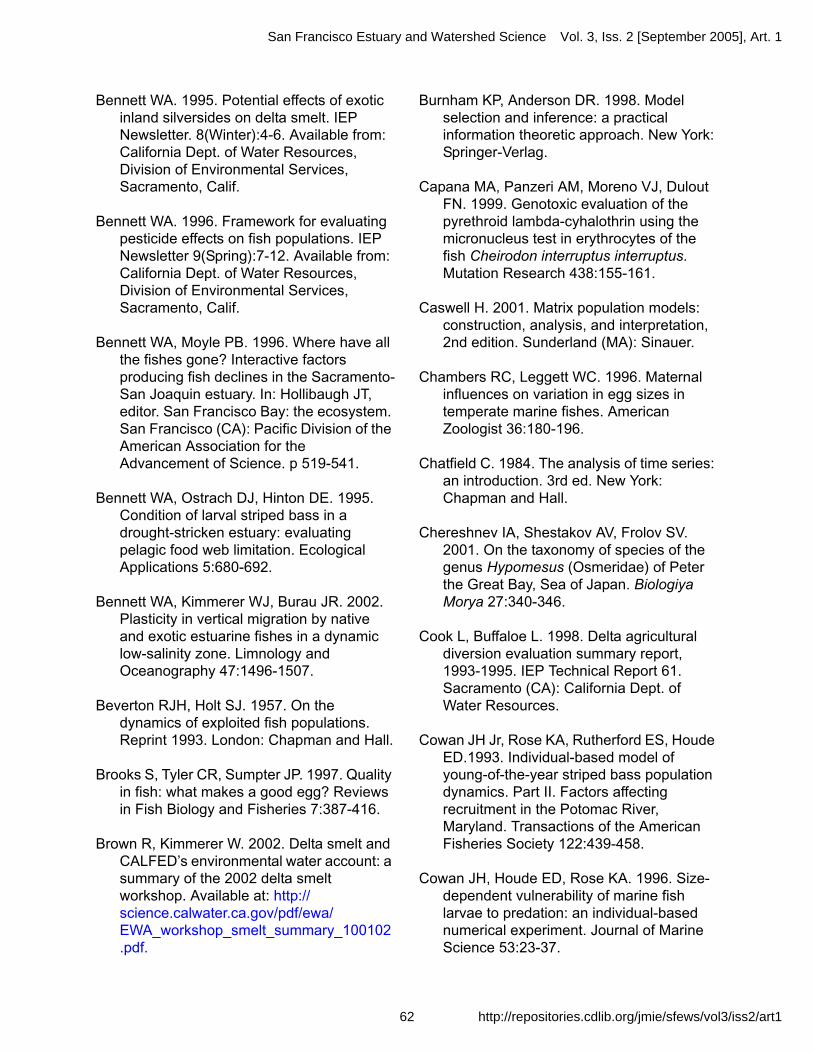
Bennett WA. 1995. Potential effects of exotic inland silversides on delta smelt. IEP Newsletter. 8(Winter):4-6. Available from: California Dept. of Water Resources, Division of Environmental Services, Sacramento, Calif.
Bennett WA. 1996. Framework for evaluating pesticide effects on fish populations. IEP Newsletter 9(Spring):7-12. Available from: California Dept. of Water Resources, Division of Environmental Services, Sacramento, Calif.
Bennett WA, Moyle PB. 1996. Where have all the fishes gone? Interactive factors producing fish declines in the Sacramento-San Joaquin estuary. In: Hollibaugh JT, editor. San Francisco Bay: the ecosystem. San Francisco (CA): Pacific Division of the American Association for the Advancement of Science. p 519-541.
Bennett WA, Ostrach DJ, Hinton DE. 1995. Condition of larval striped bass in a drought-stricken estuary: evaluating pelagic food web limitation. Ecological Applications 5:680-692.
Bennett WA, Kimmerer WJ, Burau JR. 2002. Plasticity in vertical migration by native and exotic estuarine fishes in a dynamic low-salinity zone. Limnology and Oceanography 47:1496-1507.
Beverton RJH, Holt SJ. 1957. On the dynamics of exploited fish populations. Reprint 1993. London: Chapman and Hall.
Brooks S, Tyler CR, Sumpter JP. 1997. Quality in fish: what makes a good egg? Reviews in Fish Biology and Fisheries 7:387-416.
Brown R, Kimmerer W. 2002. Delta smelt and CALFED’s environmental water account: a summary of the 2002 delta smelt workshop. Available at: http://science.calwater.ca.gov/pdf/ewa/EWA_workshop_smelt_summary_100102.pdf.
Burnham KP, Anderson DR. 1998. Model selection and inference: a practical information theoretic approach. New York: Springer-Verlag.
Capana MA, Panzeri AM, Moreno VJ, Dulout FN. 1999. Genotoxic evaluation of the pyrethroid lambda-cyhalothrin using the micronucleus test in erythrocytes of the fish Cheirodon interruptus interruptus. Mutation Research 438:155-161.
Caswell H. 2001. Matrix population models: construction, analysis, and interpretation, 2nd edition. Sunderland (MA): Sinauer.
Chambers RC, Leggett WC. 1996. Maternal influences on variation in egg sizes in temperate marine fishes. American Zoologist 36:180-196.
Chatfield C. 1984. The analysis of time series: an introduction. 3rd ed. New York: Chapman and Hall.
Chereshnev IA, Shestakov AV, Frolov SV. 2001. On the taxonomy of species of the genus Hypomesus (Osmeridae) of Peter the Great Bay, Sea of Japan. Biologiya Morya 27:340-346.
Cook L, Buffaloe L. 1998. Delta agricultural diversion evaluation summary report, 1993-1995. IEP Technical Report 61. Sacramento (CA): California Dept. of Water Resources.
Cowan JH Jr, Rose KA, Rutherford ES, Houde ED.1993. Individual-based model of young-of-the-year striped bass population dynamics. Part II. Factors affecting recruitment in the Potomac River, Maryland. Transactions of the American Fisheries Society 122:439-458.
Cowan JH, Houde ED, Rose KA. 1996. Size-dependent vulnerability of marine fish larvae to predation: an individual-based numerical experiment. Journal of Marine Science 53:23-37.
62
San Francisco Estuary and Watershed Science Vol. 3, Iss. 2 [September 2005], Art. 1
http://repositories.cdlib.org/jmie/sfews/vol3/iss2/art1

Cowan JH Jr, Rose KA, DeVries DR. 2000. Is density-dependent growth in young-of-the-year fishes a question of critical weight? Reviews in Fish Biology and Fisheries 10:61-89.
Degraaf DA.1986. Aspects of the life history of the pond smelt (Hypomesus olidus) in the Yukon and Northwest Territories. Arctic 39:260-263.
den Boer PJ. 1968. Spreading of risk and stabilization of animal numbers. Acta Biotheoretica 18:165-194.
Dennis B, Taper ML. 1994. Density dependence in time series observations of natural populations: estimation and testing. Ecological Monographs 64:205-224.
Dennis B, Munholland PL, Scott JM. 1991. Estimation of growth and extinction parameters for endangered species. Ecological Monographs 61:115-143.
Dettinger MD, Cayan DR. 1995. Large-scale atmospheric forcing of recent trends toward early snowmelt runoff in California. Journal of Climate. 8:606-623.
Downton MW, Miller KA. 1998. Relationships between Alaskan salmon catch and North Pacific climate on interannual and interdecadal time scales. Canadian Journal of Fisheries and Aquatic Sciences 55:2255-2265.
[DWR–USBR] California Department of Water Resources, US Bureau of Reclamation. 1993. Biological assessment: effects of the Central Valley Project and State Water Project on delta smelt. US Fish and Wildlife Service, Sacramento Field Office. 134 p.
Elliot JM. 1994. Quantitative ecology and the brown trout. New York: Oxford University Press.
Estuarine Ecology Team.1997. An assessment of the likely mechanisms underlying the “Fish-X2” relationships. IEP Technical Report 52. Sacramento (CA): California Dept. of Water Resources.
Erkkila LF, Moffett JW, Cope OB, Smith BR, Nelson RS. 1950. Sacramento-San Joaquin Delta fishery resources: effects of Tracy pumping plant and delta cross channels. Special Scientific Report. Fisheries 56. US Fish and Wildlife Service. 109 p.
Falconer DS, Mackay TFC. 1996. Introduction to quantitative genetics. 4th ed. New York: Longman.
Federal Register. 1993. Endangered and threatened wildlife and plants: determination of threatened status for the delta smelt. 58:2854-12863.
Ganssle D. 1966. Fishes and decapods of San Pablo and Suisun Bay. Part 1. California Dept. of Fish and Game Fish Bulletin 133. p 64-94.
Goldberg DE, Turkington R, Olsvig-Whittaker L, Dyer AR. 2001. Density dependence in an annual plant community: variation among life history stages. Ecological Monographs 71:423-446.
Grimaldo L, Ross B, Sweetnam D. 1998. Preliminary results on the age and growth of delta smelt from different areas of the estuary using otolith microstructural analysis. IEP Newsletter 11(1):25-28. Available at: http://www.iep.ca.gov/newsletter.
63
Bennett: Critical assessment of the delta smelt population
Produced by eScholarship Repository

Grimaldo L, Miller R, Peregrin CM, Hymanson Z. 2004. Spatial and temporal distribution of native and alien ichthyoplankton in three habitat types of the Sacramento-San Joaquin Delta. In: Freyer F, Brown LR, Brown RL, Orsi JJ, editors. Early life history of fishes in the San Francisco Estuary and watershed. American Fisheries Society Symposium 39, Bethesda (MD): American Fisheries Society. p 219-228.
Gritsenko OF, Churikov AA, Robionova SS. 1984a. The ecology of the pond smelt, Hypomesus olidus (Osmeridae), on Sakhalin. Journal of Ichthyology 24:91-100.
Gritsenko OF, Churikov AA, Rodionova SS. 1984b. The reproductive ecology of the Arctic smelt, Osmerus mordax dentex (Osmeridae), in the rivers of Sakhalin Island. Journal of Ichthyology 24:23-33.
Hare SR, Francis RC. 1995. Climate change and salmon production in the Northeast Pacific Ocean. Canadian Special Publication of Fisheries and Aquatic Sciences 121:357-372.
Herbold B. 1994. Habitat of delta smelt. IEP Newsletter 7(Winter):1-3. Available from: California Dept. of Water Resources, Division of Environmental Services, Sacramento, Calif.
Herbold B. 1996. Why we don’t do population estimates for delta smelt. IEP Newsletter 8(Spring)20-22. Available from: California Dept. of Water Resources, Division of Environmental Services, Sacramento, Calif.
Herbold B, Jassby AD, Moyle PB. 1992. Status and trends report on aquatic resources in the San Francisco Estuary. Oakland (CA): San Francisco Estuary Project, U.S. Environmental Protection Agency.
Herren JR, Kawasaki SS. 2001. Inventory of water diversions in four geographic areas in California’s Central Valley. In: Brown RL, editor. Contributions to the biology of Central Valley salmonids. Fish Bulletin 179, Vol. 2. Sacramento (CA): California Dept. of Fish and Game. p 343-355.
Hilborn R, Mangel M. 1997. The ecological detective: confronting models with data. Princeton (NJ): Princeton University Press.
Hirose T, Kawaguchi K. 1998a. Spawning ecology of Japanese surf smelt, Hypomesus pretiosus japonicis (Osmeridae), in Otsuchi Bay, northeastern Japan. Environmental Biology of Fishes 52:213-223.
Hirose T, Kawaguchi K. 1998b. Sediment size composition as an important factor in the selection of spawning site by the Japanese surf smelt Hypomesus japonicus. Fisheries Science 64:995-996.
Hobbs JA. 2004. Microscale patterns, macroscale implications: the application of otolith microstructure and microchemistry to assess nursery habitat quality for the threatened delta smelt in the San Francisco Estuary [PhD dissertation]. Available from: University of California, Davis.
Hollibaugh JT, editor. 1996. San Francisco Bay: the ecosystem. Further investigations into the natural history of San Francisco Bay and Delta with reference to the influence of man. San Francisco (CA): Pacific Division of the American Association for the Advancement of Science.
Houde ED. 1987. Fish early life dynamics and recruitment variability. American Fisheries Society Symposium 2:17-29.
Houde ED. 1989. Subtleties and episodes in the early life of fishes. Journal of Fish Biology 35:29-38.
64
San Francisco Estuary and Watershed Science Vol. 3, Iss. 2 [September 2005], Art. 1
http://repositories.cdlib.org/jmie/sfews/vol3/iss2/art1
Hutchings JA, Morris DW. 1985. The influence of phylogeny, size and behavior on patterns of covariation in salmonid life histories. Oikos 45:118-124.
Hutchinson GE. 1957. Concluding remarks. Cold Spring Harbor Symposia on Quantitative Biology 22:415-427.
[IUCN] International Union for Conservation of Nature and Natural Resources, Species Survival Commission. 2001. IUCN red list categories and criteria, version 3.1. Gland (Switzerland) and Cambridge (UK): IUCN. 30 p.
Jassby AD. 2000. Uncovering mechanisms of interannual variability from short ecological time series. In: Scow KM, Fogg GE, Hinton DE, Johnson ML, editors. Integrated assessment of ecosystem health. Boca Raton (FL): Lewis Publishers. p 285-306.
Jassby AD, Kimmerer WJ, Monismith SG, Armor C, Cloern JE, Powell TM, Schubel JR, Vendlinski TJ. 1995. Isohaline position as a habitat indicator for estuarine populations. Ecological Applications 5:272-289.
Katayama S. 2001. Spawning grounds and reproductive traits of anadromous and resident pond smelt, Hypomesus nipponensis, in Lake Ogawara, Japan. Fisheries Science 67:401-407.
Katayama S, Kawasaki T. 1994. Age determination of pond smelt using otolith phase. Tohoku Journal of Agricultural Research 44:91-106.
Katayama S, Omori M, Radtke RL. 1998. Analyses of growth processes of pond smelt, Hypomesus nipponensis, in Lake Ogawara, Japan, through the use of daily otolith increments. Environmental Biology of Fishes 52:313-319.
Katayama S, Sugawara Y, Omori M, Okata A. 1999. Maturation and spawning processes of anadromous and resident pond smelt in Lake Ogawara. Ichthyology Research 46:7-18.
Katayama S, Radtke RL, Omori M, Shafer D. 2000. Coexistence of anadromous and resident life history styles of pond smelt, Hypomesus nipponensis, in Lake Ogawara, Japan, as determined by analyses of otolith structure and strontium: calcium ratios. Environmental Biology of Fishes 58:195-201.
Katayama S, Kijima A, Omori M, Okata A. 2001. Genetic differentiation among and within local regions in the pond smelt, Hypomesus nipponensis. Tohoku Journal of Agricultural Research 51:61-77.
Kimmerer WJ, Cowan JH Jr, Miller LW, Rose KA. 2000. Analysis of an estuarine striped bass population: influence of density-dependent mortality between metamorphosis and recruitment. Canadian Journal of Fisheries and Aquatic Sciences 57:478-486.
Kimmerer WJ, Cowan JH Jr, Miller LW, Rose KA. 2001. Analysis of an estuarine striped bass population: effects of environmental conditions during early life. Estuaries 24:556-574.
Kimmerer WJ. 2002. Effects of freshwater flow on abundance of estuarine organisms: physical effects or trophic linkages? Marine Ecology and Progress Series 243:39-55.
Kimmerer WJ. 2004. Open water process in the San Francisco Estuary: from physical forcing to biological control. San Francisco Estuary and Watershed Science [online]. Vol. 2, Issue 1 (February 2004), Article 1. Available at: http://www.estuaryscience.org/vol2/iss1/art1/.
65
Bennett: Critical assessment of the delta smelt population
Produced by eScholarship Repository

Kimmerer WJ, Orsi JJ. 1996. Changes in the zooplankton of the San Francisco Bay estuary since the introduction of the clam Potamacorbula amurensis. In: Hollibaugh, JT, editor. San Francisco Bay: the ecosystem. San Francisco, CA: Pacific Division, American Association for the Advancement of Science. p 403-424.
Kimmerer WJ, Gartside E, Orsi JJ. 1994. Predation by an introduced clam as the likely cause of substantial declines in zooplankton of San-Francisco Bay. Marine Ecology Progress Series 113:81-93.
Kimmerer WJ, Burau JR, Bennett WA. 1998. Tidally oriented vertical migration and position maintenance of zooplankton in a temperate estuary. Limnology and Oceanography 43:1697-1709.
Kimmerer WJ, Burau JR, Bennett WA. 2002. Persistence of tidally-oriented vertical migration by zooplankton in a temperate estuary. Estuaries 25:359-371.
Kudo T, Mizuguchi K. 2000. Growth of large and small forms of pond smelt Hypomesus nipponensis in Lake Kasumigaura, Japan. Fisheries Science 66:432-441.
Kuivila KM, Foe CG. 1995. Concentrations, transport and biological effects of dormant spray pesticides in the San Francisco estuary, California. Environmental Toxicology and Chemistry 14:1141-1150.
Kuivila KM, Moon GE. 2002. Exposure of delta smelt to dissolved pesticides. IEP Newsletter 15(1):42-45. Available at:!http://www.iep.ca.gov/newsletter.
Kuivila KM, Moon GE. 2004. Potential exposure of larval and juvenile delta smelt to dissolved pesticides in the Sacramento-San Joaquin Delta, California. In: Freyer, F, Brown LR, Brown RL, Orsi JJ, editors. Early life history of fishes in the San Francisco Estuary and watershed. American Fisheries Society Symposium 39. Bethesda (MD): American Fisheries Society. p 229-242.
Laurence GC. 1990. Growth, survival, and recruitment in large marine ecosystems. In: Sherman K, Alexander LM, Gold BD, editors. Large marine ecosystems: patterns, processes, and yields. Washington DC (USA): American Association for the Advancement of Science. p 132-150.
Leggett WC, Deblois E. 1994. Recruitment in marine fishes: is it regulated by starvation and predation in the egg and larval stages? Netherlands Journal of Sea Research 32:119-134.
Lindberg J, Mager R, Bridges B, Dorshov S. 1997. Status of delta smelt culture. IEP Newsletter 10(Summer):21-22. Available at: http://www.iep.ca.gov/newsletter.
Lott J, Nobriga ML. 1998. Feeding ecology of juvenile and adult delta smelt Sacramento-San Joaquin river Estuary. IEP Newsletter 11(1):14-19. Available at: http://www.iep.ca.gov/newsletter.
MacCall AD. 1990. Dynamic geography of marine fish populations. Washington Sea Grant. Seattle, WA: University of Washington Press.
Mager R. 1996. Gametogenisis, reproduction, and artificial propogation of delta smelt, Hypomesus transpacificus [PhD dissertation]. Available from: University of California, Davis.
66
San Francisco Estuary and Watershed Science Vol. 3, Iss. 2 [September 2005], Art. 1
http://repositories.cdlib.org/jmie/sfews/vol3/iss2/art1

Mager R, Doroshov SI, Van Eenennaam JP, and Brown RL. 2004. Early life stages of delta smelt. In: Freyer, F, Brown LR, Brown RL, Orsi JJ, editors. Early life history of fishes in the San Francisco Estuary and watershed. American Fisheries Society Symposium 39. Bethesda, MD: American Fisheries Society. p 169-180.
Mantua NJ, Hare SR, Zhang Y, Wallace JM, Francis RC. 1997. A Pacific interdecadal climate oscillation with impacts on salmon production. Bulletin of the American Meteorological Society 78:1069-1079.
McAllister DE. 1963. A Revision of the Smelt Family, Osmeridae. Bulletin National Museum of Canada. 191:53.
McCann K, Shuter B. 1997. Bioenergetics of life history strategies and the comparative allometry of reproduction. Canadian Journal of Fisheries and Aquatic Sciences 54:1289-1298.
McComas SR, Drenner GE. 1982. Species replacement in a reservoir fish community: silversides feeding mechanics and competition. Canadian Journal of Fisheries and Aquatic Sciences. 39: 815-821.
McDowall RM, Clark BM, Wright GJ, Northcote TG. 1993. Trans-2-cis-6-nonadienal: the cause of cucumber odor in osmerid and retropinnid smelts. Transactions of the American Fisheries Society 122:144-147.
Meinz M, Mecum WL. 1977. A range extension for Mississippi silversides in California. California Fish and Game 63:277-278.
Miller LW. 2000. The tow-net survey abundance index for delta smelt revisited. IEP Newsletter 13(1):37-44. Available at: http://www.iep.ca.gov/newsletter.
Mingelbier M, Lecomte F, Dodson JJ. 2001. Climate change and abundance cycles of two sympatric populations of smelt (Osmerus mordax) in the middle estuary of the St. Lawrence River, Canada. Canadian Journal of Fisheries and Aquatic Sciences 58:2048-2058.
Moon GE, Kuivila KM, Ruhl C, Schoellhamer DH. 2000. Exposure of delta smelt to dissolved pesticides in 1998 and 1999. IEP Newsletter 13(4):27-33. Available at: http://www.iep.ca.gov/newsletter.
Morris WF, Doak DF. 2002. Quantitative Conservation Biology. Sinauer, Sunderland MA.
Moyle PB. 1995. Searching the origins of delta smelt. Interagency Ecological Program for the Sacramento-San Joaquin Estuary Newsletter. Volume 7, spring, page 9. Sacramento (CA): California Dept. of Water Resources.
Moyle PB. 1976. Inland fishes of California. Berkeley, CA: University of California Press.
Moyle PB. 1986. Fish introductions into North America: patterns and ecological impact. In: Mooney HA, Drake JA, editors. Ecology of biological invasions of North American and Hawaii. New York: Springer-Verlag. p 27-43.
Moyle PB, Cech JJ. 1996. Fishes: an introduction to ichthyology. 3rd ed. Prentice Hall.
Moyle PB, Herbold B, Stevens DE, Miller LW. 1992. Life history and status of delta smelt in the Sacramento-San Joaquin estuary, California. Transactions of the American Fisheries Society 121:67-77.
67
Bennett: Critical assessment of the delta smelt population
Produced by eScholarship Repository

Moyle PB, Pine R, Brown LR, Hanson CH, Herbold B, Lentz KM, Meng L, Smith JJ, Sweetnam DA, Winternitz L. 1996. Sacramento-San Joaquin Delta native fishes recovery plan. Portland (OR): US Fish and Wildlife Service.
Myers RA, Bridson J, Barrowman NJ. 1995. Summary of worldwide spawner and recruitment data. Canadian Technical Report of Fisheries and Aquatic Sciences nr. 2024. 331 p.
Nichols FH, Cloern JE, Luoma SN, Peterson DH. 1986. The modification of an estuary. Science 231:567-573.
Nobriga M. 1998. Trends in food habits of larval delta smelt, Hypomesus transpacificus, 1991-1994 [MSc thesis] Available from: California State University, Sacramento.
Nobriga M. 2002. Larval delta smelt diet composition and feeding incidence: environmental and ontogenetic influences. California Fish and Game 88:149-164.
Nobriga M, Veldhuizen T, Hymanson Z. 1999. Delta smelt concerns result in changes in SWP and CVP operations. IEP Newsletter 12(3):33-34. Available at: !http://www.iep.ca.gov/newsletter.
Nobriga M, Matica Z, Hymanson Z. 2004. Evaluating entrainment vulnerability to agricultural irrigation diversions: a comparison among open-water fishes. In: Freyer, F, Brown LR, Brown RL, Orsi JJ, editors. Early life history of fishes in the San Francisco Estuary and watershed. American Fisheries Society Symposium 39. Bethesda (MD): American Fisheries Society. p 281-295.
Obrebski S. 1993. Relationship between delta smelt abundance and entrapment zone position. Draft report to California Dept. of Water Resources. 29 p.
Okubo A. 1988. Planktonic micro-communities in the sea: biofluid mechanical view. In: Hastings A, editor. Community ecology. Berlin: Springer-Verlag. p 13-24.
Pickard A, Baracco A, Kano R. 1982. Occurrence, abundance, and size of fish at the Roaring River Slough intake, Suisun Marsh, California, during the 1980-81 and the 1981-82 diversion seasons. IEP Technical Report 3. Sacramento (CA): California Dept. of Water Resources.
Platts WJ, Millard MJ. 1995. New data on the North American distribution of the pond smelt, Hypomesus olidus (Osmeridae). Journal of Ichthyology. 35:55-62.
Polis GA, Myers CA, Holt RD. 1989. The ecology and evolution of intraguild predation - potential competitors that eat each other. Annual Review of Ecology and Systematics 20:297-330.
Quinn TJ, Deriso RB. 1999. Quantitative fish dynamics. Oxford New York: University Press.
Radke LD. 1966. Distribution of smelt, juvenile sturgeon and starry flounder in the Sacramento-San Joaquin Delta. Fish Bulletin 136. Sacramento (CA): California Department of Fish and Game. p 115-129.
Roche M-J. 2000. A comparative approach to life-history strategies and tactics among four orders of teleost fish. ICES Journal of Marine Science 57:228-239.
Rose KA, Cowan JH Jr, Winemiller KO, Myers RA, Hilborn R. 2001. Compensatory density dependence in fish populations: importance, controversy, understanding and prognosis. Fish and Fisheries 2:293-327.
68
San Francisco Estuary and Watershed Science Vol. 3, Iss. 2 [September 2005], Art. 1
http://repositories.cdlib.org/jmie/sfews/vol3/iss2/art1
Rockriver AK. 2004. Vertical distribution of larval delta smelt and striped bass near the confluence of the Sacramento and San Joaquin rivers. In: Freyer, F, Brown LR, Brown RL, Orsi JJ, editors. Early life history of fishes in the San Francisco Estuary and watershed. American Fisheries Society Symposium 39. Bethesda (MD): American Fisheries Society. p 281-295.
Rozensweig ML. 1985. Habitat selection theory. In: Cody ML, editor. Habitat selection in birds. New York: Academic Press.
Saruwatari T, Lopez JA, Pietsch TW. 1997. A revision of the Osmerid genus Hypomesus Gill (Teleostei: Salmoniformes), with the description of a new species from the southern Kuril Islands. Species Diversity 2:59-82.
Shepherd JG, Cushing DH. 1990. Regulation in fish populations: myth or mirage? Philosophical Transactions of the Royal Society of London B Biological Sciences 330:151-164.
Sirois P, Dodson JJ. 2000. Critical periods and growth-dependent survival of larvae of an estuarine fish, the rainbow smelt, Osmerus mordax. Marine Ecology Progress Series 203:233-245.
Sissenwine MP. 1984. Why do fish populations vary? In: May RM, editor. Exploitation of marine communities. Berlin: Springer-Verlag. p 59-94.
Skinner JE. 1962. An historical review of the fish and wildlife resources of the San Francisco Bay area. Water Projects Report No. 1. Sacramento (CA): California Department of Fish and Game. 226 p. Available at: http://www.estuaryarchive.org/archive/skinner_1962/.
Snyder RJ. 1991. Migration and life histories of the threespine stickleback: evidence for adaptive variation in growth rate between populations. Environmental Biology of Fishes 31:381-388.
Sommer TR, Nobriga ML, Harrell WC, Batham W, Kimmerer WJ. 2001. Floodplain rearing of juvenile Chinook salmon: evidence of enhanced growth and survival. Canadian Journal of Fisheries and Aquatic Sciences 58:325-333.
Sousa K. 2002. Revision of California Department of Fish and Game’s spring midwater trawl and results of the 2002 spring Kodiak trawl. IEP Newsletter 15(3):44-47. Available at:!http://www.iep.ca.gov/newsletter.
Stanley SE, Moyle PB, Shaffer HB. 1995. Allozyme analysis of delta smelt, Hypomesus transpacificus and longfin smelt, Spirinchus thaleichthys in the Sacramento-San Joaquin Estuary, California. Copeia 1995:390-396.
Stearns SC. 1992. The evolution of life histories. New York: Oxford University Press.
Stevens DE. 1966. Food habits of striped bass, Roccus saxatilis, in the Sacramento-San Joaquin Delta. Fish Bulletin 136. Sacramento (CA): California Department of Fish and Game. p 68-96.
Stevens DE. 1977. Striped bass (Morone saxatilis) year class strength in relation to river flow in the Sacramento-San Joaquin Estuary, California. Transactions of the American Fisheries Society 106:34-42.
Stevens DE, Miller LW. 1983. Effects of river flow on abundance of young Chinook salmon, American shad, longfin smelt, and delta smelt in the Sacramento-San Joaquin River system. North American Journal of Fishery Management 3:425-437.
69
Bennett: Critical assessment of the delta smelt population
Produced by eScholarship Repository

Stevens DE, Miller LE, Bolster BC. 1990. Report to the Fish and Game Commission: a status review of delta smelt (Hypomesus transpacificus) in California. Candidate Species Status Report 90-2. Sacramento (CA): California Department of Fish and Game.
Strong DR. 1986. Density vagueness: abiding the variance in the demography of real populations. In: Diamond J, Case TJ, editors. Comunity ecology. New York: Harper and Row. p 257-268.
Suchanek TH, Slotton DG, Johnson BS, Ayers S, Nelson DC. 1999. Effects of wetlands restoration on the production of methyl mercury in the San Francisco Bay-Delta system: preliminary results. IEP Newsletter 12(3):19-24. Available at: !http://www.iep.ca.gov/newsletter.
Swanson C, Mager RC, Doroshov SI, Cech JJ. 1996. Use of salts, anesthetics, and polymers, to minimize handling and transport mortality in delta smelt. Transactions of the American Fisheries Society 125:326-329.
Swanson C, Reid T, Young PS, Cech JJ Jr. 2000. Comparative environmental tolerances of threatened delta smelt (Hypomesus transpacificus) and introduced wakasagi (H. nipponensis) in an altered California estuary. Oecologia 123:384-390.
Swanson C, Young PS, Cech JJ. 1998. Swimming behavior of delta smelt in multi-vector flow regimes: applications for fish screens. In: Mackinlay D, Howard K, Cech JJ, editors. International Congress on the Biology of Fish. Bethesda (MD): American Fisheries Society.
Sweetnam DA. 1994. Preliminary results of the Interagency Ecological Program’s delta smelt net evaluation study. Memo from California Dept. of Fish and Game to California Dept. of Water Resources.
Sweetnam DA. 1999. Status of delta smelt in the Sacramento-San Joaquin Estuary. California Fish and Game 85:22-27.
Sweetnam DA, Stevens DE. 1991. Delta smelt study plan. California Department of Fish and Game report. 45 p + appendices.
Sweetnam DA, Stevens DE. 1993. Report to the Fish and Game Commission: a status review of delta smelt (Hypomesus transpacificus) in California. Candidate Species Status Report 93-DS. Sacramento (CA): California Department of Fish and Game.
Sweetnam DA, Baxter RD, Moyle PB. 2001. True smelts. In: California Department of Fish and Game, California Sea Grant Program. California’s living marine resources: a status report. p 472-479.
Tang Z, Xie H, Xie Y, Li B, Li X, Duan K, Yuan F, Sun Y. 2002. Comparative study on the population ecology of Asian smelt (Hypomesus transpacificus nipponesis) and large icefish (Protosalanx hyalocranius) in Shuifeng Reservoir. Journal of Lake Science 14:158-164.
Teh SJ, Adams SM, Hinton DE. 1997. Histopathologic biomarkers of anthropogenic stress in resident redbreast sunfish (Lepomis auritus) and largemouth bass (Micropterus salmoides) from contaminant impacted sites. Aquatic Toxicology 37:51-70.
Thompson B, Hoenicke R, Davis JA, Gunther A. 2000. An overview of contaminant-related issues identified by monitoring in San Francisco Bay. Environmental Monitoring and Assessment 64:409-419.
70
San Francisco Estuary and Watershed Science Vol. 3, Iss. 2 [September 2005], Art. 1
http://repositories.cdlib.org/jmie/sfews/vol3/iss2/art1
Trenham PC, Shaffer HB, Moyle PB. 1998. Biochemical identification and population subdivision in morphologically similar native and invading species (Hypomesus) in the Sacramento-San Joaquin Estuary, California. Transactions of the American Fisheries Society 127:417-424.
Unger PA. 1994. Quantifying salinity habitat of estuarine species. IEP Newsletter 7(Autumn):7-10. Available from: California Dept. of Water Resources, Division of Environmental Services, Sacramento, Calif.
Venables WN, Ripley BD. 1997. Modern applied statistics with S-Plus. 2nd ed. edition. New York: Springer.
Vila-Gispert A, Moreno-Amich R, Garcia-Berthou E. 2002. Gradients of life history variation: an intercontinental comparison of fishes. Reviews in Fish Biology and Fisheries 12:417-427.
Wales JH. 1962. Introduction of pond smelt from Japan into California. California Fish and Game 48:141-142.
Wang JCS. 1986. Fishes of the Sacramento-San Joaquin estuary and adjacent waters, California: a guide to the early life histories. IEP Technical Report 9. Sacramento (CA): California Dept. of Water Resources.
Wang JCS. 1995. Observations of possible larval and pre-juvenile and wakasagi/delta hybrids in the Delta and tributary streams. IEP Newsletter 7(Summer):18-19. Available from: California Dept. of Water Resources, Division of Environmental Services, Sacramento, Calif.
Wang JCS, Brown R. 1991. Early life stages and early life history of the delta smelt, Hypomesus transpacificus, in the Sacramento-San Joaquin Estuary, with comparison of early life stages of the longfin smelt, Spirinchus thaleichthys. IEP Technical Report 28. Sacramento (CA): California Dept. of Water Resources.
Warner RR, Chesson PL. 1985. Coexistence mediated by recruitment fluctuations: a field guide to the storage effect. American Naturalist 125:769-787.
Winemiller KO, Rose KA. 1992. Patterns of life-history diversification in North American fishes: implications for population regulation. Canadian Journal of Fisheries and Aquatic Sciences 49:2196-2218.
Wootton RJ. 1984. Introduction: strategies and tactics in fish reproduction. In: Potts GW, Wootton RJ, editors. Fish reproduction: strategies and tactics. London: Academic Press. p 1-12.
Zaret TM, Rand AS. 1971. Competition in tropical stream fishes: support for the competitive exclusion principle. Ecology 52:336-342.
71
Bennett: Critical assessment of the delta smelt population
Produced by eScholarship Repository


![W W W Wollumbin StreetNullum Street Brisbane Street Attach 1 [EO-CM] Knox Park...e/oe/oe/oe/o e/o e/o e/o e/o e/o e/o e/o e/o e/o e/o sw s s s s s s s s s s sw sw sw sw sw sw sw sw](https://img.pdfslide.us/doc/110x75/5e2bc152ea1ec51fa10481be/w-w-w-wollumbin-streetnullum-street-brisbane-street-attach-1-eo-cm-knox-park.jpg)