Embed Size (px)
Citation preview
C R O P S T O I N D U S T R YC R O P S T O I N D U S T R Y
WP4TaskS 4.1 & 4.2
Task leader: ICCEPT
Crops2IndustryCrops2Industry“Non-food Crops-to-Industry
schemes in EU27”
Calliope Panoutsou & Arturo Castillo
Imperial College [email protected]
C R O P S T O I N D U S T R YC R O P S T O I N D U S T R Y
ContentContent
1. Objectives2. Progress of work3. Results 4. Status of deliverables & milestones5. Problems encountered 6. Plans for the next 6 Months
C R O P S T O I N D U S T R YC R O P S T O I N D U S T R Y
1. Objectives
Objective• perform supply chain
cost analysis, identify best business opportunities and assess the socio-economic impacts of selected crop-to-product schemes at EU-27, regional and country levels.
Tasks• Task 4.1 Modelling
framework• Task 4.2 Data
collection• Task 4.3 Cost analysis• Task 4.4 Socio-
economic assessment
C R O P S T O I N D U S T R YC R O P S T O I N D U S T R Y
2. Progress of work
•Modeling framework: first version ready •Database structure: Prepared•
C R O P S T O I N D U S T R YC R O P S T O I N D U S T R Y
3. Results
Task 4.1 Modelling framework

C R O P S T O I N D U S T R YC R O P S T O I N D U S T R Y
Cost analysis model layout
Assumptions
Crop chain costs
Data review & collection
Production
Harvest
Densification Storage
Transport
Conversion(main & secondary
products)
Input Cost analysis Output
C R O P S T O I N D U S T R YC R O P S T O I N D U S T R Y
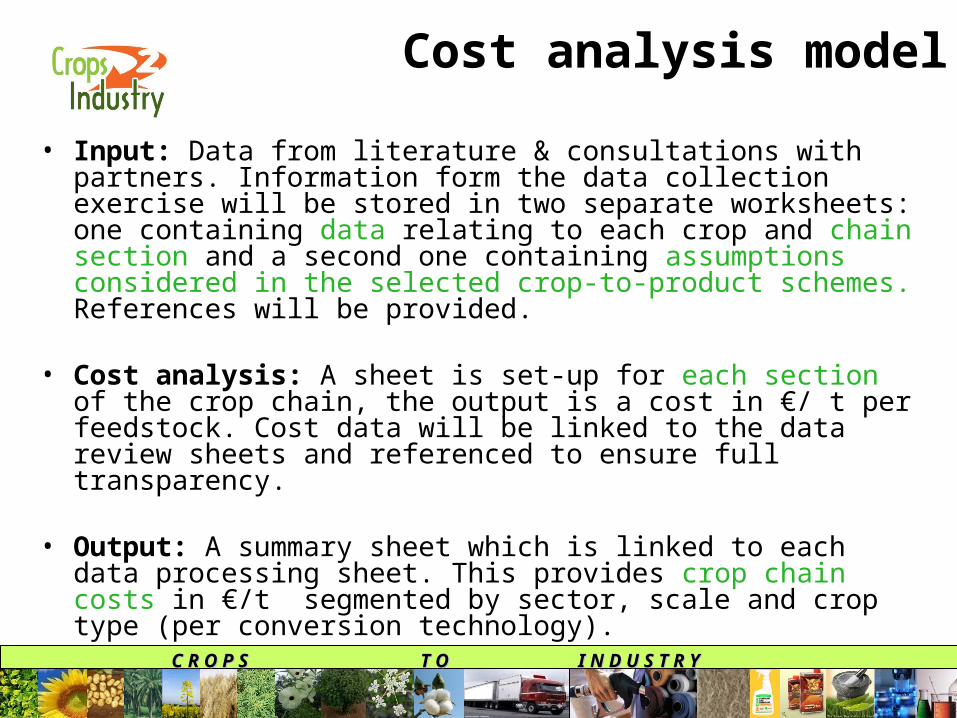
• Input: Data from literature & consultations with partners. Information form the data collection exercise will be stored in two separate worksheets: one containing data relating to each crop and chain section and a second one containing assumptions considered in the selected crop-to-product schemes. References will be provided.
• Cost analysis: A sheet is set-up for each section of the crop chain, the output is a cost in €/ t per feedstock. Cost data will be linked to the data review sheets and referenced to ensure full transparency.
• Output: A summary sheet which is linked to each data processing sheet. This provides crop chain costs in €/t segmented by sector, scale and crop type (per conversion technology).
Cost analysis model
C R O P S T O I N D U S T R YC R O P S T O I N D U S T R Y
Data collection & model validation
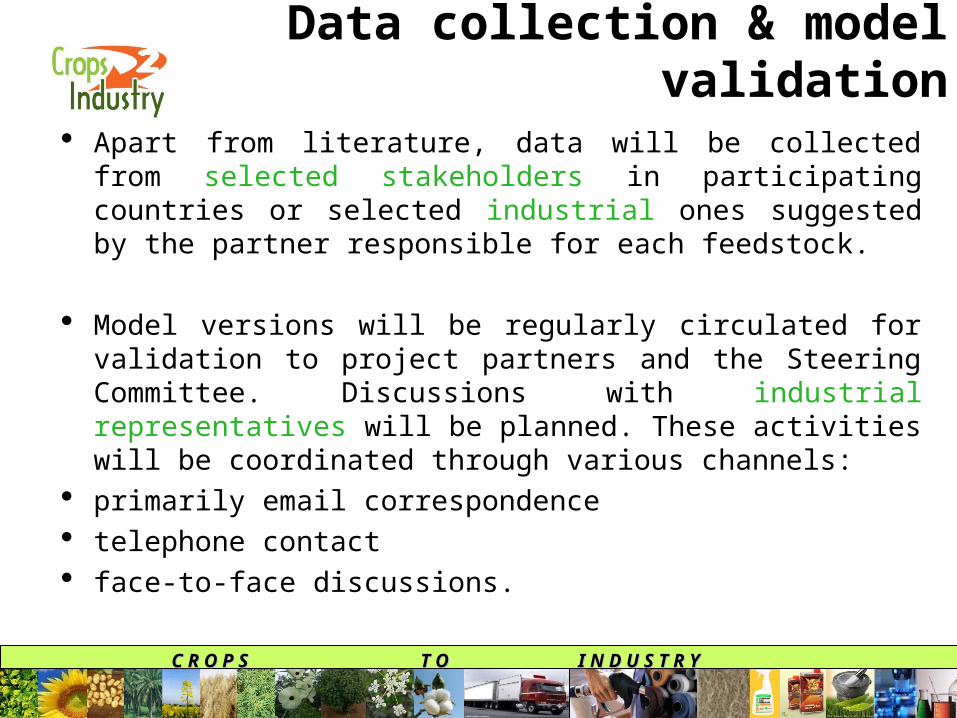
Apart from literature, data will be collected from selected stakeholders in participating countries or selected industrial ones suggested by the partner responsible for each feedstock.
Model versions will be regularly circulated for validation to project partners and the Steering Committee. Discussions with industrial representatives will be planned. These activities will be coordinated through various channels:
primarily email correspondence telephone contact face-to-face discussions.
C R O P S T O I N D U S T R YC R O P S T O I N D U S T R Y
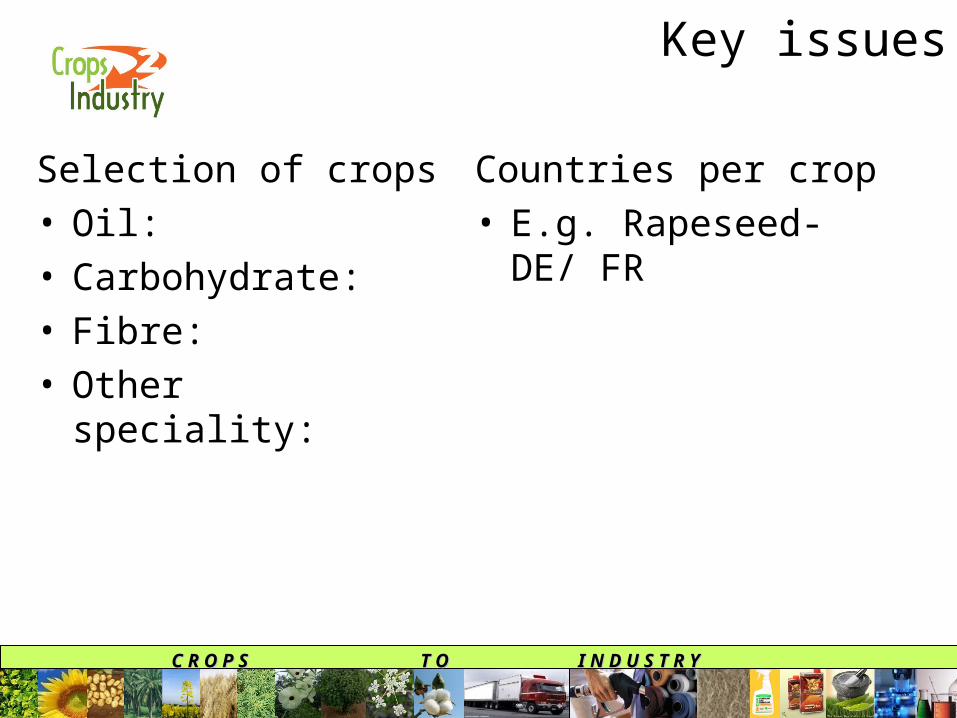
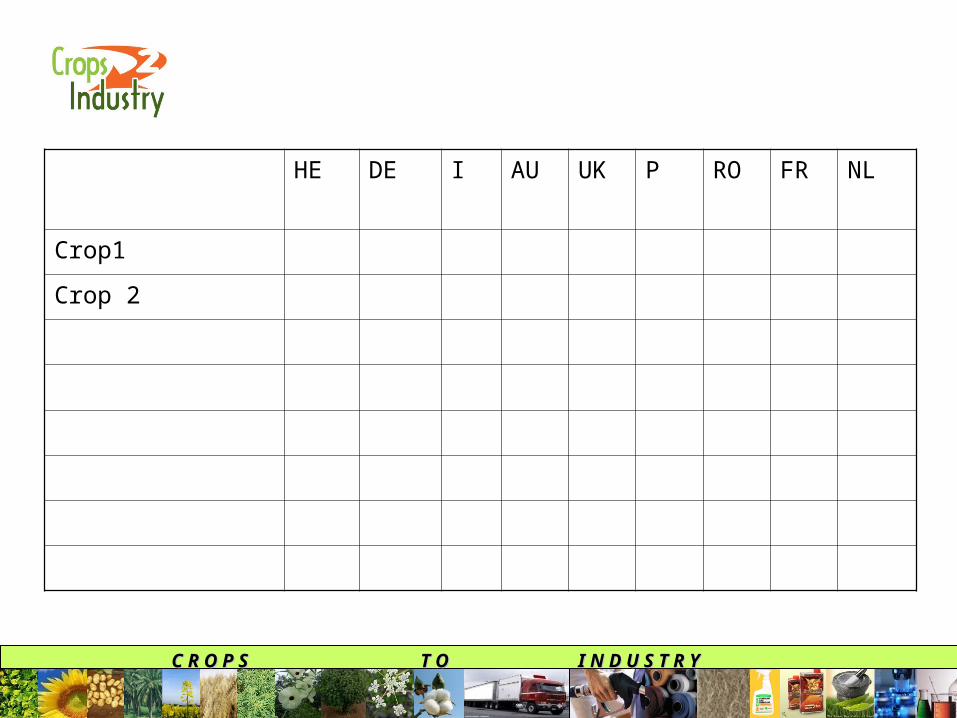
Key issues
Selection of crops• Oil:• Carbohydrate:• Fibre:• Other speciality:
Countries per crop• E.g. Rapeseed- DE/
FR
C R O P S T O I N D U S T R YC R O P S T O I N D U S T R Y
HE DE I AU UK P RO FR NL
Crop1
Crop 2
C R O P S T O I N D U S T R YC R O P S T O I N D U S T R Y
Results
Task 4.2 Database with costs for the crop-to-product scheme steps in each region/ country
C R O P S T O I N D U S T R YC R O P S T O I N D U S T R Y
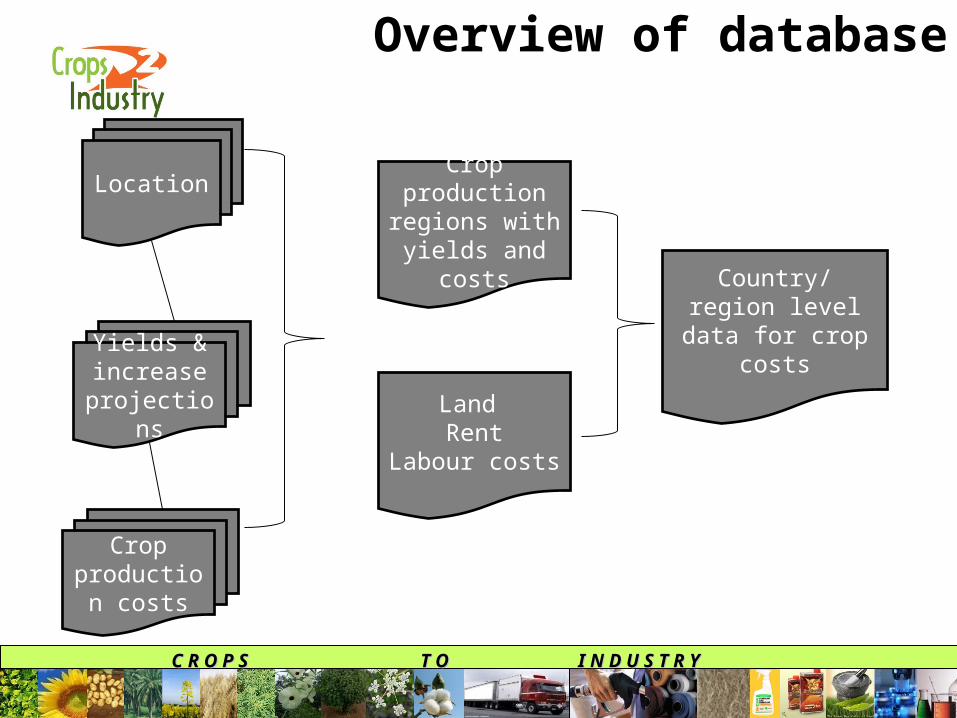
Overview of database
Location
Yields & increase
projections
Crop production regions with
yields and costs
Crop production
costs
Land Rent
Labour costs
Country/ region level data for crop
costs
C R O P S T O I N D U S T R YC R O P S T O I N D U S T R Y
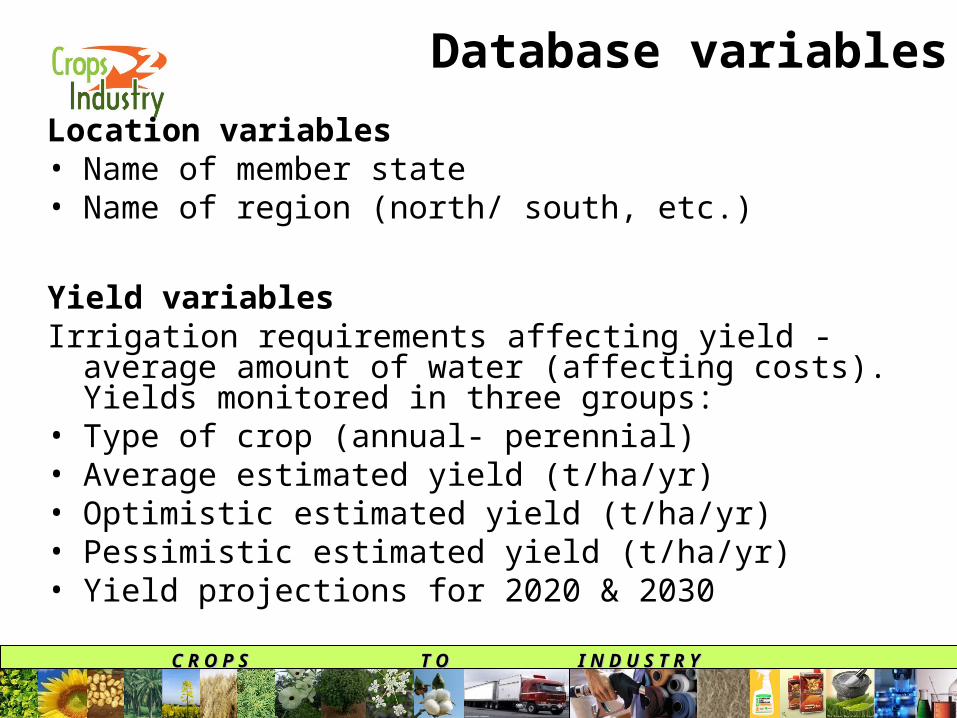
Location variables • Name of member state • Name of region (north/ south, etc.)
Yield variablesIrrigation requirements affecting yield - average amount of
water (affecting costs). Yields monitored in three groups:• Type of crop (annual- perennial)• Average estimated yield (t/ha/yr) • Optimistic estimated yield (t/ha/yr) • Pessimistic estimated yield (t/ha/yr) • Yield projections for 2020 & 2030
Database variables
C R O P S T O I N D U S T R YC R O P S T O I N D U S T R Y
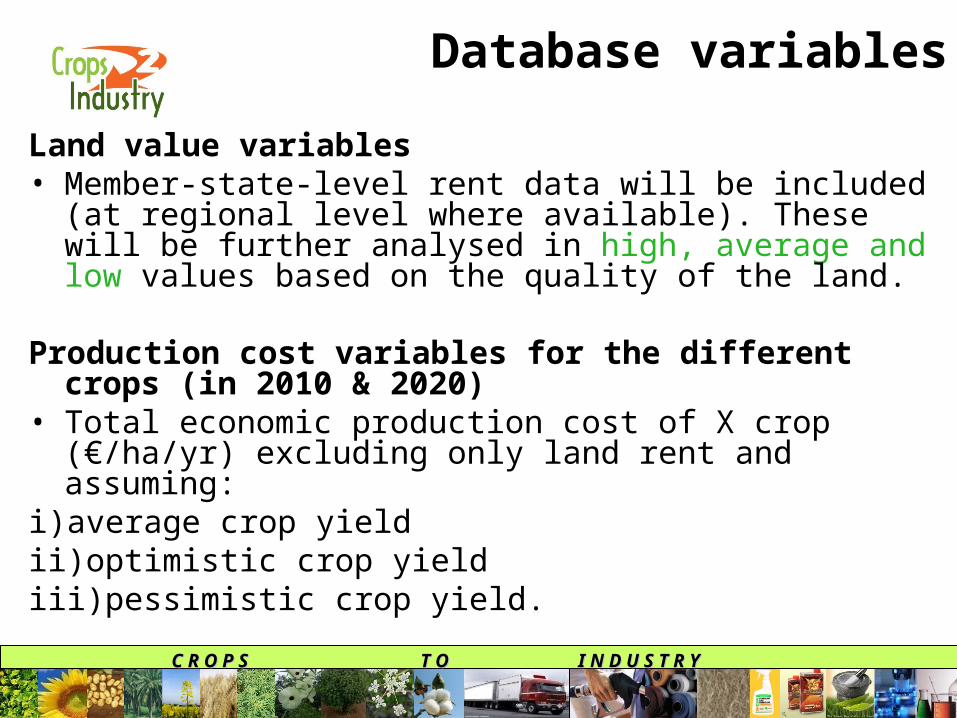
Land value variables• Member-state-level rent data will be included (at regional level
where available). These will be further analysed in high, average and low values based on the quality of the land.
Production cost variables for the different crops (in 2010 & 2020)
• Total economic production cost of X crop (€/ha/yr) excluding only land rent and assuming:
i) average crop yield ii) optimistic crop yieldiii)pessimistic crop yield.
Database variables
C R O P S T O I N D U S T R YC R O P S T O I N D U S T R Y
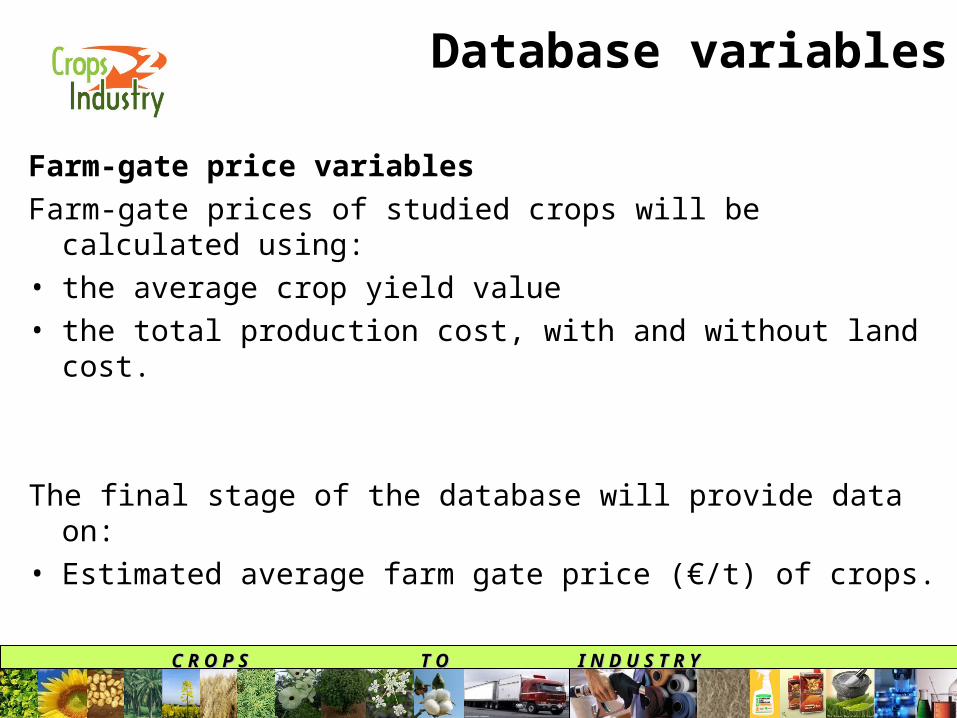
Farm-gate price variables
Farm-gate prices of studied crops will be calculated using:• the average crop yield value • the total production cost, with and without land cost.
The final stage of the database will provide data on:• Estimated average farm gate price (€/t) of crops.
Database variables
C R O P S T O I N D U S T R YC R O P S T O I N D U S T R Y
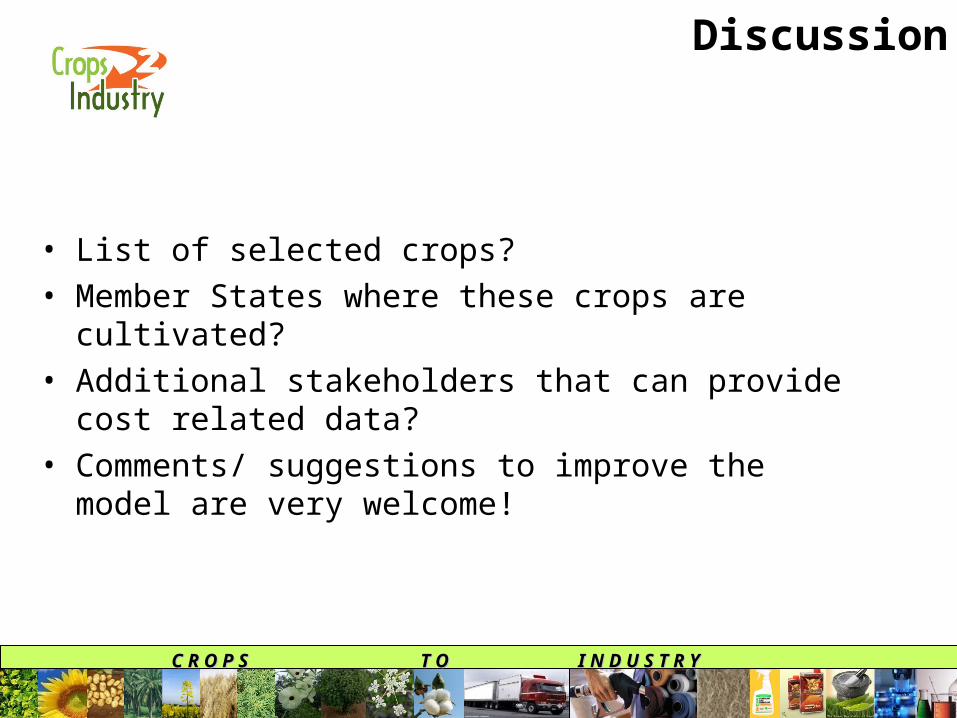
Discussion
• List of selected crops?• Member States where these crops are cultivated?• Additional stakeholders that can provide cost related
data?• Comments/ suggestions to improve the model are very
welcome!
C R O P S T O I N D U S T R YC R O P S T O I N D U S T R Y
4. Status of deliverables & milestones
•D4.1: OK•D4.2: OK
C R O P S T O I N D U S T R YC R O P S T O I N D U S T R Y
5. Problems encountered
•A slight delay in selecting crops & populating the data base linked to the maturity of related deliverables in WP1, due M15.
C R O P S T O I N D U S T R YC R O P S T O I N D U S T R Y
6. Plans for the next 6 months
•Run the model for selected crops (3 per crop category)•Populate database with data from partners•Contact stakeholders for cost data•Validation of first results