Embed Size (px)
Citation preview
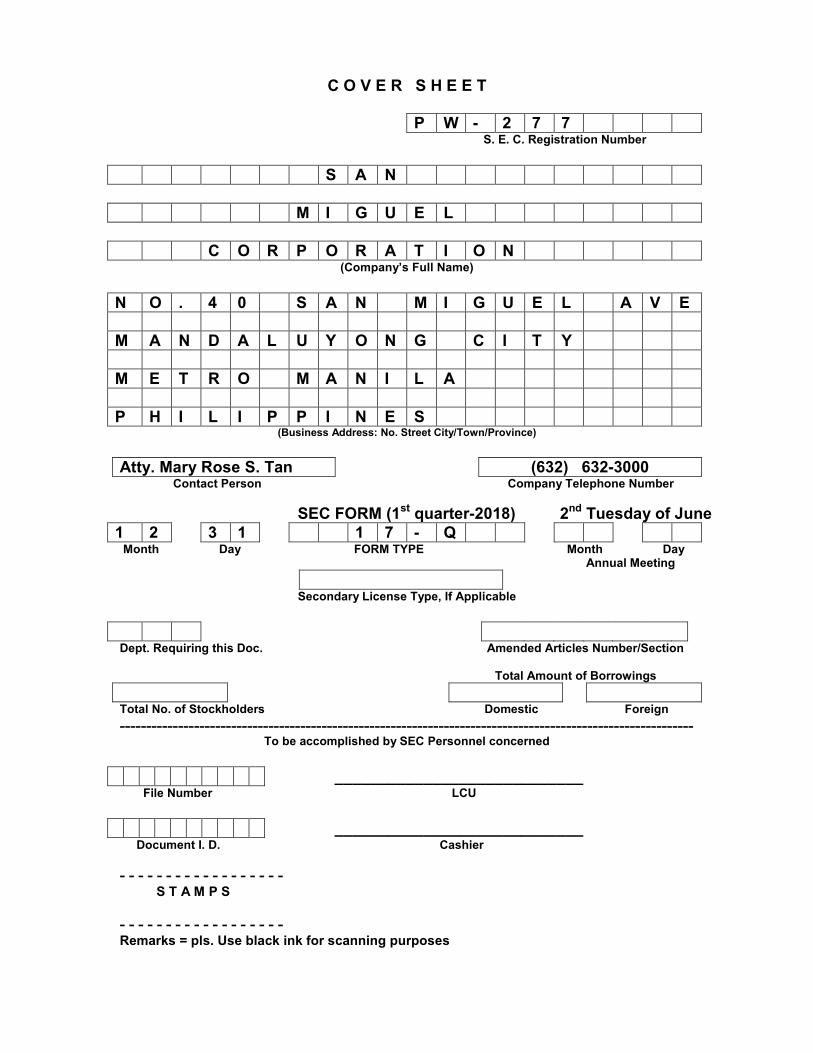
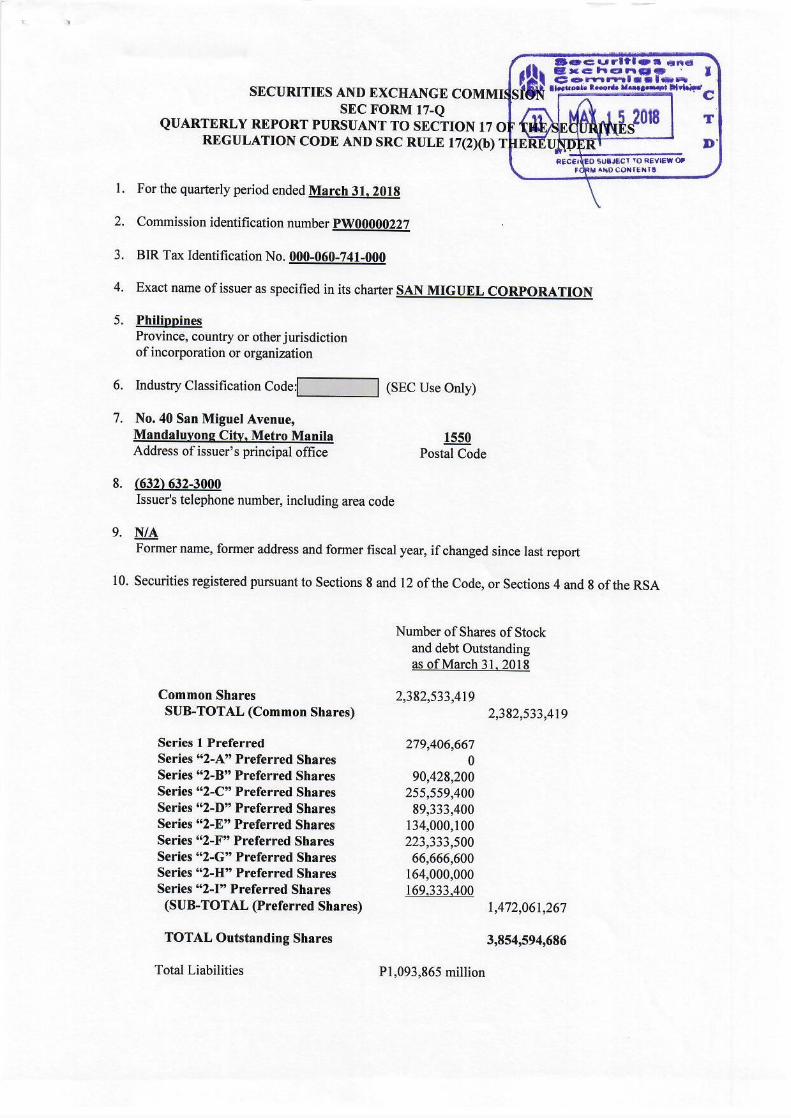
C O V E R S H E E T
P W - 2 7 7 S. E. C. Registration Number
S A N
M I G U E L
C O R P O R A T I O N (Company’s Full Name)
N O . 4 0 S A N M I G U E L A V E
M A N D A L U Y O N G C I T Y
M E T R O M A N I L A
P H I L I P P I N E S (Business Address: No. Street City/Town/Province)
Atty. Mary Rose S. Tan (632) 632-3000 Contact Person Company Telephone Number
SEC FORM (1st quarter-2018) 2nd Tuesday of June
1 2 3 1 1 7 - Q Month Day FORM TYPE Month Day Annual Meeting
Secondary License Type, If Applicable
Dept. Requiring this Doc. Amended Articles Number/Section Total Amount of Borrowings
Total No. of Stockholders Domestic Foreign
------------------------------------------------------------------------------------------------------------
To be accomplished by SEC Personnel concerned
____________________________ File Number LCU
____________________________ Document I. D. Cashier
- - - - - - - - - - - - - - - - - -
S T A M P S
- - - - - - - - - - - - - - - - - -
Remarks = pls. Use black ink for scanning purposes
- 1 -
SAN MIGUEL CORPORATION AND SUBSIDIARIES
SELECTED NOTES TO THE CONSOLIDATED FINANCIAL STATEMENTS (Amounts in Millions, Except Per Share Data)
1. Summary of Significant Accounting and Financial Reporting Policies
The Group prepared its interim consolidated financial statements as of and for the period ended March 31, 2018 and comparative financial statements for the same period in 2017 following the new presentation rules under Philippine Accounting Standard (PAS) No. 34, Interim Financial Reporting. The consolidated financial statements of the Group have been prepared in compliance with Philippine Financial Reporting Standards (PFRS). The consolidated financial statements are presented in Philippine peso and all financial information are rounded off to the nearest million (000,000), except when otherwise indicated.
The principal accounting policies and methods adopted in preparing the interim consolidated financial statements of the Group are the same as those followed in the most recent annual audited consolidated financial statements, except for the changes in accounting policies as explained below. Adoption of New and Amended Standards The Financial Reporting Standards Council (FRSC) approved the adoption of a number of new and amended standards and interpretations as part of PFRS.
New and Amended Standards and Interpretation Adopted in 2018
The Group has adopted the following PFRS effective January 1, 2018 and accordingly, changed its accounting policies in the following areas:
Annual Improvements to PFRS Cycles 2014 - 2016 contain changes to three
standards, of which only the Amendments to PAS 28, Investments in Associates, on measuring an associate or joint venture at fair value is applicable to the Group. The amendments provide that a venture capital organization, or other qualifying entity, may elect to measure its investments in an associate or joint venture at fair value through profit or loss (FVPL). This election can be made on an investment-by-investment basis. The amendments also provide that a non-investment entity investor may elect to retain the fair value accounting applied by an investment entity associate or investment entity joint venture to its subsidiaries. This election can be made separately for each investment entity associate or joint venture.
PFRS 9 (2014), Financial Instruments replaces PAS 39, Financial Instruments: Recognition and Measurement, and supersedes the previously published versions of PFRS 9 that introduced new classifications and measurement requirements (in 2009 and 2010) and a new hedge accounting model (in 2013). PFRS 9 includes revised guidance on the classification and measurement of financial assets, including a new expected credit loss model for calculating impairment, guidance on own credit risk on financial liabilities measured at fair value and supplements the new general hedge accounting requirements. PFRS 9 incorporates new hedge accounting requirements that represent a major overhaul of hedge accounting and introduces significant improvements by aligning the accounting more closely with risk management.
- 2 -
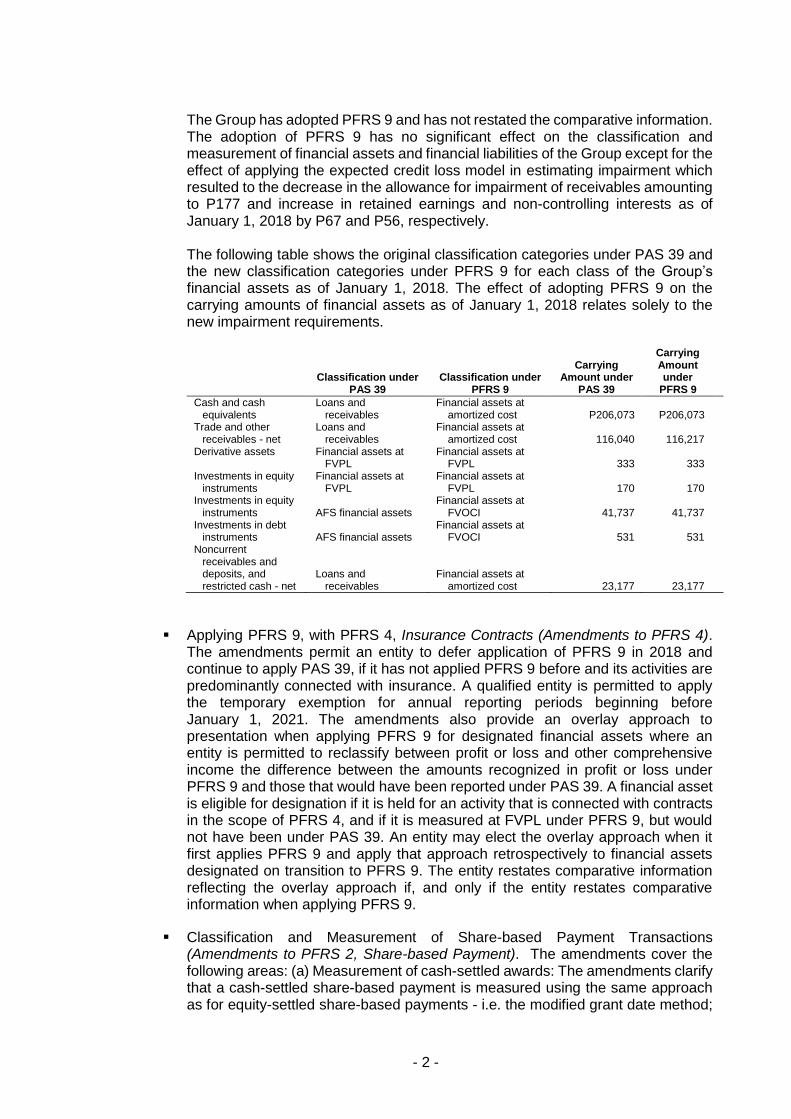
The Group has adopted PFRS 9 and has not restated the comparative information. The adoption of PFRS 9 has no significant effect on the classification and measurement of financial assets and financial liabilities of the Group except for the effect of applying the expected credit loss model in estimating impairment which resulted to the decrease in the allowance for impairment of receivables amounting to P177 and increase in retained earnings and non-controlling interests as of January 1, 2018 by P67 and P56, respectively. The following table shows the original classification categories under PAS 39 and the new classification categories under PFRS 9 for each class of the Group’s financial assets as of January 1, 2018. The effect of adopting PFRS 9 on the carrying amounts of financial assets as of January 1, 2018 relates solely to the new impairment requirements.
Classification under PAS 39
Classification under PFRS 9
Carrying Amount under
PAS 39
Carrying Amount under
PFRS 9
Cash and cash equivalents
Loans and receivables
Financial assets at amortized cost P206,073 P206,073
Trade and other receivables - net
Loans and receivables
Financial assets at amortized cost 116,040 116,217
Derivative assets
Financial assets at FVPL
Financial assets at FVPL 333 333
Investments in equity instruments
Financial assets at FVPL
Financial assets at FVPL 170 170
Investments in equity instruments AFS financial assets
Financial assets at FVOCI 41,737 41,737
Investments in debt instruments AFS financial assets
Financial assets at FVOCI 531 531
Noncurrent receivables and deposits, and restricted cash - net
Loans and receivables
Financial assets at amortized cost 23,177 23,177
Applying PFRS 9, with PFRS 4, Insurance Contracts (Amendments to PFRS 4). The amendments permit an entity to defer application of PFRS 9 in 2018 and continue to apply PAS 39, if it has not applied PFRS 9 before and its activities are predominantly connected with insurance. A qualified entity is permitted to apply the temporary exemption for annual reporting periods beginning before January 1, 2021. The amendments also provide an overlay approach to presentation when applying PFRS 9 for designated financial assets where an entity is permitted to reclassify between profit or loss and other comprehensive income the difference between the amounts recognized in profit or loss under PFRS 9 and those that would have been reported under PAS 39. A financial asset is eligible for designation if it is held for an activity that is connected with contracts in the scope of PFRS 4, and if it is measured at FVPL under PFRS 9, but would not have been under PAS 39. An entity may elect the overlay approach when it first applies PFRS 9 and apply that approach retrospectively to financial assets designated on transition to PFRS 9. The entity restates comparative information reflecting the overlay approach if, and only if the entity restates comparative information when applying PFRS 9.
Classification and Measurement of Share-based Payment Transactions (Amendments to PFRS 2, Share-based Payment). The amendments cover the following areas: (a) Measurement of cash-settled awards: The amendments clarify that a cash-settled share-based payment is measured using the same approach as for equity-settled share-based payments - i.e. the modified grant date method;
- 3 -
(b) Classification of awards settled net of withholding tax: The amendments introduce an exception stating that, for classification purposes, a share-based payment transaction with employees is accounted for as equity-settled if: (i) the terms of the arrangement permit or require an entity to settle the transaction by withholding a specified portion of the equity instruments to meet the statutory tax withholding requirement (the net settlement feature); and (ii) the entire share-based payment transaction would otherwise be classified as equity-settled if there were no net settlement feature. The exception does not apply to equity instruments that the entity withholds in excess of the employee’s tax obligation associated with the share-based payment. (c) Modification of awards from cash-settled to equity-settled. The amendments clarify that when a share-based payment is modified from cash-settled to equity-settled at modification date, the liability for the original cash-settled share-based payment is derecognized and the equity-settled share-based payment is measured at its fair value and recognized to the extent that the goods or services have been received up to that date. The difference between the carrying amount of the liability derecognized, and the amount recognized in equity, is immediately recognized in the consolidated statements of income.
PFRS 15, Revenue from Contracts with Customers, replaces PAS 11,
Construction Contracts, PAS 18, Revenue, IFRIC 13, Customer Loyalty Programmes, IFRIC 18, Transfer of Assets from Customers and Standard Interpretation Committee - 31, Revenue - Barter Transactions Involving Advertising Services. The new standard introduces a new revenue recognition model for contracts with customers which specifies that revenue should be recognized when (or as) the Group transfers control of goods or services to a customer at the amount to which the Group expects to be entitled. Depending on whether certain criteria are met, revenue is recognized over time, in a manner that best reflects the Group’s performance, or at a point in time, when control of the goods or services is transferred to the customer. The standard does not apply to insurance contracts, financial instruments or lease contracts, which fall in the scope of other PFRS. It also does not apply if two companies in the same line of business exchange nonmonetary assets to facilitate sales to other parties. Furthermore, if a contract with a customer is partly in the scope of another PFRS, then the guidance on separation and measurement contained in the other PFRS takes precedence.
The Group has adopted PFRS 15 using the cumulative effect method. The cumulative effect of applying the new standard is recognized at the beginning of the year of initial application, with no restatement of comparative period. The impact of the adoption decreased retained earnings as of January 1, 2018 by P53.
- 4 -
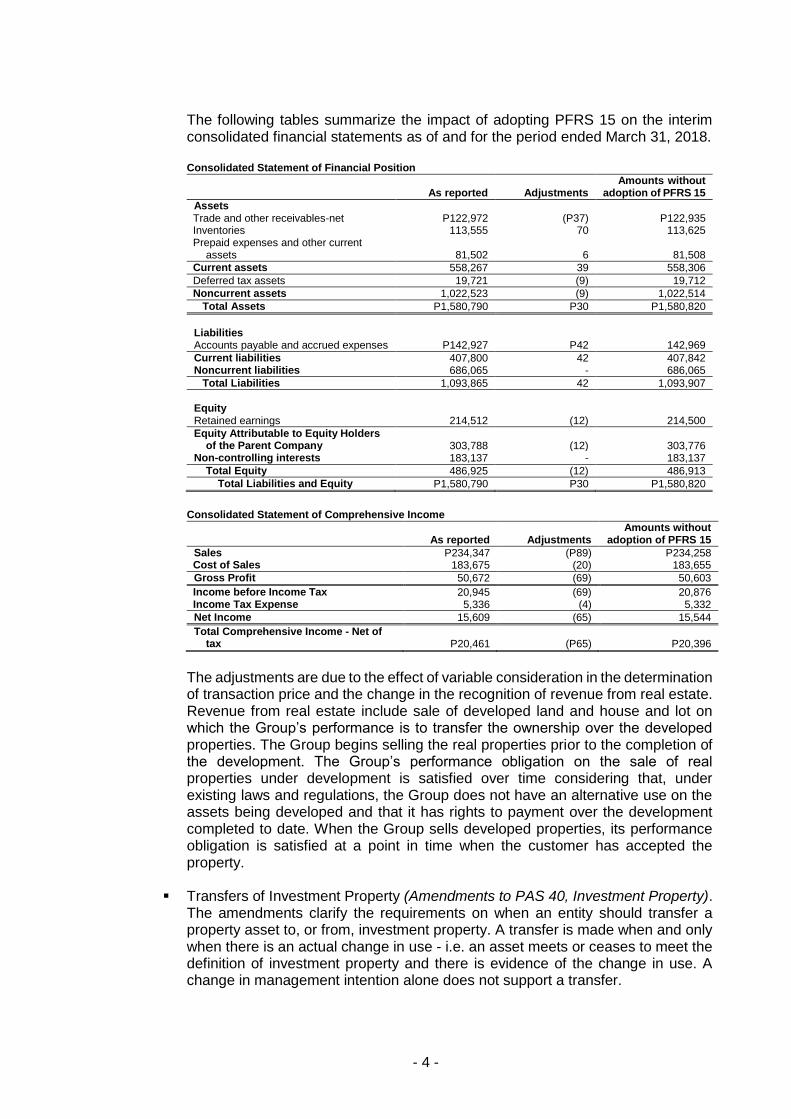
The following tables summarize the impact of adopting PFRS 15 on the interim consolidated financial statements as of and for the period ended March 31, 2018. Consolidated Statement of Financial Position
As reported Adjustments
Amounts without adoption of PFRS 15
Assets Trade and other receivables-net P122,972 (P37) P122,935 Inventories 113,555 70 113,625 Prepaid expenses and other current
assets 81,502
6
81,508
Current assets 558,267 39 558,306
Deferred tax assets 19,721 (9) 19,712
Noncurrent assets 1,022,523 (9) 1,022,514
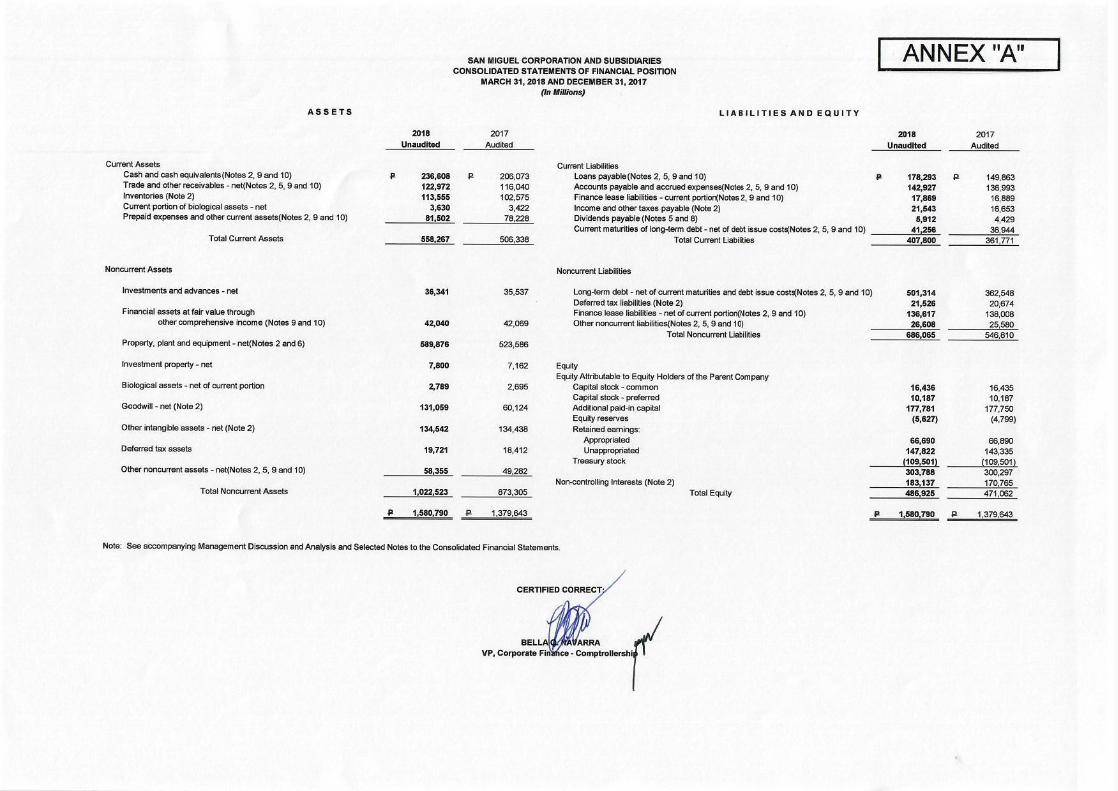
Total Assets P1,580,790 P30 P1,580,820
Liabilities Accounts payable and accrued expenses P142,927 P42 142,969
Current liabilities 407,800 42 407,842 Noncurrent liabilities 686,065 - 686,065
Total Liabilities 1,093,865 42 1,093,907
Equity Retained earnings 214,512 (12) 214,500
Equity Attributable to Equity Holders of the Parent Company 303,788
(12)
303,776
Non-controlling interests 183,137 - 183,137
Total Equity 486,925 (12) 486,913
Total Liabilities and Equity P1,580,790 P30 P1,580,820
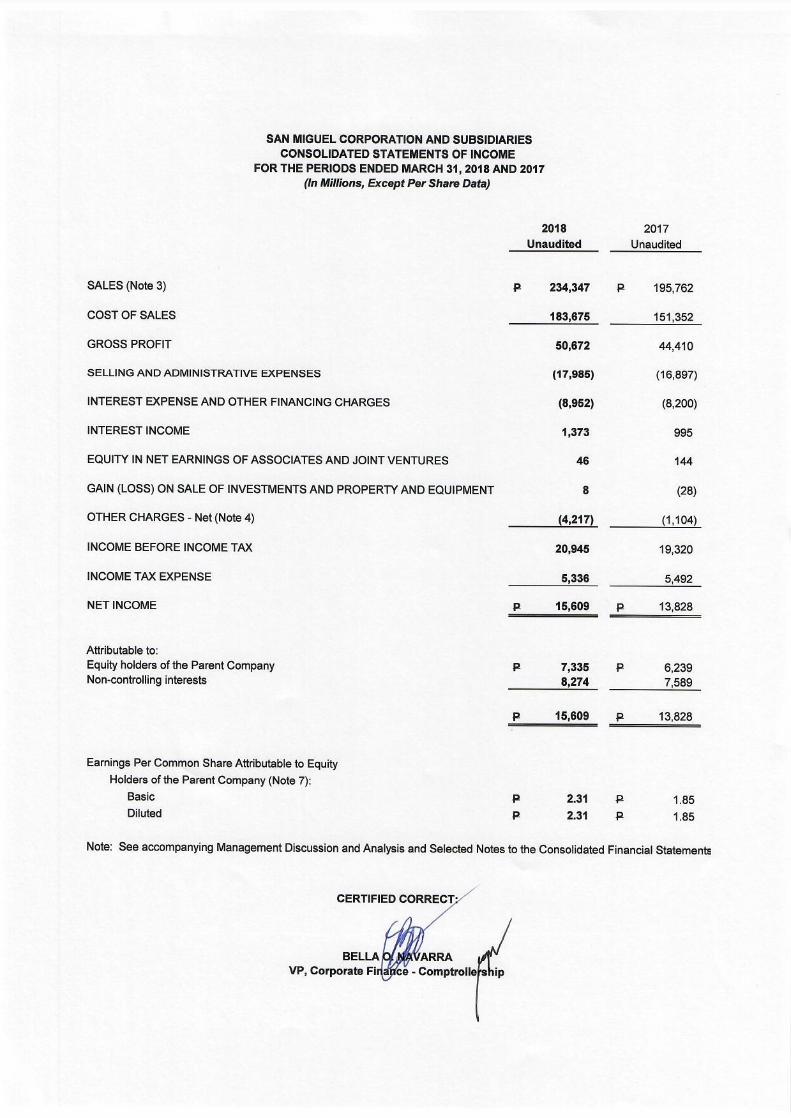
Consolidated Statement of Comprehensive Income
As reported Adjustments
Amounts without adoption of PFRS 15
Sales P234,347 (P89) P234,258 Cost of Sales 183,675 (20) 183,655
Gross Profit 50,672 (69) 50,603
Income before Income Tax 20,945 (69) 20,876 Income Tax Expense 5,336 (4) 5,332
Net Income 15,609 (65) 15,544
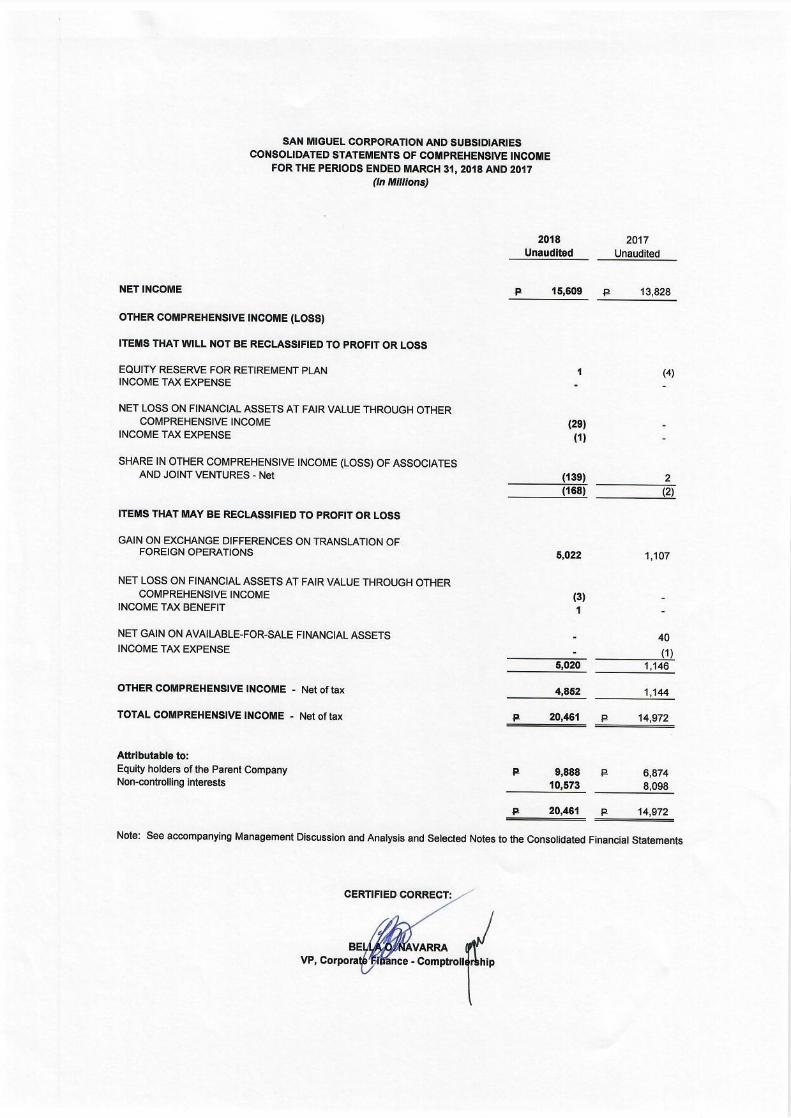
Total Comprehensive Income - Net of tax P20,461
(P65)
P20,396
The adjustments are due to the effect of variable consideration in the determination of transaction price and the change in the recognition of revenue from real estate. Revenue from real estate include sale of developed land and house and lot on which the Group’s performance is to transfer the ownership over the developed properties. The Group begins selling the real properties prior to the completion of the development. The Group’s performance obligation on the sale of real properties under development is satisfied over time considering that, under existing laws and regulations, the Group does not have an alternative use on the assets being developed and that it has rights to payment over the development completed to date. When the Group sells developed properties, its performance obligation is satisfied at a point in time when the customer has accepted the property.
Transfers of Investment Property (Amendments to PAS 40, Investment Property).
The amendments clarify the requirements on when an entity should transfer a property asset to, or from, investment property. A transfer is made when and only when there is an actual change in use - i.e. an asset meets or ceases to meet the definition of investment property and there is evidence of the change in use. A change in management intention alone does not support a transfer.
- 5 -
Philippine Interpretation IFRIC 22, Foreign Currency Transactions and Advance
Consideration. The amendments clarify that the transaction date to be used for translation of foreign currency transactions involving an advance payment or receipt is the date on which the entity initially recognizes the prepayment or deferred income arising from the advance consideration. For transactions involving multiple payments or receipts, each payment or receipt gives rise to a separate transaction date. The interpretation applies when an entity pays or receives consideration in a foreign currency and recognizes a non-monetary asset or liability before recognizing the related item.
Except as otherwise indicated, the adoption of these foregoing new and amended standards and interpretation did not have a material effect on the interim consolidated financial statements. New and Amended Standards and Interpretation Not Yet Adopted A number of new and amended standards and interpretations are effective for annual periods beginning after January 1, 2018 and have not been applied in preparing the interim consolidated financial statements. Unless otherwise indicated, none of these is expected to have a significant effect on the interim consolidated financial statements.
The Group will adopt the following new and amended standards and interpretations on the respective effective dates:
PFRS 16, Leases, supersedes PAS 17, Leases, and the related Philippine
Interpretations. The new standard introduces a single lease accounting model for lessees under which all major leases are recognized on-balance sheet, removing the lease classification test. Lease accounting for lessors essentially remains unchanged except for a number of details including the application of the new lease definition, new sale-and-leaseback guidance, new sub-lease guidance and new disclosure requirements. Practical expedients and targeted reliefs were introduced including an optional lessee exemption for short-term leases (leases with a term of 12 months or less) and low-value items, as well as the permission of portfolio-level accounting instead of applying the requirements to individual leases. New estimates and judgmental thresholds that affect the identification, classification and measurement of lease transactions, as well as requirements to reassess certain key estimates and judgments at each reporting date were introduced. PFRS 16 is effective for annual periods beginning on or after January 1, 2019. Earlier application is permitted for entities that apply PFRS 15 at or before the date of initial application of PFRS 16. The Group is currently assessing the potential impact of the new standard.
Philippine Interpretation IFRIC 23, Uncertainty over Income Tax Treatments,
clarifies how to apply the recognition and measurement requirements in PAS 12, Income Taxes, when there is uncertainty over income tax treatments. Under the interpretation, whether the amounts recorded in the consolidated financial statements will differ to that in the tax return, and whether the uncertainty is disclosed or reflected in the measurement, depends on whether it is probable that the tax authority will accept the Group’s chosen tax treatment. If it is not probable that the tax authority will accept the Group’s chosen tax treatment, the uncertainty is reflected using the measure that provides the better prediction of the resolution
- 6 -
of the uncertainty - either the most likely amount or the expected value. The interpretation also requires the reassessment of judgments and estimates applied if facts and circumstances change - e.g. as a result of examination or action by tax authorities, following changes in tax rules or when a tax authority’s right to challenge a treatment expires. The interpretation is effective for annual periods beginning on or after January 1, 2019 with earlier application permitted. The interpretation was approved by the FRSC on July 12, 2017 but is still subject to the approval by the Board of Accountancy (BOA).
Sale or Contribution of Assets between an Investor and its Associate or Joint Venture (Amendments to PFRS 10, Consolidated Financial Statements, and PAS 28). The amendments address an inconsistency in the requirements in PFRS 10 and PAS 28 in dealing with the sale or contribution of assets between an investor and its associate or joint venture. The amendments require that a full gain or loss is recognized when a transaction involves a business whether it is housed in a subsidiary or not. A partial gain or loss is recognized when a transaction involves assets that do not constitute a business, even if these assets are housed in a subsidiary. Originally, the amendments apply prospectively for annual periods beginning on or after January 1, 2016, with early adoption permitted. However on January 13, 2016, the FRSC decided to postpone the effective date until the International Accounting Standards Board has completed its broader review of the research project on equity accounting that may result in the simplification of accounting for such transactions and of other aspects of accounting for associates and joint ventures.
Prepayment Features with Negative Compensation (Amendments to PFRS 9). The amendments cover the following areas: (a) Prepayment features with negative compensation. The amendment clarifies that a financial asset with a prepayment feature could be eligible for measurement at amortized cost or fair value through other comprehensive income (FVOCI) irrespective of the event or circumstance that causes the early termination of the contract, which may be within or beyond the control of the parties, and a party may either pay or receive reasonable compensation for that early termination. The amendment is effective for annual periods beginning on or after January 1, 2019 with early adoption permitted. Retrospective application is required, subject to relevant transitional reliefs; and (b) Modification of financial liabilities. The amendment to the Basis for Conclusions on PFRS 9 clarifies that the standard provide an adequate basis for an entity to account for modifications and exchanges of financial liabilities that do not result in derecognition and the treatment is consistent with the requirements for adjusting the gross carrying amount of a financial asset when a modification does not result in the derecognition of the financial asset - i.e. the amortized cost of the modified financial liability is recalculated by discounting the modified contractual cash flows using the original effective interest rate and any adjustment is recognized in profit or loss. If the initial application of PFRS 9 results in a change in accounting policy for these modifications or exchanges, then retrospective application is required, subject to relevant transition reliefs.
The amendments were approved by the FRSC on November 8, 2017 but is still subject to the approval by the BOA.
- 7 -
Long-term Interests (LTI) in Associates and Joint Ventures (Amendments to PAS 28). The amendment requires the application of PFRS 9 to other financial instruments in an associate or joint venture to which the equity method is not applied. These include long-term interests that, in substance, form part of the entity's net investment in an associate or joint venture. The amendment explains the annual sequence in which PFRS 9 and PFRS 28 are to be applied. In effect, PFRS 9 is first applied ignoring any PAS 28 loss absorption in prior years. If necessary, prior years’ PAS 28 loss allocation is adjusted in the current year which may involve recognizing more prior years’ losses, reversing these losses or re-allocating them between different LTI instruments. Any current year PAS 28 losses are allocated to the extent that the remaining LTI balance allows and any current year PAS 28 profits reverse any unrecognized prior years’ losses and then allocations against LTI. The amendment is effective for annual periods beginning on or after January 1, 2019 with early adoption permitted. Retrospective application is required, subject to relevant transitional reliefs.
The amendments were approved by the FRSC on November 8, 2017 but is still subject to the approval by the BOA.
Plan Amendment, Curtailment or Settlement (Amendments to PAS 19, Employee Benefits). The amendments clarify that: (a) current service cost and net interest for the period are determined using the actuarial assumptions when amendment, curtailment or settlement occurs; and (b) the effect of the asset ceiling is disregarded when calculating the gain or loss on any settlement of the plan and is dealt with separately in other comprehensive income.
The amendments apply for plan amendments, curtailments or settlements that occur on or after January 1, 2019, or the date on which the amendments are first applied, with earlier application permitted. The amendments were approved by the FRSC on March 14, 2018 but is still subject to the approval by the BOA.
Annual Improvements to PFRS Cycles 2015 - 2017 contain changes to three standards:
o Previously Held Interest in a Joint Operation (Amendments to PFRS 3,
Business Combinations and PFRS 11, Joint Arrangements). The amendments clarify how an entity accounts for increasing its interest in a joint operation that meets the definition of a business. If an entity maintains (or obtains) joint control, the previously held interest is not remeasured. If an entity obtains control, the transaction is a business combination achieved in stages and the acquiring entity remeasures the previously held interest at fair value.
The amendments are effective for annual periods beginning on or after January 1, 2019, with early adoption permitted.
- 8 -
o Income Tax Consequences of Payments on Financial Instrument Classified as Equity (Amendments to PAS 12, Income Taxes). The amendments clarify that all income tax consequences of dividends (including payments on financial instruments classified as equity) are recognized consistently with the transactions that generated the distributable profits - i.e., in profit or loss, other comprehensive income or equity. The amendments are effective for annual periods beginning on or after January 1, 2019, with early adoption permitted.
o Borrowing Costs Eligible for Capitalization (Amendments to PAS 23, Borrowing Costs). The amendments clarify that the general borrowings pool used to calculate eligible borrowing costs excludes borrowings that specifically finance qualifying assets that are still under development or construction. Borrowings that were intended to specifically finance qualifying assets that are now ready for their intended use or sale, or any non-qualifying assets, are included in that general pool. The amendments are effective for annual periods beginning on or after January 1, 2019, with early adoption permitted. The amendments were approved by the FRSC on March 14, 2018 but is still subject to the approval by the BOA.
Amendments to References to the Conceptual Framework in IFRS Standards. The
amendments introduce the following main improvements: (a) concept on measurement, including factors to be considered when selecting a measurement basis; (b) concept on presentation and disclosure, including when to classify income and expenses in other comprehensive income; (c) guidance on the recognition and derecognition of assets and liabilities in the consolidated financial statements; (d) improved definitions of an asset and a liability; and (e) clarifications in important areas, such as the roles of stewardship, prudence and measurement uncertainty in financial reporting. The amendments are effective for annual periods beginning on or after January 1, 2020.
PFRS 17, Insurance Contracts. PFRS 17 provides updated information about the obligation, risks and performance of insurance contracts, increases transparency in financial information reported by insurance companies, and introduces consistent accounting for all insurance contracts based on a current measurement model. The standard is effective for annual periods beginning on or after January 1, 2021. Early application is permitted for entities that apply PFRS 9 and PFRS 15. The new standard was approved by the FRSC on March 14, 2018 but is still subject to the approval by the BOA.
- 9 -
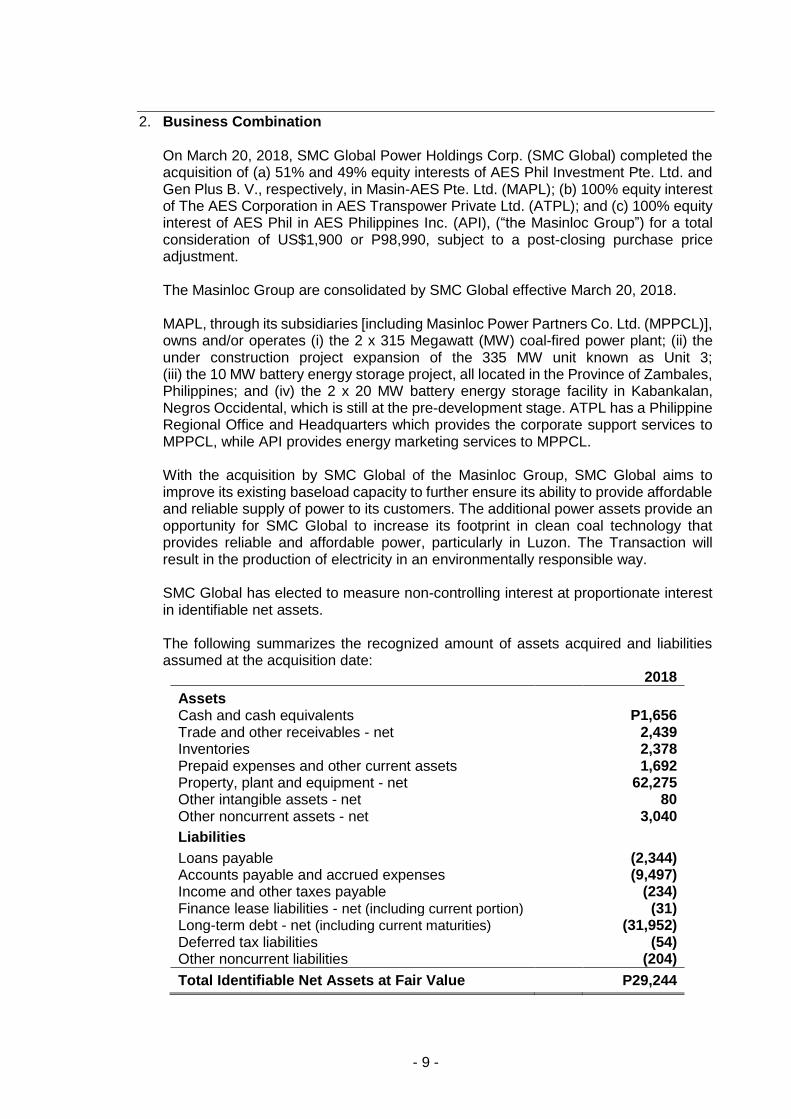
2. Business Combination On March 20, 2018, SMC Global Power Holdings Corp. (SMC Global) completed the acquisition of (a) 51% and 49% equity interests of AES Phil Investment Pte. Ltd. and Gen Plus B. V., respectively, in Masin-AES Pte. Ltd. (MAPL); (b) 100% equity interest of The AES Corporation in AES Transpower Private Ltd. (ATPL); and (c) 100% equity interest of AES Phil in AES Philippines Inc. (API), (“the Masinloc Group”) for a total consideration of US$1,900 or P98,990, subject to a post-closing purchase price adjustment. The Masinloc Group are consolidated by SMC Global effective March 20, 2018. MAPL, through its subsidiaries [including Masinloc Power Partners Co. Ltd. (MPPCL)], owns and/or operates (i) the 2 x 315 Megawatt (MW) coal-fired power plant; (ii) the under construction project expansion of the 335 MW unit known as Unit 3; (iii) the 10 MW battery energy storage project, all located in the Province of Zambales, Philippines; and (iv) the 2 x 20 MW battery energy storage facility in Kabankalan, Negros Occidental, which is still at the pre-development stage. ATPL has a Philippine Regional Office and Headquarters which provides the corporate support services to MPPCL, while API provides energy marketing services to MPPCL. With the acquisition by SMC Global of the Masinloc Group, SMC Global aims to improve its existing baseload capacity to further ensure its ability to provide affordable and reliable supply of power to its customers. The additional power assets provide an opportunity for SMC Global to increase its footprint in clean coal technology that provides reliable and affordable power, particularly in Luzon. The Transaction will result in the production of electricity in an environmentally responsible way. SMC Global has elected to measure non-controlling interest at proportionate interest in identifiable net assets. The following summarizes the recognized amount of assets acquired and liabilities assumed at the acquisition date:
2018
Assets Cash and cash equivalents P1,656 Trade and other receivables - net 2,439 Inventories 2,378 Prepaid expenses and other current assets 1,692 Property, plant and equipment - net 62,275 Other intangible assets - net 80 Other noncurrent assets - net 3,040
Liabilities
Loans payable (2,344) Accounts payable and accrued expenses (9,497) Income and other taxes payable (234) Finance lease liabilities - net (including current portion) (31) Long-term debt - net (including current maturities) (31,952) Deferred tax liabilities (54) Other noncurrent liabilities (204)
Total Identifiable Net Assets at Fair Value P29,244
- 10 -
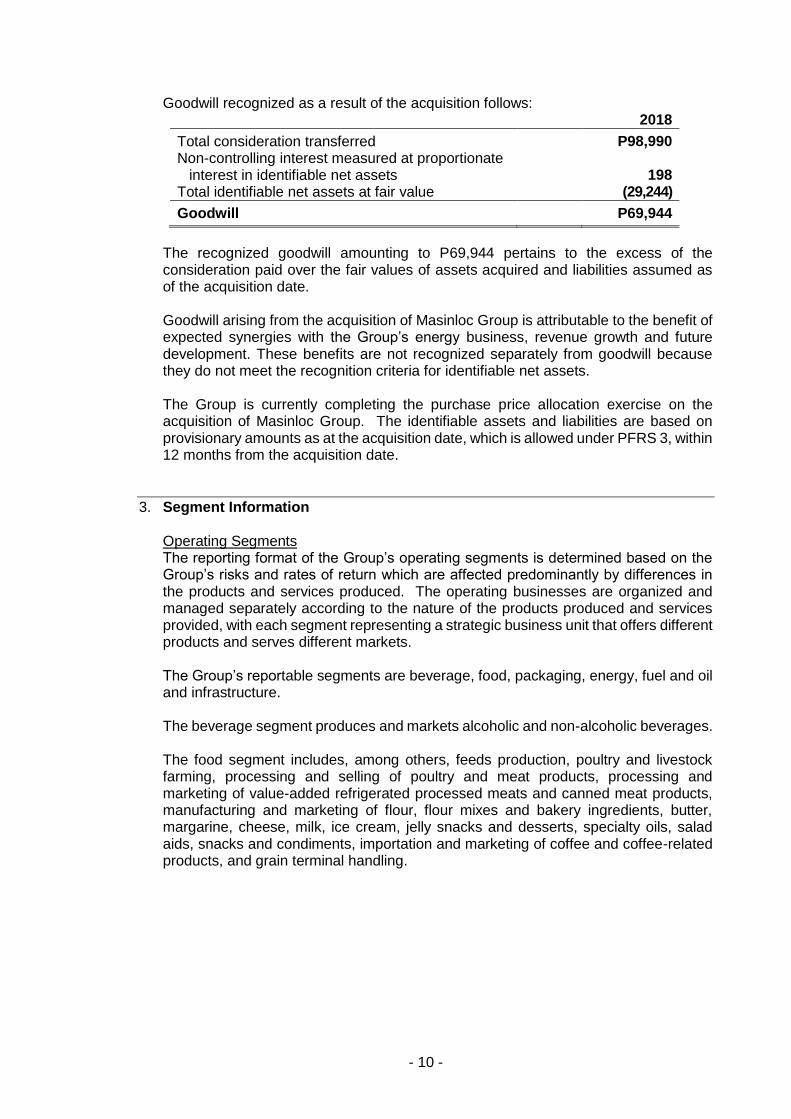
Goodwill recognized as a result of the acquisition follows: 2018
Total consideration transferred P98,990
Non-controlling interest measured at proportionate interest in identifiable net assets 198
Total identifiable net assets at fair value (29,244)
Goodwill P69,944
The recognized goodwill amounting to P69,944 pertains to the excess of the consideration paid over the fair values of assets acquired and liabilities assumed as of the acquisition date.
Goodwill arising from the acquisition of Masinloc Group is attributable to the benefit of expected synergies with the Group’s energy business, revenue growth and future development. These benefits are not recognized separately from goodwill because they do not meet the recognition criteria for identifiable net assets. The Group is currently completing the purchase price allocation exercise on the acquisition of Masinloc Group. The identifiable assets and liabilities are based on provisionary amounts as at the acquisition date, which is allowed under PFRS 3, within 12 months from the acquisition date.
3. Segment Information
Operating Segments The reporting format of the Group’s operating segments is determined based on the Group’s risks and rates of return which are affected predominantly by differences in the products and services produced. The operating businesses are organized and managed separately according to the nature of the products produced and services provided, with each segment representing a strategic business unit that offers different products and serves different markets.
The Group’s reportable segments are beverage, food, packaging, energy, fuel and oil and infrastructure. The beverage segment produces and markets alcoholic and non-alcoholic beverages. The food segment includes, among others, feeds production, poultry and livestock farming, processing and selling of poultry and meat products, processing and marketing of value-added refrigerated processed meats and canned meat products, manufacturing and marketing of flour, flour mixes and bakery ingredients, butter, margarine, cheese, milk, ice cream, jelly snacks and desserts, specialty oils, salad aids, snacks and condiments, importation and marketing of coffee and coffee-related products, and grain terminal handling.
- 11 -
The packaging segment is involved in the production and marketing of packaging products including, among others, glass containers, glass molds, polyethylene terephthalate (PET) bottles and preforms, PET recycling, plastic closures, corrugated cartons, woven polypropylene, kraft sacks and paperboard, pallets, flexible packaging, plastic crates, plastic floorings, plastic films, plastic trays, plastic pails and tubs, metal closures and two-piece aluminum cans, woven products, industrial laminates and radiant barriers. It is also involved in crate and plastic pallet leasing, PET bottle filling graphics design, packaging research and testing, packaging development and consultation, contract packaging and trading. The energy segment sells, retails and distributes power, through power supply agreements, retail supply agreements, concession agreement and other power-related service agreements, either directly to customers, including Manila Electric Company (Meralco), electric cooperatives, industrial customers and the Philippine Wholesale Electricity Spot Market (WESM). The fuel and oil segment is engaged in refining and marketing of petroleum products. The infrastructure segment is engaged in the business of construction and development of various infrastructure projects such as airports, roads, highways, toll roads, freeways, skyways, flyovers, viaducts, interchanges and mass rail transit system.
Inter-segment Transactions Segment revenues, expenses and performance include sales and purchases between operating segments. Transfer prices between operating segments are set on an arm’s length basis in a manner similar to transactions with third parties. Such transactions are eliminated in consolidation.
- 12 -
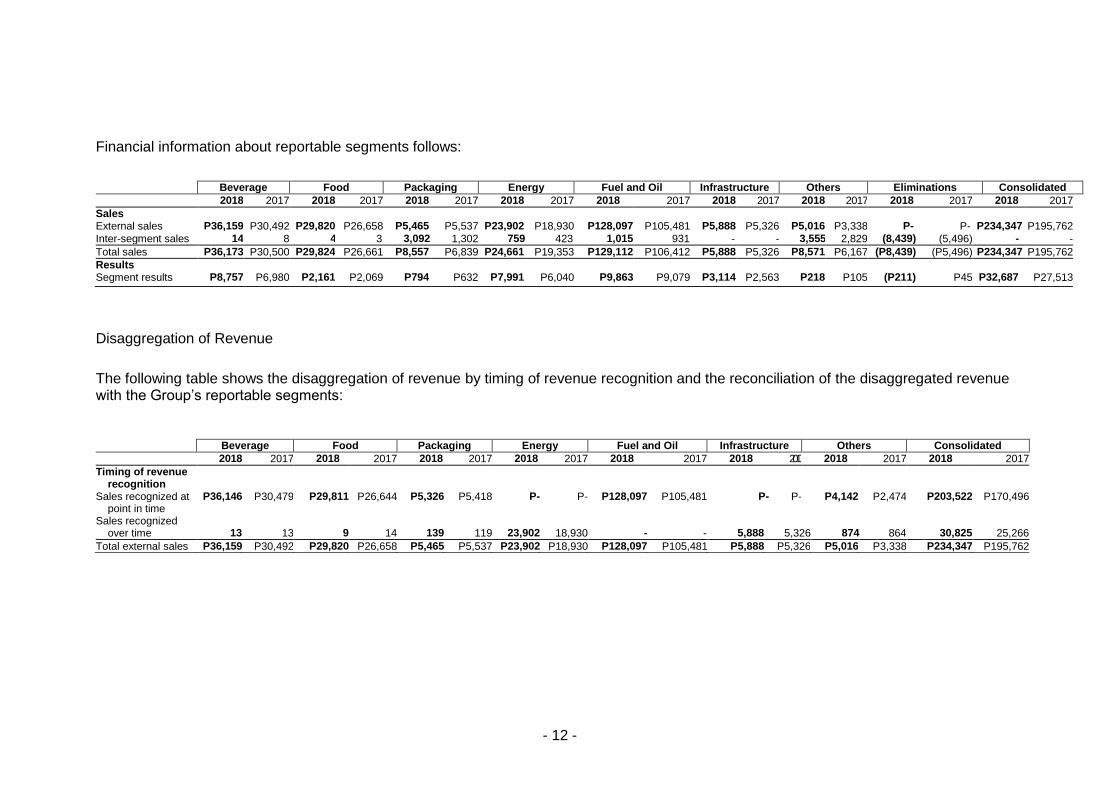
Financial information about reportable segments follows:
Beverage Food Packaging Energy Fuel and Oil Infrastructure Others Eliminations Consolidated
2018 2017 2018 2017 2018 2017 2018 2017 2018 2017 2018 2017 2018 2017 2018 2017 2018 2017
Sales External sales P36,159 P30,492 P29,820 P26,658 P5,465 P5,537 P23,902 P18,930 P128,097 P105,481 P5,888 P5,326 P5,016 P3,338 P- P- P234,347 P195,762
Inter-segment sales 14 8 4 3 3,092 1,302 759 423 1,015 931 - - 3,555 2,829 (8,439) (5,496) - -
Total sales P36,173 P30,500 P29,824 P26,661 P8,557 P6,839 P24,661 P19,353 P129,112 P106,412 P5,888 P5,326 P8,571 P6,167 (P8,439) (P5,496) P234,347 P195,762
Results Segment results P8,757 P6,980 P2,161 P2,069 P794 P632 P7,991 P6,040 P9,863 P9,079 P3,114 P2,563 P218 P105 (P211) P45 P32,687 P27,513
Disaggregation of Revenue
The following table shows the disaggregation of revenue by timing of revenue recognition and the reconciliation of the disaggregated revenue with the Group’s reportable segments:
Beverage Food Packaging Energy Fuel and Oil Infrastructure Others Consolidated
2018 2017 2018 2017 2018 2017 2018 2017 2018 2017 2018 2017 2018 2017 2018 2017
Timing of revenue recognition
Sales recognized at point in time
P36,146 P30,479 P29,811 P26,644 P5,326 P5,418 P- P- P128,097 P105,481 P- P- P4,142 P2,474 P203,522 P170,496
Sales recognized over time
13
13
9
14
139
119
23,902
18,930
-
-
5,888
5,326
874
864
30,825
25,266
Total external sales P36,159 P30,492 P29,820 P26,658 P5,465 P5,537 P23,902 P18,930 P128,097 P105,481 P5,888 P5,326 P5,016 P3,338 P234,347 P195,762
- 13 -
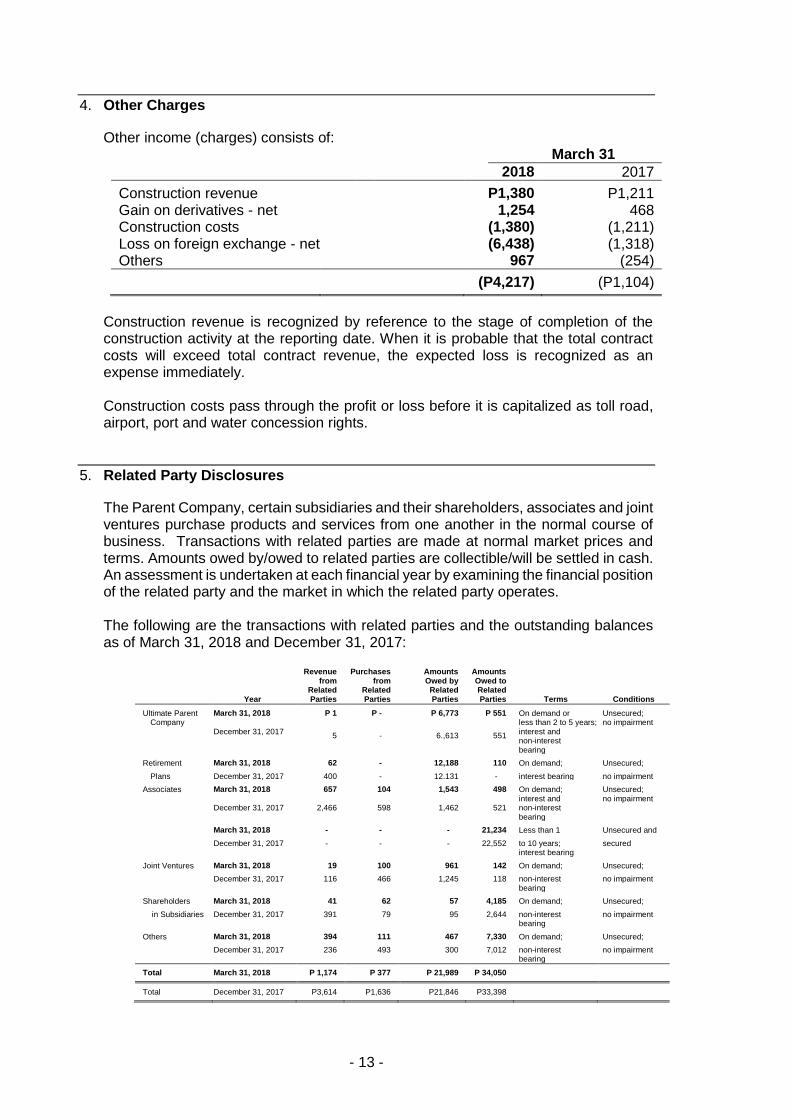
4. Other Charges
Other income (charges) consists of: March 31
2018 2017
Construction revenue P1,380 P1,211 Gain on derivatives - net 1,254 468 Construction costs (1,380) (1,211) Loss on foreign exchange - net (6,438) (1,318) Others 967 (254)
(P4,217) (P1,104)
Construction revenue is recognized by reference to the stage of completion of the construction activity at the reporting date. When it is probable that the total contract costs will exceed total contract revenue, the expected loss is recognized as an expense immediately. Construction costs pass through the profit or loss before it is capitalized as toll road, airport, port and water concession rights.
5. Related Party Disclosures
The Parent Company, certain subsidiaries and their shareholders, associates and joint ventures purchase products and services from one another in the normal course of business. Transactions with related parties are made at normal market prices and terms. Amounts owed by/owed to related parties are collectible/will be settled in cash. An assessment is undertaken at each financial year by examining the financial position of the related party and the market in which the related party operates.
The following are the transactions with related parties and the outstanding balances as of March 31, 2018 and December 31, 2017:
Year
Revenue from
Related Parties
Purchases from
Related Parties
Amounts Owed by
Related Parties
Amounts Owed to Related Parties Terms Conditions
Ultimate Parent Company
March 31, 2018 P 1 P - P 6,773 P 551 On demand or less than 2 to 5 years;
Unsecured; no impairment
December 31, 2017 5 - 6.,613 551
interest and non-interest
bearing
Retirement March 31, 2018 62 - 12,188 110 On demand; Unsecured;
Plans December 31, 2017 400 - 12.131 - interest bearing no impairment
Associates March 31, 2018 657 104 1,543 498 On demand; Unsecured;
December 31, 2017 2,466 598 1,462 521 interest and non-interest
no impairment
bearing
March 31, 2018 - - - 21,234 Less than 1 Unsecured and
December 31, 2017 - - - 22,552 to 10 years; secured interest bearing
Joint Ventures March 31, 2018 19 100 961 142 On demand; Unsecured;
December 31, 2017 116 466 1,245 118 non-interest no impairment bearing
Shareholders March 31, 2018 41 62 57 4,185 On demand; Unsecured;
in Subsidiaries December 31, 2017 391 79 95 2,644 non-interest no impairment bearing
Others March 31, 2018 394 111 467 7,330 On demand; Unsecured;
December 31, 2017 236 493 300 7,012 non-interest no impairment bearing
Total March 31, 2018 P 1,174 P 377 P 21,989 P 34,050
Total December 31, 2017 P3,614 P1,636 P21,846 P33,398

- 14 -
a. Amounts owed by related parties consist of current and noncurrent receivables
and deposits, and share in expenses. b. Amounts owed to related parties consist of trade payables and professional
fees. The amount owed to the Ultimate Parent Company pertains to dividend payable.
c. The amounts owed to associates include interest bearing loans to Bank of
Commerce (BOC) presented as part of “Loans payable” and “Long-term debt” accounts in the consolidated statements of financial position.
- 15 -
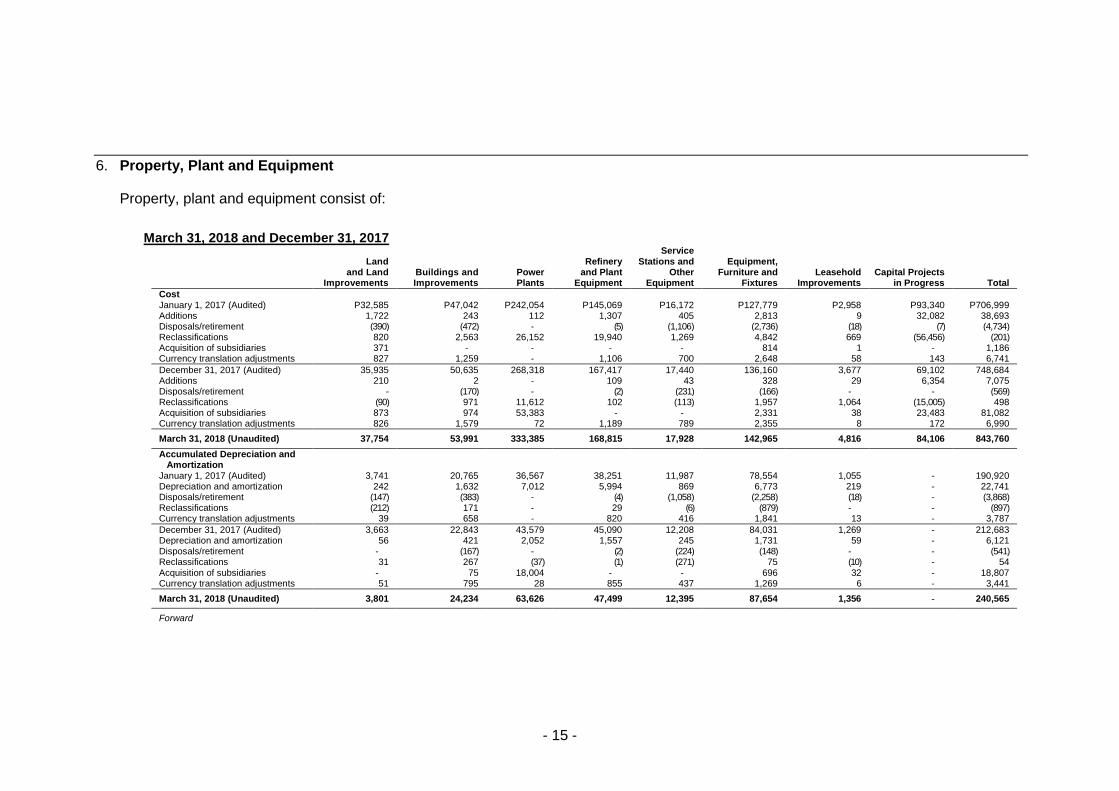
6. Property, Plant and Equipment
Property, plant and equipment consist of:
March 31, 2018 and December 31, 2017
Land and Land
Improvements Buildings and Improvements
Power Plants
Refinery and Plant
Equipment
Service Stations and
Other Equipment
Equipment, Furniture and
Fixtures Leasehold
Improvements Capital Projects
in Progress Total
Cost January 1, 2017 (Audited) P32,585 P47,042 P242,054 P145,069 P16,172 P127,779 P2,958 P93,340 P706,999 Additions 1,722 243 112 1,307 405 2,813 9 32,082 38,693 Disposals/retirement (390) (472) - (5) (1,106) (2,736) (18) (7) (4,734) Reclassifications 820 2,563 26,152 19,940 1,269 4,842 669 (56,456) (201) Acquisition of subsidiaries 371 - - - - 814 1 - 1,186 Currency translation adjustments 827 1,259 - 1,106 700 2,648 58 143 6,741
December 31, 2017 (Audited) 35,935 50,635 268,318 167,417 17,440 136,160 3,677 69,102 748,684 Additions 210 2 - 109 43 328 29 6,354 7,075 Disposals/retirement - (170) - (2) (231) (166) - - (569) Reclassifications (90) 971 11,612 102 (113) 1,957 1,064 (15,005) 498 Acquisition of subsidiaries 873 974 53,383 - - 2,331 38 23,483 81,082 Currency translation adjustments 826 1,579 72 1,189 789 2,355 8 172 6,990
March 31, 2018 (Unaudited) 37,754 53,991 333,385 168,815 17,928 142,965 4,816 84,106 843,760
Accumulated Depreciation and Amortization
January 1, 2017 (Audited) 3,741 20,765 36,567 38,251 11,987 78,554 1,055 - 190,920 Depreciation and amortization 242 1,632 7,012 5,994 869 6,773 219 - 22,741 Disposals/retirement (147) (383) - (4) (1,058) (2,258) (18) - (3,868) Reclassifications (212) 171 - 29 (6) (879) - - (897) Currency translation adjustments 39 658 - 820 416 1,841 13 - 3,787
December 31, 2017 (Audited) 3,663 22,843 43,579 45,090 12,208 84,031 1,269 - 212,683 Depreciation and amortization 56 421 2,052 1,557 245 1,731 59 - 6,121 Disposals/retirement - (167) - (2) (224) (148) - - (541) Reclassifications 31 267 (37) (1) (271) 75 (10) - 54 Acquisition of subsidiaries - 75 18,004 - - 696 32 - 18,807 Currency translation adjustments 51 795 28 855 437 1,269 6 - 3,441
March 31, 2018 (Unaudited) 3,801 24,234 63,626 47,499 12,395 87,654 1,356 - 240,565
Forward
- 16 -
Land and Land
Improvements Buildings and Improvements
Power Plants
Refinery and Plant
Equipment
Service Stations
and Other Equipment
Equipment, Furniture and
Fixtures Leasehold
Improvements Capital Projects
in Progress Total
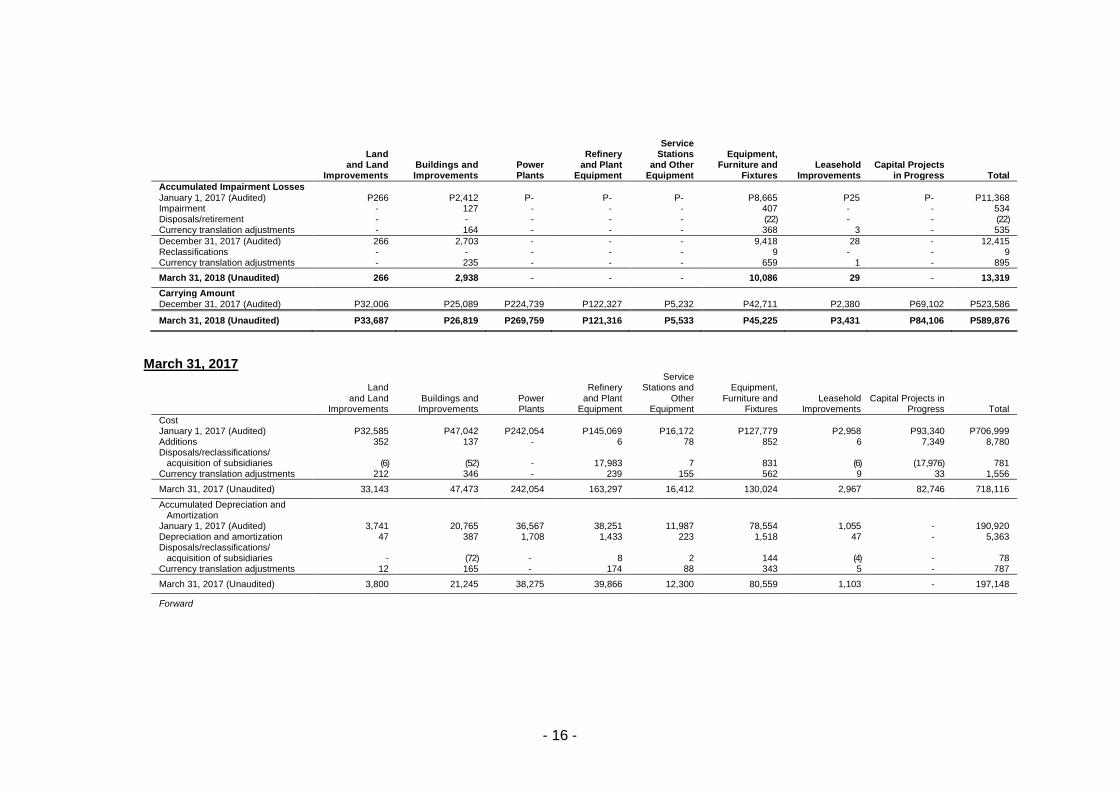
Accumulated Impairment Losses
January 1, 2017 (Audited) P266 P2,412 P- P- P- P8,665 P25 P- P11,368 Impairment - 127 - - - 407 - - 534 Disposals/retirement - - - - - (22) - - (22) Currency translation adjustments - 164 - - - 368 3 - 535
December 31, 2017 (Audited) 266 2,703 - - - 9,418 28 - 12,415 Reclassifications - - - - - 9 - - 9 Currency translation adjustments - 235 - - - 659 1 - 895
March 31, 2018 (Unaudited) 266 2,938 - - - 10,086 29 - 13,319
Carrying Amount December 31, 2017 (Audited) P32,006 P25,089 P224,739 P122,327 P5,232 P42,711 P2,380 P69,102 P523,586
March 31, 2018 (Unaudited) P33,687 P26,819 P269,759 P121,316 P5,533 P45,225 P3,431 P84,106 P589,876
March 31, 2017
Land
and Land Improvements
Buildings and Improvements
Power Plants
Refinery
and Plant Equipment
Service Stations and
Other Equipment
Equipment,
Furniture and Fixtures
Leasehold Improvements
Capital Projects in Progress Total
Cost January 1, 2017 (Audited) P32,585 P47,042 P242,054 P145,069 P16,172 P127,779 P2,958 P93,340 P706,999 Additions 352 137 - 6 78 852 6 7,349 8,780 Disposals/reclassifications/
acquisition of subsidiaries (6) (52) - 17,983 7 831 (6) (17,976) 781 Currency translation adjustments 212 346 - 239 155 562 9 33 1,556
March 31, 2017 (Unaudited) 33,143 47,473 242,054 163,297 16,412 130,024 2,967 82,746 718,116
Accumulated Depreciation and Amortization
January 1, 2017 (Audited) 3,741 20,765 36,567 38,251 11,987 78,554 1,055 - 190,920 Depreciation and amortization 47 387 1,708 1,433 223 1,518 47 - 5,363 Disposals/reclassifications/
acquisition of subsidiaries - (72) - 8 2 144 (4) - 78 Currency translation adjustments 12 165 - 174 88 343 5 - 787
March 31, 2017 (Unaudited) 3,800 21,245 38,275 39,866 12,300 80,559 1,103 - 197,148
Forward
- 17 -
Land and Land
Improvements Buildings and
Improvements Power Plants
Refinery and Plant
Equipment
Service Stations
and Other Equipment
Equipment, Furniture and
Fixtures Leasehold
Improvements Capital Projects in
Progress Total
Accumulated Impairment Losses January 1, 2017 (Audited) P266 P2,412 P- P- P- P8,665 P25 P- P11,368 Currency translation adjustments - 35 - - - 102 2 - 139
March 31, 2017 (Unaudited) 266 2,447 - - - 8,767 27 - 11,507
Carrying Amount March 31, 2017 (Unaudited) P29,077 P23,781 P203,779 P123,431 P4,112 P40,698 P1,837 P82,746 P509,461
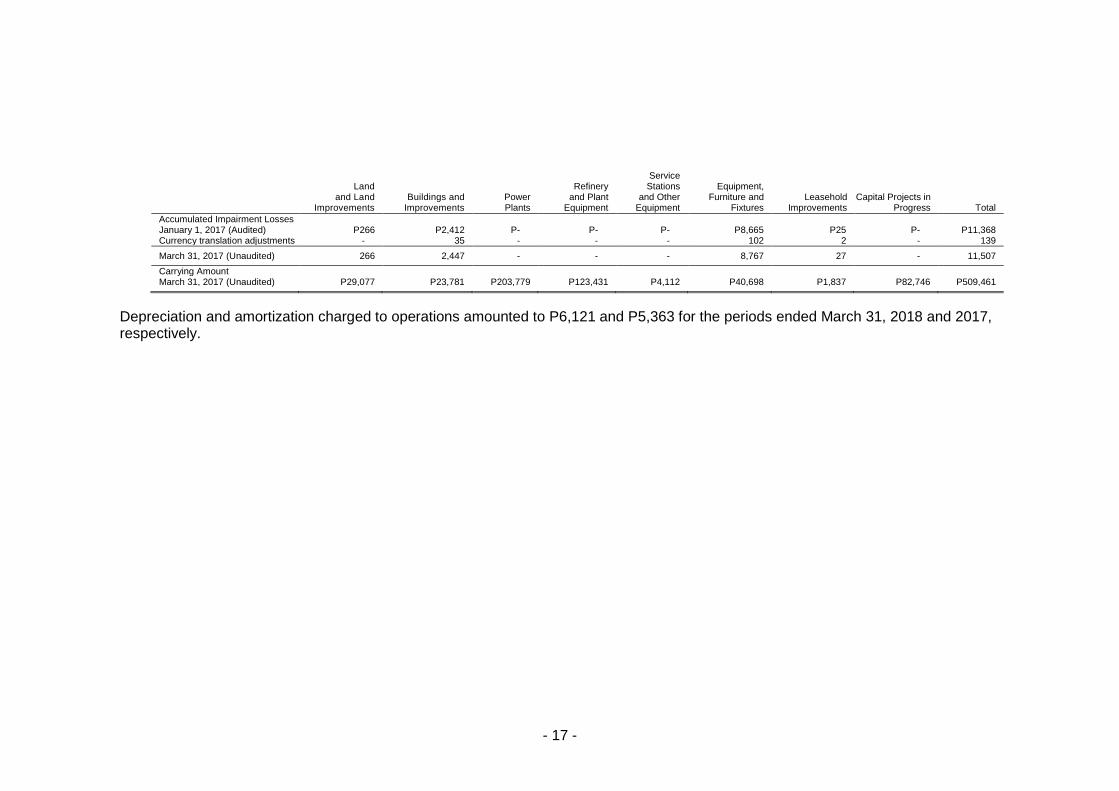
Depreciation and amortization charged to operations amounted to P6,121 and P5,363 for the periods ended March 31, 2018 and 2017, respectively.
- 18 -
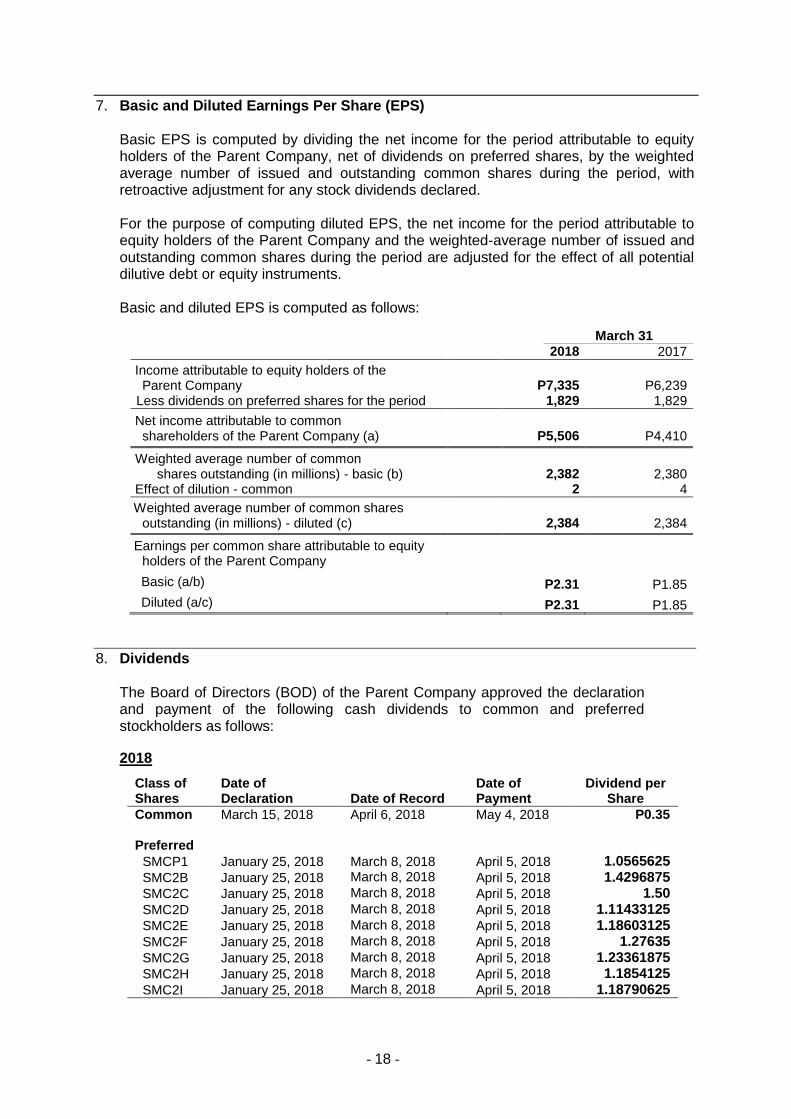
7. Basic and Diluted Earnings Per Share (EPS)
Basic EPS is computed by dividing the net income for the period attributable to equity holders of the Parent Company, net of dividends on preferred shares, by the weighted average number of issued and outstanding common shares during the period, with retroactive adjustment for any stock dividends declared. For the purpose of computing diluted EPS, the net income for the period attributable to equity holders of the Parent Company and the weighted-average number of issued and outstanding common shares during the period are adjusted for the effect of all potential dilutive debt or equity instruments. Basic and diluted EPS is computed as follows:
March 31
2018 2017
Income attributable to equity holders of the Parent Company P7,335 P6,239
Less dividends on preferred shares for the period 1,829 1,829
Net income attributable to common shareholders of the Parent Company (a) P5,506 P4,410
Weighted average number of common shares outstanding (in millions) - basic (b) 2,382 2,380
Effect of dilution - common 2 4
Weighted average number of common shares outstanding (in millions) - diluted (c) 2,384 2,384
Earnings per common share attributable to equity holders of the Parent Company
Basic (a/b) P2.31 P1.85
Diluted (a/c) P2.31 P1.85
8. Dividends The Board of Directors (BOD) of the Parent Company approved the declaration and payment of the following cash dividends to common and preferred stockholders as follows:
2018
Class of Shares
Date of Declaration Date of Record
Date of Payment
Dividend per Share
Common March 15, 2018 April 6, 2018 May 4, 2018 P0.35
Preferred
SMCP1 January 25, 2018 March 8, 2018 April 5, 2018 1.0565625
SMC2B January 25, 2018 March 8, 2018 April 5, 2018 1.4296875
SMC2C January 25, 2018 March 8, 2018 April 5, 2018 1.50
SMC2D January 25, 2018 March 8, 2018 April 5, 2018 1.11433125
SMC2E January 25, 2018 March 8, 2018 April 5, 2018 1.18603125
SMC2F January 25, 2018 March 8, 2018 April 5, 2018 1.27635
SMC2G January 25, 2018 March 8, 2018 April 5, 2018 1.23361875
SMC2H January 25, 2018 March 8, 2018 April 5, 2018 1.1854125
SMC2I January 25, 2018 March 8, 2018 April 5, 2018 1.18790625
- 19 -
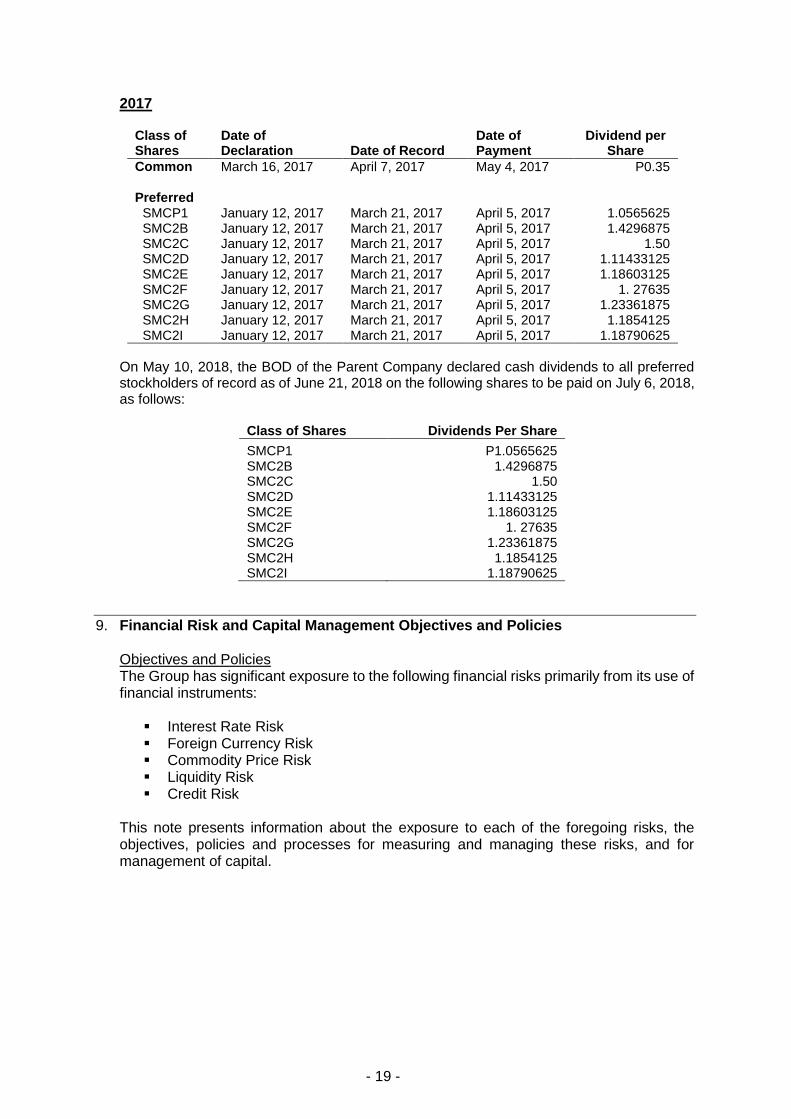
2017
Class of Shares
Date of Declaration Date of Record
Date of Payment
Dividend per Share
Common March 16, 2017 April 7, 2017 May 4, 2017 P0.35
Preferred SMCP1 January 12, 2017 March 21, 2017 April 5, 2017 1.0565625 SMC2B January 12, 2017 March 21, 2017 April 5, 2017 1.4296875 SMC2C January 12, 2017 March 21, 2017 April 5, 2017 1.50 SMC2D January 12, 2017 March 21, 2017 April 5, 2017 1.11433125 SMC2E January 12, 2017 March 21, 2017 April 5, 2017 1.18603125 SMC2F January 12, 2017 March 21, 2017 April 5, 2017 1. 27635 SMC2G January 12, 2017 March 21, 2017 April 5, 2017 1.23361875 SMC2H January 12, 2017 March 21, 2017 April 5, 2017 1.1854125 SMC2I January 12, 2017 March 21, 2017 April 5, 2017 1.18790625
On May 10, 2018, the BOD of the Parent Company declared cash dividends to all preferred stockholders of record as of June 21, 2018 on the following shares to be paid on July 6, 2018, as follows:
Class of Shares Dividends Per Share
SMCP1 P1.0565625 SMC2B 1.4296875 SMC2C 1.50 SMC2D 1.11433125 SMC2E 1.18603125 SMC2F 1. 27635 SMC2G 1.23361875 SMC2H 1.1854125 SMC2I 1.18790625
9. Financial Risk and Capital Management Objectives and Policies Objectives and Policies The Group has significant exposure to the following financial risks primarily from its use of financial instruments:
Interest Rate Risk Foreign Currency Risk Commodity Price Risk Liquidity Risk Credit Risk
This note presents information about the exposure to each of the foregoing risks, the objectives, policies and processes for measuring and managing these risks, and for management of capital.
- 20 -
The principal non-trade related financial instruments of the Group include cash and cash equivalents, financial assets at FVOCI, investments in equity instruments at FVPL, restricted cash, short-term and long-term loans, and derivative instruments. These financial instruments, except investments in equity instruments at FVPL and derivative instruments, are used mainly for working capital management purposes. The trade-related financial assets and financial liabilities of the Group such as trade and other receivables, noncurrent receivables and deposits, accounts payable and accrued expenses, finance lease liabilities and other noncurrent liabilities arise directly from and are used to facilitate its daily operations. The outstanding derivative instruments of the Group such as commodity and currency options, forwards and swaps are intended mainly for risk management purposes. The Group uses derivatives to manage its exposures to foreign currency, interest rate and commodity price risks arising from the operating and financing activities. The BOD has the overall responsibility for the establishment and oversight of the risk management framework of the Group. The risk management policies of the Group are established to identify and analyze the risks faced by the Group, to set appropriate risk limits and controls, and to monitor risks and adherence to limits. Risk management policies and systems are reviewed regularly to reflect changes in market conditions and activities. The Group, through its training and management standards and procedures, aims to develop a disciplined and constructive control environment in which all employees understand their roles and obligations. The BOD constituted the Audit and Risk Oversight Committee to assist the BOD in fulfilling its oversight responsibility of the Group’s corporate governance process relating to the: a) quality and integrity of the consolidated financial statements and financial reporting process and the systems of internal accounting and financial controls; b) performance of the internal auditors; c) annual independent audit of the consolidated financial statements, the engagement of the independent auditors and the evaluation of the independent auditors’ qualifications, independence and performance; d) compliance with tax, legal and regulatory requirements; e) evaluation of management’s process to assess and manage the enterprise risk issues; and f) fulfillment of the other responsibilities set out by the BOD. The Audit and Risk Oversight Committee shall prepare such reports as may be necessary to document the activities of the committee in the performance of its functions and duties. Such reports shall be included in the annual report of the Group and other corporate disclosures as may be required by the SEC and/or the PSE. The Audit and Risk Oversight Committee also oversees how management monitors compliance with the risk management policies and procedures of the Group and reviews the adequacy of the risk management framework in relation to the risks faced by the Group. Internal Audit assists the Audit and Risk Oversight Committee in monitoring and evaluating the effectiveness of the risk management and governance processes of the Group. Internal Audit undertakes both regular and special reviews of risk management controls and procedures, the results of which are reported to the Audit and Risk Oversight Committee. The accounting policies in relation to derivatives are set out in Note 10 to the selected notes to the consolidated financial statements.
- 21 -
Interest Rate Risk Interest rate risk is the risk that future cash flows from a financial instrument (cash flow interest rate risk) or its fair value (fair value interest rate risk) will fluctuate because of changes in market interest rates. The Group’s exposure to changes in interest rates relates primarily to the long-term borrowings and investment securities. Investment securities acquired or borrowings issued at fixed rates expose the Group to fair value interest rate risk. On the other hand, investment securities acquired or borrowings issued at variable rates expose the Group to cash flow interest rate risk. The Group manages its interest cost by using an optimal combination of fixed and variable rate debt instruments. Management is responsible for monitoring the prevailing market-based interest rate and ensures that the mark-up rates charged on its borrowings are optimal and benchmarked against the rates charged by other creditor banks. On the other hand, the investment policy of the Group is to maintain an adequate yield to match or reduce the net interest cost from its borrowings pending the deployment of funds to their intended use in the operations and working capital management. However, the Group invests only in high-quality securities while maintaining the necessary diversification to avoid concentration risk. In managing interest rate risk, the Group aims to reduce the impact of short-term fluctuations on the earnings. Over the longer term, however, permanent changes in interest rates would have an impact on profit or loss. The management of interest rate risk is also supplemented by monitoring the sensitivity of the Group’s financial instruments to various standard and non-standard interest rate scenarios. The sensitivity to a reasonably possible 1% increase in the interest rates, with all other variables held constant, would have decreased the Group’s profit before tax (through the impact on floating rate borrowings) by P1,733 and P1,037 for the period ended March 31, 2018 and for the year ended December 31, 2017, respectively. A 1% decrease in the interest rate would have had the equal but opposite effect. These changes are considered to be reasonably possible given the observation of prevailing market conditions in those periods. There is no impact on the Group’s other comprehensive income.
- 22 -
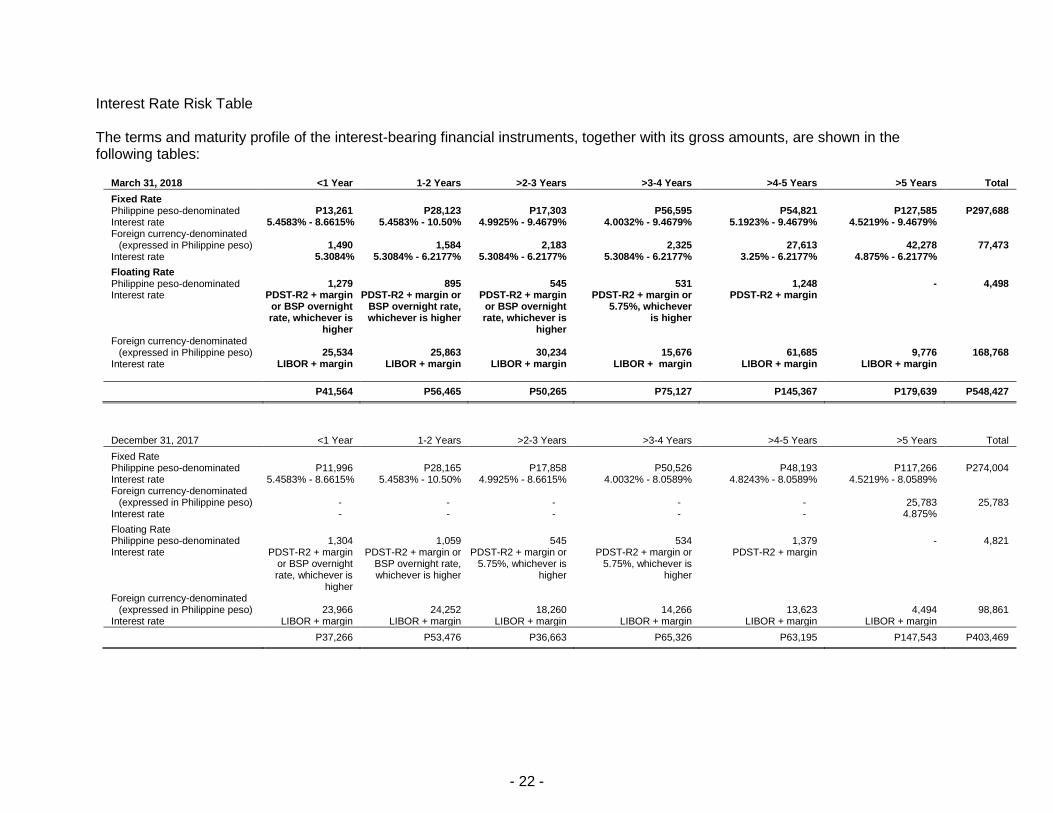
Interest Rate Risk Table The terms and maturity profile of the interest-bearing financial instruments, together with its gross amounts, are shown in the following tables:
March 31, 2018 <1 Year 1-2 Years >2-3 Years >3-4 Years >4-5 Years >5 Years Total
Fixed Rate Philippine peso-denominated P13,261 P28,123 P17,303 P56,595 P54,821 P127,585 P297,688 Interest rate 5.4583% - 8.6615% 5.4583% - 10.50% 4.9925% - 9.4679% 4.0032% - 9.4679% 5.1923% - 9.4679% 4.5219% - 9.4679% Foreign currency-denominated
(expressed in Philippine peso) 1,490 1,584 2,183 2,325 27,613 42,278 77,473 Interest rate 5.3084% 5.3084% - 6.2177% 5.3084% - 6.2177% 5.3084% - 6.2177% 3.25% - 6.2177% 4.875% - 6.2177%
Floating Rate Philippine peso-denominated 1,279 895 545 531 1,248 - 4,498 Interest rate PDST-R2 + margin
or BSP overnight rate, whichever is
higher
PDST-R2 + margin or BSP overnight rate, whichever is higher
PDST-R2 + margin or BSP overnight rate, whichever is
higher
PDST-R2 + margin or 5.75%, whichever
is higher
PDST-R2 + margin
Foreign currency-denominated (expressed in Philippine peso) 25,534 25,863 30,234 15,676 61,685 9,776 168,768
Interest rate LIBOR + margin
LIBOR + margin
LIBOR + margin
LIBOR + margin LIBOR + margin
LIBOR + margin
P41,564 P56,465 P50,265 P75,127 P145,367 P179,639 P548,427
December 31, 2017 <1 Year 1-2 Years >2-3 Years >3-4 Years >4-5 Years >5 Years Total
Fixed Rate Philippine peso-denominated P11,996 P28,165 P17,858 P50,526 P48,193 P117,266 P274,004 Interest rate 5.4583% - 8.6615% 5.4583% - 10.50% 4.9925% - 8.6615% 4.0032% - 8.0589% 4.8243% - 8.0589% 4.5219% - 8.0589% Foreign currency-denominated
(expressed in Philippine peso) - - - - - 25,783 25,783 Interest rate - - - - - 4.875%
Floating Rate Philippine peso-denominated 1,304 1,059 545 534 1,379 - 4,821 Interest rate PDST-R2 + margin
or BSP overnight rate, whichever is
higher
PDST-R2 + margin or BSP overnight rate, whichever is higher
PDST-R2 + margin or 5.75%, whichever is
higher
PDST-R2 + margin or 5.75%, whichever is
higher
PDST-R2 + margin
Foreign currency-denominated (expressed in Philippine peso) 23,966 24,252 18,260 14,266 13,623 4,494 98,861
Interest rate LIBOR + margin LIBOR + margin LIBOR + margin LIBOR + margin LIBOR + margin LIBOR + margin
P37,266 P53,476 P36,663 P65,326 P63,195 P147,543 P403,469
- 23 -
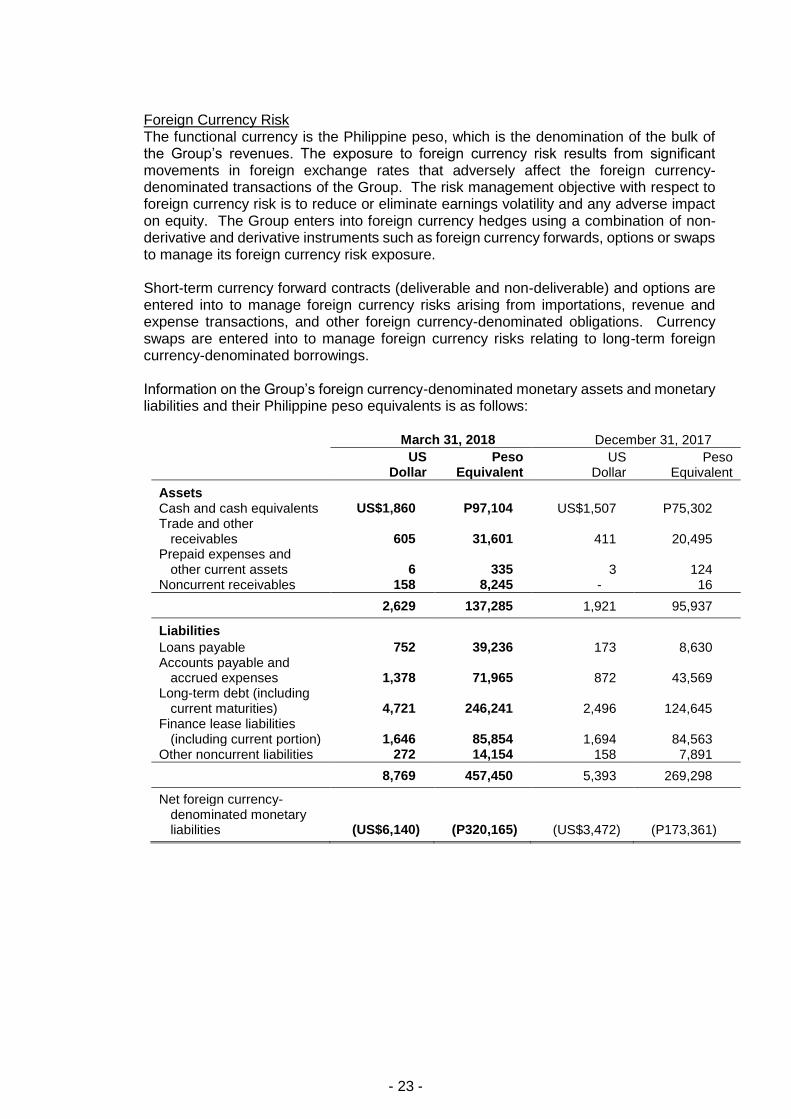
Foreign Currency Risk The functional currency is the Philippine peso, which is the denomination of the bulk of the Group’s revenues. The exposure to foreign currency risk results from significant movements in foreign exchange rates that adversely affect the foreign currency-denominated transactions of the Group. The risk management objective with respect to foreign currency risk is to reduce or eliminate earnings volatility and any adverse impact on equity. The Group enters into foreign currency hedges using a combination of non-derivative and derivative instruments such as foreign currency forwards, options or swaps to manage its foreign currency risk exposure. Short-term currency forward contracts (deliverable and non-deliverable) and options are entered into to manage foreign currency risks arising from importations, revenue and expense transactions, and other foreign currency-denominated obligations. Currency swaps are entered into to manage foreign currency risks relating to long-term foreign currency-denominated borrowings. Information on the Group’s foreign currency-denominated monetary assets and monetary liabilities and their Philippine peso equivalents is as follows:
March 31, 2018 December 31, 2017
US
Dollar Peso
Equivalent US
Dollar Peso
Equivalent
Assets Cash and cash equivalents US$1,860 P97,104 US$1,507 P75,302 Trade and other
receivables 605 31,601 411 20,495 Prepaid expenses and
other current assets 6 335 3 124 Noncurrent receivables 158 8,245 - 16
2,629 137,285 1,921 95,937
Liabilities
Loans payable 752 39,236 173 8,630 Accounts payable and
accrued expenses 1,378 71,965 872 43,569 Long-term debt (including
current maturities) 4,721 246,241 2,496 124,645 Finance lease liabilities
(including current portion) 1,646 85,854 1,694 84,563 Other noncurrent liabilities 272 14,154 158 7,891
8,769 457,450 5,393 269,298
Net foreign currency- denominated monetary liabilities (US$6,140) (P320,165) (US$3,472) (P173,361)
- 24 -
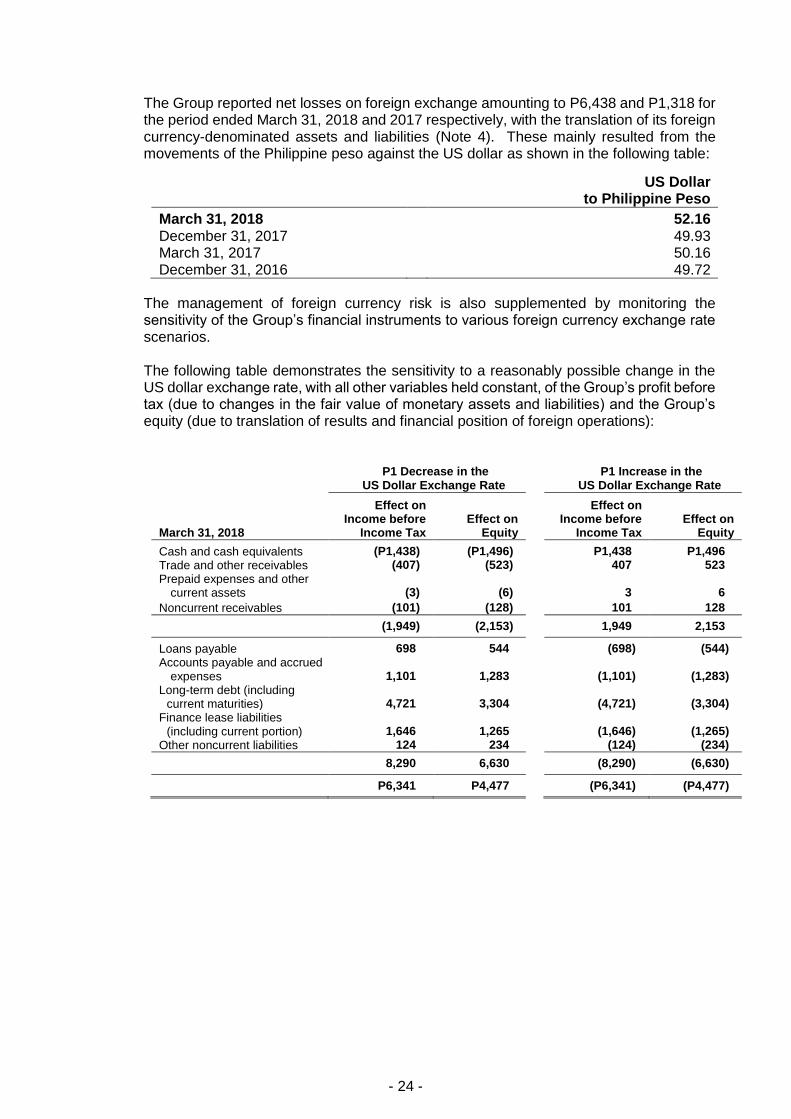
The Group reported net losses on foreign exchange amounting to P6,438 and P1,318 for the period ended March 31, 2018 and 2017 respectively, with the translation of its foreign currency-denominated assets and liabilities (Note 4). These mainly resulted from the movements of the Philippine peso against the US dollar as shown in the following table:
US Dollar
to Philippine Peso
March 31, 2018 52.16 December 31, 2017 49.93 March 31, 2017 50.16 December 31, 2016 49.72
The management of foreign currency risk is also supplemented by monitoring the sensitivity of the Group’s financial instruments to various foreign currency exchange rate scenarios. The following table demonstrates the sensitivity to a reasonably possible change in the US dollar exchange rate, with all other variables held constant, of the Group’s profit before tax (due to changes in the fair value of monetary assets and liabilities) and the Group’s equity (due to translation of results and financial position of foreign operations):
P1 Decrease in the
US Dollar Exchange Rate P1 Increase in the
US Dollar Exchange Rate
March 31, 2018
Effect on Income before
Income Tax Effect on
Equity
Effect on Income before
Income Tax Effect on
Equity
Cash and cash equivalents (P1,438) (P1,496) P1,438 P1,496
Trade and other receivables (407) (523) 407 523
Prepaid expenses and other current assets (3) (6) 3 6
Noncurrent receivables (101) (128) 101 128
(1,949) (2,153) 1,949 2,153
Loans payable 698 544 (698) (544)
Accounts payable and accrued expenses 1,101 1,283 (1,101) (1,283)
Long-term debt (including current maturities) 4,721 3,304 (4,721) (3,304)
Finance lease liabilities (including current portion) 1,646 1,265 (1,646) (1,265)
Other noncurrent liabilities 124 234 (124) (234)
8,290 6,630 (8,290) (6,630)
P6,341 P4,477 (P6,341) (P4,477)
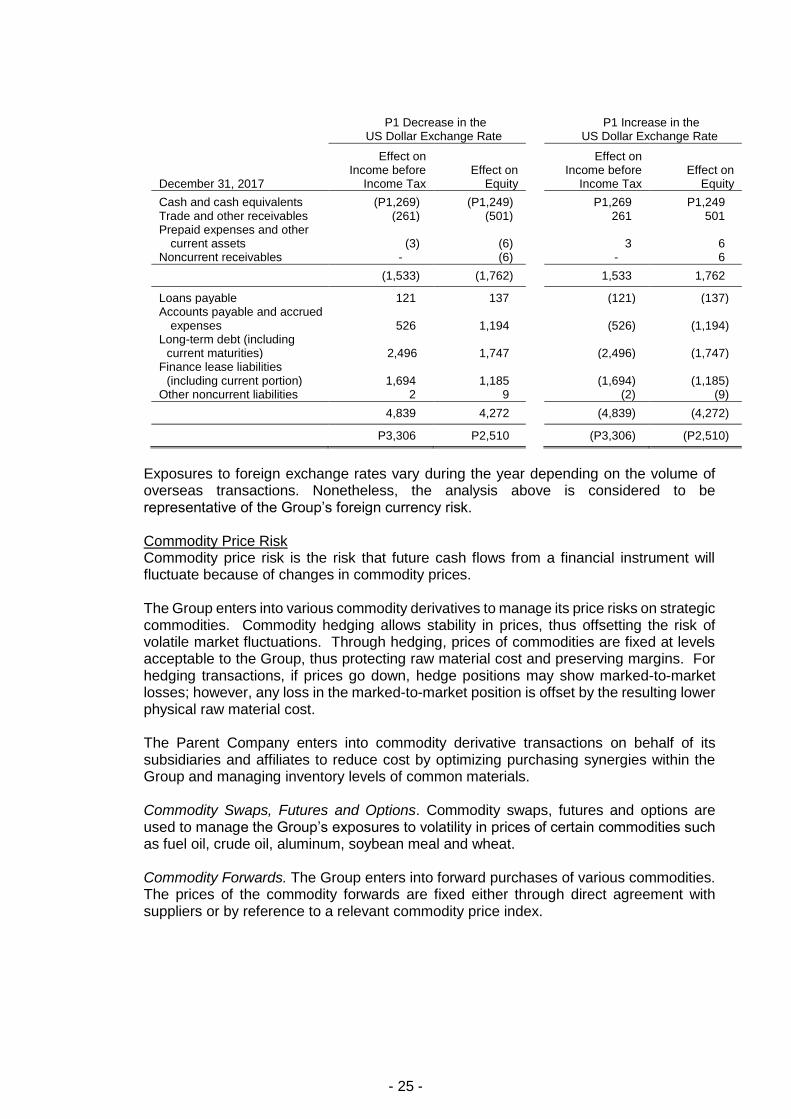
- 25 -
P1 Decrease in the
US Dollar Exchange Rate P1 Increase in the
US Dollar Exchange Rate
December 31, 2017
Effect on Income before
Income Tax Effect on
Equity
Effect on Income before
Income Tax Effect on
Equity
Cash and cash equivalents (P1,269) (P1,249) P1,269 P1,249 Trade and other receivables (261) (501) 261 501 Prepaid expenses and other
current assets (3) (6) 3 6 Noncurrent receivables - (6) - 6
(1,533) (1,762) 1,533 1,762
Loans payable 121 137 (121) (137) Accounts payable and accrued
expenses 526 1,194 (526) (1,194) Long-term debt (including
current maturities) 2,496 1,747 (2,496) (1,747) Finance lease liabilities
(including current portion) 1,694 1,185 (1,694) (1,185) Other noncurrent liabilities 2 9 (2) (9)
4,839 4,272 (4,839) (4,272)
P3,306 P2,510 (P3,306) (P2,510)
Exposures to foreign exchange rates vary during the year depending on the volume of overseas transactions. Nonetheless, the analysis above is considered to be representative of the Group’s foreign currency risk. Commodity Price Risk Commodity price risk is the risk that future cash flows from a financial instrument will fluctuate because of changes in commodity prices. The Group enters into various commodity derivatives to manage its price risks on strategic commodities. Commodity hedging allows stability in prices, thus offsetting the risk of volatile market fluctuations. Through hedging, prices of commodities are fixed at levels acceptable to the Group, thus protecting raw material cost and preserving margins. For hedging transactions, if prices go down, hedge positions may show marked-to-market losses; however, any loss in the marked-to-market position is offset by the resulting lower physical raw material cost. The Parent Company enters into commodity derivative transactions on behalf of its subsidiaries and affiliates to reduce cost by optimizing purchasing synergies within the Group and managing inventory levels of common materials. Commodity Swaps, Futures and Options. Commodity swaps, futures and options are used to manage the Group’s exposures to volatility in prices of certain commodities such as fuel oil, crude oil, aluminum, soybean meal and wheat. Commodity Forwards. The Group enters into forward purchases of various commodities. The prices of the commodity forwards are fixed either through direct agreement with suppliers or by reference to a relevant commodity price index.
- 26 -
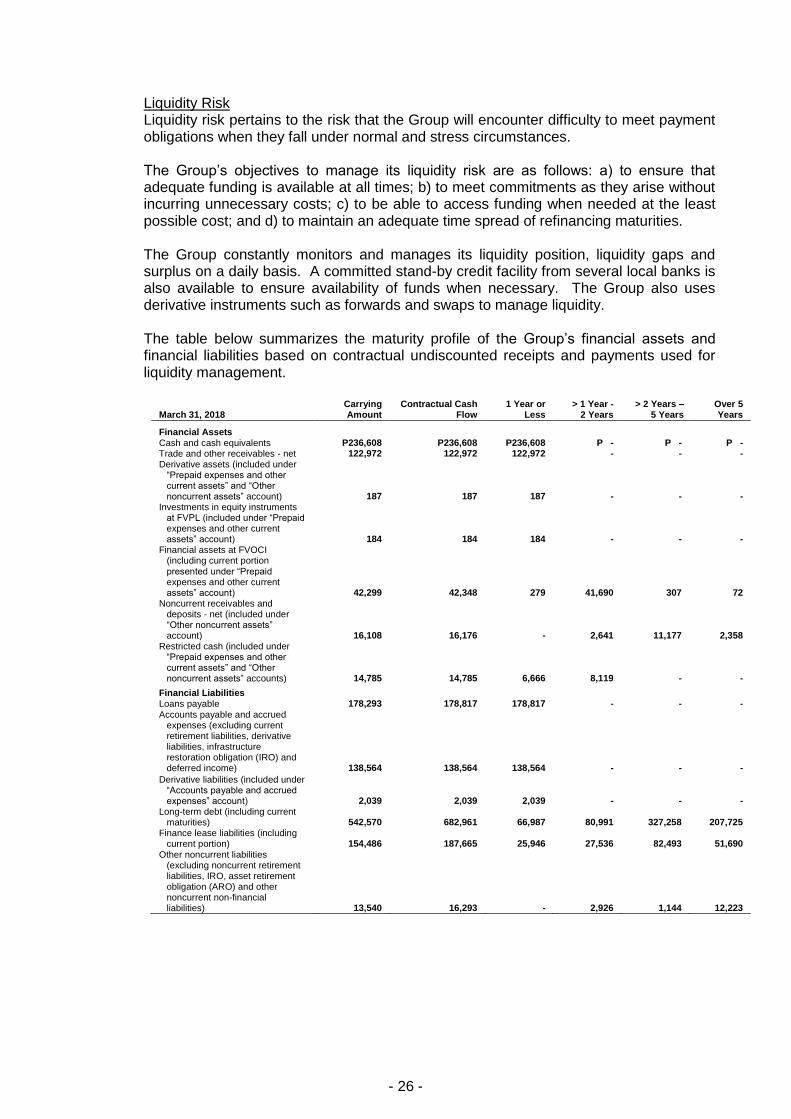
Liquidity Risk Liquidity risk pertains to the risk that the Group will encounter difficulty to meet payment obligations when they fall under normal and stress circumstances. The Group’s objectives to manage its liquidity risk are as follows: a) to ensure that adequate funding is available at all times; b) to meet commitments as they arise without incurring unnecessary costs; c) to be able to access funding when needed at the least possible cost; and d) to maintain an adequate time spread of refinancing maturities. The Group constantly monitors and manages its liquidity position, liquidity gaps and surplus on a daily basis. A committed stand-by credit facility from several local banks is also available to ensure availability of funds when necessary. The Group also uses derivative instruments such as forwards and swaps to manage liquidity. The table below summarizes the maturity profile of the Group’s financial assets and financial liabilities based on contractual undiscounted receipts and payments used for liquidity management.
March 31, 2018 Carrying Amount
Contractual Cash Flow
1 Year or Less
> 1 Year - 2 Years
> 2 Years – 5 Years
Over 5 Years
Financial Assets Cash and cash equivalents P236,608 P236,608 P236,608 P - P - P - Trade and other receivables - net 122,972 122,972 122,972 - - - Derivative assets (included under
“Prepaid expenses and other current assets” and “Other noncurrent assets” account) 187 187 187 - - -
Investments in equity instruments at FVPL (included under “Prepaid expenses and other current assets” account) 184 184 184 - - -
Financial assets at FVOCI (including current portion presented under “Prepaid expenses and other current assets” account) 42,299 42,348 279 41,690 307 72
Noncurrent receivables and deposits - net (included under “Other noncurrent assets” account) 16,108 16,176 - 2,641 11,177 2,358
Restricted cash (included under “Prepaid expenses and other current assets” and “Other noncurrent assets” accounts) 14,785 14,785 6,666 8,119 - -
Financial Liabilities Loans payable 178,293 178,817 178,817 - - -
Accounts payable and accrued expenses (excluding current retirement liabilities, derivative liabilities, infrastructure restoration obligation (IRO) and deferred income) 138,564 138,564 138,564 - - -
Derivative liabilities (included under “Accounts payable and accrued expenses” account) 2,039 2,039 2,039 - - -
Long-term debt (including current maturities) 542,570 682,961 66,987 80,991 327,258 207,725
Finance lease liabilities (including current portion) 154,486 187,665 25,946 27,536 82,493 51,690
Other noncurrent liabilities (excluding noncurrent retirement liabilities, IRO, asset retirement obligation (ARO) and other noncurrent non-financial liabilities) 13,540 16,293 - 2,926 1,144 12,223
- 27 -
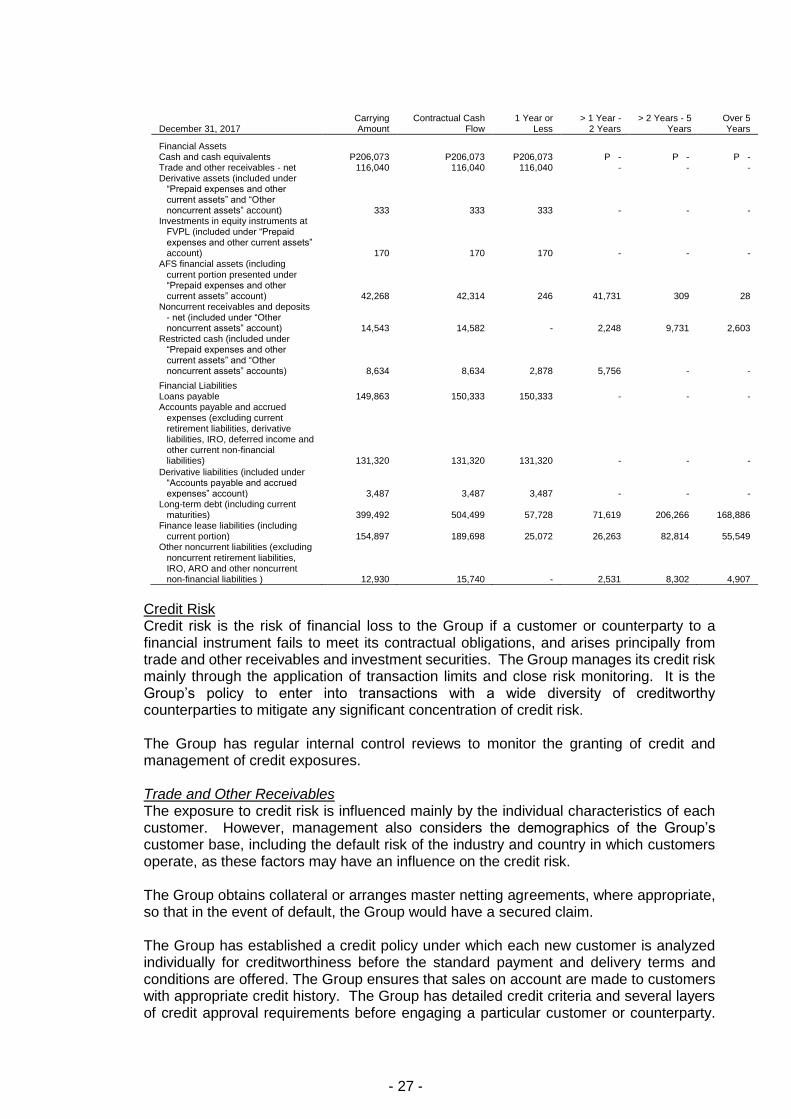
December 31, 2017 Carrying Amount
Contractual Cash Flow
1 Year or Less
> 1 Year - 2 Years
> 2 Years - 5 Years
Over 5 Years
Financial Assets Cash and cash equivalents P206,073 P206,073 P206,073 P - P - P - Trade and other receivables - net 116,040 116,040 116,040 - - - Derivative assets (included under
“Prepaid expenses and other current assets” and “Other noncurrent assets” account) 333 333 333 - - -
Investments in equity instruments at FVPL (included under “Prepaid expenses and other current assets” account) 170 170 170 - - -
AFS financial assets (including current portion presented under “Prepaid expenses and other current assets” account) 42,268 42,314 246 41,731 309 28
Noncurrent receivables and deposits - net (included under “Other noncurrent assets” account) 14,543 14,582 - 2,248 9,731 2,603
Restricted cash (included under “Prepaid expenses and other current assets” and “Other noncurrent assets” accounts) 8,634 8,634 2,878 5,756 - -
Financial Liabilities Loans payable 149,863 150,333 150,333 - - - Accounts payable and accrued
expenses (excluding current retirement liabilities, derivative liabilities, IRO, deferred income and other current non-financial liabilities) 131,320 131,320 131,320 - - -
Derivative liabilities (included under “Accounts payable and accrued expenses” account) 3,487 3,487 3,487 - - -
Long-term debt (including current maturities) 399,492 504,499 57,728 71,619 206,266 168,886
Finance lease liabilities (including current portion) 154,897 189,698 25,072 26,263 82,814 55,549
Other noncurrent liabilities (excluding noncurrent retirement liabilities, IRO, ARO and other noncurrent non-financial liabilities ) 12,930 15,740 - 2,531 8,302 4,907
Credit Risk Credit risk is the risk of financial loss to the Group if a customer or counterparty to a financial instrument fails to meet its contractual obligations, and arises principally from trade and other receivables and investment securities. The Group manages its credit risk mainly through the application of transaction limits and close risk monitoring. It is the Group’s policy to enter into transactions with a wide diversity of creditworthy counterparties to mitigate any significant concentration of credit risk. The Group has regular internal control reviews to monitor the granting of credit and management of credit exposures.
Trade and Other Receivables The exposure to credit risk is influenced mainly by the individual characteristics of each customer. However, management also considers the demographics of the Group’s customer base, including the default risk of the industry and country in which customers operate, as these factors may have an influence on the credit risk. The Group obtains collateral or arranges master netting agreements, where appropriate, so that in the event of default, the Group would have a secured claim. The Group has established a credit policy under which each new customer is analyzed individually for creditworthiness before the standard payment and delivery terms and conditions are offered. The Group ensures that sales on account are made to customers with appropriate credit history. The Group has detailed credit criteria and several layers of credit approval requirements before engaging a particular customer or counterparty.
- 28 -
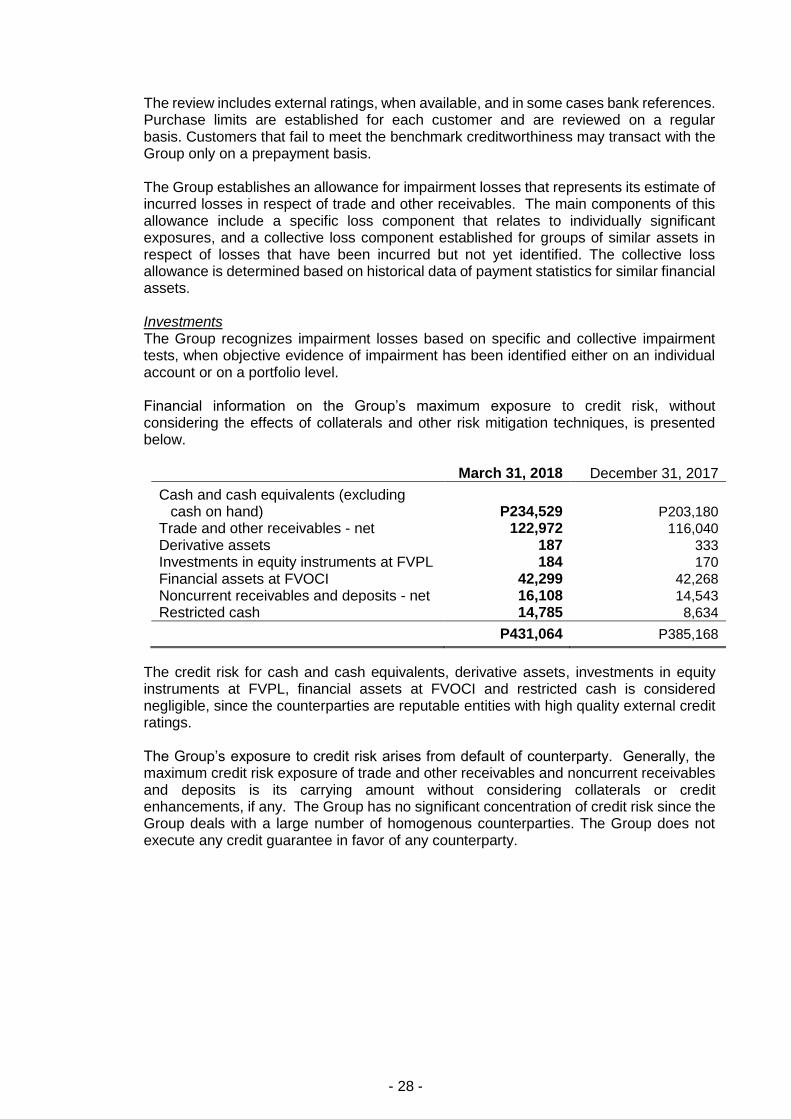
The review includes external ratings, when available, and in some cases bank references. Purchase limits are established for each customer and are reviewed on a regular basis. Customers that fail to meet the benchmark creditworthiness may transact with the Group only on a prepayment basis. The Group establishes an allowance for impairment losses that represents its estimate of incurred losses in respect of trade and other receivables. The main components of this allowance include a specific loss component that relates to individually significant exposures, and a collective loss component established for groups of similar assets in respect of losses that have been incurred but not yet identified. The collective loss allowance is determined based on historical data of payment statistics for similar financial assets.
Investments The Group recognizes impairment losses based on specific and collective impairment tests, when objective evidence of impairment has been identified either on an individual account or on a portfolio level. Financial information on the Group’s maximum exposure to credit risk, without considering the effects of collaterals and other risk mitigation techniques, is presented below.
March 31, 2018 December 31, 2017
Cash and cash equivalents (excluding cash on hand) P234,529 P203,180
Trade and other receivables - net 122,972 116,040 Derivative assets 187 333 Investments in equity instruments at FVPL 184 170 Financial assets at FVOCI 42,299 42,268 Noncurrent receivables and deposits - net 16,108 14,543 Restricted cash 14,785 8,634
P431,064 P385,168
The credit risk for cash and cash equivalents, derivative assets, investments in equity instruments at FVPL, financial assets at FVOCI and restricted cash is considered negligible, since the counterparties are reputable entities with high quality external credit ratings. The Group’s exposure to credit risk arises from default of counterparty. Generally, the maximum credit risk exposure of trade and other receivables and noncurrent receivables and deposits is its carrying amount without considering collaterals or credit enhancements, if any. The Group has no significant concentration of credit risk since the Group deals with a large number of homogenous counterparties. The Group does not execute any credit guarantee in favor of any counterparty.
- 29 -
Financial and Other Risks Relating to Livestock The Group is exposed to financial risks arising from the change in cost and supply of feed ingredients and the selling prices of chicken, hogs and cattle and related products, all of which are determined by constantly changing market forces such as supply and demand and other factors. The other factors include environmental regulations, weather conditions and livestock diseases for which the Group has little control. The mitigating factors are listed below: The Group is subject to risks affecting the food industry, generally, including risks
posed by food spoilage and contamination. Specifically, the fresh meat industry is regulated by environmental, health and food safety organizations and regulatory sanctions. The Group has put into place systems to monitor food safety risks throughout all stages of manufacturing and processing to mitigate these risks. Furthermore, representatives from the government regulatory agencies are present at all times during the processing of dressed chicken, hogs and cattle in all dressing and meat plants and issue certificates accordingly. The authorities, however, may impose additional regulatory requirements that may require significant capital investment at short notice.
The Group is subject to risks relating to its ability to maintain animal health status
considering that it has no control over neighboring livestock farms. Livestock health problems could adversely impact production and consumer confidence. However, the Group monitors the health of its livestock on a daily basis and proper procedures are put in place.
The livestock industry is exposed to risk associated with the supply and price of raw
materials, mainly grain prices. Grain prices fluctuate depending on the harvest results. The shortage in the supply of grain will result in adverse fluctuation in the price of grain and will ultimately increase the Group’s production cost. If necessary, the Group enters into forward contracts to secure the supply of raw materials at a reasonable price.
Other Market Price Risk The Group’s market price risk arises from its investments carried at fair value (investments in equity instruments at FVPL and financial assets at FVOCI). The Group manages its risk arising from changes in market price by monitoring the changes in the market price of the investments.
Capital Management The Group maintains a sound capital base to ensure its ability to continue as a going concern, thereby continue to provide returns to stockholders and benefits to other stakeholders and to maintain an optimal capital structure to reduce cost of capital. The Group manages its capital structure and makes adjustments in the light of changes in economic conditions. To maintain or adjust the capital structure, the Group may adjust the dividend payment to shareholders, pay-off existing debts, return capital to shareholders or issue new shares. The Group defines capital as paid-in capital stock, additional paid-in capital and retained earnings, both appropriated and unappropriated. Other components of equity such as treasury stock and equity reserves are excluded from capital for purposes of capital management.
- 30 -
The Group monitors capital on the basis of debt-to-equity ratio, which is calculated as total debt divided by total equity. Total debt is defined as total current liabilities and total noncurrent liabilities, while equity is total equity as shown in the consolidated statements of financial position. The BOD has overall responsibility for monitoring capital in proportion to risk. Profiles for capital ratios are set in the light of changes in the external environment and the risks underlying the Group’s business, operation and industry. The Group, except for BOC which is subject to certain capitalization requirements by the Bangko Sentral ng Pilipinas, is not subject to externally imposed capital requirements.
10. Financial Assets and Financial Liabilities Date of Recognition. The Group recognizes a financial asset or a financial liability in the consolidated statements of financial position when it becomes a party to the contractual provisions of a financial instrument. In the case of a regular way purchase or sale of financial assets, recognition is done using settlement date accounting. Initial Recognition of Financial Instruments. Financial instruments are recognized initially at fair value of the consideration given (in case of an asset) or received (in case of a liability). The initial measurement of financial instruments, except for those designated as at FVPL, includes transaction costs. ‘Day 1’ Difference. Where the transaction price in a non-active market is different from the fair value of other observable current market transactions in the same instrument or based on a valuation technique whose variables include only data from observable market, the Group recognizes the difference between the transaction price and the fair value (a ‘Day 1’ difference) in the consolidated statements of income unless it qualifies for recognition as some other type of asset. In cases where data used is not observable, the difference between the transaction price and model value is only recognized in the consolidated statements of income when the inputs become observable or when the instrument is derecognized. For each transaction, the Group determines the appropriate method of recognizing the ‘Day 1’ difference amount. Accounting Policies for the Classification and Measurement of Financial Assets Applicable from January 1, 2018 Financial Assets The Group classifies its financial assets, at initial recognition, in the following categories: financial assets at amortized cost, financial assets at FVOCI and financial assets at FVPL. The classification depends on the business model of the Group for managing the financial assets and the contractual cash flow characteristics of the financial assets. Financial assets are not reclassified subsequent to initial recognition unless the Group changes its business model for managing financial assets in which case all affected financial assets are reclassified on the first day of the reporting period following the change in the business model.
- 31 -
Financial Assets at Amortized Cost. A financial asset is measured at amortized cost if it meets both of the following conditions and is not designated as at FVPL: it is held within a business model whose objective is to hold financial assets to collect
contractual cash flows; and
its contractual terms give rise on specified dates to cash flows that are solely payments of principal and interest on the principal amount outstanding.
After initial measurement, the financial assets are subsequently measured at amortized cost using the effective interest method, less any allowance for impairment. Amortized cost is calculated by taking into account any discount or premium on acquisition, and fees that are an integral part of the effective interest rate. Gains and losses are recognized in profit or loss when the financial assets are reclassified to FVPL, impaired or derecognized, as well as through the amortization process. The Group’s cash and cash equivalents, trade and other receivables, noncurrent receivables and deposits, and restricted cash are included under this category. Financial Assets at FVOCI. Investment in debt instruments is measured at FVOCI if it meets both of the following conditions and is not designated as at FVPL: it is held within a business model whose objective is achieved by both collecting
contractual cash flows and selling the financial assets; and
its contractual terms give rise on specified dates to cash flows that are solely payments of principal and interest on the principal amount outstanding.
At initial recognition of an investment in equity instrument that is not held for trading, the Group may irrevocably elect to present subsequent changes in the fair value in other comprehensive income. This election is made on an instrument-by-instrument basis. After initial measurement, financial assets at FVOCI are subsequently measured at fair value. Changes in fair value are recognized in other comprehensive income. Interest income calculated using the effective interest method, foreign exchange gains and losses and impairment on investment in debt instruments are recognized in profit or loss. When investment in debt instruments at FVOCI is derecognized the related accumulated gains or losses previously reported in the statement of changes in equity are transferred to and recognized in profit or loss. Dividends earned on holding an investment in equity instrument are recognized as dividend income when the right to receive the payment has been established. When investment in equity instruments at FVOCI is derecognized the related accumulated gains or losses previously reported in the statement of changes in equity are never reclassified to profit or loss. The Group’s investments in debt instruments and investments in equity instruments at FVOCI are classified under this category. Financial Assets at FVPL. All financial assets not classified as measured at amortized cost or FVOCI are measured at FVPL. This includes all derivative financial assets. Financial assets that are held for trading or are managed and whose performance is evaluated on a fair value basis are measured at FVPL.
- 32 -
At initial recognition, a financial asset may be irrevocably designated as at FVPL if the designation eliminates or significantly reduces an accounting mismatch that would otherwise arise from measuring assets or liabilities or recognizing the gains and losses on different bases. The Group carries financial assets at FVPL using their fair values. Attributable transaction costs are recognized in profit or loss as incurred. Changes in fair value and realized gains or losses are recognized in profit or loss. Fair value changes from derivatives accounted for as part of an effective cash flow hedge are recognized in other comprehensive income. Any interest earned from investment in debt instrument is recognized in profit or loss. Any dividend income from investment in equity instrument is recognized in profit or loss when the right to receive payment has been established. The Group’s derivative assets and investments in equity instruments at FVPL are classified under this category. Accounting Policies for the Classification and Measurement of Financial Assets Applicable before January 1, 2018 Financial Assets The Group classifies its financial assets, at initial recognition, in the following categories: financial assets at FVPL, loans and receivables, AFS financial assets and held-to-maturity (HTM) investments. The classification depends on the purpose for which the investments are acquired and whether they are quoted in an active market. The Group determines the classification of its financial assets at initial recognition and, where allowed and appropriate, re-evaluates such designation at every reporting date. Financial Assets at FVPL. A financial asset is classified as at FVPL if it is classified as held for trading or is designated as such upon initial recognition. Financial assets are designated as at FVPL if the Group manages such investments and makes purchase and sale decisions based on their fair values in accordance with the documented risk management or investment strategy of the Group. Derivative instruments (including embedded derivatives), except those covered by hedge accounting relationships, are classified under this category. Financial assets are classified as held for trading if they are acquired for the purpose of selling in the near term. Financial assets may be designated by management at initial recognition as at FVPL, when any of the following criteria is met: the designation eliminates or significantly reduces the inconsistent treatment that
would otherwise arise from measuring the assets or recognizing gains or losses on a different basis;
the assets are part of a group of financial assets which are managed and their
performances are evaluated on a fair value basis, in accordance with a documented risk management or investment strategy; or
the financial instrument contains an embedded derivative, unless the embedded
derivative does not significantly modify the cash flows or it is clear, with little or no analysis, that it would not be separately recognized.
- 33 -
The Group carries financial assets at FVPL using their fair values. Attributable transaction costs are recognized in the consolidated statements of income as incurred. Fair value changes and realized gains or losses are recognized in the consolidated statements of income. Fair value changes from derivatives accounted for as part of an effective cash flow hedge are recognized in other comprehensive income and presented in the consolidated statements of changes in equity. Any interest earned is recognized as part of “Interest income” account in the consolidated statements of income. Any dividend income from equity securities classified as at FVPL is recognized in the consolidated statements of income when the right to receive payment has been established. The Group’s derivative assets and investments in equity instruments at FVPL are classified under this category. Loans and Receivables. Loans and receivables are non-derivative financial assets with fixed or determinable payments and maturities that are not quoted in an active market. They are not entered into with the intention of immediate or short-term resale and are not designated as AFS financial assets or financial assets at FVPL. Subsequent to initial measurement, loans and receivables are carried at amortized cost using the effective interest rate method, less any impairment in value. Any interest earned on loans and receivables is recognized as part of “Interest income” account in the consolidated statements of income on an accrual basis. Amortized cost is calculated by taking into account any discount or premium on acquisition and fees that are an integral part of the effective interest rate. The periodic amortization is also included as part of “Interest income” account in the consolidated statements of income. Gains or losses are recognized in the consolidated statements of income when loans and receivables are derecognized or impaired. Cash includes cash on hand and in banks which are stated at face value. Cash equivalents are short-term, highly liquid investments that are readily convertible to known amounts of cash and are subject to an insignificant risk of changes in value. The Group’s cash and cash equivalents, trade and other receivables, noncurrent receivables and deposits, and restricted cash are included under this category. AFS Financial Assets. AFS financial assets are non-derivative financial assets that are either designated in this category or not classified in any of the other financial asset categories. Subsequent to initial recognition, AFS financial assets are measured at fair value and changes therein, other than impairment losses and foreign currency differences on AFS debt instruments, are recognized in other comprehensive income and presented in the “Fair value reserve” account in the consolidated statements of changes in equity. The effective yield component of AFS debt securities is reported as part of “Interest income” account in the consolidated statements of income. Dividends earned on holding AFS equity securities are recognized as dividend income when the right to receive the payment has been established. When individual AFS financial assets are either derecognized or impaired, the related accumulated unrealized gains or losses previously reported in the consolidated statements of changes in equity are transferred to and recognized in the consolidated statements of income. AFS financial assets also include unquoted equity instruments with fair values which cannot be reliably determined. These instruments are carried at cost less impairment in value, if any. The Group’s investments in equity and debt securities are classified under this category.
- 34 -
Financial Liabilities The Group classifies its financial liabilities, at initial recognition, in the following categories: financial liabilities at FVPL and other financial liabilities. The Group determines the classification of its financial liabilities at initial recognition and, where allowed and appropriate, re-evaluates such designation at every reporting date. All financial liabilities are recognized initially at fair value and, in the case of loans and borrowings, net of directly attributable transaction costs. Financial Liabilities at FVPL. Financial liabilities are classified under this category through the fair value option. Derivative instruments (including embedded derivatives) with negative fair values, except those covered by hedge accounting relationships, are also classified under this category. The Group carries financial liabilities at FVPL using their fair values and reports fair value changes in profit or loss. Fair value changes from derivatives accounted for as part of an effective accounting hedge are recognized in other comprehensive income and presented in the consolidated statements of changes in equity. Any interest expense incurred is recognized as part of “Interest expense and other financing charges” account in the consolidated statements of income. The Group’s derivative liabilities are classified under this category. Other Financial Liabilities. This category pertains to financial liabilities that are not designated or classified as at FVPL. After initial measurement, other financial liabilities are carried at amortized cost using the effective interest rate method. Amortized cost is calculated by taking into account any premium or discount and any directly attributable transaction costs that are considered an integral part of the effective interest rate of the liability. The effective interest rate amortization is included in “Interest expense and other financing charges” account in the consolidated statements of income. Gains and losses are recognized in the consolidated statements of income when the liabilities are derecognized as well as through the amortization process. The Group’s liabilities arising from its trade or borrowings such as loans payable, accounts payable and accrued expenses, long-term debt, finance lease liabilities and other noncurrent liabilities are included under this category.
Derecognition of Financial Assets and Financial Liabilities Financial Assets. A financial asset (or, where applicable, a part of a financial asset or part of a group of similar financial assets) is primarily derecognized when: the rights to receive cash flows from the asset have expired; or the Group has transferred its rights to receive cash flows from the asset or has
assumed an obligation to pay them in full without material delay to a third party under a “pass-through” arrangement; and either: (a) has transferred substantially all the risks and rewards of the asset; or (b) has neither transferred nor retained substantially all the risks and rewards of the asset, but has transferred control of the asset.
- 35 -
When the Group has transferred its rights to receive cash flows from an asset or has entered into a pass-through arrangement, it evaluates if and to what extent it has retained the risks and rewards of ownership. When it has neither transferred nor retained substantially all the risks and rewards of the asset nor transferred control of the asset, the Group continues to recognize the transferred asset to the extent of the Group’s continuing involvement. In that case, the Group also recognizes the associated liability. The transferred asset and the associated liability are measured on the basis that reflects the rights and obligations that the Group has retained. Financial Liabilities. A financial liability is derecognized when the obligation under the liability is discharged or cancelled, or expires. When an existing financial liability is replaced by another from the same lender on substantially different terms, or the terms of an existing liability are substantially modified, such an exchange or modification is treated as a derecognition of the original liability and the recognition of a new liability. The difference in the respective carrying amounts is recognized in the consolidated statements of income. Accounting Policies for the Impairment of Financial Assets Applicable from January 1, 2018 Impairment of Financial Assets The Group recognizes allowance for impairment losses on receivables, other financial assets at amortized cost and investments in debt instruments at FVOCI. The Group recognizes an allowance for impairment based on either 12-month or lifetime expected credit losses, depending on whether there has been a significant increase in credit risk since initial recognition. When determining whether the credit risk of a financial asset has increased significantly since initial recognition and when estimating expected credit losses, the Group considers reasonable and supportable information that is relevant and available without undue cost or effort. This includes both quantitative and qualitative information and analysis, based on the Group’s historical experience and informed credit assessment and including forward-looking information. The Group recognizes lifetime expected credit losses for receivables that do not contain significant financing component. The Group uses provision matrix that is based on the Group’s historical credit loss experience, adjusted for forward-looking factors specific to the borrowers and the economic environment. The Group considers a financial asset to be in default when a counterparty fails to pay its contractual obligations, or there is a breach of other contractual terms, such as covenants.
- 36 -
Accounting Policies for the Impairment of Financial Assets Applicable before January 1, 2018 Impairment of Financial Assets The Group assesses, at the reporting date, whether a financial asset or group of financial assets is impaired. A financial asset or a group of financial assets is deemed to be impaired if, and only if, there is objective evidence of impairment as a result of one or more events that have occurred after the initial recognition of the asset (an incurred loss event) and that loss event has an impact on the estimated future cash flows of the financial asset or the group of financial assets that can be reliably estimated. Assets Carried at Amortized Cost. For financial assets carried at amortized cost such as loans and receivables, the Group first assesses whether impairment exists individually for financial assets that are individually significant, or collectively for financial assets that are not individually significant. If no objective evidence of impairment has been identified for a particular financial asset that was individually assessed, the Group includes the asset as part of a group of financial assets with similar credit risk characteristics and collectively assesses the group for impairment. Assets that are individually assessed for impairment and for which an impairment loss is, or continues to be recognized, are not included in the collective impairment assessment. Evidence of impairment may include indications that the borrower or a group of borrowers is experiencing financial difficulty, default or delinquency in principal or interest payments, or may enter into bankruptcy or other form of financial reorganization intended to alleviate the financial condition of the borrower. For collective impairment purposes, evidence of impairment may include observable data on existing economic conditions or industry-wide developments indicating that there is a measurable decrease in the estimated future cash flows of the related assets. If there is objective evidence of impairment, the amount of loss is measured as the difference between the asset’s carrying amount and the present value of estimated future cash flows (excluding future credit losses) discounted at the financial asset’s original effective interest rate (i.e., the effective interest rate computed at initial recognition). Time value is generally not considered when the effect of discounting the cash flows is not material. If a loan or receivable has a variable rate, the discount rate for measuring any impairment loss is the current effective interest rate, adjusted for the original credit risk premium. For collective impairment purposes, impairment loss is computed based on their respective default and historical loss experience. The carrying amount of the asset is reduced either directly or through the use of an allowance account. The impairment loss for the period is recognized in the consolidated statements of income. If, in a subsequent period, the amount of the impairment loss decreases and the decrease can be related objectively to an event occurring after the impairment was recognized, the previously recognized impairment loss is reversed. Any subsequent reversal of an impairment loss is recognized in the consolidated statements of income, to the extent that the carrying amount of the asset does not exceed its amortized cost at the reversal date. AFS Financial Assets. For equity instruments carried at fair value, the Group assesses, at each reporting date, whether objective evidence of impairment exists. Objective evidence of impairment includes a significant or prolonged decline in the fair value of an equity instrument below its cost. ‘Significant’ is evaluated against the original cost of the
- 37 -
investment and ‘prolonged’ is evaluated against the period in which the fair value has been below its original cost. The Group generally regards fair value decline as being significant when the decline exceeds 25%. A decline in a quoted market price that persists for 12 months is generally considered to be prolonged. If an AFS financial asset is impaired, an amount comprising the difference between the acquisition cost (net of any principal payment and amortization) and its current fair value, less any impairment loss on that financial asset previously recognized in the consolidated statements of changes in equity, is transferred from other comprehensive income and recognized in the consolidated statements of income. Impairment losses in respect of equity instruments classified as AFS financial assets are not reversed through the consolidated statements of income. Increases in fair value after impairment are recognized directly in other comprehensive income. For debt instruments classified as AFS, impairment is assessed based on the same criteria as financial assets carried at amortized cost. If, in subsequent period, the fair value of the debt instrument increases and the increase can be objectively related to an event occurring after the impairment loss was recognized in the consolidated statements of income, the impairment loss is reversed through the consolidated statements of income.
If there is an objective evidence that an impairment loss on an unquoted equity instrument that is not carried at fair value because its fair value cannot be reliably measured, or a derivative asset that is linked to and must be settled by delivery of such unquoted equity instrument has been incurred, the amount of loss is measured as the difference between the asset’s carrying amount and the present value of estimated future cash flows discounted at the current market rate of return for a similar financial asset. Such impairment loss shall not be reversed. Classification of Financial Instruments between Liability and Equity Financial instruments are classified as liability or equity in accordance with the substance of the contractual arrangement. Interest, dividends, gains and losses relating to a financial instrument or a component that is a financial liability, are reported as expense or income. Distributions to holders of financial instruments classified as equity are charged directly to equity, net of any related income tax benefits. A financial instrument is classified as liability if it provides for a contractual obligation to: deliver cash or another financial asset to another entity; exchange financial assets or financial liabilities with another entity under conditions
that are potentially unfavorable to the Group; or satisfy the obligation other than by the exchange of a fixed amount of cash or another
financial asset for a fixed number of own equity shares. If the Group does not have an unconditional right to avoid delivering cash or another financial asset to settle its contractual obligation, the obligation meets the definition of a financial liability. The components of issued financial instruments that contain both liability and equity elements are accounted for separately, with the equity component being assigned the residual amount after deducting from the instrument as a whole or in part, the amount separately determined as the fair value of the liability component on the date of issue.
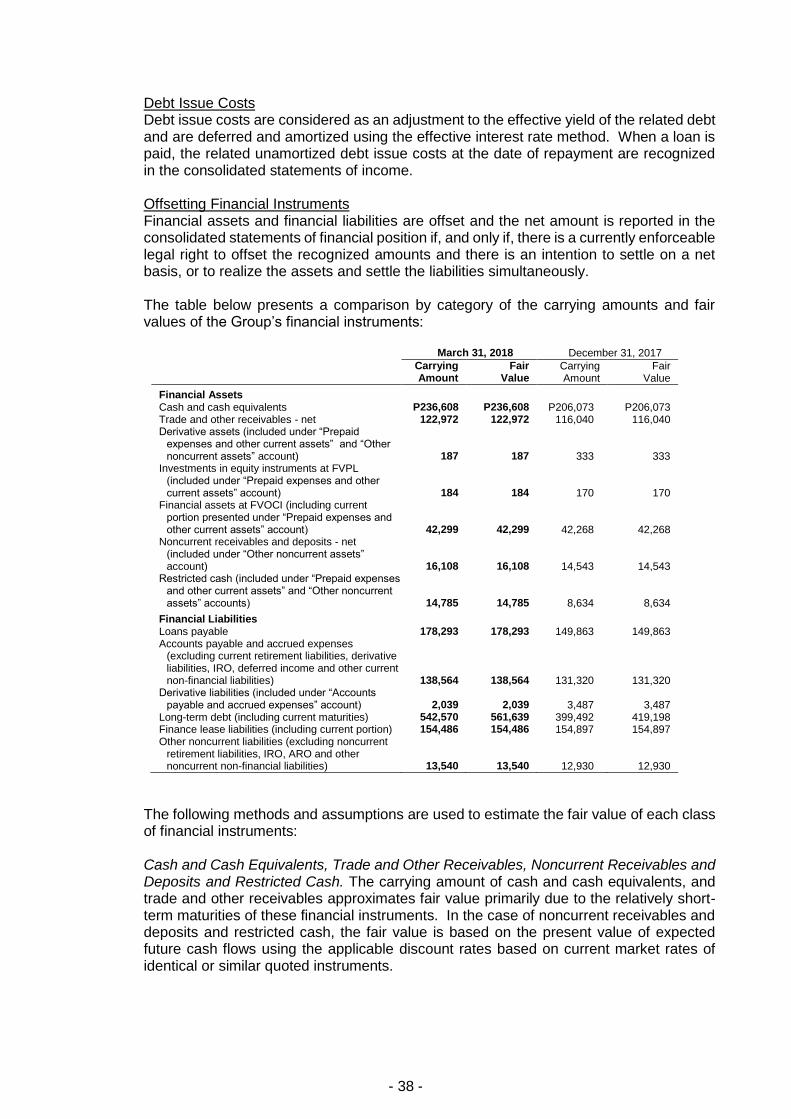
- 38 -
Debt Issue Costs Debt issue costs are considered as an adjustment to the effective yield of the related debt and are deferred and amortized using the effective interest rate method. When a loan is paid, the related unamortized debt issue costs at the date of repayment are recognized in the consolidated statements of income. Offsetting Financial Instruments Financial assets and financial liabilities are offset and the net amount is reported in the consolidated statements of financial position if, and only if, there is a currently enforceable legal right to offset the recognized amounts and there is an intention to settle on a net basis, or to realize the assets and settle the liabilities simultaneously. The table below presents a comparison by category of the carrying amounts and fair values of the Group’s financial instruments:
March 31, 2018 December 31, 2017
Carrying Amount
Fair Value
Carrying Amount
Fair Value
Financial Assets Cash and cash equivalents P236,608 P236,608 P206,073 P206,073 Trade and other receivables - net 122,972 122,972 116,040 116,040 Derivative assets (included under “Prepaid
expenses and other current assets” and “Other noncurrent assets” account) 187 187 333 333
Investments in equity instruments at FVPL (included under “Prepaid expenses and other current assets” account) 184 184 170 170
Financial assets at FVOCI (including current portion presented under “Prepaid expenses and other current assets” account) 42,299 42,299 42,268 42,268
Noncurrent receivables and deposits - net (included under “Other noncurrent assets” account) 16,108 16,108 14,543 14,543
Restricted cash (included under “Prepaid expenses and other current assets” and “Other noncurrent assets” accounts) 14,785 14,785 8,634 8,634
Financial Liabilities Loans payable 178,293 178,293 149,863 149,863 Accounts payable and accrued expenses
(excluding current retirement liabilities, derivative liabilities, IRO, deferred income and other current non-financial liabilities) 138,564 138,564 131,320 131,320
Derivative liabilities (included under “Accounts payable and accrued expenses” account) 2,039 2,039 3,487 3,487
Long-term debt (including current maturities) 542,570 561,639 399,492 419,198 Finance lease liabilities (including current portion) 154,486 154,486 154,897 154,897 Other noncurrent liabilities (excluding noncurrent
retirement liabilities, IRO, ARO and other noncurrent non-financial liabilities) 13,540 13,540 12,930 12,930
The following methods and assumptions are used to estimate the fair value of each class of financial instruments:
Cash and Cash Equivalents, Trade and Other Receivables, Noncurrent Receivables and Deposits and Restricted Cash. The carrying amount of cash and cash equivalents, and trade and other receivables approximates fair value primarily due to the relatively short-term maturities of these financial instruments. In the case of noncurrent receivables and deposits and restricted cash, the fair value is based on the present value of expected future cash flows using the applicable discount rates based on current market rates of identical or similar quoted instruments.
- 39 -
Derivatives. The fair values of forward exchange contracts are calculated by reference to current forward exchange rates. In the case of freestanding currency and commodity derivatives, the fair values are determined based on quoted prices obtained from their respective active markets. Fair values for stand-alone derivative instruments that are not quoted from an active market and for embedded derivatives are based on valuation models used for similar instruments using both observable and non-observable inputs. Investments in Equity Instruments at FVPL and Financial Assets at FVOCI. The fair values of publicly traded instruments and similar investments are based on quoted market prices in an active market. For debt instruments with no quoted market prices, a reasonable estimate of their fair values is calculated based on the expected cash flows from the instruments discounted using the applicable discount rates of comparable instruments quoted in active markets. Loans Payable and Accounts Payable and Accrued Expenses. The carrying amount of loans payable and accounts payable and accrued expenses approximates fair value due to the relatively short-term maturities of these financial instruments. Long-term Debt, Finance Lease Liabilities and Other Noncurrent Liabilities. The fair value of interest-bearing fixed-rate loans is based on the discounted value of expected future cash flows using the applicable market rates for similar types of instruments as of reporting date. Discount rates used for Philippine peso-denominated loans range from 3.1% to 6.7% and 2.4% to 5.7% as of March 31, 2018 and December 31, 2017, respectively. The discount rates used for foreign currency-denominated loans range from 1.7% to 2.8% and 1.7% to 2.2% as of March 31, 2018 and December 31, 2017, respectively. The carrying amounts of floating rate loans with quarterly interest rate repricing approximate their fair values. Derivative Financial Instruments and Hedging The Group’s derivative financial instruments according to the type of financial risk being managed and the details of freestanding and embedded derivative financial instruments are discussed below. The Group enters into various currency and commodity derivative contracts to manage its exposure on foreign currency, interest rate and commodity price risk. The portfolio is a mixture of instruments including forwards, swaps and options. Freestanding Derivatives For the purpose of hedge accounting, hedges are classified as either: (a) fair value hedges when hedging the exposure to changes in the fair value of a
recognized asset or liability or an unrecognized firm commitment (except for foreign currency risk);
(b) cash flow hedges when hedging exposure to variability in cash flows that is either
attributable to a particular risk associated with a recognized asset or liability or a highly probable forecast transaction or the foreign currency risk in an unrecognized firm commitment; or
(c) hedges of a net investment in foreign operations.
- 40 -
At the inception of a hedge relationship, the Group formally designates and documents the hedge relationship to which the Group wishes to apply hedge accounting and the risk management objective and strategy for undertaking the hedge. The documentation includes identification of the hedging instrument, the hedged item or transaction, the nature of the risk being hedged and how the entity will assess the hedging instrument’s effectiveness in offsetting the exposure to changes in the hedged item’s fair value or cash flows attributable to the hedged risk. Such hedges are expected to be highly effective in achieving offsetting changes in fair value or cash flows and are assessed on an ongoing basis to determine that they actually have been highly effective throughout the financial reporting periods for which they were designated. Fair Value Hedge. Derivatives classified as fair value hedges are carried at fair value with corresponding change in fair value recognized in the consolidated statements of income. The carrying amount of the hedged asset or liability is also adjusted for changes in fair value attributable to the hedged item and the gain or loss associated with that remeasurement is also recognized in the consolidated statements of income. When the hedge ceases to be highly effective, hedge accounting is discontinued and the adjustment to the carrying amount of a hedged financial instrument is amortized immediately. The Group discontinues fair value hedge accounting if: (a) the hedging instrument expires, is sold, is terminated or is exercised; (b) the hedge no longer meets the criteria for hedge accounting; or (c) the Group revokes the designation. The Group has no outstanding derivatives accounted for as a fair value hedge as of March 31, 2018 and December 31, 2017. Cash Flow Hedge. Changes in the fair value of a hedging instrument that qualifies as a highly effective cash flow hedge are recognized in other comprehensive income and presented in the consolidated statements of changes in equity. The ineffective portion is immediately recognized in the consolidated statements of income. If the hedged cash flow results in the recognition of an asset or a liability, all gains or losses previously recognized directly in the consolidated statements of changes in equity are transferred and included in the initial measurement of the cost or carrying amount of the asset or liability. Otherwise, for all other cash flow hedges, gains or losses initially recognized in the consolidated statements of changes in equity are transferred to the consolidated statements of income in the same period or periods during which the hedged forecasted transaction or recognized asset or liability affects the consolidated statements of income. When the hedge ceases to be highly effective, hedge accounting is discontinued prospectively. The cumulative gain or loss on the hedging instrument that has been reported directly in the consolidated statements of changes in equity is retained until the forecasted transaction occurs. When the forecasted transaction is no longer expected to occur, any net cumulative gain or loss previously reported in the consolidated statements of changes in equity is recognized in the consolidated statements of income.
- 41 -
The Group has no outstanding derivatives accounted for as a cash flow hedge as of March 31, 2018 and December 31, 2017. Net Investment Hedge. Hedges of a net investment in a foreign operation, including a hedge of a monetary item that is accounted for as part of the net investment, are accounted for in a way similar to cash flow hedges. Gains or losses on the hedging instrument relating to the effective portion of the hedge are recognized in other comprehensive income while any gains or losses relating to the ineffective portion are recognized in the consolidated statements of income. On disposal of a foreign operation, the cumulative value of any such gains and losses recorded in the consolidated statements of changes in equity is transferred to and recognized in the consolidated statements of income. The Group has no hedge of a net investment in a foreign operation as of March 31, 2018 and December 31, 2017. Changes in fair values of derivatives that do not qualify for hedge accounting are recognized directly in the consolidated statements of income. Embedded Derivatives The Group assesses whether embedded derivatives are required to be separated from the host contracts when the Group becomes a party to the contract. An embedded derivative is separated from the host contract and accounted for as a derivative if all of the following conditions are met: (a) the economic characteristics and risks of the embedded derivative are not closely
related to the economic characteristics and risks of the host contract; (b) a separate instrument with the same terms as the embedded derivative would meet
the definition of a derivative; and (c) the hybrid or combined instrument is not recognized as at FVPL. Reassessment only occurs if there is a change in the terms of the contract that significantly modifies the cash flows that would otherwise be required. Embedded derivatives that are bifurcated from the host contracts are accounted for either as financial assets or financial liabilities at FVPL.
- 42 -
Derivative Instruments not Designated as Hedges The Group enters into certain derivatives as economic hedges of certain underlying exposures. These include freestanding and embedded derivatives found in host contracts, which are not designated as accounting hedges. Changes in fair value of these instruments are accounted for directly in the consolidated statements of income. Details are as follows: Freestanding Derivatives Freestanding derivatives consist of interest rate, currency and commodity derivatives entered into by the Group. Interest Rate Swap As of March 31, 2018 and December 31, 2017, the Group has outstanding interest rate swap with notional amount of US$300. Under the agreement, the Group receives quarterly floating interest rate based on LIBOR and pays annual fixed interest rate adjusted based on a specified index up to March 2020. The negative fair value of the swap amounted to P731 and P1,563 as of March 31, 2018 and December 31, 2017, respectively. Currency Forwards The Group has outstanding foreign currency forward contracts with aggregate notional amount of US$1,219 and US$1,283 as of March 31, 2018 and December 31, 2017, respectively, and with various maturities in 2018. The net fair value of these currency forwards amounted to P4 and (P445) as of March 31, 2018 and December 31, 2017, respectively. Currency Options As of March 31, 2018, the Group has outstanding currency options with an aggregate notional amount of US$362 and with various maturities in 2018. The negative fair value of these currency options amounted to P98 as of March 31, 2018. Commodity Swaps The Group has outstanding swap agreements covering its aluminum requirements, with maturities in 2018. Under the agreement, payment is made either by the Group or its counterparty for the difference between the agreed fixed price of aluminum and the price based on the relevant price index. The outstanding equivalent notional quantity covered by the commodity swaps is 400 metric tons as of March 31, 2018. The negative fair value of these swaps amounted to P4 as of March 31, 2018. The Group has no outstanding commodity swaps on the purchase of aluminum as of December 31, 2017. The Group has outstanding swap agreements covering its oil requirements, with various maturities in 2018. Under the agreement, payment is made either by the Group or its counterparty for the difference between the hedged fixed price and the relevant monthly average index price. The outstanding equivalent notional quantity covered by the commodity swaps were 12.1 million barrels and 42.6 million barrels as of March 31, 2018 and December 31, 2017, respectively. The net negative fair value of these swaps amounted to P735 and P1,177 as of March 31, 2018 and December 31, 2017, respectively. The Group has outstanding fixed swap agreements covering the coal requirements of a subsidiary, with various maturities in 2019. Under the agreement, payment is made either by the Group or its counterparty for the difference between the hedged fixed price and the relevant monthly average index price. The outstanding notional quantity covered by the commodity swaps is 60,000 metric tons as of March 31, 2018 and December 31, 2017.
- 43 -
The positive fair value of these swaps amounted to P50 and P62 as of March 31, 2018 and December 31, 2017, respectively. Commodity Options As of March 31, 2018 and December 31, 2017, the Group has no outstanding bought and sold options covering the wheat and soybean meal requirements. The Group has no outstanding three-way options designated as hedge of forecasted purchases of crude oil as of March 31, 2018 and December 31, 2017. Embedded Derivatives The Group’s embedded derivatives include currency derivatives (forwards and options) embedded in non-financial contracts. Embedded Currency Forwards The total outstanding notional amount of currency forwards embedded in non-financial contracts amounted to US$171 and US$169 as of March 31, 2018 and December 31, 2017, respectively. These non-financial contracts consist mainly of foreign currency- denominated purchase orders, sales agreements and capital expenditures. The embedded forwards are not clearly and closely related to their respective host contracts. The net fair value of these embedded currency forwards amounted to (P338) and P93 as of March 31, 2018 and December 31, 2017, respectively. Embedded Currency Options As of March 31, 2018 and December 31, 2017, the Group has no outstanding currency options embedded in non-financial contracts. The Group recognized marked-to-market gains (losses) from freestanding and embedded derivatives amounting to P1,254, P468 and (P3,665) for the periods ended March 31, 2018 and 2017, and December 31, 2017, respectively. Fair Value Measurements The Group measures a number of financial and non-financial assets and liabilities at fair value at each reporting date.
Fair value is the price that would be received to sell an asset or paid to transfer a liability in an orderly transaction between market participants at the measurement date. The fair value measurement is based on the presumption that the transaction to sell the asset or transfer the liability takes place either: (a) in the principal market for the asset or liability; or (b) in the absence of a principal market, in the most advantageous market for the asset or liability. The principal or most advantageous market must be accessible to the Group.
The fair value of an asset or liability is measured using the assumptions that market participants would use when pricing the asset or liability, assuming that market participants act in their best economic interest. The Group uses valuation techniques that are appropriate in the circumstances and for which sufficient data are available to measure fair value, maximizing the use of relevant observable inputs and minimizing the use of unobservable inputs.
- 44 -
All assets and liabilities for which fair value is measured or disclosed in the consolidated financial statements are categorized within the fair value hierarchy, described as follows, based on the lowest level input that is significant to the fair value measurement as a whole:
Level 1: quoted prices (unadjusted) in active markets for identical assets or liabilities;
Level 2: inputs other than quoted prices included within Level 1 that are observable for the asset or liability, either directly or indirectly; and
Level 3: inputs for the asset or liability that are not based on observable market data.
For assets and liabilities that are recognized in the consolidated financial statements on a recurring basis, the Group determines whether transfers have occurred between levels in the hierarchy by re-assessing the categorization at the end of each reporting period.
For the purpose of fair value disclosures, the Group has determined classes of assets and liabilities on the basis of the nature, characteristics and risks of the asset or liability and the level of the fair value hierarchy.
Fair Value Hierarchy Financial assets and financial liabilities measured at fair value in the consolidated statements of financial position are categorized in accordance with the fair value hierarchy. This hierarchy groups financial assets and financial liabilities into three levels based on the significance of inputs used in measuring the fair value of the financial assets and financial liabilities. The table below analyzes financial instruments carried at fair value by valuation method:
March 31, 2018 December 31, 2017
Level 1 Level 2 Total Level 1 Level 2 Total
Financial Assets Derivative assets P - P187 P187 P - P333 P333 Investments in equity
instruments at FVPL - 184 184 - 170 170
Financial assets at FVOCI 974 41,325 42,299 1,002 41,266 42,268
Financial Liabilities Derivative liabilities - 2,039 2,039 - 3,487 3,487
The Group has no financial instruments valued based on Level 3 as of March 31, 2018 and December 31, 2017. For the period ended March 31, 2018 and for the year ended December 31, 2017, there were no transfers between Level 1 and Level 2 fair value measurements, and no transfers into and out of Level 3 fair value measurement.
- 45 -
11. Other Matters
a. There are no unusual items as to nature and amount affecting assets, liabilities, equity, net income or cash flows, except those stated in Management’s Discussion and Analysis of Financial Position and Financial Performance.
b. There were no material changes in estimates of amounts reported in prior financial
years.
c. There were no known trends, demands, commitments, events or uncertainties that will have a material impact on the Group’s liquidity.
d. There were no known trends, events or uncertainties that have had or that are
reasonably expected to have a favorable or unfavorable impact on net sales or revenues or income from continuing operation.
e. There were no known events that will trigger direct or contingent financial obligation
that is material to the Group, including any default or acceleration of an obligation and there were no changes in contingent liabilities and contingent assets since the last annual reporting date, except for Note 6 (i), Note 24 (c) and Note 44 (a) of the 2017 Audited Consolidated Financial Statements, that remain outstanding as of March 31, 2018. No material contingencies and any other events or transactions exist that are material to an understanding of the current interim period.
f. On May 10, 2018, the BOD of the Parent Company approved the issuance of peso-
denominated fixed-rate notes (“Notes”) in the amount of up to P20,000. The Notes shall be enrolled at the Philippine Dealing Exchange and are exempt from registration with the SEC since they will be sold only to qualified institutional buyers. The entire proceeds for the Issue will be used either for: (i) refinancing of existing loan obligations and/or redenomination of US Dollar denominated obligations of the Parent Company or (ii) additional investments in subsidiaries of the Parent Company. The Notes will be issued on May 25, 2018 in scripless form, in minimum denominations of P50 each, and in integral multiples of P5 thereafter. The Notes to be issued will have two tenors: (i) two-year Series A Notes and (ii) two-year Series B Notes with a Noteholder Put Option.
g. The effects of seasonality or cyclicality on the interim operations of the Group’s
businesses are not material.
h. There were no material off-statements of financial position transactions, arrangements, obligations (including contingent obligations), and other relationship of the Group with unconsolidated entities or other persons created during the reporting period, except for the outstanding derivative transactions entered by the Group as of and for the period ended March 31, 2018.
i. The Group’s material commitments for capital expenditure projects have been
approved during the current year but are still ongoing and not yet completed as of end of March 31, 2018. These consist of construction, acquisition, upgrade or repair of fixed assets needed for normal operations of the business. The said projects will be carried forward to the next quarter until its completion. The fund to be used for these projects will come from available cash, short and long-term loans.
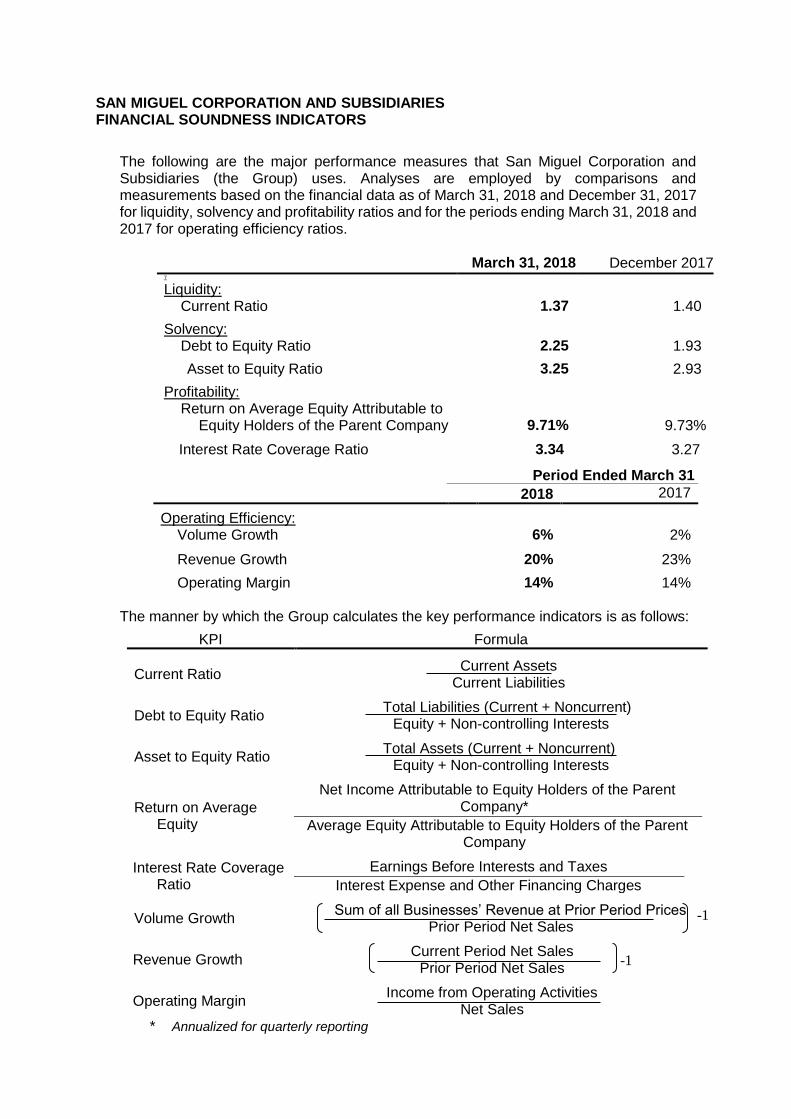
SAN MIGUEL CORPORATION AND SUBSIDIARIES FINANCIAL SOUNDNESS INDICATORS
The following are the major performance measures that San Miguel Corporation and Subsidiaries (the Group) uses. Analyses are employed by comparisons and measurements based on the financial data as of March 31, 2018 and December 31, 2017 for liquidity, solvency and profitability ratios and for the periods ending March 31, 2018 and 2017 for operating efficiency ratios.
March 31, 2018 December 2017 7
Liquidity: Current Ratio 1.37 1.40
Solvency: Debt to Equity Ratio 2.25 1.93
Asset to Equity Ratio 3.25 2.93
Profitability: Return on Average Equity Attributable to
Equity Holders of the Parent Company 9.71% 9.73%
Interest Rate Coverage Ratio 3.34 3.27
Period Ended March 31
2018 2017
Operating Efficiency: Volume Growth 6% 2%
Revenue Growth 20% 23%
Operating Margin 14% 14% The manner by which the Group calculates the key performance indicators is as follows:
KPI Formula
Current Ratio
Current Assets Current Liabilities
Debt to Equity Ratio
Total Liabilities (Current + Noncurrent) Equity + Non-controlling Interests
Asset to Equity Ratio
Total Assets (Current + Noncurrent) Equity + Non-controlling Interests
Return on Average Equity
Net Income Attributable to Equity Holders of the Parent Company*
Average Equity Attributable to Equity Holders of the Parent Company
Interest Rate Coverage
Ratio Earnings Before Interests and Taxes
Interest Expense and Other Financing Charges Volume Growth
Sum of all Businesses’ Revenue at Prior Period Prices Prior Period Net Sales
Revenue Growth
Current Period Net Sales Prior Period Net Sales
Operating Margin
Income from Operating Activities Net Sales
* Annualized for quarterly reporting
-1
-1
Management Discussion and Analysis Page 2
Acquisition of Masinloc Group
On March 20, 2018, SMC Global Power Holdings Corp. (SMC Global) completed the
acquisition of 100% equity interest in Masin-AES Pte. Ltd. (MAPL), AES Transpower Private
Ltd. (corporate support services) and AES Philippines Inc. (energy marketing services) (“the
Masinloc Group”) for a total consideration of US$1,900 million, subject to a post-closing
purchase price adjustment. The transaction involves the acquisition of the Masinloc Power
Plant, a coal-fired power plant with an operating capacity of 2 x 315 Megawatt (MW), the on-
going power project expansion of 335 MW unit known as Unit 3, and the 10 MW battery
energy storage project, all located in the Province of Zambales.
The transaction was financed through the following:
a) Availment by SMC Global of a US$700 million floating interest rate term loan and a
US$500 million fixed interest rate term loan.
The US$700 million loan is divided into Facility A Loan amounting to US$200
million maturing on March 12, 2021 and Facility B Loan amounting to US$500
million maturing on March 13, 2023. The loans are subject to repricing based on
LIBOR plus spread.
b) Availment by SMC of a total of US$400 million short-term bridge financing loans and
US$400 million floating interest rate term loan maturing on March 13, 2023. The
bridge financing loans were fully paid in April 2018 from the proceeds of the P20,000
million fixed rate peso-denominated bonds issued by SMC on March 19, 2018.
SMC subscribed to US$650 million Redeemable Perpetual Securities (RPS) issued by
SMC Global and made a US$150 million advance to SMC Global.
REFINANCING OF LOANS
Issuance of P20,000 Million Fixed Rate Peso-denominated Bonds by the Parent Company
On March 19, 2018, the Parent Company issued and listed in the Philippine Dealing &
Exchange Corp. P20,000 million peso denominated fixed rate bonds out of the P60,000 million
shelf registered Peso bonds of the Parent Company.
The bonds are comprised of the five-year Series E Bonds due 2023, seven-year Series F Bonds
due 2025 and ten-year Series G Bonds due 2028.
The Series E, F and G Bonds have fixed interest rate equivalent to 6.2500% per annum,
6.6250% per annum and 7.1250% per annum, respectively.
The proceeds from the issuance were used in April 2018 for the payment of the US$400
million short-term loans availed for the acquisition of the Masinloc Group.
Management Discussion and Analysis Page 3
Issuance of US$500 million Senior Perpetual Capital Securities (SPCS) and partial
redemption of US$750 million Undated Subordinated Capital Securities (USCS) by
Petron Corporation (Petron)
On January 8, 2018, Petron announced a tender offer to holders of its US$750 million USCS
with expiration deadline on January 16, 2018. Tenders amounted to US$402 million and were
settled by Petron on January 22, 2018. The USCS redeemed by Petron pursuant to the Tender
Offer were cancelled.
On January 19, 2018, Petron issued US$500 million SPCS with an issue price of 100% to
partially refinance the redemption of its existing US$750 million USCS, for the repayment of
indebtedness and for general corporate purposes, including capital expenditures. The SPCS
were listed with the Singapore Exchange Securities Trading Ltd. on January 22, 2018.
AVAILMENT OF LOANS TO FINANCE CAPEX/PROJECTS
SMC Consolidated Power Corporation (SCPC)
On January 31, 2018, SCPC drew P2,000 million from the P44,000 million Omnibus Loan
and Security Agreement (OLSA) with various local banks dated June 22, 2017 to finance the
ongoing construction of the 2x150 MW Limay Coal-fired Power Plant.
Citra Central Expressway Corp. (CCEC)
On March 28, 2018, CCEC drew P4,300 million from the P31,000 million OLSA with various
local banks dated December 15, 2014 for the project cost of the North Luzon Expressway -
South Luzon Expressway (SLEX) Link (Skyway Stage 3).
Luzon Clean Water Development Corporation (LCWDC)
On March 15, 2018, LCWDC drew P2,103 million from the P5,400 million OLSA with
various local banks dated September 16, 2016.
Proceeds of the loan will be used for the Bulacan Bulk Water Supply Project.
PAYMENT OF MATURING OBLIGATIONS
Infrastructure Group
The Infrastructure Group paid a total of P3,731 million of its maturing long-term debt in the
first quarter of 2018.
Other Subsidiaries
In the first quarter of 2018, Petron, SCPC, San Miguel Yamamura Packaging Corporation
(SMYPC), East Pacific Star Bottlers Phils Inc. and Can Asia, Inc. paid their maturing long-
term debt amounting to P1,312 million.
Management Discussion and Analysis Page 4
II. FINANCIAL PERFORMANCE
2018 vs. 2017
San Miguel Corporation’s consolidated sales revenue for the first quarter of 2018 amounted to
P234,347 million, 20% higher than 2017 with all major businesses posting double-digit growth.
Cost of sales increased by 21% to P183,675 million mainly due to the increase in crude prices and
excise tax on fuel, lubes & greases of Petron; higher sales volume of SMB, Poultry and the Food
group; higher excise tax of the domestic operations of SMB, cost of coal consumed by Limay
Power Plant, and prices of major raw materials of the Food business.
Selling and administrative expenses increased mainly due to higher personnel, advertising and
promotion expenses, and distribution costs of SMB, higher Liquefied Petroleum Gas (LPG)
cylinder purchases and rental expenses of Petron, and logistics and manpower costs of SMFB.
The Group’s consolidated operating income reached P32,687 million, 19% higher than last year.
This was the result of sustained sales growth from all businesses and continuous efficiency
improvements throughout the Group.
The increase in interest expense and financing charges was mainly due to the higher level of loans
payable and long-term debt in 2018 compared to 2017 from the issuance by the Parent Company
of the P50,000 million (Series A, B, C, D, E, F and G) bonds in 2017 and 2018, and availment of
US$400 million and US$400 million long-term debt in 2017 and March 2018, respectively,
issuance by SMC Global of P20,000 million Bonds in December 2017 and additional loan availed
in 2018 by SMC Global to finance the acquisition of the Masinloc Group.
The higher interest income was primarily due to higher average balance of cash and money market
placements of SMC Global, of the domestic and international operations of SMB, San Miguel
Equity Investments Inc. and the Parent Company.
The decrease in equity in net earnings primarily represents the share of SMC Global on the net
loss of Angat Hydropower Corporation (Angat Hydro) in 2018 vs net income in 2017, share of
San Miguel Properties Inc. (SMPI) on the lower income of Bank of Commerce (BOC).
The gain on sale of investments and property and equipment in 2018 pertains to the sale of service
stations by Petron Malaysia to the government. Certain service stations of Petron Malaysia were
closed since the lot they are occupying will be used for government projects.
The increase in other charges was primarily due to the higher foreign exchange loss on the
translation of the foreign currency denominated long-term debt of and finance lease liabilities as a
result of the higher depreciation of Philippine Peso (PhP) against the US$ in March 2018.
Consolidated net income of P15,609 million was 13% higher than 2017.
Consolidated recurring net income, excluding the effect of foreign exchange translation amounted
to P19,364 million, 31% higher than last year.
Share of non-controlling interests (NCI) on the group's net income increased in 2018 mainly due
to the higher net income of SMB.
Management Discussion and Analysis Page 5
2017 vs. 2016
SMC’s consolidated sales revenue for the first quarter of 2017 amounted to P195,762 million, 23%
higher than 2016. Most businesses increased their revenues with Petron, the Infrastructure and
Beverage businesses posting double-digit growth. Petron, in particular, posted a 38% revenue
increase versus 2016 with higher crude oil prices.
The corresponding consolidated operating income went up by 21% to P27,513 million, as most
businesses surpassed their 2016 income levels.
The lower interest expense resulted from the payment of loans made by Atlantic Aurum
Investments B.V. and SMC PowerGen Inc. in March and December 2016, respectively.
The decrease in equity in net earnings in 2017 primarily represents the share of SMC Global in the
lower net income of Angat Hydro, reduced by the share of SMPI in the net income of BOC in 2017
compared to the net loss in 2016.
The decrease in other income (charges) was primarily due to the P0.44 depreciation of the PhP
against the US$ in March 2017 compared to the P0.99 appreciation of PhP in March 2016, resulting
to a foreign exchange loss of P1,318 million in 2017 compared to a foreign exchange gain of
P5,701 million in 2016.
The loss on foreign exchange in 2017 pertains mainly due to the loss on the revaluation of foreign
currency denominated: a) loans payable and long-term debt of the Parent Company, SMC Global
and Petron; and b) finance lease liabilities of SMC Global. This was partially offset by the foreign
exchange gain on the foreign currency-denominated cash in banks of the Parent Company.
The decrease in other income (charges) was partly offset by the marked-to-market gains on
outstanding commodity hedge positions of Petron in 2017, compared to the marked-to-market loss
on freestanding currency of Petron and the Parent Company in 2016.
Consolidated net income of P13,828 million was 2% higher than 2016.
Consolidated recurring net income, excluding the effect of foreign exchange translation amounted
to P14,832 million, 62% higher than the P9,181 million in 2016.
The increase in the share of NCI in the Group’s net income was due to the higher net income of
Petron and SMB.
The following are the highlights of the performance of the individual business segments:
1. BEVERAGE
2018 vs. 2017
a. San Miguel Brewery Inc.
SMB continued to perform strongly in the first three months this year with consolidated
volumes reaching 65 million cases, 11% higher than last year. The strong volume growth was
mainly driven by increased consumption of SMB brands nationwide, boosted by new
marketing campaigns further strengthening its brand equity coupled with the implementation
of trade and consumer promos.
Management Discussion and Analysis Page 6
Growth in volumes combined with the impact of the price increase implemented last October
2017, brought consolidated revenues up 18% to P29,814 million.
Along with the contribution from its International Operations, operating income grew 25% to
P8,313 million.
b. Ginebra San Miguel Inc.
GSMI likewise turned in a solid first quarter performance posting a 20% increase in sales
volumes to 8.4 million cases. The core brands Ginebra San Miguel and Vino Kulafu continued
to drive growth benefitting from all out ongoing campaigns.
Revenues rose 24% to P6,359 million while operating income reached P478 million, 58%
higher than previous year.
2017 vs. 2016
a. San Miguel Brewery Inc.
SMB posted P25,364 million in revenues in the first quarter of 2017, 9% higher compared to
the same period in 2016. Operating income likewise grew 10% to P6,677 million.
Domestic operations contributed P22,225 million in revenues, a 10% jump from 2016. It sold
52.6 million cases, a 3% improvement compared to the same period in 2016. This is despite
of the very strong volumes in the first quarter of 2016 due to the elections.
International operations contributed 6 million cases, a 7% decline from the 2016 mainly due
to the withholding of shipments to United Arab Emirates as part of the purposive effort to shift
from single to multiple distributors. Despite lower volumes, San Miguel Brewing International
Ltd. managed to register operating income growth, with most units providing profitability
improvements.
b. Ginebra San Miguel Inc.
GSMI posted 32% volume growth to 7 million cases, driven by higher consumption of its core
brands. In particular, flagship Ginebra San Miguel contributed 34% growth in volumes.
Better over-all volumes translated to 31% revenue growth to P5,136 million. This, along with
higher efficiency, pushed operating income by 61% to P303 million in the first quarter of 2017.
2. FOOD
2018 vs. 2017
The Food business headed to a good start during the first three months of the year, with
consolidated revenues reaching P29,824 million, 12% higher than last year. This is on the back
of the sustained strong growth momentum from the Poultry and Fresh Meats and Value-Added
Meats businesses.
Income from operations grew 4% to P2,161 million, led by the strong revenue performance of
the Feeds, Poultry and Fresh Meats and Branded Value-added businesses. Growth was
however softened by higher prices of major raw materials and expansion-related operating
expenses.
Management Discussion and Analysis Page 7
Revenues from the Feeds, Poultry and Fresh Meats businesses grew 12% to P21,027 million,
driven by higher sales volume and favorable selling prices from the chicken and Fresh Meats
products. However, rising costs of major raw materials namely corn, cassava and feed wheat
partly affected operating income growth.
The Flour Milling business continues to be weighed down by aggressive competition among
local and foreign players putting pressure on flour selling prices. Capacity constraints likewise
limited the business’ volume growth expansion. Revenues declined by 3% to P2,370 million
relative to the same quarter last year. Nevertheless, the Milling business remains profitable
despite the margin squeeze.
The Branded Value-Added Business continued to perform well as combined revenues climbed
17% higher to P6,869 million, driven primarily by the strong performance of processed meats.
Growth in volumes was led by the double-digit sales of the mid-priced segment. Tender Juicy
hotdog continued to be the market leader in the overall hotdog category. Operating income
was likewise affected by rising imported raw material costs for dairy.
2017 vs. 2016
SMFB and its subsidiaries’ revenue grew 3% for the first quarter of 2017, reaching P26,661
million.
Agro-industrial cluster revenue grew by 2% led by 4% increase in Poultry and Fresh Meats
businesses driven by favorable prices and 2% growth in chicken volumes.
Milling business managed to increase volumes by 10% but with softening of world wheat
prices and industry competition, revenue increase was limited to 4%.
Branded Value-Added cluster delivered 3% increase in revenues driven by 11% increase in
processed meats volume. However, cheese, spreads and biscuits were affected by higher cost
of raw materials and high inventories at the trade level at the start of 2017.
SMFB’s consolidated operating income for the first quarter of 2017 amounted to P2,069
million, 16% higher than 2016 results. The strong result was due to the income performance
of Agro-industrial cluster, particularly with Poultry and Fresh Meats businesses’ favorable
selling prices and lower cost of some major raw materials. Processed Meats business also
contributed to the improved income performance.
3. PACKAGING
2018 vs. 2017
The San Miguel Yamamura Packaging Group (SMYPG) likewise started the year strong
delivering total sales revenues amounting to P8,557 million, 25% higher from 2017. This was
mainly driven by strong sales from the glass, plastics, flexibles businesses and continuous
growth in its Australian operations.
Operating income amounted to P794 million, 26% higher than 2017.
Management Discussion and Analysis Page 8
2017 vs. 2016
SMYPG’s sales revenue for the first quarter of 2017 amounted to P6,839 million, 5% higher
than 2016. The increase was brought about by higher sales of plastics, metal cans and crowns,
and Australian operations.
The Packaging business’ operating income for the period amounted to P632 million, 6% higher
than 2016.
4. ENERGY
2018 vs. 2017
SMC Global posted consolidated offtake volume of 4,790 gigawatt hours (gwh) during the
first quarter, 21% higher than last year driving revenues to grow 27% to P24,661 million. This
was the result of higher offtake volumes from Ilijan and San Miguel Electric Corp., shorter
outages, increase in Retail Electricity Supplier customer requirements, higher average selling
prices for Sual and higher contribution from the new power plants in Limay, Bataan and
Malita, Davao.
Operating income reached P7,991 million, 32% higher than the previous year at P6,040
million.
2017 vs. 2016
SMC Global’s off take volume for the first quarter of 2017 was 3,961 gwh, 11% lower than
2016 mainly due to lower bilateral volumes as a result of the scheduled annual maintenance
shutdown of Ilijan Power Plant and Malampaya gas facility from January 28 to February 16,
2017.
Corresponding consolidated net revenue decreased by 3% to P19,353 million as a result of
lower bilateral volumes, partly offset by higher average bilateral realization prices. Increase in
average realization price is attributable to higher fuel costs, both coal and diesel, passed on to
customers.
The Energy business’ consolidated operating income ended at P6,040 million.
5. FUEL AND OIL
2018 vs. 2017
Petron opened the year strong, posting consolidated revenues of P129,112 million, up 21%
from last year’s P106,412 million. Despite higher international oil prices and softer demand,
combined volumes of 26.6 million barrels ended at par vs. last year which reached full time
high. Combined domestic fuel volumes in the Philippines and Malaysia grew 5%.
Petron’s Refinery Master Plan 2 has reached its highest ever utilization rate at 99% or near full
capacity during the period.
Operating income hit P8,796 million.
Management Discussion and Analysis Page 9
2017 vs. 2016
Petron doubled its net income in the first three months of 2017 to P5,555 million. Operating
income likewise improved by 54% to P8,858 million, the result of Petron’s strong focus on
more profitable segments, production of higher-margin products and aggressive market
expansion in both Philippines and Malaysia.
Petron’s volumes grew modestly by 3% to 26.6 million barrels. Philippine operations sold 16.2
million barrels, up by 3% from 2016, as its retail segment’s volumes jumped by 6% while LPG
and Lubricants businesses grew by 5% and 16%, respectively. Petrochemical export volumes
also doubled over the period. Malaysian operations, meanwhile, posted a 4% volume growth
to almost 10 million barrels, as its domestic volumes posted 6% growth with Commercial and
Lubricants sectors showing double-digit growth.
Revenues registered at P106,412 million, 38% ahead of the same period in 2016. Volume
growth was coupled with higher selling prices as benchmark crude-Dubai averaged at
US$53.12 per barrel, compared to an average of US$30.42 per barrel in the first quarter of
2016.
6. INFRASTRUCTURE
2018 vs. 2017
The Infrastructure business posted consolidated revenue of P5,888 million, 11% higher than
last year on the back of continuous growth in traffic volume at all operating tollroads.
Operating income grew 22% to P3,114 million.
2017 vs. 2016
Consolidated Infrastructure opened 2017 with a 14% increase in revenues, bringing the first
quarter revenues to P5,326 million. The growth came from the full operations of Ninoy Aquino
International Airport Expressway and continuous growth across all toll companies namely
Metro Manila Skyway, SLEX, Southern Tagalog Arterial Road and Tarlac-Pangasinan-La
Union Toll Expressway. Consequently, operating income rose by 6%, to end at P2,563
million.
III. FINANCIAL POSITION
2018 vs. 2017
Consolidated total assets as of March 31, 2018 amounted to P1,580,790 million, P201,147
million higher than December 31, 2017. The increase was primarily due to the increase in cash
and cash equivalents, the consolidation of Masinloc Power assets and the recognition of
goodwill on the consolidation of Masinloc Group.
The increase in cash and cash equivalents by P30,535 million was mainly due to the proceeds
from issuance of Series E, F and G Bonds of the Parent Company which was used to repay the
US$400 million bridge loan in April 2018, and net cash generated from operations of SMB
and Petron.
The increase in trade and other receivables of P6,932 million is mainly attributable to the
higher bilateral sales of SMC Global and consolidation of the trade and other receivables of
Masinloc Power Partners Co. Ltd. (MPPCL), a subsidiary of MAPL.
Management Discussion and Analysis Page 10
Inventories increased by P10,980 million due to the higher prices and higher volume of crude
oil and finished products of Petron, consolidation of the materials and supplies of MPPCL,
and purchase of containers and materials by SMB in anticipation of higher volumes for the
summer season.
Current portion of biological assets increased by P208 million mainly due to expansion of
Poultry farms' capacities to support increasing supply requirement.
The increase in property, plant and equipment by P66,290 million was primarily due to the
consolidation of the power plant and properties of MPPCL and Alpha Water and Realty
Services Corp. (AWRSC), a subsidiary of MAPL, and the costs of the expansion projects of
SMFB.
Investment property also increased by P638 million mainly due to the acquisition by SMPI of
properties located in Mariveles, Bataan and Makati City.
The increase in goodwill by P70,935 million mainly represents the goodwill recognized as a
result of the consolidation of Masinloc Power.
Deferred tax assets increased by P1,309 million mainly due to the effect of recognition by the
Parent Company of deferred tax on the higher unrealized foreign exchange loss on the
revaluation of foreign currency denominated-long-term debt and loans payable in 2018, net of
the effect of deferred tax on unrealized gain on derivatives and forex restatement of San Miguel
Energy Corporation (SMEC) and Strategic Power Devt. Corp. (SPDC) and difference in the
PSALM payments versus recognized finance lease liabilities-related expenses per books and
the consolidation of the deferred taxes of AWRSC and MPPCL.
Other noncurrent assets increased by P9,073 million mainly due to the reclassification of
advances to contractors of Universal LRT Corporation (BVI) Limited, project costs incurred
for Section 3A-2 (Binalonan to Pozzorubio) of Private Infra Dev Corporation Project and
capitalized expenditures on the construction of the Mass Rail Transit Line 7 Project;
consolidation of the restricted cash balance of MPPCL and purchase of new bottles and shells
by SMB.
Loans payable increased by P28,430 million mainly due to availment by the Parent Company
of US$400 million bridge financing loans to partly finance the acquisition of Masinloc Group.
The increase in the current portion of finance lease liabilities mainly represents the
reclassification from noncurrent portion to current portion of finance lease liabilities of South
Premiere Power Corp., SMEC, and SPDC.
Income and other taxes payable increased by P4,890 million mainly due to the increase in
taxable income of SMB and San Miguel Holdings Corp., higher vatable sales of SMC Global,
and higher excise tax liability coupled with higher income tax of Petron Malaysia.
The increase in dividends payable by P1,483 million was mainly due to the dividends declared
by SMB to its common stockholders on March 9, 2018 which was paid on April 18, 2018.
Management Discussion and Analysis Page 11
The higher amount of long-term debt by P143,078 million resulted from the availments made
by SMC Global of US$1,200 million and SMC of US$400 million to partly finance the
acquisition of Masinloc; issuance by SMC of Series E, F and G fixed rate Bonds which were
used for the payment in April 2018 of the US$400 million short-term loans.; consolidation of
the long-term debt of MPPCL; and forex adjustment on the US dollar denominated loans.
The increase in equity was primarily due to the net income attributable to the equity holders
of the Parent Company, net of dividends declared by the Parent Company during the period.
NCI increased by P12,372 million mainly due to issuance of SPCS net of partial redemption
of USCS by Petron, share of non-controlling stockholders in the higher net income of Petron
and SMB, and translation adjustments, net of dividends declared to the non-controlling
stockholders of SMB and Petron.
2017 vs. 2016
Consolidated total assets as of March 31, 2017 amounted to P1,315,517 million,
P8,693 million higher than December 31, 2016. The increase was primarily due to the increase
in inventories of about P2,935 million and increase of P4,750 million in property, plant and
equipment.
The increase in inventories was mainly due to the higher value of finished products of Petron,
inventory build-up of raw materials by SMYPC and increase in purchases of molasses by
GSMI.
The increase in property, plant and equipment was primarily due to the capital expenditures
incurred by SMC Global for the on-going construction of the new power plants in Davao and
Limay, Bataan and by SMFB for its expansion projects.
Current portion of biological assets also increased by P211 million mainly due to the purposive
increase in volume of live broiler grown, to support anticipated demand requirements in 2017.
Dividends payable increased by P1,253 million mainly due to the dividend declared by SMB
to its common stockholders on March 13, 2017 which was paid on April 19, 2017.
The increase in long-term debt of P6,567 million was mainly due to the issuance by the Parent
Company of fixed rate Peso-denominated bonds on March 1, 2017, net of payments made by
SMC Global, the Infrastructure Group and Petron of their maturing long-term debt.
Deferred tax liabilities increased by P939 million due to the deferred tax on the additional
timing difference related to the method of depreciation of the RMP-2 and the power plant
acquired by Petron in December 2016 and the temporary difference between the actual
monthly payments to the PSALM over the finance lease liability-related expenses of South
Premiere Power Corp. and Strategic Power Devt. Corp.
Equity reserves increased by P634 million mainly due to the translation adjustment on the net
assets of foreign subsidiaries, mainly of Petron, San Miguel Yamamura Packaging
International Limited and SMB.
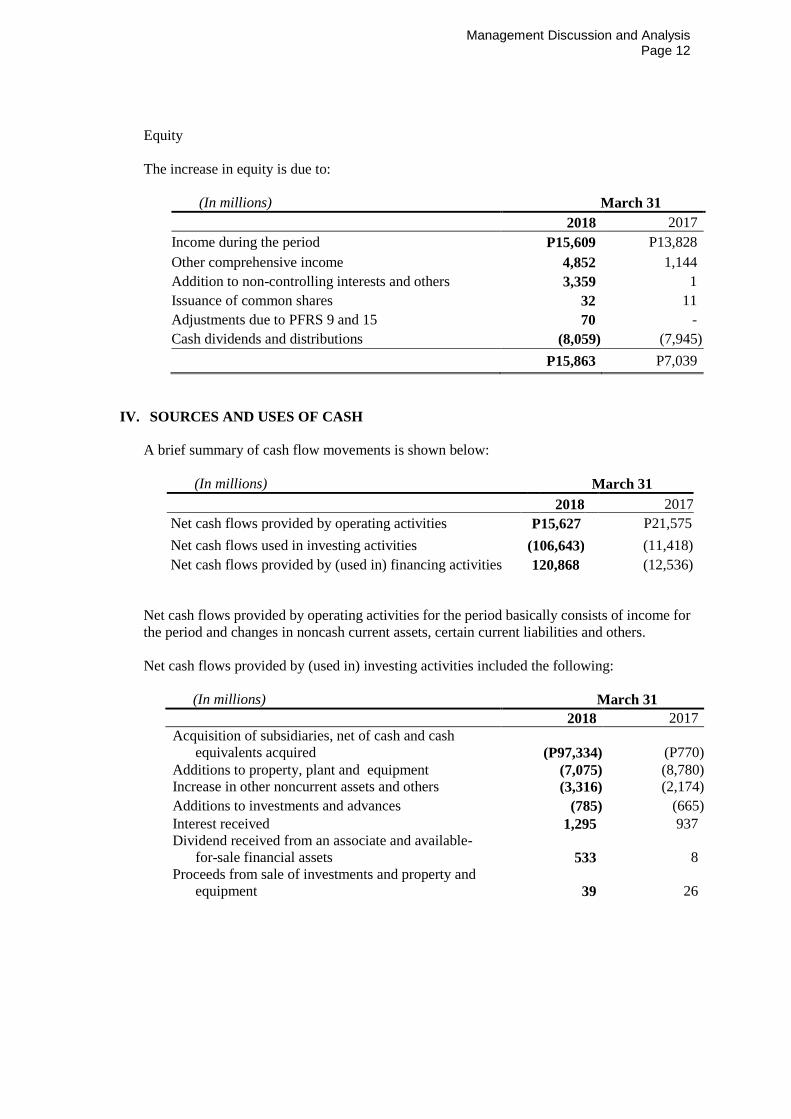
Management Discussion and Analysis Page 12
Equity
The increase in equity is due to:
(In millions) March 31
2018 2017
Income during the period P15,609 P13,828
Other comprehensive income 4,852 1,144
Addition to non-controlling interests and others 3,359 1
Issuance of common shares 32 11
Adjustments due to PFRS 9 and 15 70 -
Cash dividends and distributions (8,059) (7,945)
P15,863 P7,039
IV. SOURCES AND USES OF CASH
A brief summary of cash flow movements is shown below:
(In millions) March 31
2018 2017
Net cash flows provided by operating activities P15,627 P21,575
Net cash flows used in investing activities (106,643) (11,418)
Net cash flows provided by (used in) financing activities 120,868 (12,536)
Net cash flows provided by operating activities for the period basically consists of income for
the period and changes in noncash current assets, certain current liabilities and others.
Net cash flows provided by (used in) investing activities included the following:
(In millions) March 31
2018 2017
Acquisition of subsidiaries, net of cash and cash
equivalents acquired (P97,334) (P770)
Additions to property, plant and equipment (7,075) (8,780)
Increase in other noncurrent assets and others (3,316) (2,174)
Additions to investments and advances (785) (665)
Interest received 1,295 937
Dividend received from an associate and available-
for-sale financial assets 533 8
Proceeds from sale of investments and property and
equipment 39 26
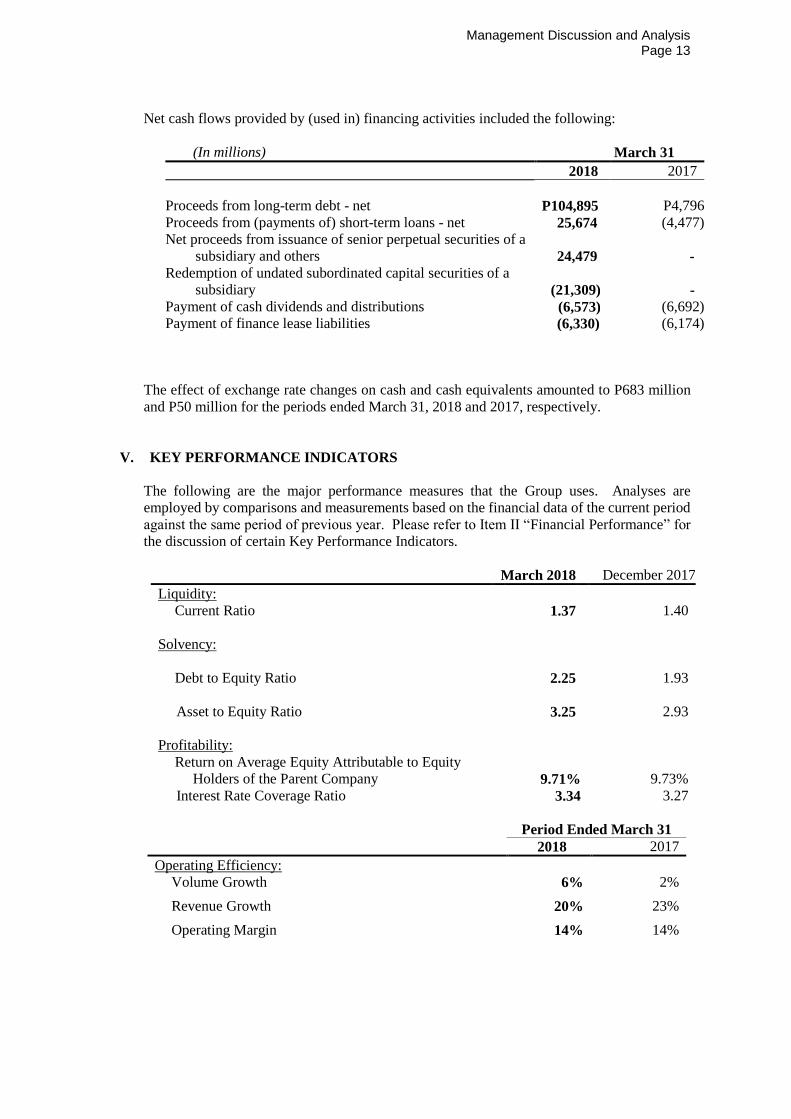
Management Discussion and Analysis Page 13
Net cash flows provided by (used in) financing activities included the following:
(In millions) March 31
2018 2017
Proceeds from long-term debt - net
P104,895 P4,796
Proceeds from (payments of) short-term loans - net 25,674 (4,477)
Net proceeds from issuance of senior perpetual securities of a
subsidiary and others 24,479
-
Redemption of undated subordinated capital securities of a
subsidiary (21,309) -
Payment of cash dividends and distributions (6,573) (6,692)
Payment of finance lease liabilities (6,330) (6,174)
The effect of exchange rate changes on cash and cash equivalents amounted to P683 million
and P50 million for the periods ended March 31, 2018 and 2017, respectively.
V. KEY PERFORMANCE INDICATORS
The following are the major performance measures that the Group uses. Analyses are
employed by comparisons and measurements based on the financial data of the current period
against the same period of previous year. Please refer to Item II “Financial Performance” for
the discussion of certain Key Performance Indicators.
March 2018 December 2017
Liquidity:
Current Ratio 1.37 1.40
Solvency:
Debt to Equity Ratio 2.25 1.93
Asset to Equity Ratio 3.25 2.93
Profitability:
Return on Average Equity Attributable to Equity
Holders of the Parent Company 9.71% 9.73%
Interest Rate Coverage Ratio 3.34 3.27
Period Ended March 31
2018 2017
Operating Efficiency:
Volume Growth 6% 2%
Revenue Growth 20% 23%
Operating Margin 14% 14%
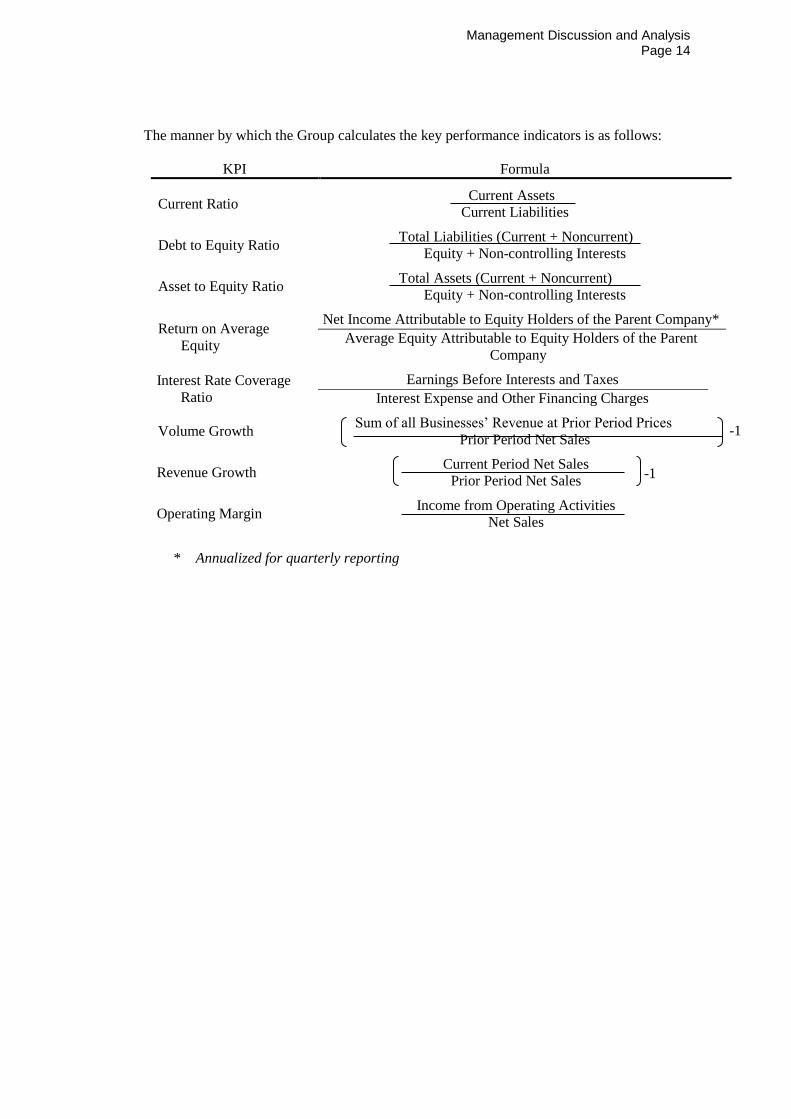
Management Discussion and Analysis Page 14
The manner by which the Group calculates the key performance indicators is as follows:
KPI Formula
Current Ratio
Current Assets
Current Liabilities
Debt to Equity Ratio
Total Liabilities (Current + Noncurrent)
Equity + Non-controlling Interests
Asset to Equity Ratio
Total Assets (Current + Noncurrent)
Equity + Non-controlling Interests
Return on Average
Equity
Net Income Attributable to Equity Holders of the Parent Company*
Average Equity Attributable to Equity Holders of the Parent
Company
Interest Rate Coverage
Ratio
Earnings Before Interests and Taxes
Interest Expense and Other Financing Charges
Volume Growth
Sum of all Businesses’ Revenue at Prior Period Prices
Prior Period Net Sales
Revenue Growth
Current Period Net Sales
Prior Period Net Sales
Operating Margin
Income from Operating Activities
Net Sales
* Annualized for quarterly reporting
-1
-1