Embed Size (px)
Citation preview
Consumer Packaged Goods (CPG) Predictive Analytics Models Mantzoufa Ioanna SID: 3308170012
SCHOOL OF SCIENCE & TECHNOLOGY
A thesis submitted for the degree of
Master of Science (MSc) in Data Science
-1-
NOVEMBER 2018
THESSALONIKI – GREECE
Consumer Packaged Goods (CPG) Predictive Analytics Models
Mantzoufa Ioanna SID: 3308170012
Supervisor: Prof. Baltagiannis Agamemnon
SCHOOL OF SCIENCE & TECHNOLOGY
A thesis submitted for the degree of
Master of Science (MSc) in Data Science
-2
NOVEMBER 2018
THESSALONIKI – GREECE
Abstract This dissertation was written as a part of the MSc in Data Science at the International
Hellenic University. It aims at analyzing the marketing mix of a retail company’s product
through the use of data science techniques and algorithms.
Initially, an introduction is written in terms of marketing, marketing mix and
modeling. Thence, the challenges faced by retailers in modeling marketing mix are analysed
and some policies to address these situations are proposed.
Afterwards, some examples take place of cases where data science is involved in
procedures relating to retail companies. Finally, the algorithms used for retail analysis are
analyzed and the procedure followed for a product’s sales prediction is explained, using
multiple linear regression.
Next, a detailed description of the dataset used for the analysis and the variables
according to which the result was extracted, was made. Furthermore, exploratory data analysis
was applied by visualizing the dataset’s features using the R language, SAP HANA Studio
and SAP Predictive Analytics.
Τhe next step was the implementation of multiple linear regression algorithm
purposing to predictive modeling for retail sales forecasting using the aforementioned tools,
concluding that this method has proven to be very effective.
At last, some conclusions are drawn and some issues for future research are suggested.
-3-

Acknowledgements I would like to express my gratitude to my dissertation advisor Dr. Agamemnon
Baltagiannis of the School of Technology, Data Science department at International Hellenic
University. The door to Prof. Baltagiannis office was always open whenever I ran into a
trouble spot or had a question about my research or writing. He dutifully allowed this paper to
be my own work but guided me in the right direction whenever he realized I needed it.
I would also like to thank my family for their moral support during the preparation of
my dissertation and also for their support throughout my academic studies in the postgraduate
program of Data Science.
Mantzoufa Ioanna
Date: 07/12/2018
-4
Contents
1 Introduction 7
2 Research Method 9
2.1 Goal and Research Questions 9
2.2 Search Process 9
3 Introduction to Marketing Mix Modeling and Business Challenges 11
3.1 Marketing 11
3.2 Marketing Mix 11
3.3 Marketing Mix Modeling 13
3.3.1 Marketing Mix Modeling on Retail 13
3.3.2 Marketing Mix Modeling Strategies 15
3.3.3 Marketing Mix Variables 16
3.4 Challenges on Marketing Mix Modeling 19
3.4.1 Business Challenges 19
3.4.2 Technical Challenges 20
4 Data Science and Retail 23
4.1 Data Science Use Cases in Retail 23
4.2 Retail Sales Forecasting 25
4.2.1 Neural Networks 25
4.2.2 Multiple Linear Regression 26
5 Dataset and Exploratory Data Analysis 27
5.1 Dataset 27
5.2 Exploratory Data Analysis 28
5.2.1 Exploratory Data Analysis using R 28
-5-
5.2.2 Exploratory Data Analysis using SAP HANA Studio and SAP Predictive
Analytics 34
6 Modeling Results 41
6.1 Modeling using R 41
6.2 Modeling using Expert Analytics 43
7 Conclusions and Next Research Steps 52
7.1 Conclusions 52
7.2 Next Research Steps 53
-6
1 Introduction Within the competitive environment we have, businesses in order to prevail on the
market must exploit all the given opportunities. Τowards following the path of success, the
decisions taken in each sector should be made after extensive research. Data science is ideal
to exploit all the information of an enterprise's internal and external environment and through
various processes to accurately predict the consequences of their decisions.
Ιn this dissertation, the concept of marketing developed, so that a further analysis of
the marketing mix, which is one of the main concepts of marketing and relates to the most
important factors influencing the direction of a company's product, followed. The main
factors are known as the 4Ps , Price, Product, Promotion and Place. They are really popular in
the field of marketing as they form the core elements where each business would have to
invest.
However, it is inadequate for a company to know these factors. The business must
build on this knowledge to follow clearer paths through which it could reach the top. In order
to achieve this, marketing mix modeling is necessary. This tool evaluates the company's
available choices, as well as reveals choices that were not known in the past and are capable
of suggesting a major development in the company.
Marketing Mix Modeling follows various strategies depending on the complexity of
the business situation and the challenges need to be addressed in each specific case. The main
strategies analyzed in this union are “longitudinal” and “cross-functional”.
Afterwards, an introduction to the kinds of variables affect Marketing Mix Modeling
is made. These variables may concern some marketing mix elements, as mentioned above
(4Ps), in addition to some market forces that engage marketing, such as consumers’ behavior
and competitors’ position. These are the elements on which modeling is based and
differentiated by.
Additional, marketing mix modeling creates new challenges which become
pronounced in business and technical level. Business challenges are related to company’s
-7-
target or recognition of useful procedures such as uplift drivers identification and decision
time reduction. Technical challenges are related to the barriers arise from a technical point of
view, like the instability of coefficients.
The second chapter of the literature review, refers to the connection between data
science and retail trade. Initially, some applications through which data science contributed to
the upward path of retail companies are briefly explained. The second part of this chapter
refers to a particular use case of data science in retail, which is crucial for a company to
address. This is sales forecasting, for which the algorithms that are used more frequently are
explained. The most prevalent of them is being implemented in the chapter which concerns
modeling, on a real dataset.
In the fifth chapter, a dataset concerning Consumer Packaged Goods industry is
analytically explained. Building on this dataset, exploratory data analysis and predictive
modeling will be made, using R programming language and SAP’s tools.
The exploratory data analysis part includes a descriptive statistics projection
conducted using R language running in Rstudio environment. Also, it includes data
visualization, which is the core concept of this kind of analysis. The tools used for data
visualization are R language, SAP HANA Studio and SAP Predictive analytics, in order to
make use of both open source and commercial tools.
In the next chapter, multiple linear regression algorithm was implemented for the
predictive modeling, using the same tools as before. This function slightly differs from the
one tool to the other. The procedure followed after modeling using R is visualizing residual
plots, which consists an important path that assesses regression models. With SAP Predictive
Analytics the modeling process is specific with unique differentiation the variables that were
selected for modeling and the function choice. The result in both cases was highly accurate,
proving multiple linear regression is really suitable for such kind of analysis.
Τhe last chapter refers to the conclusions drawn following the research carried out in
the context of the present diplomatic work as well as by the model’s application in real data.
Finally, some suggestions for future research have been made, with the aim of further
contribution of data science to similar kinds of cases.
-8
2 Research Method This chapter refers to the methodology followed for the compilation of the third and fourth
chapter, which compose the literature review of this dissertation.
2.1 Goal and Research Questions The goal of this research is to point out the data science use cases in retail companies and
explain the way multiple linear regression is used for sales forecasting, after a brief
introduction to the marketing mix and marketing mix modeling concepts. The formulated
research questions that used to achieve the goal described above are:
RQ1: What is Marketing Mix Modeling?
RQ2: What are the retail business cases where data science applications are being used?
RQ3: How does Multiple Linear Regression contribute to sales forecasting?
2.2 Search Process In this literature review, the approach which was followed is proposed by Kitchenham 2007
[1]. In order to cover a large spectrum of relevant publications, the following widely
recognized libraries were used:
a) Science Direct
b) Emeraldinsight
c) Springer Link
Google Scholar used as well in cases where some topics were not fully covered by the
previous libraries.
Some of the keyword strings that were used are “Marketing Mix”, “Marketing Mix
Modeling”, “Data Science and Retail”, “Sales Forecasting Algorithms”. At the next step, the
fields where the results could be useful were decided. In order to get a reasonable number of
results, the keyword strings were searched in the title, abstract and keywords. No restrictions
regarding the paper release date were used.
The procedure for literature selection was conducted until September 2018, so it contains
papers that were published up to that date. The final number of papers gathered after
-9-
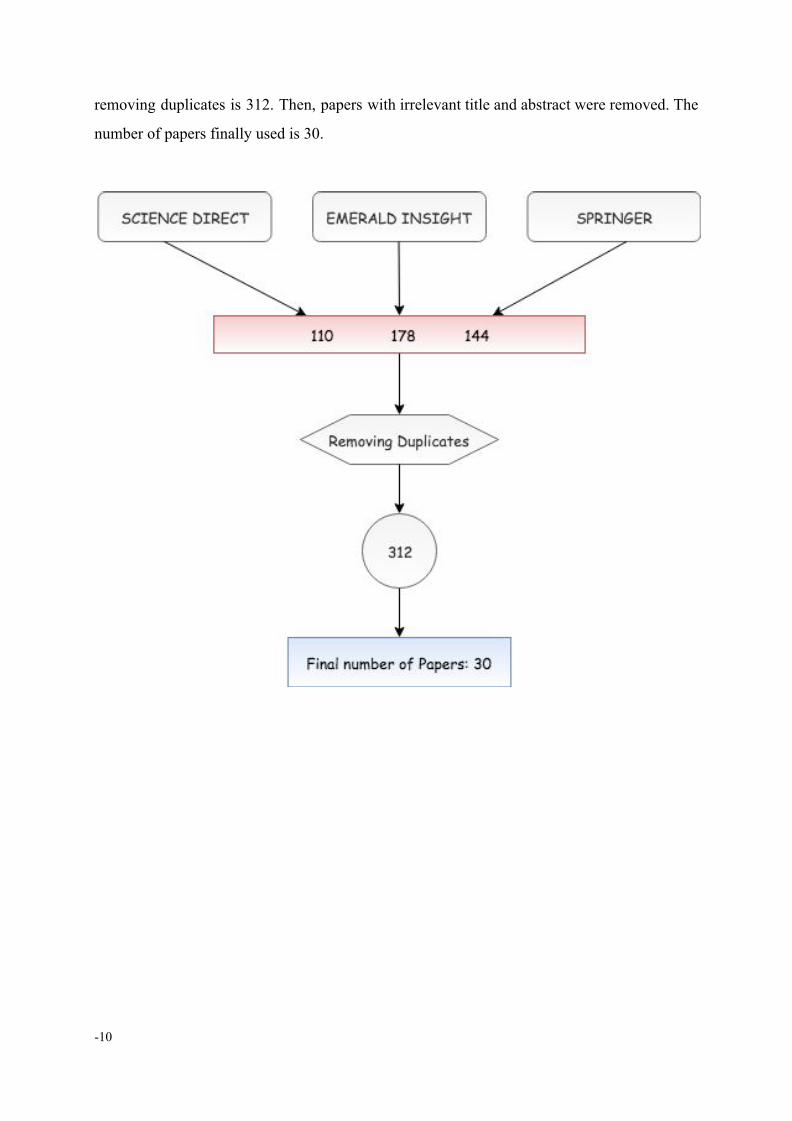
removing duplicates is 312. Then, papers with irrelevant title and abstract were removed. The
number of papers finally used is 30.
-10
3 Introduction to Marketing Mix Modeling and Business Challenges
Business market is constantly growing and becoming more competitive as many
similar products and services have been introduced to the same market so as to meet
consumer needs.
3.1 Marketing Towards addressing market needs, companies follow different policies and choose the
suitable techniques through which they try to achieve the best possible result in maximizing
the profit and sales of their products.
Success is the result of integrated operations and processes that are related to strategic
decisions determining the course of each company and its products.
Applying the principles of modern marketing and adopting in depth this simple to
interpret but extremely difficult to implement definition of what marketing is, every company
and product moves towards the future with greater safety.
According to Armstrong and Kotler (2011), “Marketing is a set of steps that deliver
value, which could be remembered by customers and can create a relationship with them, as
well as providing benefits to the organization”. [2]
With the intention of value delivery, some marketing expenditure and investment
decisions should be made. This requires the analysis of marketing mix, which is considered
one of the core concepts of marketing theory.
3.2 Marketing Mix Neil Borden, Emeritus Professor of marketing at the Harvard Business School, was the
first to suggest the term “Marketing Mix”. The term was inspired from his associate,
Professor James Culliton. In 1948, Culliton described the business execute as “a mixer of
ingredients”.
-11-
The creation of a profitable company is largely depended on the combination of
appropriate marketing procedures and policies. A company’s marketing mix is a set of actions
the company follows to promote its brand or a specific product in the market.
The main areas where marketing managers should concentrate in order to achieve their
goals are widely known as the “4Ps”. These are Price, Promotion, Product and Place. The first
to introduce these four marketing variables was E. Jerome McCarthy in 1960.
According to McCarthy, marketing management faces some issues regarding customer
analysis and product, channels, promotion and pricing analysis. The suggested solution was
the use of a framework that emphasizes on customer importance and has the 4Ps mentioned
above as fundamental variables.
In 1981, Bernard H. Booms and Mary J. Bitner further developed the traditional
marketing mix into the extended marketing mix or services marketing mix. This is also called
as the 7Ps model, as Booms and Bitner included three additional Ps to accommodate trends
towards a service or knowledge-based economy; they added “People” in order to recognize
human element importance, “Process” to reflect the fact that services are experiences as
processes, and “Physical Evidence” referring to the whole environment in which the service is
presented.
All of the above are only the primary principles developed around the marketing mix
concept. This term is continuously enriched with more elements according to the needs of
each season/period. These theories are the foundations of marketing mix, but there are more
theories about the variables added over the years. The rest of the variables as well as those
which mentioned above will be discussed in another chapter.
Marketing managers should learn how to select the appropriate variables for an
accurate and targeted analysis of their company’s marketing mix, for the purpose of attracting
customers via their buying behavior and, thus, keep them satisfied.
For this reason, models have been created that aim to claim and analyze the available
data that facilitate marketing managers. The analysis of such cases is called Marketing Mix
Modeling. [3][4][5][6]
-12
3.3 Marketing Mix Modeling “Marketing mix modeling” has been applied to a variety of marketing models. In this
way, many different business strategies could be evaluated, which have emerged from the
commercial development each company has shaped according to its objectives. Some of the
marketing policies followed by businesses are related to the way the advertisements are used
by the company to promote the company itself or its products, the type of promotions applied,
packaging procedures, sales forecasting, all combined with the policy and the moves followed
by competitive companies.
There are several models implemented in order to contribute in the optimization of the
above situations. However, the most prevalent model for this type of analysis is multiple
linear regression. This model is based on a number of variables that are related to each other
which must necessarily be taken into consideration for each type of decision making.
Whichever modeling solution technique is being used, it is important to be validated
throughout the model’s development. Once this procedure is followed, the input variables can
be used to determine some valuable information for the company. Usually these predictions
concern business profit or sales. For example, a marketing manager, knowing that an
investment on advertising could result in a big profit for the company, if made on a specific
time, it could make some decisions about the amount of money to invest on advertising at the
right time. In other words, it is necessary for the marketing manager to understand in depth
how each one of the variables affect the company’s sales and profits towards following the
optimal strategy. Therefore, Marketing Mix modeling could lead in decision making as well
as creating a knowledge platform which the company could easily reclaim. [9][10]
3.3.1 Marketing Mix Modeling on Retail Marketing mix modeling is a very useful tool with many analytical capabilities that gives
retailers the opportunity to create an inclusive fact base. Its usability is that it enables them to
take data-driven marketing and activity decisions. Marketing mix modeling is based on
econometrical modeling and a tool through which the performance of the marketing mix can
-13-
be measured so as to follow some optimization solution through advertising or other means,
such as promotions and pricing.
In general, there is a perception that retail management is concerned with the
aesthetics of products and how they will look on the TV screen, on the shelf and, therefore, in
the consumer’s mind. However, this is the least retail management is about. As it is much
more complicated than that, both marketing and sales department need a concise and simple
basis to record the facts they need to make strategic decisions. There are many issues the
executives would like to know how to handle and marketing mix modeling could give the
answer.
The objective of the marketing mix modeling is to provide a complete real base for the
executives involved in the retail management in order to help them make strategic decisions.
A very important issue about which they are called to decide is the allocation of funds to
various business departments and levers as well as their investment.
There are three main types of analysis that could be applied through marketing mix
modeling. These are Performance driver analysis, Impact analysis and Optimization of
marketing spend. The first one relates to the factors that drive the company’s performance and
specifically, it provides the answer to which of the factors affect directly an organization’s
success. Impact analysis associates with marketing investments and their impact on revenue.
Last but not least, Optimization of marketing spend is concerned with the marketing budget,
the capital sales and their reinvestment to revenue and profit.
An ideal analysis of Marketing Mix modeling deals with the impact of key marketing
factors on revenue and profits of the enterprise with the purpose of determining the actual
performance drivers. Moreover, it separates these variables from other, external factors that
could not be affected by the company. For example, weather or demographic trends belong to
this category, while promotional flag and advertising are some of the factors that affect the
result and could be modified by the company with the purpose to affect the revenue and
profits of the company. Marketing Mix modeling provides the needed information about the
measurements of all the above. This kind of analysis belongs to the second type of analysis
mentioned in the previous paragraph, Impact analysis. An example is that it could provide
information about advertisements and promotions as well as which one of them would be
-14
more effective driver for a company in a specific case. In addition, Marketing Mix modeling
offers the company the opportunity to extract knowledge about consumer perceptions on
product pricing. An effective way to increase the revenue would be to reduce the price of the
product by adding a discount to it. However, the impact of this discount on the long-term
profit of the business is even more important. For the purpose of balancing the short-term
with the long-term benefits of the business, a sensitivity test is necessary. Marketing mix
modeling enables retailers to investigate the possible after-effects of their actions, with the
result of enabling them to support their decisions in simulation results, rather than making
actions based on their instinct. [7][9][10][11]
3.3.2 Marketing Mix Modeling Strategies There are two main strategies that could be applied to Marketing Mix models. These
are “longitudinal” and “cross-functional”.
In the longitudinal approach, the analysis focuses on the sales and profits per period of
time combined with the market inputs of each period. This time period depends on the
company’s target.
The cross-sectional analysis, also known as side-by-side analysis, is an approach
where each one of the different sales territories receive its own inputs at the same period of
time; alternately these inputs are distributed across the territories of sales and correlated to the
outcomes of profits and sales.
Both of the aforementioned methods are effective and each one of them can be applied
in specific cases. However, sometimes the combination of these methods has a more accurate
result and is more efficient than using only one of the two methods.
None of the methods mentioned above can have an efficient result, unless the data
used for the analysis are suitable. The data should be accurate and highly specific, as the
modeling process is based on them. Initially, a data warehouse should be designed, targeting
modeling support, as misleading data constitute the most important barrier for successful
modeling. The second step is data collection and preprocessing as well as data import into the
data warehouse. Another important detail is that in some cases of continuous data
modification, the collection and cleaning of data along with entering new data into the data
-15-
warehouse should be controlled constantly. Towards achieving a successful modeling, clean,
accurate and specific data are needed. The data must be reported in subdivisions of the
company, such as specific brands and product lines and not in the whole company. This is
because the data analysis cannot be done correctly at a global level, since each sub-assembly
has its own attributes, which would be able to output a false representation for a subset with
totally different data. [3][9][10][11]
3.3.3 Marketing Mix Variables Every company and product are special and unique. For the development of a
successful marketing mix modeling, variables relevant to marketing mix should be identified.
Then, the measurement of each one of them should be calculated according to how they affect
the marketing mix. Moreover, Data Warehouse should be updated constantly, as marketing
mix is continuously changing. The variables on which modeling is based on are some
elements that compose marketing programs in addition to other external factors encountered
in the external environment.
Elements of the Marketing Mix
Product:
This is the first of the four Ps included in marketing mix concept. The product either has
material or non-proprietary form, meaning it is a service. In both cases, its purpose is to
address customer needs. Thus, it is of major importance that the business offering a product
on the market knows exactly which needs the product is covering and understands completely
the nature of the product as well as what makes it unique. That is the only way to make a
product successful. A very important process to be followed is product planning. This
includes procedures about product lines, product’s market direction and Research and
Development programs when it comes to a new product.
Price:
Determining the price of a product is one of the most important marketing mix
processes, as it affects the profit margins on a specific product. The pricing strategy of a
company should take into account what its product represents and what its reflection on the
-16
market is. The product’s price must also cover its total cost of production. In addition, a price
survey of competing products should always be conducted. Marketing Mix modeling could
help in the product pricing segment by predicting what price adoption is best suited to
maximize the company's profit in combination with other factors.
Place:
This variable refers to the methods and locations about product hosting in order to
make it easily accessible to the customers who belong to its target group. It is critical to
evaluate possible locations and identify where the product should be located. Place includes
the distribution channels through which a product passes until it reaches out to the customers.
These channels are related to procedures and policies about retailer-wholesaler relationship.
Promotion:
A common way to increase the sales of a product is through promotions. It is
necessary to look at the different ways in which product information is distributed to
consumers in order to differentiate the price of the product for a certain period of time and in
a different way depending on the circumstances. The procedures related to promotions are the
identification of promotion type and the optimization of financial burden of promotion selling
plans and devices. There are two types of promotions, consumer and trade promotion:
Consumer promotions: There is a variety of consumer (end-user) promotions that
we come across. However, all of them share a common characteristic which regards the
immediate effects that they cause on the market as compared to advertising. Promotions such
as temporary price reductions, buy one-get one free or cent-off coupons constitute some
fundamental examples of promotions which are designed in a robust way to directly affect
sales. We feel it is wise that these kind of promotions need to be well understood and
measured before incorporated into the business models.
Trade promotions: Τhese are discounts that are not made for consumers but for
shops to buy large quantities of them for resale. Ιt is a common policy of products that appear
on the market for the first time.
Advertising:
Through this process, the consumer community is informed about and influenced by
the existence and use of a marketed product. There are several means of advertising, which
are based on product needs and used according to the consumer group to which it is
-17-
addressed. Some of the policies related to it are the decision taking about spend amount and
mix of advertising.
Branding:
Branding refers to the way a customer understands the product or service provided. It
consists of policies and procedures concerning the choice of the product or the company logo,
brand policy and commercial label choices.
The variables mentioned above are the ones that affect marketing mix the most.
Nevertheless, there are much more elements that contribute to marketing mix concept, such as
personal selling, packaging, display, servicing, physical handling and fact finding and
analysis. [3][9]
Market Forces that engage Marketing
Consumers Behavior:
The consumer market is the total of people who purchase or acquire goods and
services for personal use. Their behavior is determined by their purchasing motivation, buying
and living habits, environment and their buying power. These elements should be taken into
account in order to properly promote the products on the market.
Trading Behavior:
This term refers to the behavior of wholesalers and retailers. It concerns their
motivations as well as the goal they have set, their structure and way of thinking and their
changing trends in the structure and the processes they follow.
Competitors Position and Behavior:
The behavior adopted by a company's competitors is affected by several elements. One
of these is the business-to-industry relationship, which involves the strength and size of
competing firms, the number of competitors, the concentration of industry and indirect
competition, i.e. competition generated by other kinds of products. Other factors influencing
the behavior of competitors is supply-demand relationship, product characteristics such as the
quality and price offered to consumers by the product sector, the level at which competitors
compete against non-discount base prices, incentives and attitudes of competitors like their
-18
possible response to actions by other companies and technological and social changes that
change supply and demand.
Governmental Behavior and Marketing Controls:
The company’s attitude depends on the information concerning government control of
marketing. Controls over marketing concern regulations over products and pricing, rules on
competition practices and restrictions on advertising and promotion policy. The greater
influence of governmental control on marketing is to act as a great educational campaign to
get to know all parties involved in the routes and distribution processes and to achieve a wider
use of good practices already in place. [3]
3.4 Challenges on Marketing Mix Modeling For better investment initiatives, every organization depends on the optimal
distribution of funds across different marketing channels. Thus, an analytical approach such
as Marketing Mix Modeling is required to enhance marketing budgets. Taking into
consideration its wide adoption across industries, MMM serves as a recommendation tool for
efficient fund allocation across multiple marketing channels. Despite these facts, it is pivotal
that the MMM technique should be appropriately implemented to achieve maximum results.
3.4.1 Business Challenges Cannibalization effect measurement for every product and its competitors
Cannibalization is a maintenance procedure according to which an operational
component is extracted from a larger set of components which are considered unserviceable.
This helps in servicing and maintaining other equipment of the same type by using similar,
operational sub-components of unserviceable items. The reason to that is usually lack of stock
parts available in the market or difficulty in retrieving it from the vendor or manufacturer.
Revenue growth
Several factors affect the revenue growth. It is of great importance the reasonable
proof of product value as well as benchmarks for initial executive sponsorship, ensuring the
sponsors’ engagement by using a proof-of-value pilot. Various analytics that provide
-19-
meaningful insight and prioritize the needed changes within the organization shall be
implemented throughout the revenue estimation process. For achieving maximum results, a
combination of the aforementioned practices is recommended, along with the use of a
thorough implementation plan.
Proper Pricing
The success of each business is largely due to the correct pricing of its products. The
foundation of the prosperity of an enterprise is the pricing of products, thus enhancing the
number of sales and revenue of the business. However, the existing pricing methods need
many adaptations depending on product, business and market types. To address this
challenge, there are several algorithms could be used, as there is excessive quantity of data on
consumer profiles, which is one of the key elements of this procedure.
Promotional effectiveness measurement
As price promotions are increasingly applied for the stimulation of a company’s
performance, new methods have been also introduced to further enhance as well as quantify
their effectiveness. The introduction of scanner data and persistence modeling are two
innovative means of promotional effectiveness.
Volume uplift drivers identification
The success of each company depends on a number of internal and external factors.
The identification of uplift drivers of sales and evidences of store performance is a crucial
challenge to be addressed. The major focus should be on measurable key drivers responsible
to record the progression of the company, while being correlated in the same time with a
certain standard, i.e. a budget or an average.
Decision time reduction
The successful implementation of different ideas is determined by the shortening of
decision time. This can be achieved through converting the internal setup operations into
external ones. However, key factors such as cost or safety should be taken into consideration
for the most appropriate setup technique to stand out. [12][13][14][15][16][17]
-20
3.4.2 Technical Challenges
State of Data
For each kind of analysis, as well as for marketing mix modeling, it is necessary to
evaluate the current data state. Unfortunately, in many cases the marketing department does
not fully exploit the given information. When the data state is not correct, modeling could fail.
A proposed policy to prevent such situations is to identify the necessary types of information
and needed data for future analysis.
Multicollinearity
When the marketing activities coincide with each other, they generate a collinearity in
the analysis model. These variables typically appear when analyzing by using observation
data. The most important issue is the kind of impact they have on our analysis, which
sometimes is negative. Α recommended solution to avoid such situations is the removal of
highly correlated input variables or the use of information overlapping methods.
Lack of Measurement Standards
The development of better measures of marketing variables is essential for knowledge
evolution. The measurement process concerns “rules for assigning numbers to objects to
represent quantities of attributes” . Τhe measurements with which marketers work are often
inadequate. For that reason, emphasis should be placed on their development through careful
programming of data collection and analysis.
Lack of Transparency
The lack of transparency can have an impact on manipulation of information and
issuing of false or misleading information. There are four types of transparency that
contribute to information technology exploitation and transparency development: cost, supply,
organizational and technological transparency.
Measurement of Advertisement Content
Advertising content is a complicated element to measure. The substantial factor of
advertising measurement is sales. Direct sales results constitute a criterion of advertising
effectiveness measurement. However, this does not represent the degree of completeness the
-21-
content of an advertisement can have. On account of this, evaluation models of advertisement
effectiveness have been developed.
Dynamic Effects
At the start of a business move, the results are not immediately apparent. In many
cases, even months have passed until the efficiency of some moves has emerged. During this
time, it would be useful to consider the different aspects of creating a model process. A
proposed policy of addressing this issue is to identify the required time to show results and to
address the variables and the effects on it.
Interaction Effect between Advertisements
Different marketing activities can have a better effect on sales, providing they are
properly coordinated. In many cases, the coexistence of promotions and advertisements,
instead of increasing profit through the sales of a product, has a negative effect on it. Whilst
the direct effect of these methods is positive, the use of pricing has a negative impact on the
influence of the consumer community through advertisements and the opposite. However,
there are several ways to control this issue by applying classification algorithms where
relationships between marketing activities can be recognized and there is the possibility of
their application optimization.
Nonlinear Effects
There are cases where the effect of altering a variable on the desired result is specific
and others where their relationship is linear. However, this relationship is often quite complex
and there is a need to identify and describe it. For example, in some cases of activity
implementation, customer responsiveness is relatively predictable. Other times, it is difficult
to predict their effects as the relationship of consumers with certain advertising spots, such as
television, is not linear, making modeling process difficult.
Instability of Coefficients
In many cases, when modeling a marketing mix of a product, there are columns that
are related to each other and, as mentioned above, they are almost collinear. Thus, when the
independent variables of the model are highly correlated, an instability effect on the least
square coefficients is caused. To deal with this issue, biased estimators are often used which
aim at greater stability.[18][19][20][21][22][23][24][25]
-22
4 Data Science and Retail
Data is becoming more and more important to businesses that want to make profitable
decisions. Retailers analyze the data as they have found that their beneficial value produces
positive results for their businesses.
4.1 Data Science Use Cases in Retail Bellow, there are some cases in which data science contributes to the upturning of
enterprises by solving certain problems and optimizing different processes.
Recommendation Engines
Α very useful tool for predicting consumer behavior is Recommendation Engines. In
this way trends are dictated resulting in increased sales.
Market Basket Analysis
Τhe most necessary process of analyzing retail data is the Market Basket Analysis. For
this process, it is very important to organize the transaction data correctly. Rule mining
algorithms are the core tool behind this type of analysis. Through Market Basket Analysis the
profits from sales reach the peak.
Warranty Analytics
The tool used to monitor warranty claims, reduce costs, improve quality and detect
illegal activities is Warranty Analytics. It is a good opportunity to convert Warranty
challenges into active intelligence.
Price optimization
A major advantage gained through the use of optimization mechanisms is to determine
the appropriate price of a product. Pricing depends on various factors, such as the cost of
production, customer target group as well as competition’s prices and offers.
Inventory management
Τhe procedure which refers to the storage of goods for future use is called inventory
management. The supply chain is analyzed in depth, taking into account the product offer at
-23-
the right time on the right side. Machine learning algorithms are used to identify correlations
and patterns between the available elements and the supply chain.
Location of new stores
Data Science seems to be extremely important in terms of new stores location. Τhe
algorithms used for this issue are quite simple but simultaneously effective. In this type of
analysis, the demographic data and data relating to the location of other stores are of utmost
importance.
Customer sentiment analysis
The analysis of data extracted from social networks and e-Services, is a part of
customer sentiment analysis. Τhe implementation of analytical tools on social platforms is
easy as they are directly available. Α common policy is to monitor words that are positive or
negative in order to understand the view that the client has shaped.
Merchandising
Τhe purchasing decisions taken by customers through optical channels are easy to be
manipulated through merchandising tools. Some important elements that contribute to this are
the brand names of the product or the company in combination with the attractive packaging.
Data on consumer priorities, taking into account market trends, are essential for a proper
analysis.
Lifetime value prediction
Τhe total value of the profit which is acquired by a particular customer throughout his
/ her relationship with the business is called customer lifetime value. Ιn this forecasting
procedure, historical data identifying consumer preferences are of particular importance. Τhe
result obtained after analyzing the mentioned data reflects the value of customers for the
business.
Fraud detection
Ιn order for a client not to suffer any kind of fraud with a negative effect on the
company, a fraud detection process is a must. There are Big data platforms to detect such
activities that allow continuous monitoring of any move. Τhe Data Science Algorithms used
in these cases should not only identify fraudulent activities but also predict future similar
activities. This way, the customer and the company are protected.
-24
Αs is apparent from the cases mentioned above, data science has many useful applications for
businesses operating in the retail trade. Αll the data that can be claimed for the benefit of an
enterprise are analyzed and processed in order to find the right marketing policy and to
optimize the commercialization processes.
However, there are still many applications where data science contribute to the upward
path of companies. Οnly the most common cases have been reported above. A very useful
application of data science is the sales forecast of a product, which is presented in the next
chapter.
4.2 Retail Sales Forecasting A crucial task of a store’s management is sales prediction. Predictive analytics is a
powerful tool which allows retailers discover the factors that drive products sales. Various
algorithms have been used to periodize sales of products. The most widely used of them are
Neural Networks and Multiple Linear Regression.
4.2.1 Neural Networks Ιn the technical sector, the expression and evaluation of the predictable parameters of
a system is done using equalizers. Τhus, many complicated problems are encountered, which
may have been unlikely to be solved. Neural Networks is a computationally complex method
and quite often the solution is easy to find following the fact that has been predicted.
Νeural Νetworks are used for seasonal and non-seasonal sales forecasting as they are
the most custom non-linear models. Unlike other models, Neural Networks are flexible in any
kind of non-linear pattern analysis, as they don’t make any assumptions about underlying data
generating process. The most common Neural Networks model is used for sales prediction , is
the three-layer network, which is represented as:
-25-
with p input nodes, q hidden nodes, a sigmoid function f, aj a vector of weights of the input to
output nodes with j = 0, 1, 2, …, n and βij the weights of the input to hidden nodes with
i = 0, 1, 2, …, p and j = 0, 1, 2, …, q. a0 and β0j are the weights of arcs leading from the bias
terms that have always values equal to 1. The inputs xi are the delayed observations.
4.2.2 Multiple Linear Regression The modeling technique that is responsible for the analysis of the relationship between
a dependent variable y and one or more independent variables x1, x2, … , xk is called
regression analysis and it is the most common way of analysis is Sales Forecasting.
This technique aims at recognizing the function that describes the relationship of these
variables, so as to predict the value of the dependent variable taking into account the values of
the independent variables.
An ordinary form of regression analysis is multiple linear regression, that is used to
explain the relationship between a continuous dependent variable and more than one
categorical or continuous independent variables. A multiple linear regression model can be
formed as: y = β0 + β1x1 + β2x2 + ... + βkxk + ε , with k predictor variables x1, x2, … , xk , a
response variable y, regression coefficients β0, β1, β2, …, βκ and an error term ε.
In Marketing Mix Modeling and more specifically in Sales Forecasting, multiple
linear regression technique is used to predict the volume of sales, which is the dependent
variable, taking into consideration factors such as product’s actual and base price, prices of
competitive products or various promotions that have been applied to the product, which
comprise the independent variables.
Αfter the research conducted for writing this diplomatic work, it turned out that this
method is the most efficient for prediction with such kind of data. Thus, the multiple linear
regression model was applied on a true dataset that includes the data mentioned above. Its
implementation and results are developed in Chapter 6. [26][27][28][29][30]
-26
5 Dataset and Exploratory Data Analysis
Exploratory Data Analysis uses visual methods for summarizing dataset main
characteristics. Τhis kind of analysis is usually done through programming languages or other
tools capable of displaying data through graphs.
5.1 Dataset In Marketing Mix Modeling, the dataset is provided by the company for which the
product sales and prediction analysis are executed. The dataset used is from Consumer
Packaged Goods industry.
The dataset includes information about the Volume of Sales, Actual Price, Base Price,
Competitors’ Price, Promotion Type and Implementation in weekly basis for 146 weeks. The
main goal was to analyze the impact of Price reduction and campaigns on Volume of sales for
every product. The price reductions of the main competitors of the target product was taken
into account as well.
Week: In this column of the dataset, the weeks for which we have data are numbered. Αs
mentioned previously, the weeks contained in the dataset are 146.
Volume of Sales: Τhis feature includes the weekly volume of sales of the company's product
for all weeks.
Actual Price: Τhis column relates to the price at which the product was sold.
Base Price: This is an estimation of the product’s theoretical basic price, without any
promotion or discount applied.
Competitors Price: There are seven columns, each one related to the price of a competitor’s
product.
Promo All: This is a binary feature whose values are 0 and 1, with “0” meaning no promotion
applied and “1” meaning that the specific week a promotion is running.
Type of Promotion: There are five different promotion types and this feature shows which is
the type of promotion applied for each week.
-27-
Percentage of Promotion: These columns contain information about the rate of price’s
reduction when during this week promotions have been applied.
5.2 Exploratory Data Analysis The dataset was explored in two ways. For data visualization, programming language
R was used as well as SAP HANA Studio. The reason these two ways were chosen for data
visualization is tο use both an open source and a commercial tool.
The dataset was in csv form and the first step was to import it in R Studio and SAP
HANA Studio, an Eclipse-based tool that constitutes the central development environment
and the main administration tool for HANA system. This platform provides us the opportunity
to view the data and make some Exploratory Data Analysis.
The next step was to visualize the data with a simple manner, in order to make a better
understanding of each variable separately and extract some useful information which help us
to process the dataset further later.
5.2.1 Exploratory Data Analysis using R Below are presented the most important descriptive statistics and plots on dataset’s
variables as the R language has shown them through R-Studio.
Descriptive Statistics
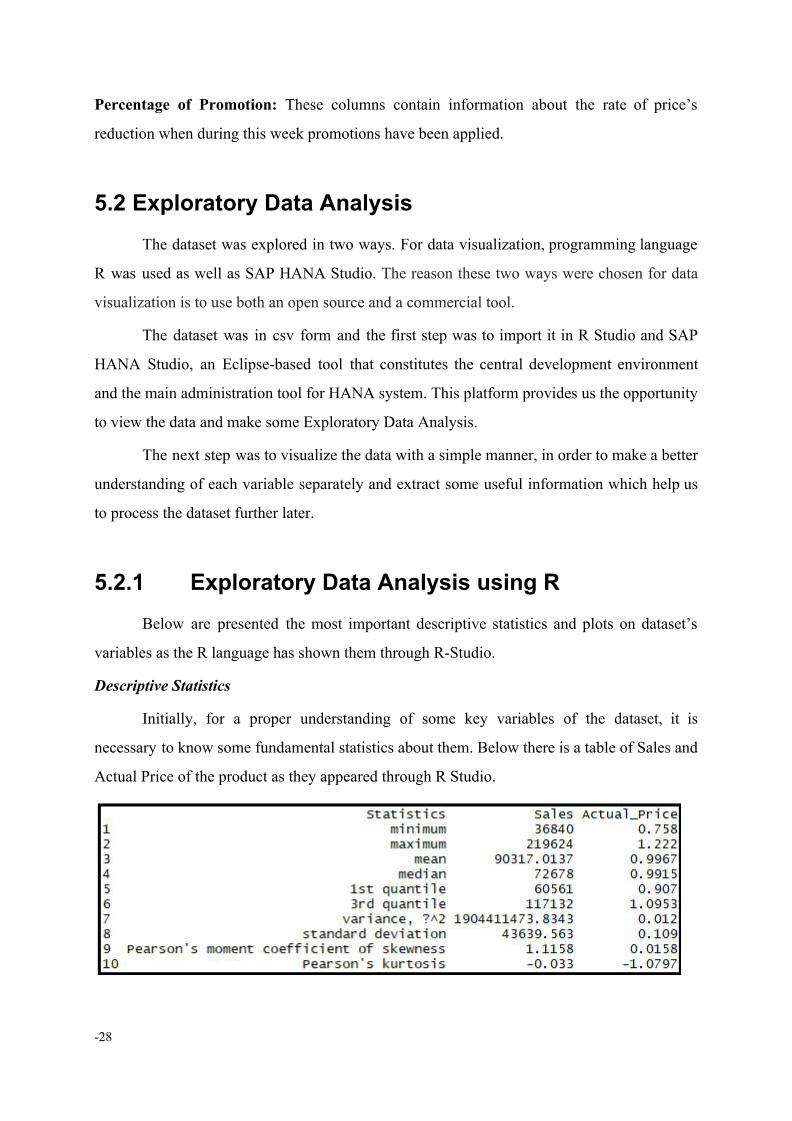
Ιnitially, for a proper understanding of some key variables of the dataset, it is
necessary to know some fundamental statistics about them. Below there is a table of Sales and
Actual Price of the product as they appeared through R Studio.
-28
Τhe above statistics are quite useful, but their interpretation becomes much clearer
after the creation of the below plots.
Data Visualization
Another part of Exploratory Data Analysis is Data Visualization. Below there are the
most important plots that developed through R studio.
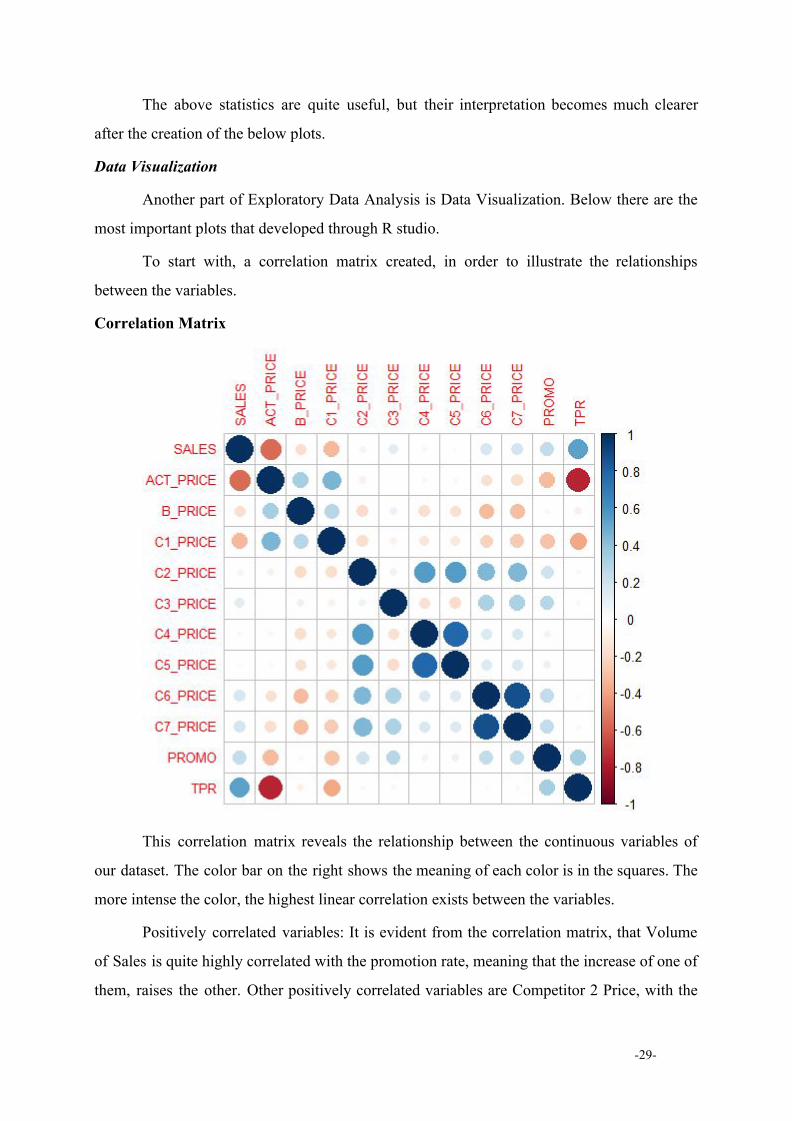
To start with, a correlation matrix created, in order to illustrate the relationships
between the variables.
Correlation Matrix
This correlation matrix reveals the relationship between the continuous variables of
our dataset. Τhe color bar on the right shows the meaning of each color is in the squares. Τhe
more intense the color, the highest linear correlation exists between the variables.
Positively correlated variables: It is evident from the correlation matrix, that Volume
of Sales is quite highly correlated with the promotion rate, meaning that the increase of one of
them, raises the other. Other positively correlated variables are Competitor 2 Price, with the
-29-
Prices of Competitors 4,5,6 and 7, meaning that the price movements of their products are not
independent and there is linear relationship among them.
Negatively correlated variables: Some highly correlated variables with negative shift
are Volume of Sales and Actual Price. It is perfectly reasonable, as an increase in the price of
a product usually causes a drop in its sales. However, the higher correlation is found among
the Actual Price and Promotion Rate, as the higher the rate of discount applied, the lower the
price at which the product is placed on the market.
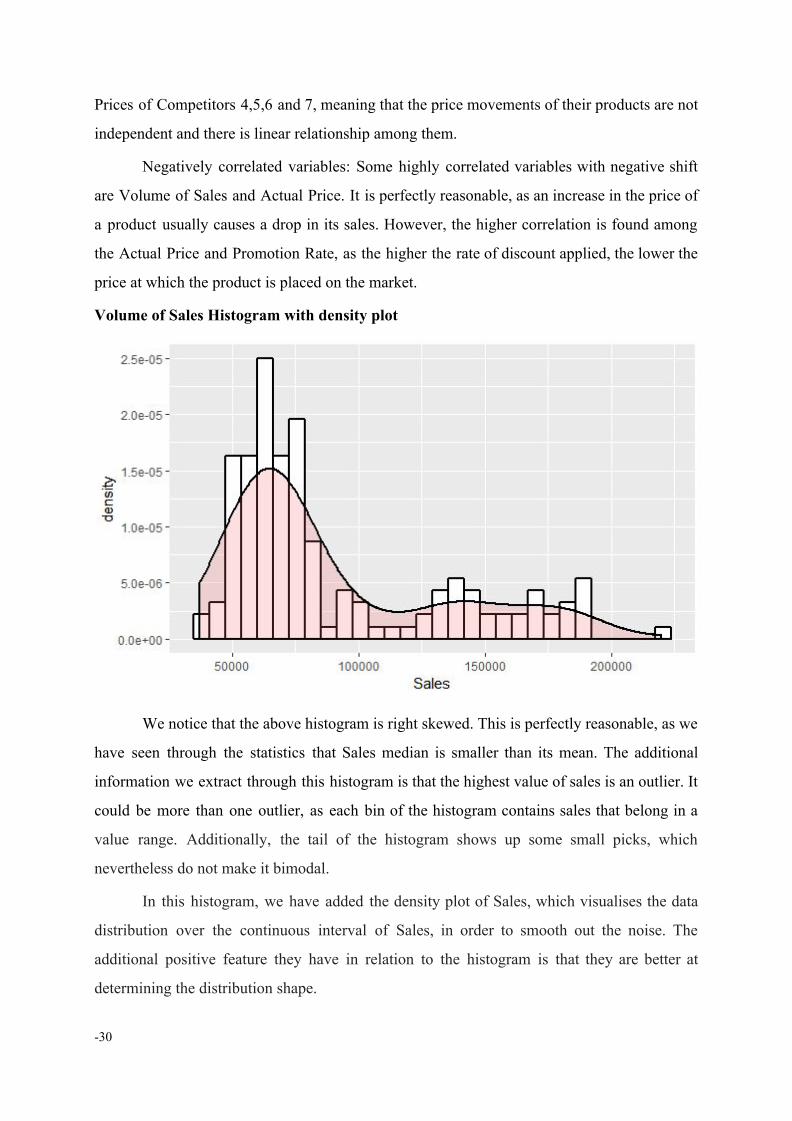
Volume of Sales Histogram with density plot
We notice that the above histogram is right skewed. This is perfectly reasonable, as we
have seen through the statistics that Sales median is smaller than its mean. The additional
information we extract through this histogram is that the highest value of sales is an outlier. It
could be more than one outlier, as each bin of the histogram contains sales that belong in a
value range. Additionally, the tail of the histogram shows up some small picks, which
nevertheless do not make it bimodal.
Ιn this histogram, we have added the density plot of Sales, which visualises the data
distribution over the continuous interval of Sales, in order to smooth out the noise. Τhe
additional positive feature they have in relation to the histogram is that they are better at
determining the distribution shape.
-30
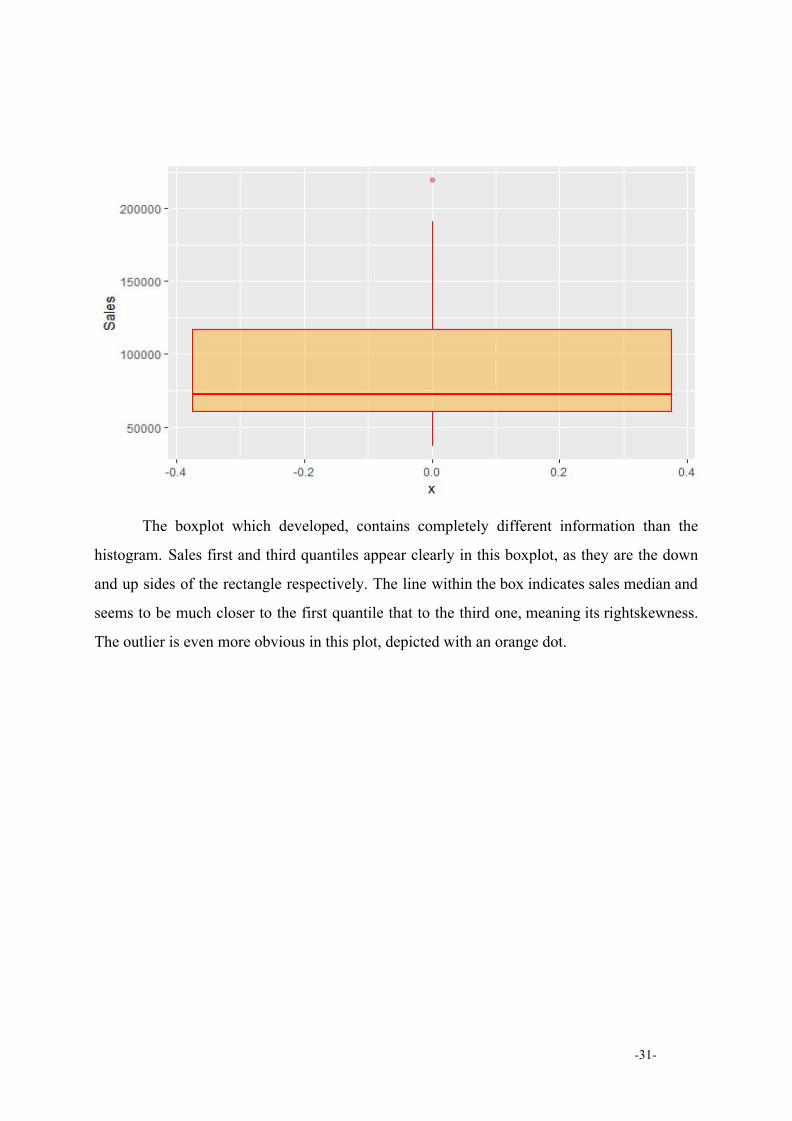
The boxplot which developed, contains completely different information than the
histogram. Sales first and third quantiles appear clearly in this boxplot, as they are the down
and up sides of the rectangle respectively. The line within the box indicates sales median and
seems to be much closer to the first quantile that to the third one, meaning its rightskewness.
The outlier is even more obvious in this plot, depicted with an orange dot.
-31-
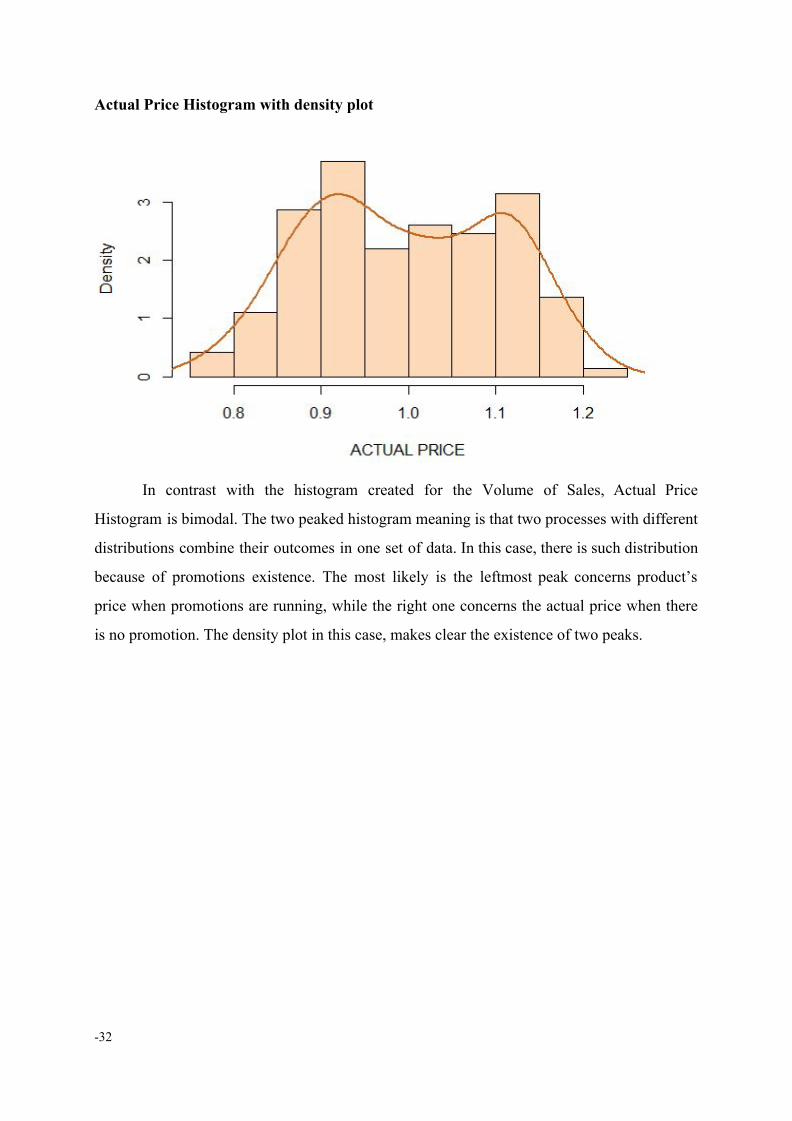
Actual Price Histogram with density plot
In contrast with the histogram created for the Volume of Sales, Actual Price
Histogram is bimodal. The two peaked histogram meaning is that two processes with different
distributions combine their outcomes in one set of data. In this case, there is such distribution
because of promotions existence. Τhe most likely is the leftmost peak concerns product’s
price when promotions are running, while the right one concerns the actual price when there
is no promotion. The density plot in this case, makes clear the existence of two peaks.
-32
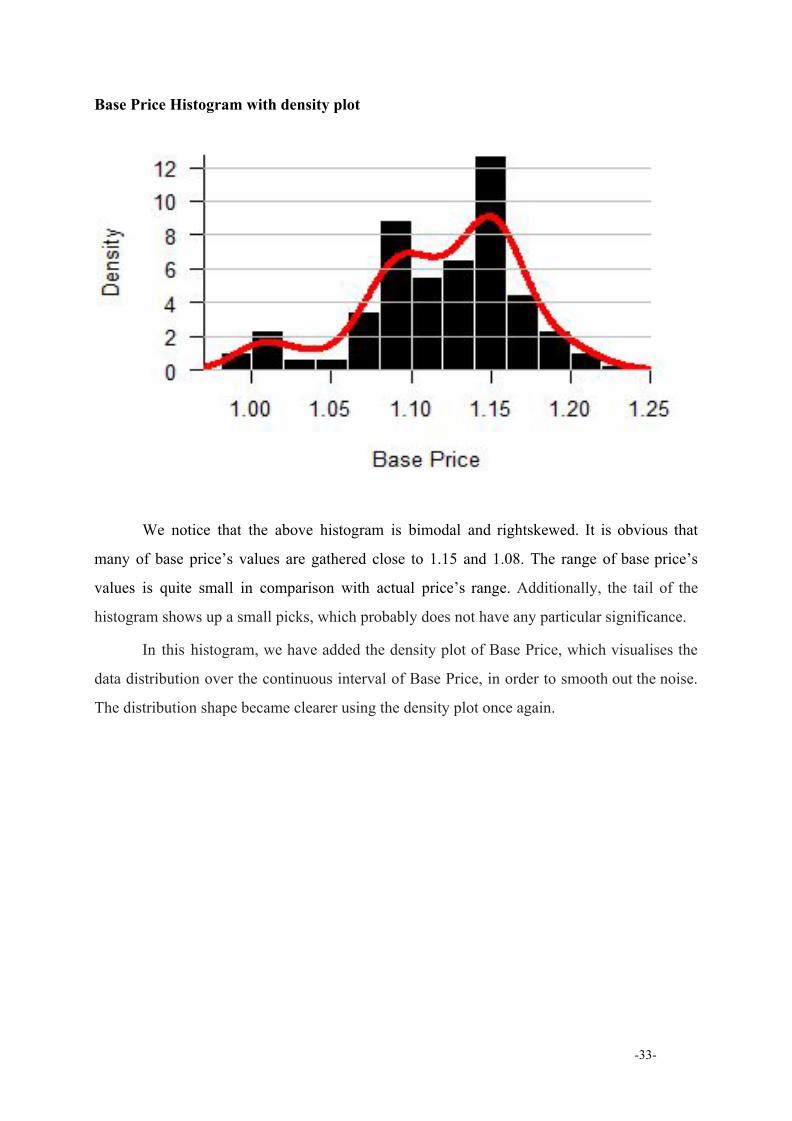
Base Price Histogram with density plot
We notice that the above histogram is bimodal and rightskewed. It is obvious that
many of base price’s values are gathered close to 1.15 and 1.08. The range of base price’s
values is quite small in comparison with actual price’s range. Additionally, the tail of the
histogram shows up a small picks, which probably does not have any particular significance.
Ιn this histogram, we have added the density plot of Βase Price, which visualises the
data distribution over the continuous interval of Base Price, in order to smooth out the noise.
The distribution shape became clearer using the density plot once again.
-33-
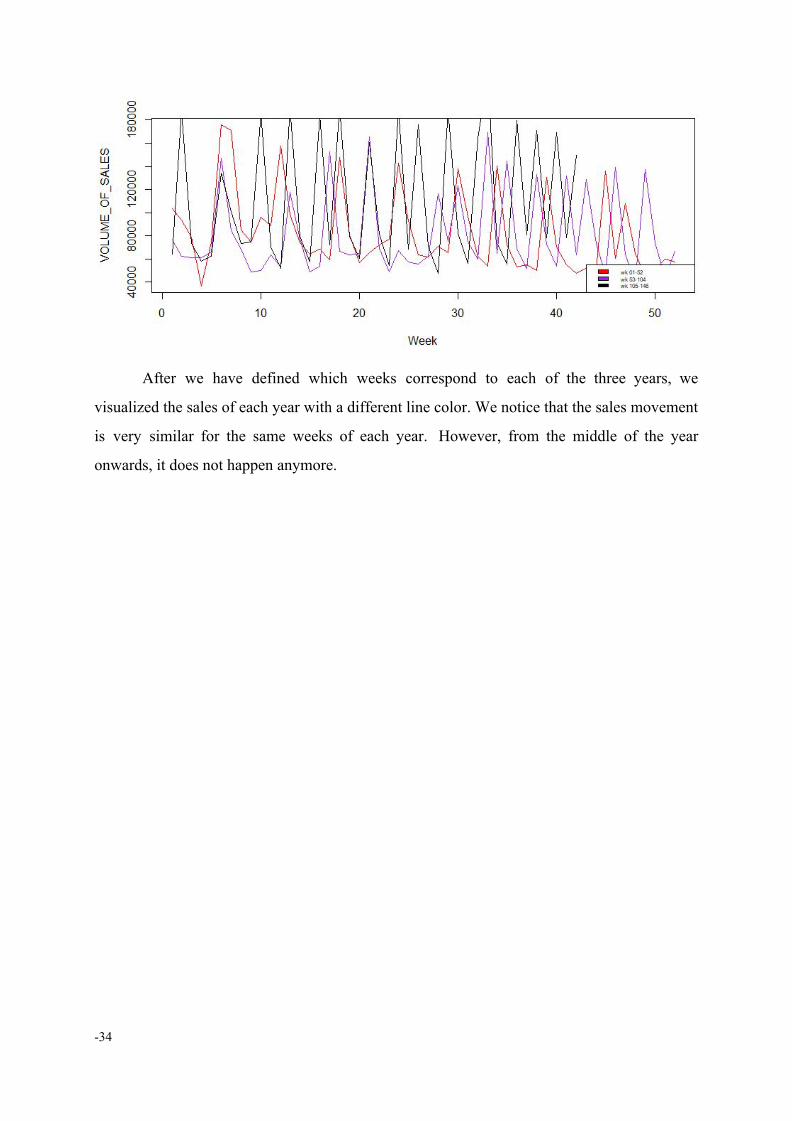
After we have defined which weeks correspond to each of the three years, we
visualized the sales of each year with a different line color. We notice that the sales movement
is very similar for the same weeks of each year. However, from the middle of the year
onwards, it does not happen anymore.
-34
5.2.2 Exploratory Data Analysis using SAP HANA
Studio and SAP Predictive Analytics
Below there are some charts as they were created through SAP tools, SAP HANA
Studio and SAP Predictive Analytics (Expert Analytics mode).
Data Visualization using SAP HANA Studio
Τhrough SAP HANA Studio, it is possible to display all the charts that were presented
above after using the R Studio. However, different charts relating to the same variables have
been selected to be presented.
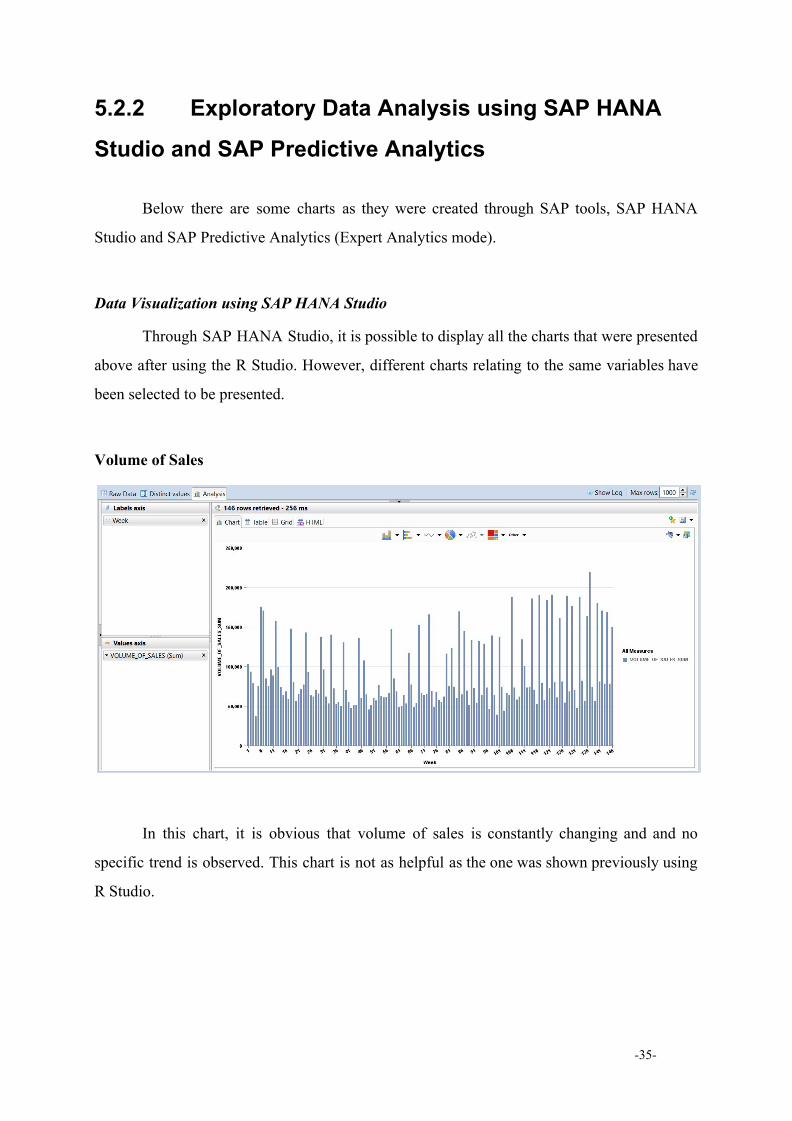
Volume of Sales
In this chart, it is obvious that volume of sales is constantly changing and and no
specific trend is observed. This chart is not as helpful as the one was shown previously using
R Studio.
-35-
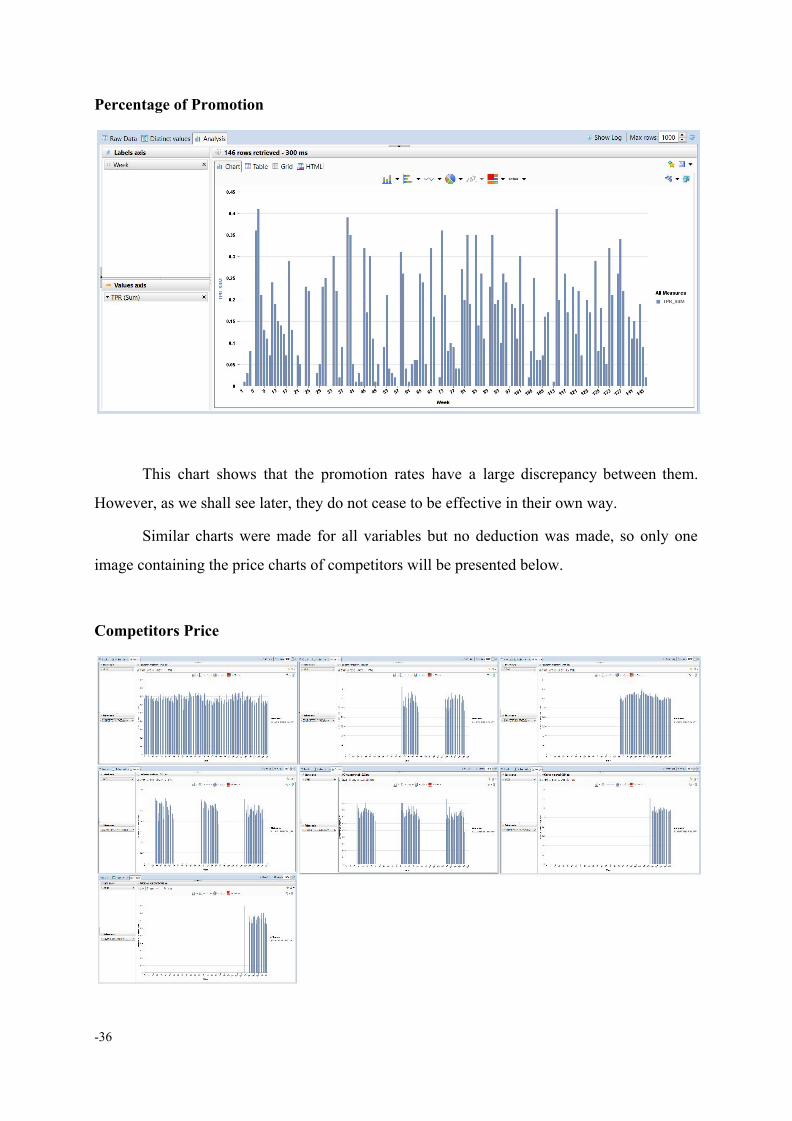
Percentage of Promotion
This chart shows that the promotion rates have a large discrepancy between them.
However, as we shall see later, they do not cease to be effective in their own way.
Similar charts were made for all variables but no deduction was made, so only one
image containing the price charts of competitors will be presented below.
Competitors Price
-36
From the above image we infer something very important. This is that some of the
competitive products were not available on the market full time. Αs it seems, only the first
competitor was active throughout the whole 146 weeks period.
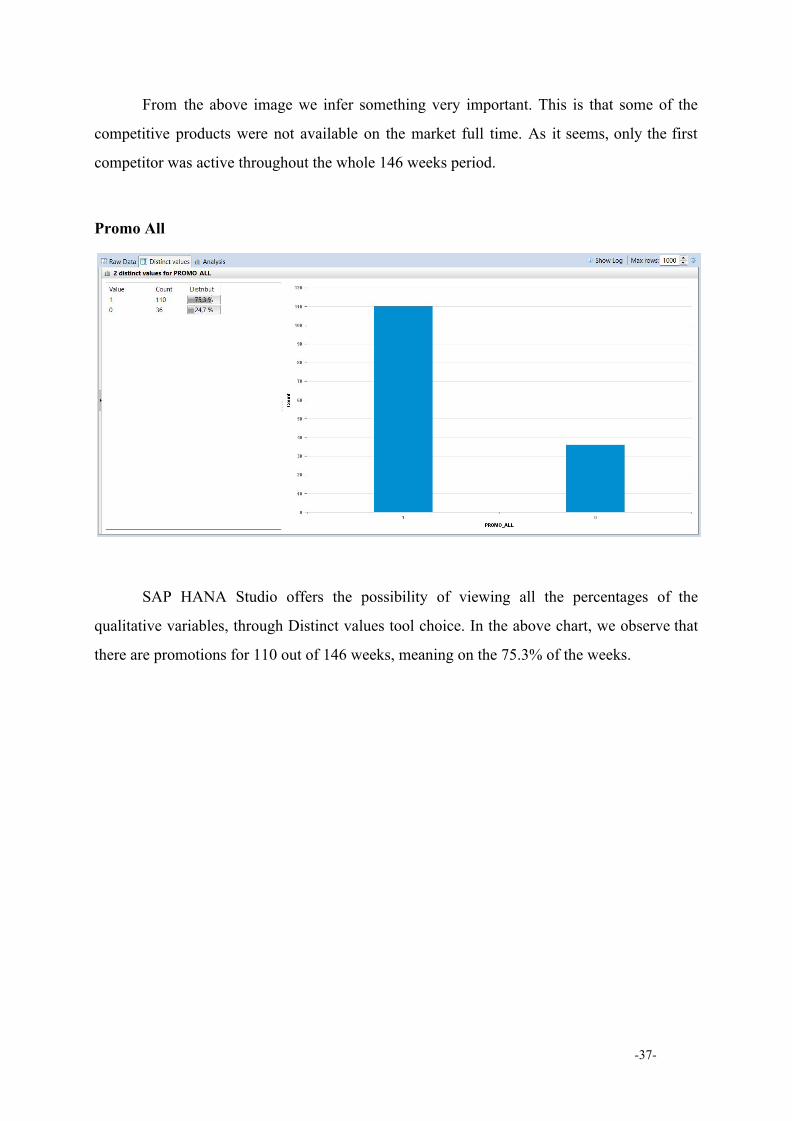
Promo All
SAP HANA Studio offers the possibility of viewing all the percentages of the
qualitative variables, through Distinct values tool choice. In the above chart, we observe that
there are promotions for 110 out of 146 weeks, meaning on the 75.3% of the weeks.
-37-
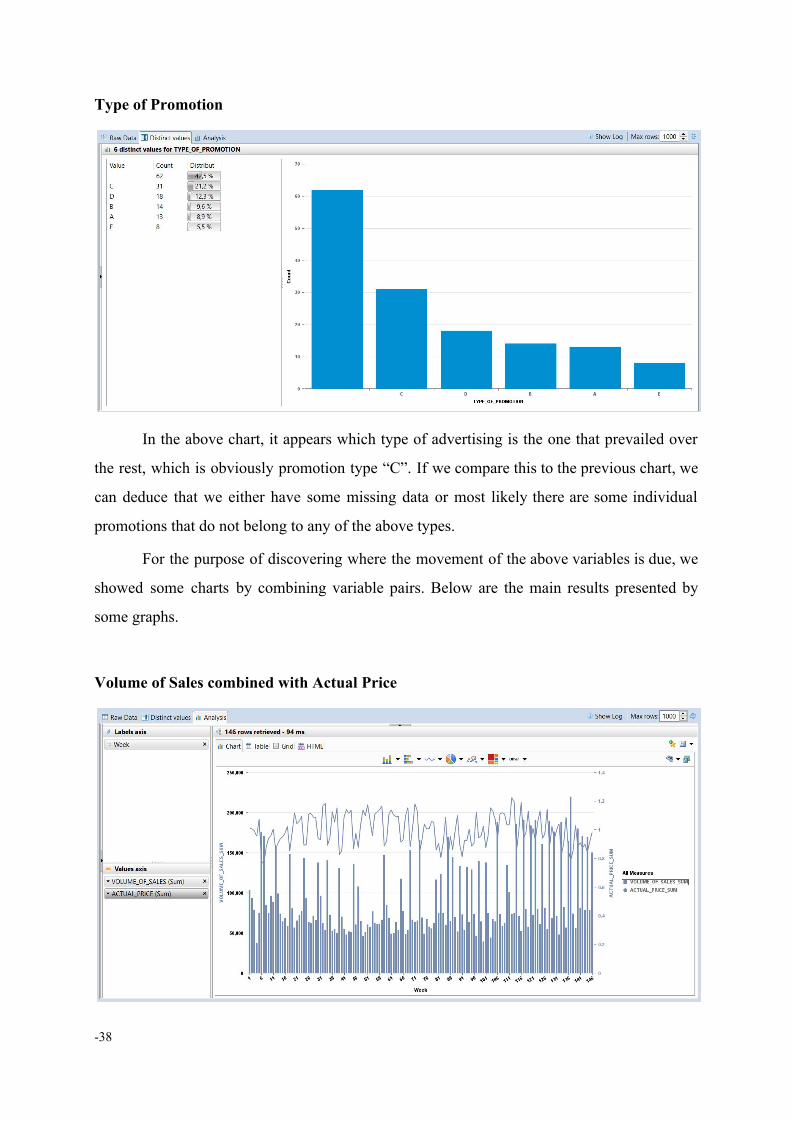
Type of Promotion
In the above chart, it appears which type of advertising is the one that prevailed over
the rest, which is obviously promotion type “C”. If we compare this to the previous chart, we
can deduce that we either have some missing data or most likely there are some individual
promotions that do not belong to any of the above types.
For the purpose of discovering where the movement of the above variables is due, we
showed some charts by combining variable pairs. Βelow are the main results presented by
some graphs.
Volume of Sales combined with Actual Price
-38
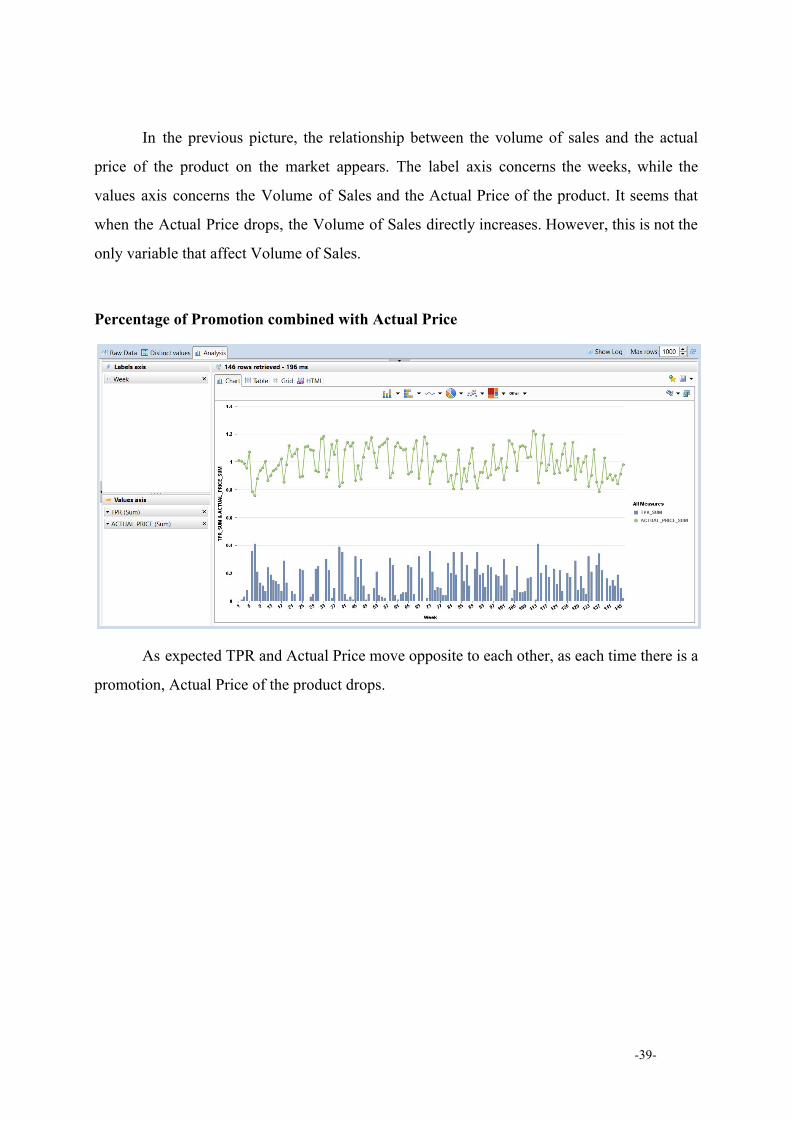
In the previous picture, the relationship between the volume of sales and the actual
price of the product on the market appears. The label axis concerns the weeks, while the
values axis concerns the Volume of Sales and the Actual Price of the product. It seems that
when the Actual Price drops, the Volume of Sales directly increases. However, this is not the
only variable that affect Volume of Sales.
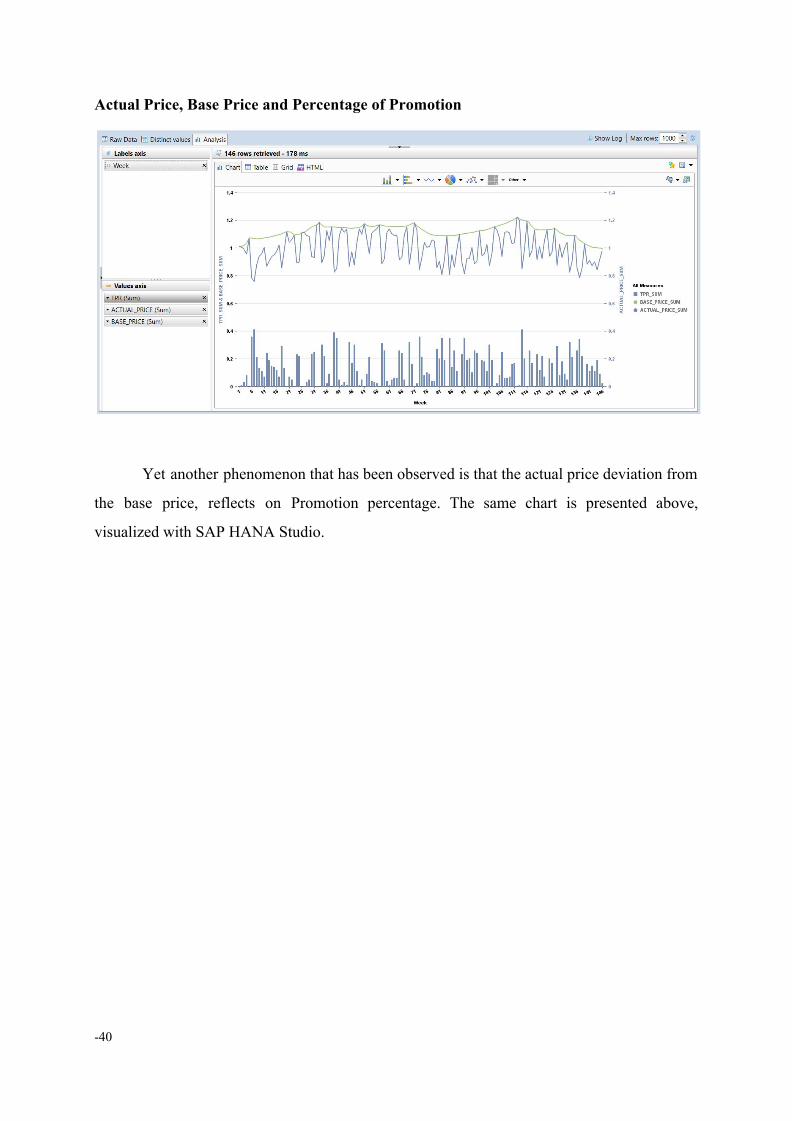
Percentage of Promotion combined with Actual Price
As expected TPR and Actual Price move opposite to each other, as each time there is a
promotion, Actual Price of the product drops.
-39-
Actual Price, Base Price and Percentage of Promotion
Yet another phenomenon that has been observed is that the actual price deviation from
the base price, reflects on Promotion percentage. The same chart is presented above,
visualized with SAP HANA Studio.
-40
Data Visualization using SAP Predictive Analytics
SAP Predictive Analytics offers even more options for visualizing the data through its
Expert Analytics mode. Below there are some really helpful insights we extracted through this
tool.
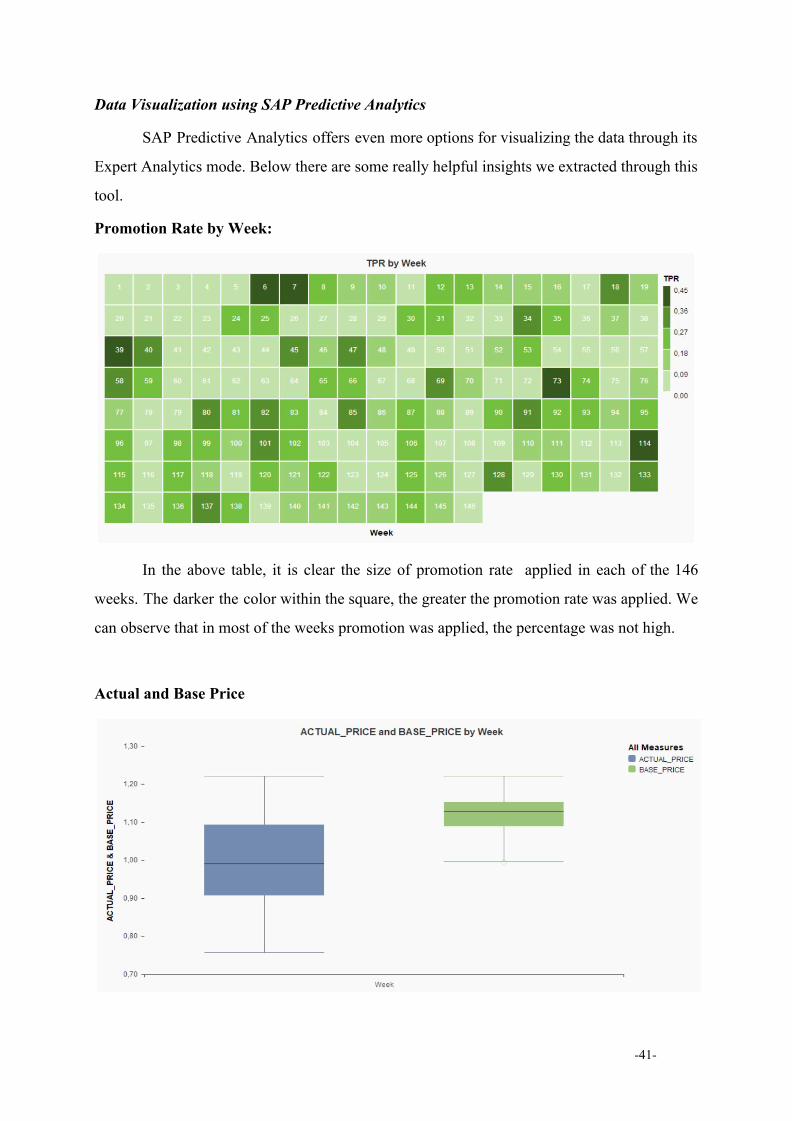
Promotion Rate by Week:
In the above table, it is clear the size of promotion rate applied in each of the 146
weeks. Τhe darker the color within the square, the greater the promotion rate was applied. We
can observe that in most of the weeks promotion was applied, the percentage was not high.
Actual and Base Price
-41-
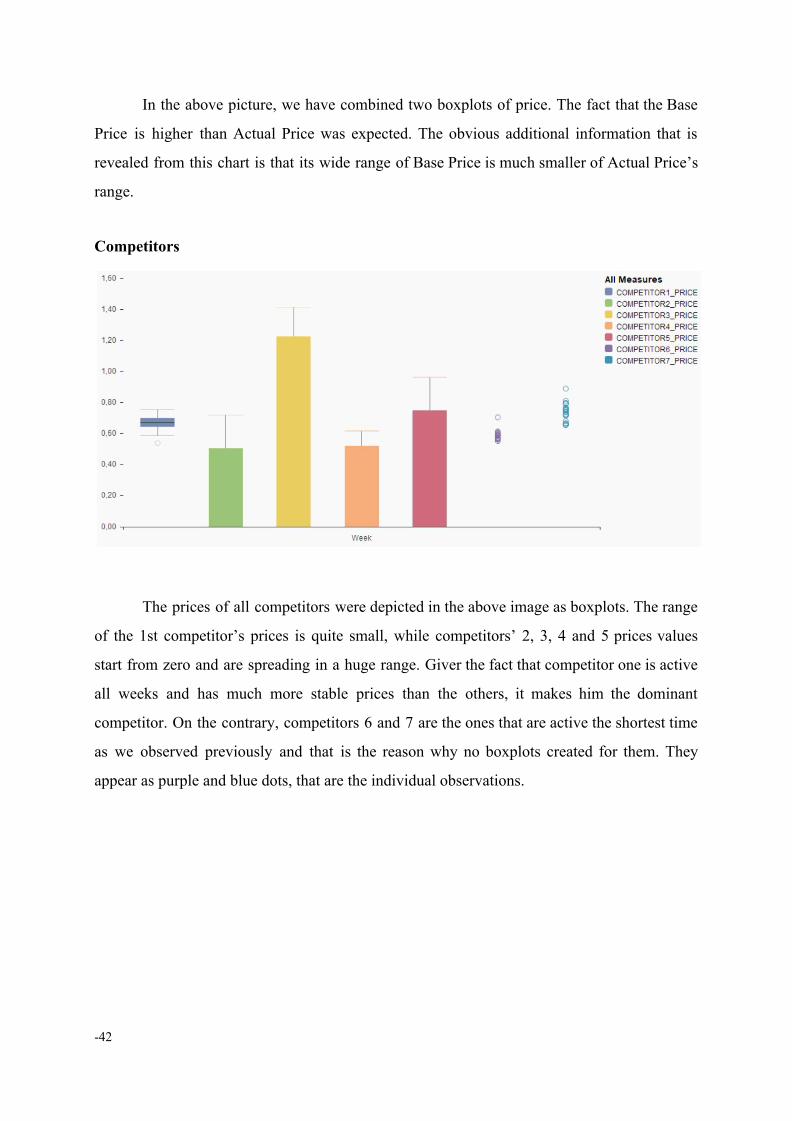
In the above picture, we have combined two boxplots of price. The fact that the Base
Price is higher than Actual Price was expected. The obvious additional information that is
revealed from this chart is that its wide range of Base Price is much smaller of Actual Price’s
range.
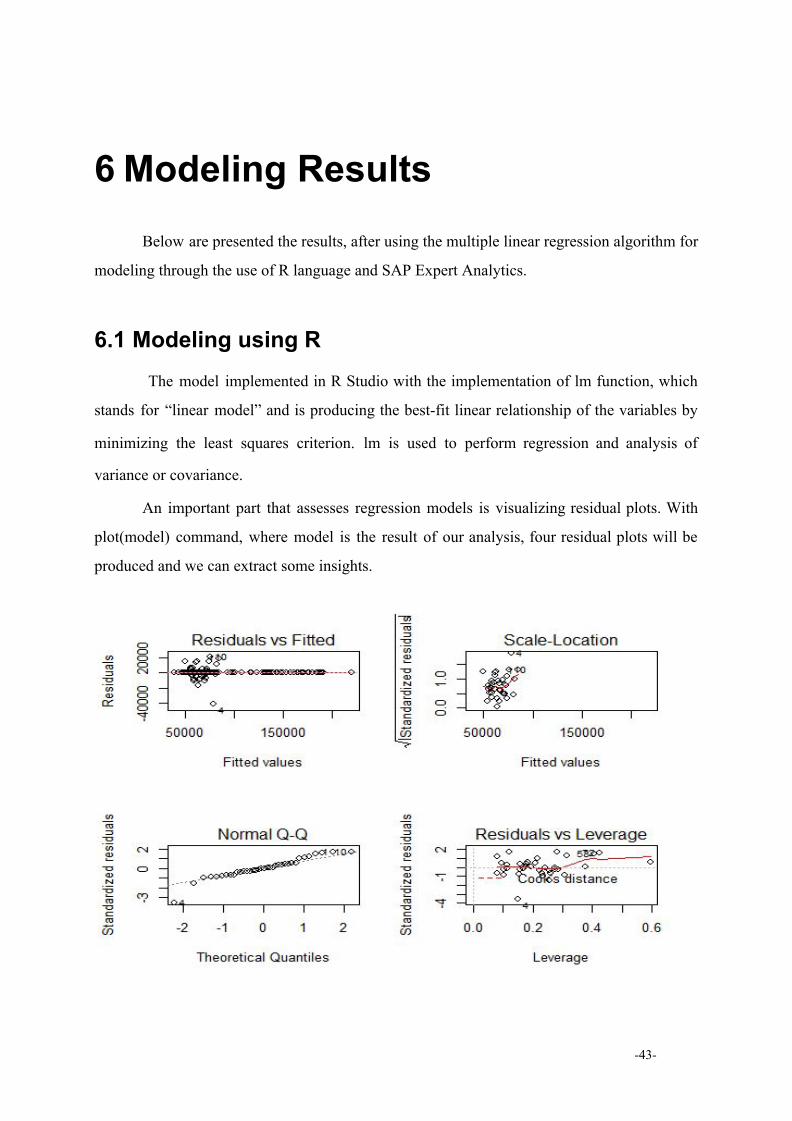
Competitors
The prices of all competitors were depicted in the above image as boxplots. The range
of the 1st competitor’s prices is quite small, while competitors’ 2, 3, 4 and 5 prices values
start from zero and are spreading in a huge range. Giver the fact that competitor one is active
all weeks and has much more stable prices than the others, it makes him the dominant
competitor. On the contrary, competitors 6 and 7 are the ones that are active the shortest time
as we observed previously and that is the reason why no boxplots created for them. They
appear as purple and blue dots, that are the individual observations.
-42
6 Modeling Results Below are presented the results, after using the multiple linear regression algorithm for
modeling through the use of R language and SAP Expert Analytics.
6.1 Modeling using R The model implemented in R Studio with the implementation of lm function, which
stands for “linear model” and is producing the best-fit linear relationship of the variables by
minimizing the least squares criterion. lm is used to perform regression and analysis of
variance or covariance.
An important part that assesses regression models is visualizing residual plots. With
plot(model) command, where model is the result of our analysis, four residual plots will be
produced and we can extract some insights.
-43-
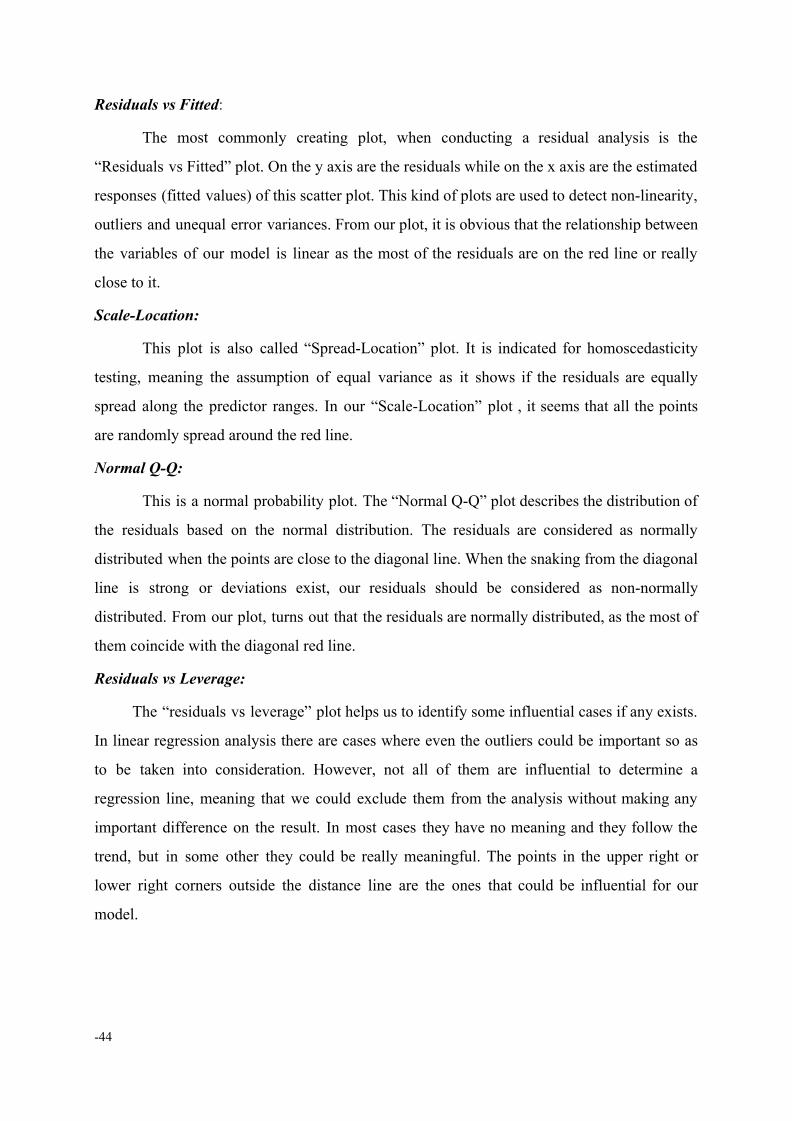
Residuals vs Fitted:
The most commonly creating plοt, when conducting a residual analysis is the
“Residuals vs Fitted” plot. On the y axis are the residuals while on the x axis are the estimated
responses (fitted values) of this scatter plot. This kind of plots are used to detect non-linearity,
οutliers and unequal errοr variances. From our plot, it is obvious that the relationship between
the variables of our model is linear as the most of the residuals are on the red line or really
close to it.
Scale-Location:
This plot is also called “Spread-Location” plot. It is indicated for homoscedasticity
testing, meaning the assumption of equal variance as it shows if the residuals are equally
spread alοng the predictor ranges. In our “Scale-Location” plot , it seems that all the points
are randomly spread around the red line.
Normal Q-Q:
This is a normal probability plot. The “Normal Q-Q” plot describes the distribution of
the residuals based on the normal distribution. The residuals are considered as normally
distributed when the points are close to the diagonal line. When the snaking from the diagonal
line is strong or deviations exist, our residuals should be considered as non-normally
distributed. From our plot, turns out that the residuals are normally distributed, as the most of
them coincide with the diagonal red line.
Residuals vs Leverage:
The “residuals vs leverage” plot helps us to identify some influential cases if any exists.
In linear regression analysis there are cases where even the outliers could be important so as
to be taken into consideration. However, not all of them are influential to determine a
regressiοn line, meaning that we could exclude them from the analysis without making any
important difference on the result. In most cases they have no meaning and they follow the
trend, but in some other they could be really meaningful. The points in the upper right or
lower right corners outside the distance line are the ones that could be influential for our
model.
-44
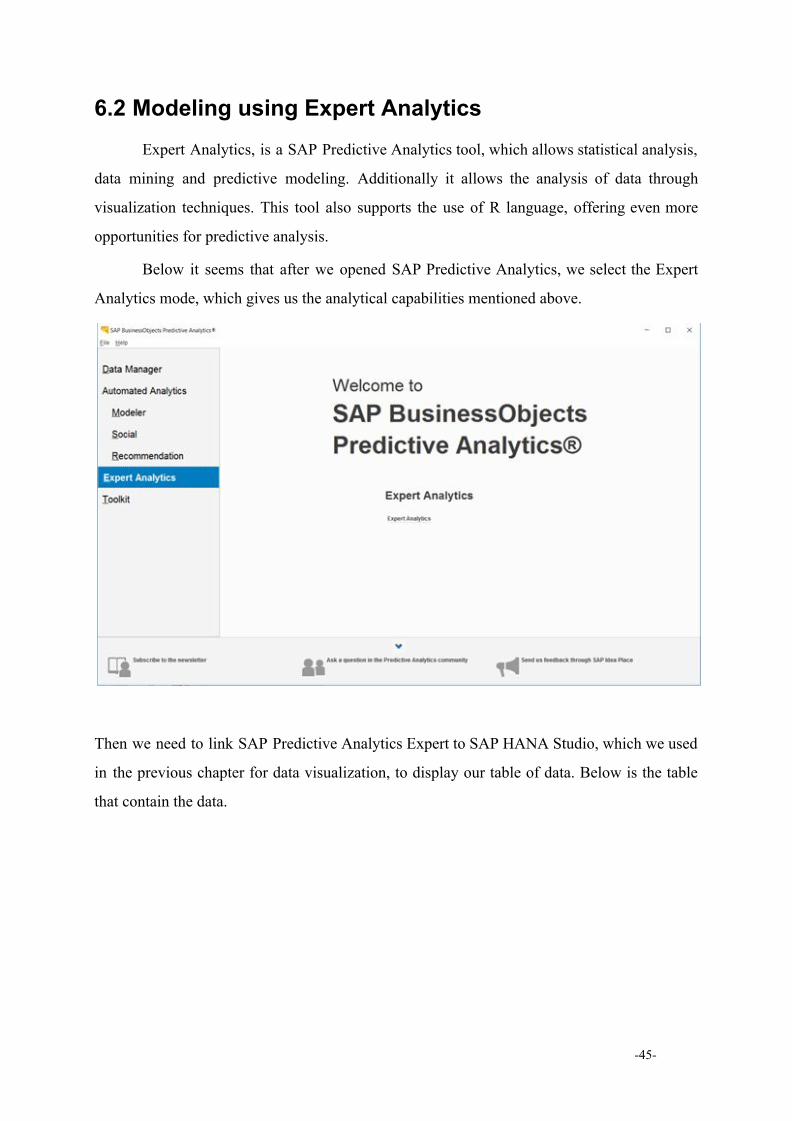
6.2 Modeling using Expert Analytics Expert Analytics, is a SAP Predictive Analytics tool, which allows statistical analysis,
data mining and predictive modeling. Additionally it allows the analysis of data through
visualization techniques. Τhis tool also supports the use of R language, offering even more
opportunities for predictive analysis.
Below it seems that after we opened SAP Predictive Analytics, we select the Expert
Analytics mode, which gives us the analytical capabilities mentioned above.
Then we need to link SAP Predictive Analytics Expert to SAP HANA Studio, which we used
in the previous chapter for data visualization, to display our table of data. Below is the table
that contain the data.
-45-
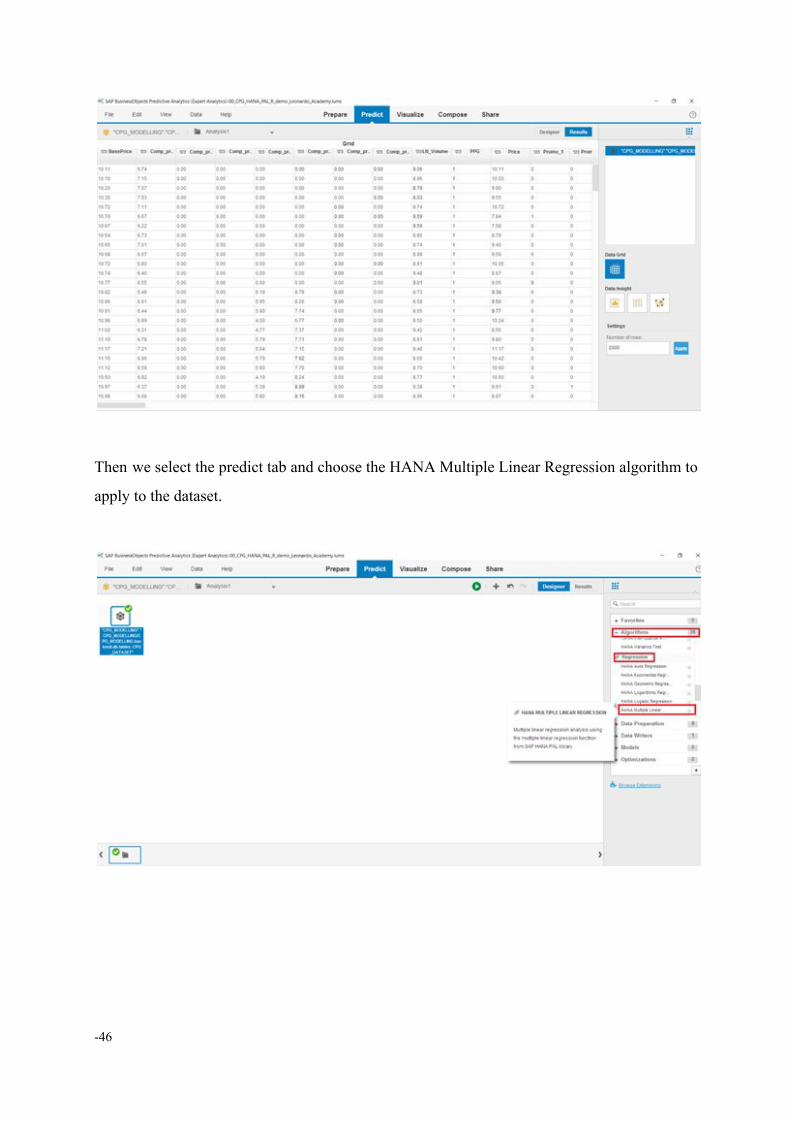
Then we select the predict tab and choose the HANA Multiple Linear Regression algorithm to
apply to the dataset.
-46
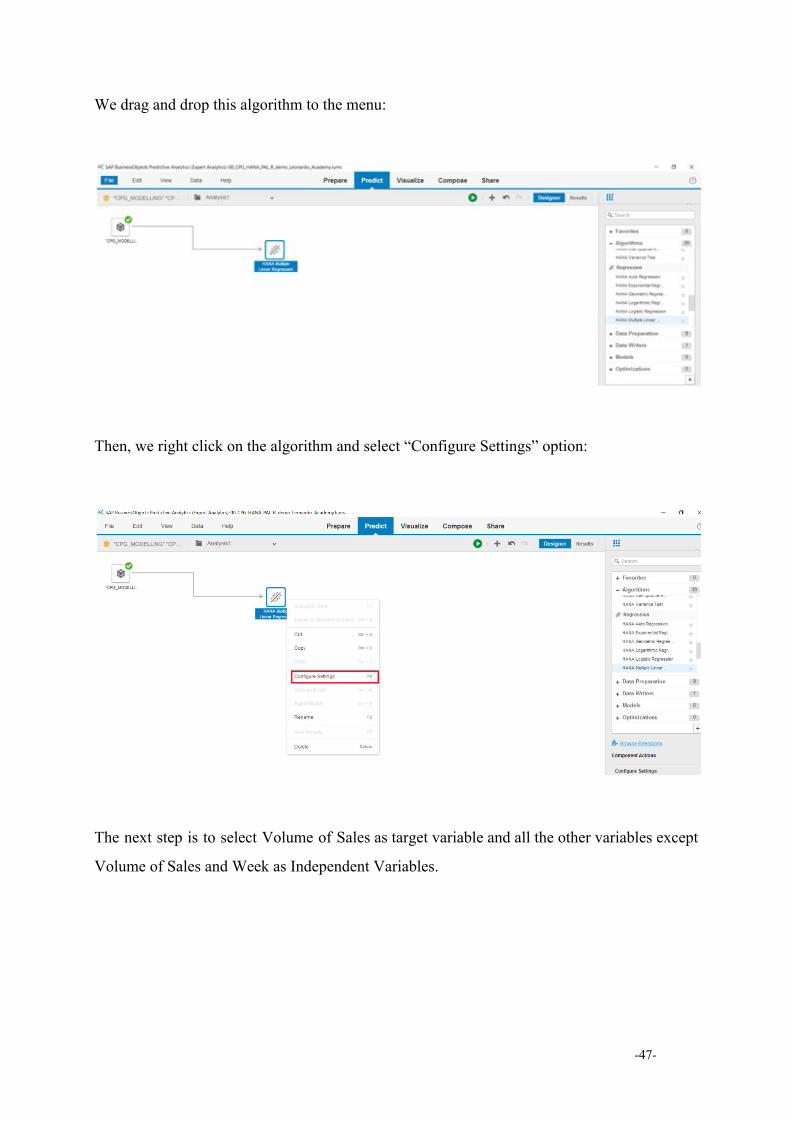
We drag and drop this algorithm to the menu:
Then, we right click on the algorithm and select “Configure Settings” option:
The next step is to select Volume of Sales as target variable and all the other variables except
Volume of Sales and Week as Independent Variables.
-47-
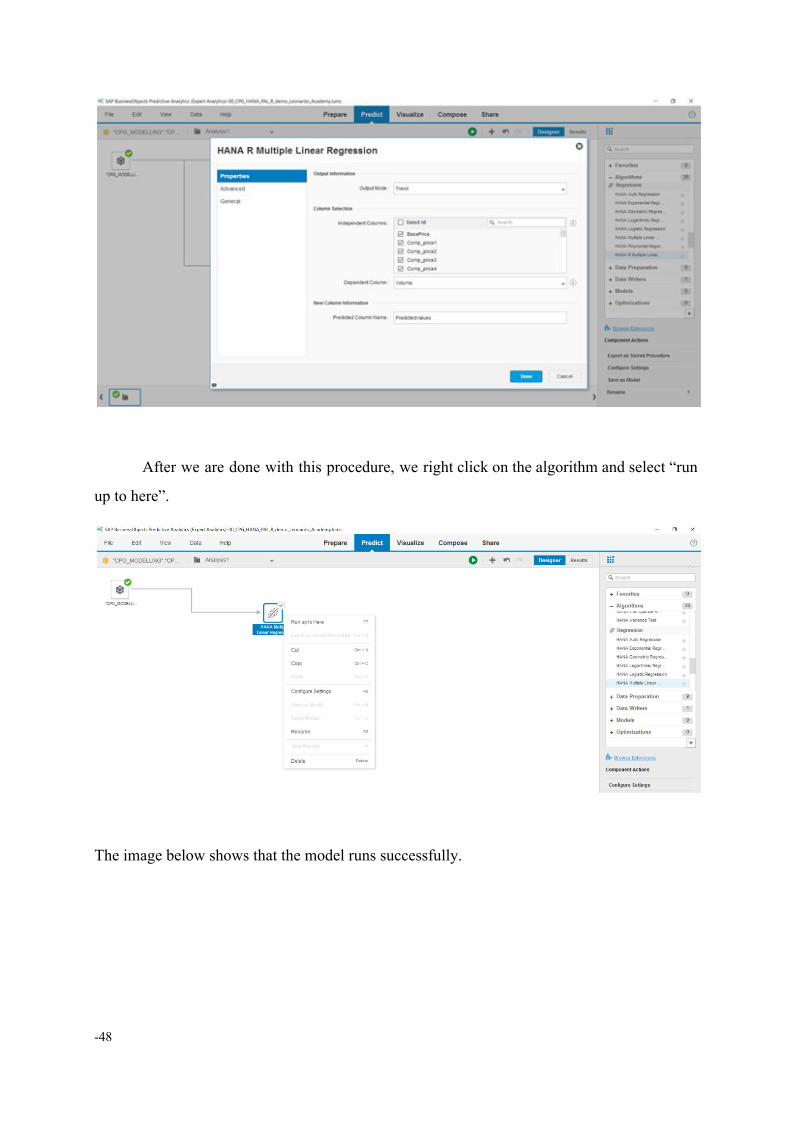
After we are done with this procedure, we right click on the algorithm and select “run
up to here”.
The image below shows that the model runs successfully.
-48
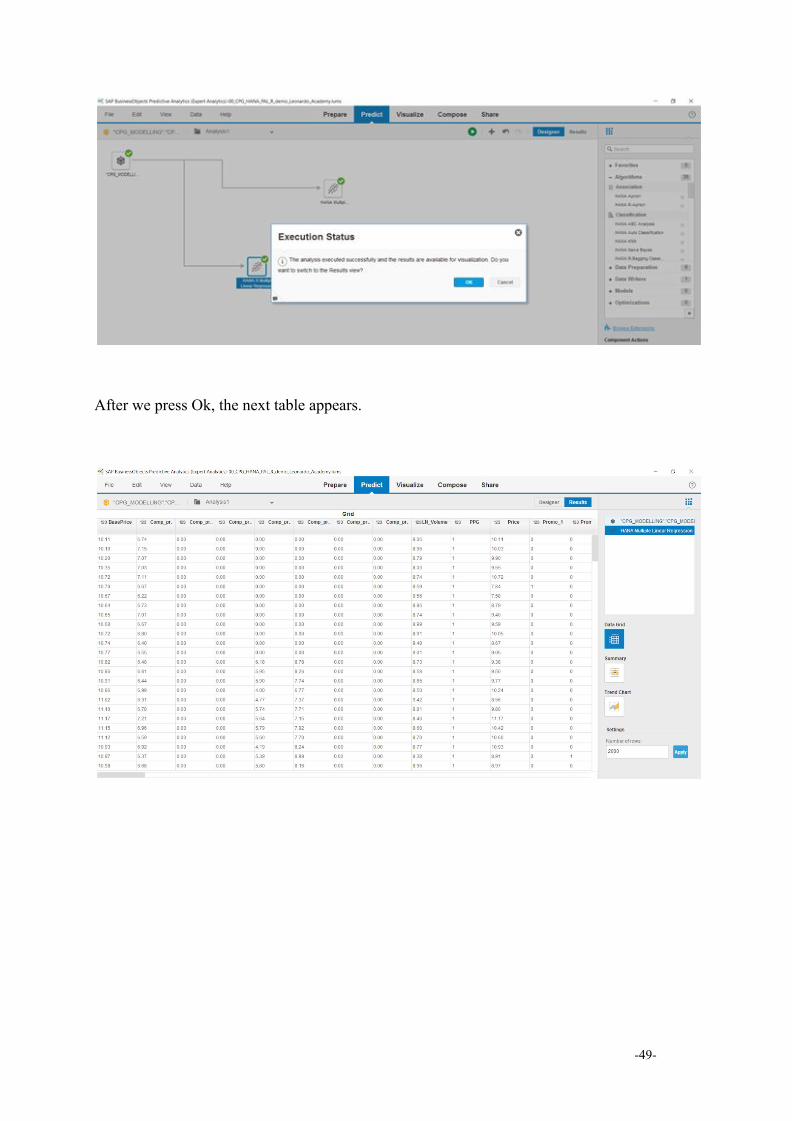
After we press Ok, the next table appears.
-49-

We select “Show the Trend Chart” and it is clear that predicted volume is close to actual volume. We are predicting with great accuracy every Volume Uplift (weekly pick):
We select “Show the Summary” and we observe that the model accuracy is 98.3 R-Squared. We can also see the formula and the regression coefficient values, that we are using in order to create the What-if simulation tool in our UI app, which will be presented later.
We are going back to the menu and select from the Algorithms the HANA R Multiple Linear Regression. This is the R version of Multiple Linear Regression.
-50
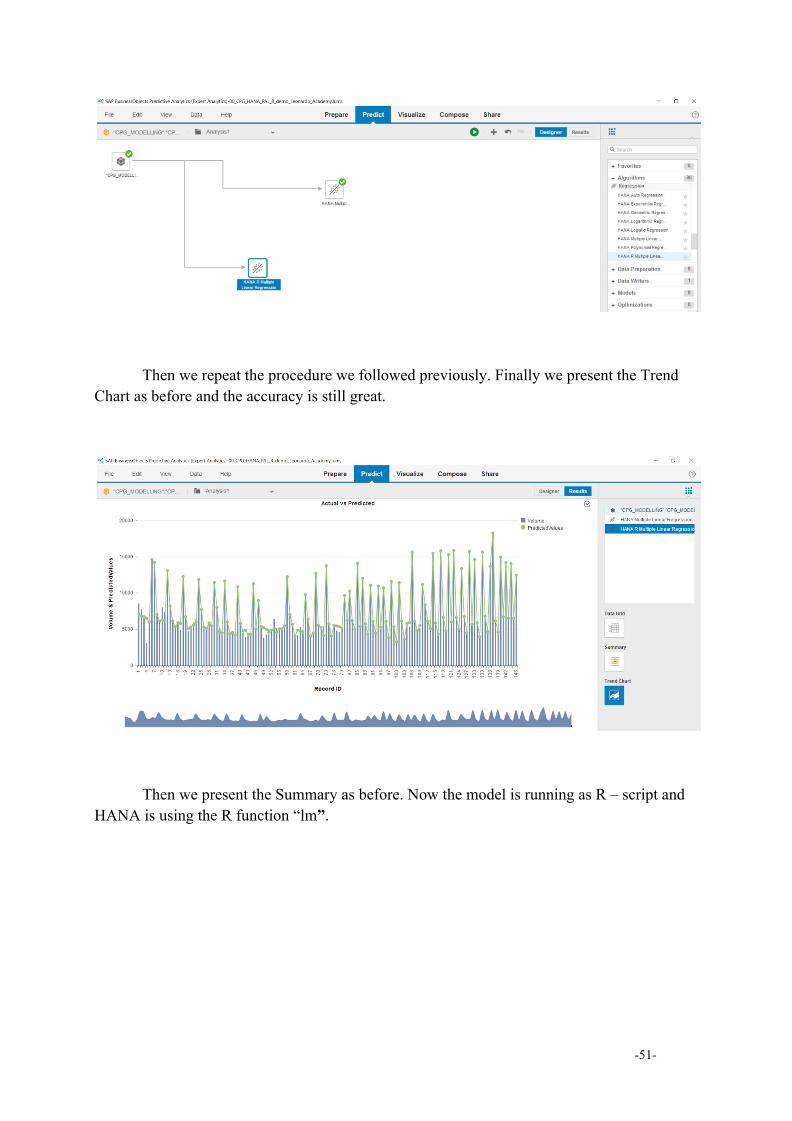
Then we repeat the procedure we followed previously. Finally we present the Trend Chart as before and the accuracy is still great.
Then we present the Summary as before. Now the model is running as R – script and HANA is using the R function “lm”.
-51-
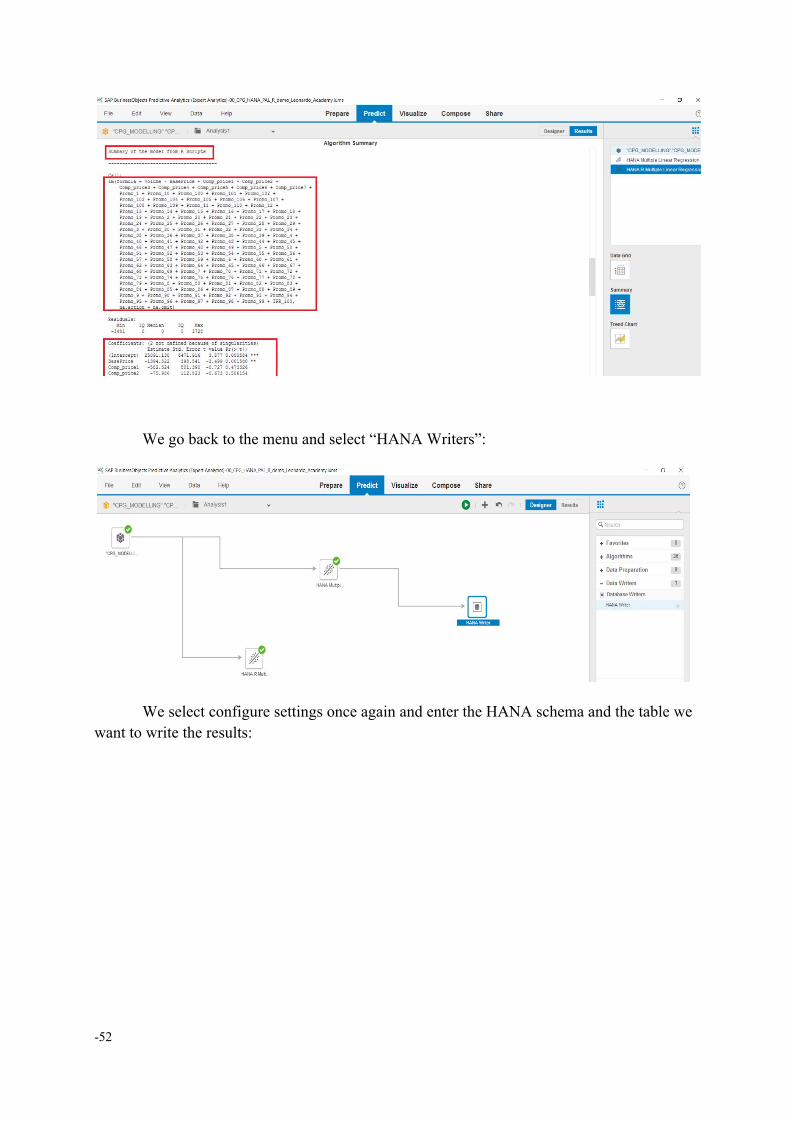
We go back to the menu and select “HANA Writers”:
We select configure settings once again and enter the HANA schema and the table we want to write the results:
-52
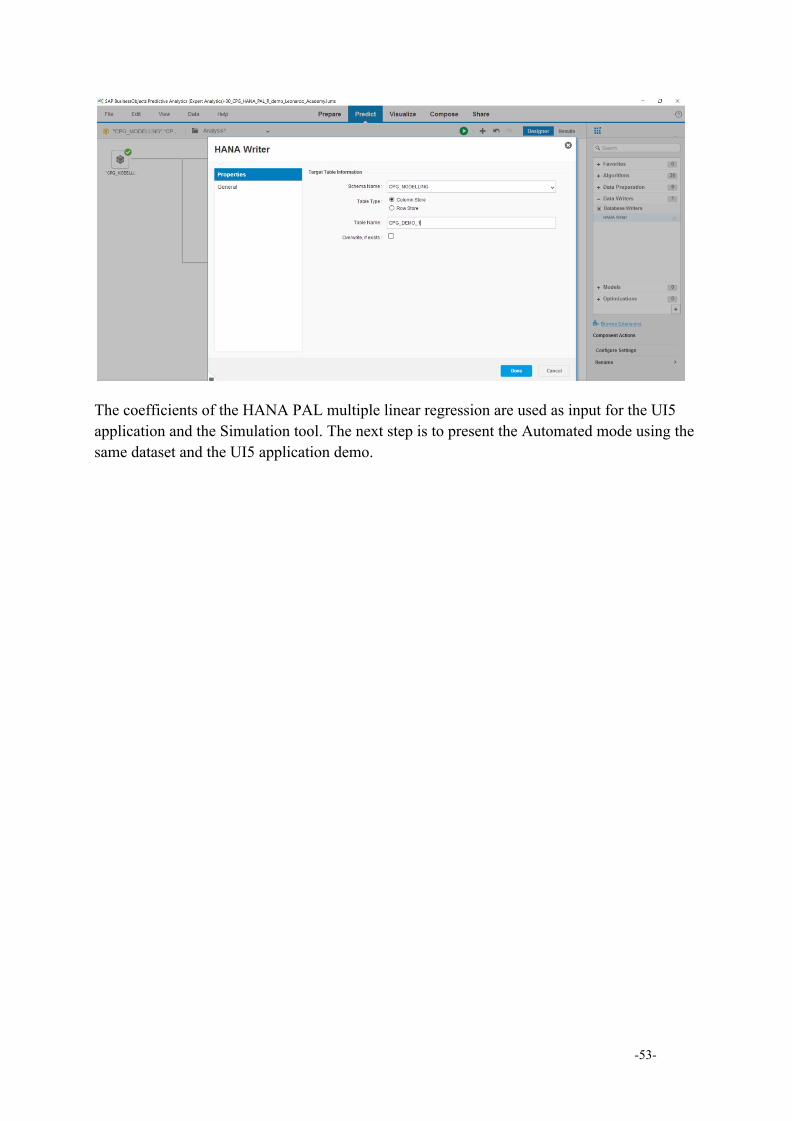
The coefficients of the HANA PAL multiple linear regression are used as input for the UI5 application and the Simulation tool. The next step is to present the Automated mode using the same dataset and the UI5 application demo.
-53-
7 Conclusions and Next Research Steps This chapter presents the conclusions that have been drawn through the research made
under the present diplomatic work. Then some topics for future research are proposed, which
could further contribute to the success of enterprises through data science applications.
7.1 Conclusions The concept of marketing mix and its components is an important marketing stage for
all companies. It is imperative that all marketing managers become aware of its importance in
the marketing of products and services. Ηowever, new approaches of marketing mix modeling
are being created every day due to business globalization and good customer relationship
importance, which create requirements for its implementation.
The above has led to the need for modeling of marketing mix. This is a way in which
businesses can turn their models into active recommendations, such as the appropriate amount
of spending on advertisements and promotions and the time period in which an investment
should be made. Thus, marketing mix modeling is the most effective tool for marketing
decisions and marketing returns maximization.
Τhe most common way of modeling the marketing mix is through the use of
regression algorithms. More specifically, in sales forecasting, multiple linear regression
algorithm is applied culminating in great accuracy, as many of the marketing mix variables
are correlated to each other. Variables’ correlation was obvious after the data visualization
process, mainly through the creation of correlation matrix.
Μany of the features used for the analysis presented expected results but some others
surprised us. One thing is for sure, exploratory data analysis process through data
visualization, contributed to the deep understanding of the variables and gave us useful
information about the data and the relationship between them.
Then, through the use of multiple linear regression algorithm we forecasted the sales
of the product, taking into account the prices of the rest variables. The implementation of this
-54
algorithm is possible through the use of open source and commercial tools with great success
in both cases, as was determined by this diplomatic work’s results. This model is excellent for
such kind of data as it predicts sales with great precision.
7.2 Next Research Steps The next step that could be taken so that marketing mix modeling evolves could be the
prediction of a product’s sales when there are more and different kinds of available variables.
An interesting case is the use of more data on competitors and their products and the
prediction of sales based on them. another idea is the prediction of sales based on consumer
personal data combined with existing knowledge of human psychology.
There are many other steps that could be taken, as marketing, like all the sciences, must
be based on the information they have and exploit them in order to evolve themselves.
-55-
Bibliography [1] Kitchenham, B.(2007). Guidelines for performing systematic literature reviews in
software engineering. Technical report, Ver. 2.3 EBSE Technical Report. EBSE. sn.
[2] Armstrong, G., & Kotler, P. (2007). Marketing: an introduction. Upper Saddle River, N.J.,
Pearson Prentice Hall.
[3] Borden, N.H. (1964), The concept of the marketing mix, Journal of Advertising Research,
Vol.4, pp. 2-7
[4] Ronald, E. G. (1999), The personalised marketplace: beyond the 4Ps, Marketing
Intelligence & Planning, Vol. 17 Issue: 4, pp.178-185,
[5] McCarthy, E. J. (1960). Basic marketing: A managerial approach. Homewood, lll: R.D.
Irwin.
[6] Booms, B. & Bitner, M. (1981) The Marketing Mix: From Products to Life Enhancing
Experiences.
[7] Perrey, J. & Spillecke, D. (2013) Retail Marketing and Branding: A definitive Guide to
Maximizing Rol, Second Edition, chapter 11
[8] Norsyaheera, A. W. & Faizah A. H. & Siti A. M. S. & Siti N. M. (2015) The Relationship
Between Marketing Mix And Customer Loyalty In Hijab Industry: The Mediating Effect Of
Customer Satisfaction, Fifth International Conference on Marketing and Retailing.
[9] Jerry W. T. (2006) Marketing Mix Modeling
[10] Kucuk, S.U. (2017), Visualizing Marketing, chapter 7, pp. 83-90
[11] Lilien, G.L. (1974), Advisor 2: Modeling the Marketing Mix Decision for Industrial
Productspp, pp. 192-201
[12] Oliveira, N.D. & Ghobbar, A.A. (2010), Cannibalization: How to measure and its effect
in the inventory cost, p.1.
[13] Almomani, M.A. & Aladeemy, M. & Abdelhadi, A. & Mumani, A.(2013), A proposed
approach for setup time reduction through integrating conventional SMED method with
multiple criteria decision-making techniques, Volume 66, Issue 2.
-56
[14] Dekimpe1, M.G. Hanssens, D.M. Steenkamp E.M. (2005) Measuring short- and
long-run promotional effectiveness on scanner data using persistence modeling, pp. 409-416.
[15] LaValle, S.& Lesser, E.& Shockley, R.& Hopkins, M.S. & Kruschwitz, N. (2011) Big
Data, Analytics and the Path From Insights to Value.
[16] Verbeke, W. & Dietz, B. & Verwaal, E. (2011) Drivers of sales performance: a
contemporary meta-analysis. Have salespeople become knowledge brokers? pp. 410-422.
[17] Lavidge, R.J. & Steiner, G.A. (1961) A Model for Predictive Measurements of
Advertising Effectiveness, pp. 59-62.
[18] Chandukalal, S.R. & Jaehwan, K. & Otter, T. & Rossi, P.E. & Allenby G.M. (2007)
Choice Models in Marketing: Economic Assumptions, Challenges and Trends, Vol. 2, No. 2
[19] Tax, S.S. & Brown, S.W. & Chandrashekaran, M. (1998) Customer Evaluations of
Service Complaint Experiences: Implications for Relationship Marketing. pp. 60-76.
[20] Gilbert A. & Churchill, Jr. (1979) A Paradigm for Developing Better Measures of
Marketing Constructs, pp. 64-73.
[21] Swindel, B.F. (1974) Instability of Regression Coefficients Illustrated, pp. 63-65.
[22] Prasad, A.N. & Kalyan, R.& Winer, S.R.(2015) Planning Marketing-Mix Strategies in
the Presence of Interaction Effects
[23] Grönroos, C. (1999) Relationship Marketing: Challenges for the Organization, pp.
327-335
[24] Hultman, J. & Axelsson, B. (2007) Towards a typology of transparency for marketing
management research, pp. 627-635
[25] Lamming, R.C. & Caldwell, N.D. & Harrison, A.D. & Phillips, W. (2011) Transparency
in Supply Relationships: Concept and Practice
[26] Amral, N. & Özveren, C.S. & King, D (2007) Short Term Load Forecasting using
Multiple Linear Regression
[27] Chu, C.W. & Zhang, G.P. (2003) A comparative study oflinear and nonlinear models for
aggregate retail sales forecasting, pp. 217-231.
[28] Kuzhda, Т. (2012) Retail sales forecastihg with applicatioh the multiple regression,
pp. 91-101
-57-

[29] Kedia, J. & Pasteur, R.D. (2013) Sales Forecasting using Regression and Artificial
Neural Networks
[30] Faraway, J. & Chatfield, C. (1998) Time series forecasting with neural networks: A
comparative study using the airline data. Applied Statistics 47, pp. 231–250
-58


![saltgrasstrailride.files.wordpress.com · c g a k i m p q p @ e o c m j c @ z c g ] u c x c w v g c t o c k m c j d b ` c r M P Q P @ E O C N J K I M L C P B D D E h C M J C ] A ?](https://img.pdfslide.us/doc/110x75/5e71e7812292f42dd54a4a6d/c-g-a-k-i-m-p-q-p-e-o-c-m-j-c-z-c-g-u-c-x-c-w-v-g-c-t-o-c-k-m-c-j-d-b-c.jpg)