Embed Size (px)
Citation preview

Molecular Docking of
Naphthyl Hydroxamic Acids With DNA
C
H
A
P
T
E
R
V

This chapter deals with the molecular docking of
N-arylhydroxamic acids with DNA. Hex and Argus Lab docking
softwares were used for molecular docking. Both flexible and rigid
docking were performed. Ascore method from Argus Lab and E value
from Hex were employed to obtain binding energies.
MOLECULAR DOCKING OF
NAPHTHYL HYDROXAMIC ACIDS
WITH DNA
CHAPTER V
S
U
M
M
A
R
Y

108
Molecular Docking of Naphthyl Hydroxamic Acids with DNA
MOLECULAR DOCKING OF
NAPHTHYL HYDROXAMIC ACIDS WITH DNA
Prediction of the structure and binding free energy of a ligand receptor complex from
structures of the free ligand and receptor only is known as molecular docking.
It is the computational simulation of a candidate ligand binding to a receptor. Receptor is
the large-sized receiving molecule, generally protein, DNA or some other biopolymer.
Ligand is the small-sized molecule binding to the receptor due to structural
complementarity. The three dimensional structure of a potential ligand (drug) is
superimposed on the receptor target site to predict structure of the intermolecular
complexes thus formed. The regions of the receptor involved in complexation are known
as binding sites. Binding may occur in various possible conformations known as binding
modes. It also predicts the strength of the binding and the binding affinity between ligand
and receptor using scoring functions.
TYPES OF DOCKING
(i) Rigid Docking
The internal geometry of the receptor and ligand is kept fixed during docking. It is
also known as Lock and Key type of docking.
(ii) Flexible Docking
An enumeration on the rotations of ligands is performed. The surface cell
occupancy and energy is calculated for every rotation and the optimum pose is
selected. It is also known as induced fit type of docking.

109
Molecular Docking of Naphthyl Hydroxamic Acids with DNA
STEPS IN MOLECULAR DOCKING
(i) Building the Receptor
The 3D structure of the receptor can be downloaded from Protein Data Bank
(PDB). The receptor is then processed and water molecules are removed. The
receptor should be biologically stable.
(ii) Identification of the Active Site
The region of the receptor where the ligand has to bind, i.e., the active site should
be identified.
(iii) Ligand Preparation
Ligands can be obtained from the available databases, viz., ZINC, PubChem, etc. It
can be sketched using tools such as Chemsketch or Chemdraw or Marvine
softwares. The ligand should be selected on the basis of the Lipinsky’s rule of 5.
(iv) Docking
The ligand is finally docked with the receptor and the interactions are checked. The
scoring function generates score. The best pose for the ligand with the highest
binding affinity is selected.
DIFFERENT TYPES OF INTERACTIONS
The interactions between ligands and receptors are primarily the consequence of forces
acting between them.
These forces can be of four types:
(i) Electrostatic Forces
These forces originate due to the charges present in the ligand and receptor. They
include charge-charge, charge-dipole and dipole-dipole interactions.
110
Molecular Docking of Naphthyl Hydroxamic Acids with DNA
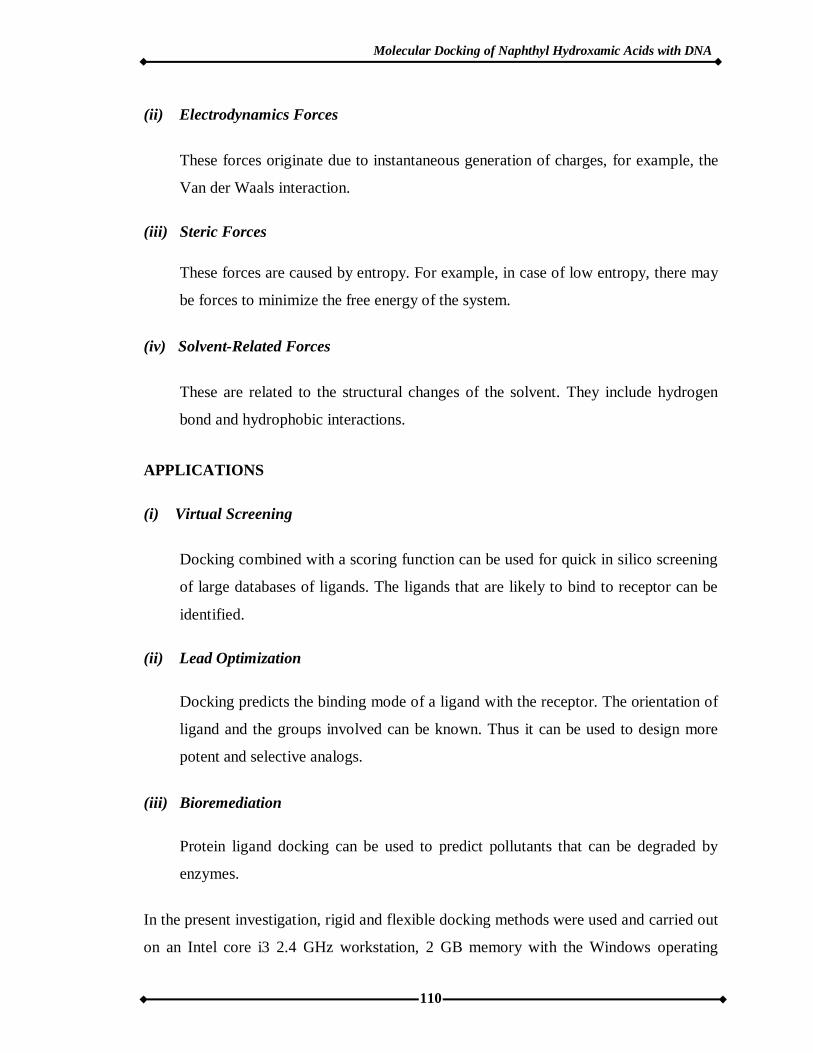
(ii) Electrodynamics Forces
These forces originate due to instantaneous generation of charges, for example, the
Van der Waals interaction.
(iii) Steric Forces
These forces are caused by entropy. For example, in case of low entropy, there may
be forces to minimize the free energy of the system.
(iv) Solvent-Related Forces
These are related to the structural changes of the solvent. They include hydrogen
bond and hydrophobic interactions.
APPLICATIONS
(i) Virtual Screening
Docking combined with a scoring function can be used for quick in silico screening
of large databases of ligands. The ligands that are likely to bind to receptor can be
identified.
(ii) Lead Optimization
Docking predicts the binding mode of a ligand with the receptor. The orientation of
ligand and the groups involved can be known. Thus it can be used to design more
potent and selective analogs.
(iii) Bioremediation
Protein ligand docking can be used to predict pollutants that can be degraded by
enzymes.
In the present investigation, rigid and flexible docking methods were used and carried out
on an Intel core i3 2.4 GHz workstation, 2 GB memory with the Windows operating

111
Molecular Docking of Naphthyl Hydroxamic Acids with DNA
system with Argus Lab software. The ligand was drawn in Marvine and converted into
PDB format. The DNA duplex receptor structure was obtained from Protein Data Bank
(PDB No. 1R2L) with 12 base pairs with sequence CCATAATTTACC:
CCTATGAAATCC running in 3′-5′ directions (172). Water molecules were removed
and hydrogen atoms were added to the structure. In docking calculation, Ascore method
from Argus Lab and E value from Hex were employed to obtain binding energies.
Docking based on quantum mechanics was performed on simulation with rigid and
flexible ligand.
(I) DOCKING OF HYDROXAMIC ACIDS WITH DNA BY HEX SOFTWARE
The Hex software is based on Laguiere - Gaussian polynomial order to calculate
translation correlation. Hex 8.0.0 software was used for rigid ligand docking. The ligand
and receptor are superposed through 3D shapes only (173). Docking is performed by
scoring the degree of overlap between pair of grids in 3D. Usually 3D grid based on Fast
Fourier Transform (FFT) correlation algorithm and free grid Spherical Polar Fourier
(SPF) approach, that allow rotational rather than translation correlation are used (174).
The following parameters were used in Hex docking,
Correlation = Shape
FFT = 3D fast filter
Grid = 0.6
Receptor and Ligand range = 180
Distance range = 40
Number of clusters = 200
The result obtained revealed that from Hex docking all hydroxamic acids interact with
DNA through groove binding.
Binding affinities are presented in Table 5.1 as E value.
The best poses obtained by hydroxamic acids upon binding with DNA are shown in
Figures 5.1 to 5.5.

112
Molecular Docking of Naphthyl Hydroxamic Acids with DNA
DNA- HYDROXAMIC ACID COMPLEX
ENERGY ( kJ/mol)
N-1-naphthyl-2-methylbenzo- -231.68
N-1-naphthyl-4-methylbenzo- -233.46
N-1-naphthyl-2-ethoxybenzo- -240.38
N-1-naphthyl phenylaceto- -258.40
N-1-naphthyl valero- -214.52
Table 5.1
Binding free energy of DNA-hydroxamic acid complexes obtained through Hex
8.0.0 software.

113
Molecular Docking of Naphthyl Hydroxamic Acids with DNA
Figure 5.1: N-1-naphthyl-2-methylbenzohydroxamic acid
Figure 5.2: N-1-naphthyl-4-methylbenzohydroxamic acid
Figure 5.3 : N-1-naphthyl-2-ethoxybenzohydroxamic acid
DOCKING OF HYDROXAMIC ACIDS WITH DNA BY HEX SOFTWARE

114
Molecular Docking of Naphthyl Hydroxamic Acids with DNA
Figure 5.4 : N-1-naphthyl phenylacetohydroxamic acid
Figure 5.5 : N-1-naphthyl valerohydroxamic acid
DOCKING OF HYDROXAMIC ACIDS WITH DNA BY HEX SOFTWARE

115
Molecular Docking of Naphthyl Hydroxamic Acids with DNA
(II) DOCKING BY ARGUS LAB SOFTWARE
(i) Flexible Docking of Hydroxamic Acids With DNA
Argus Lab docking programe was performed on simultion with flexible ligand docking
and based on quantum mechanics. A spacing of 0.4 Å between the grid point was used,
with docking accuracury ̴ 3Å as root mean of square distance (RMSD).
The binding free energies of the best pose of hydroxamic acids are shown in Table 5.2.
The best poses obtained by hydroxamic acids upon binding with DNA are shown in
Figures 5.6 to 5.10.
Not much difference was found in the binding affinity of the hydroxamic acids with
DNA.
All the compounds show groove binding with DNA.
(ii) Rigid Docking of Hydroxamic Acids With DNA
Rigid ligand docking was performed through Argus Lab software. All the parameters
were kept similar to that of flexible docking.
The binding free energies of the best pose of hydroxamic acids are shown in Table 5.2.
The best poses obtained by hydroxamic acids upon binding with DNA are shown in
Figures 5.11 to 5.15.
Again, not much difference was found in the binding affinity. All the compounds show
groove binding with DNA. The docking results further support the experimental data.

116
Molecular Docking of Naphthyl Hydroxamic Acids with DNA
HYDROXAMIC ACID-DNA COMPLEX
ENERGY ( kJ/mol)
FLEXIBLE DOCKING
RIGID DOCKING
N-1-naphthyl-2-methylbenzo- -4.33 -4.02
N-1-naphthyl-4-methylbenzo- -4.28 -1.81
N-1-naphthyl-2-ethoxybenzo- -4.33 -4.24
N-1-naphthyl phenylaceto- -4.18 -3.75
N-1-naphthyl valero- -3.95 -4.63
Table 5.2
Binding free energy of DNA-hydroxamic acid complexes obtained through
ArgusLab.

117
Molecular Docking of Naphthyl Hydroxamic Acids with DNA
Figure 5.6 : N-1-naphthyl-2-methylbenzohydroxamic acid
Figure 5.7 : N-1-naphthyl-4-methylbenzohydroxamic acid
Figure 5.8 : N-1-naphthyl-2-ethoxybenzohydroxamic acid
FLEXIBLE DOCKING OF HYDROXAMIC ACIDS WITH DNA BY ARGUS LAB SOFTWARE

118
Molecular Docking of Naphthyl Hydroxamic Acids with DNA
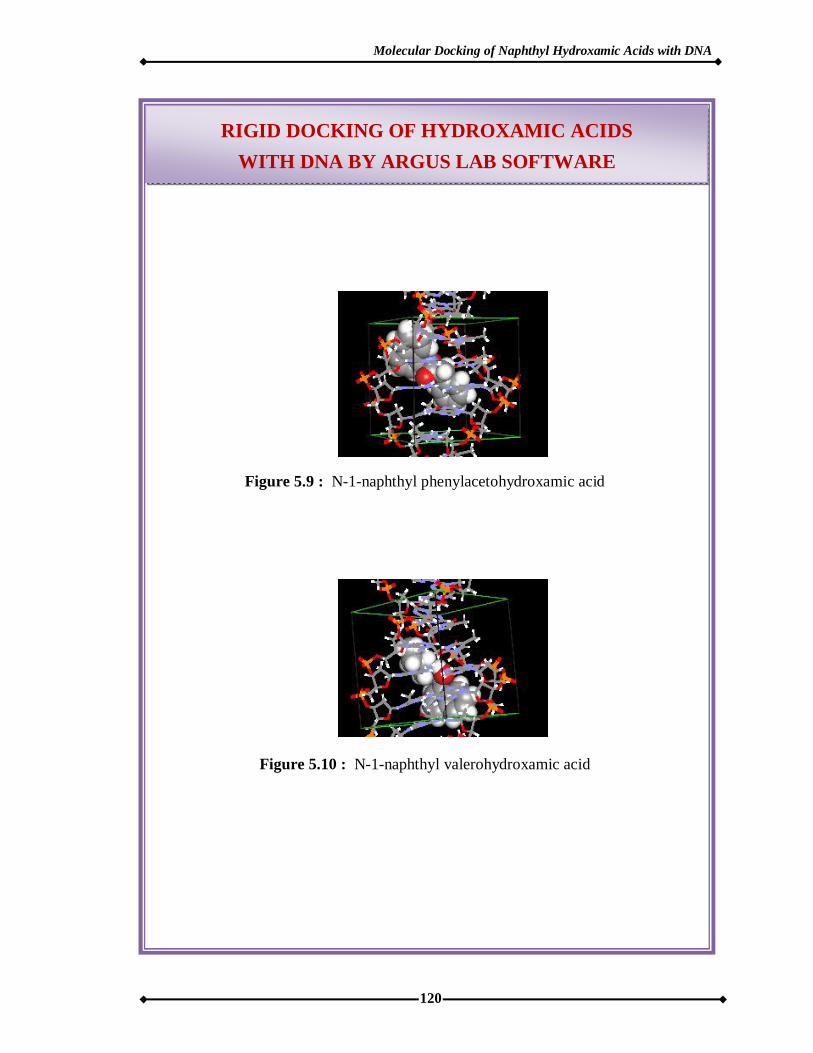
Figure 5.9 : N-1-naphthyl phenylacetohydroxamic acid
Figure 5.10 : N-1-naphthyl valerohydroxamic acid
FLEXIBLE DOCKING OF HYDROXAMIC ACIDS WITH DNA BY ARGUS LAB SOFTWARE

119
Molecular Docking of Naphthyl Hydroxamic Acids with DNA
Figure 5.6: N-1-naphthyl-2-methylbenzohydroxamic acid
Figure 5.7: N-1-naphthyl-4-methylbenzohydroxamic acid
Figure 5.8: N-1-naphthyl-2-ethoxybenzohydroxamic acid
RIGID DOCKING OF HYDROXAMIC ACIDS WITH DNA BY ARGUS LAB SOFTWARE
120
Molecular Docking of Naphthyl Hydroxamic Acids with DNA
Figure 5.9 : N-1-naphthyl phenylacetohydroxamic acid
Figure 5.10 : N-1-naphthyl valerohydroxamic acid
RIGID DOCKING OF HYDROXAMIC ACIDS WITH DNA BY ARGUS LAB SOFTWARE

121
Molecular Docking of Naphthyl Hydroxamic Acids with DNA
CONCLUSIONS
All the compounds show DNA binding ability.
The binding affinity for all the compounds calculated through Hex
and Agrus docking softwares is negative showing the spontaneity of
the complexation process.
Both the docking softwares prove that all the compounds under
present study show groove binding mode of DNA interaction.
These results further support the experimental observations.