Embed Size (px)
Citation preview
C L E A N R O O M G A R M E N T S Q u a r t e r l y E n v i r o n m e n t a l R e p o r t
____________________________________________________________________________________________________________ CRG Quarterly Report; Q3 2013 Page 1 of 16
QUARTERLY
ENVIRONMENTAL REPORT
Q3 : JULY - SEPTEMBER 2013
Garments Standard/Reference
Particles AS 2013.2 Cleanroom Garments Part 2: Processing
and Use
Bioburden PIC/S code of GMP – Annex 1
Water
Particles CRG Internal Historical Data
Bioburden USP 2004 / CRG Internal Historical Data
Air
Particles PIC/S code of GMP – Annex 1
Bioburden PIC/S code of GMP – Annex 1
Surfaces
Bioburden PIC/S code of GMP – Annex 1
Operators
Bioburden PIC/S code of GMP – Annex 1 / CRG Internal
Historical Data
C L E A N R O O M G A R M E N T S Q u a r t e r l y E n v i r o n m e n t a l R e p o r t
____________________________________________________________________________________________________________ CRG Quarterly Report; Q3 2013 Page 2 of 16
Contents:
Contents: ....................................................................................................... 2
Garment Particle Counts ............................................................................... 3
Garment Bioburden ....................................................................................... 4
Water Particle Counting ................................................................................. 5
Water Bioburden ............................................................................................ 6
Air Particle Monitoring .................................................................................... 7
Air Bioburden ................................................................................................. 9
Surface Bioburden ....................................................................................... 11
Operator Bioburden ..................................................................................... 12
Conclusion ................................................................................................... 15
C L E A N R O O M G A R M E N T S Q u a r t e r l y E n v i r o n m e n t a l R e p o r t
____________________________________________________________________________________________________________ CRG Quarterly Report; Q3 2013 Page 3 of 16
Garment Particle Counts
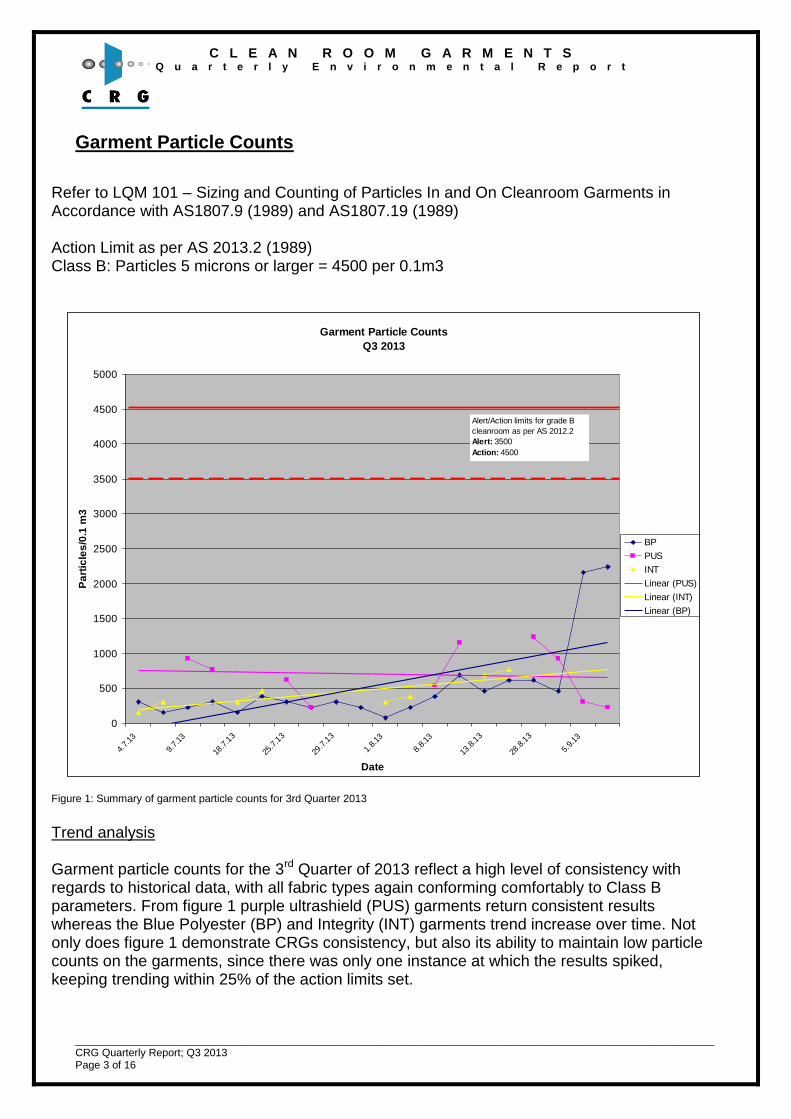
Refer to LQM 101 – Sizing and Counting of Particles In and On Cleanroom Garments in Accordance with AS1807.9 (1989) and AS1807.19 (1989) Action Limit as per AS 2013.2 (1989) Class B: Particles 5 microns or larger = 4500 per 0.1m3
Garment Particle Counts
Q3 2013
0
500
1000
1500
2000
2500
3000
3500
4000
4500
5000
4.7.
13
9.7.
13
18.7
.13
25.7
.13
29.7
.13
1.8.
13
8.8.
13
13.8
.13
28.8
.13
5.9.
13
Date
Pa
rtic
les
/0.1
m3
BP
PUS
INT
Linear (PUS)
Linear (INT)
Linear (BP)
Alert/Action limits for grade B
cleanroom as per AS 2012.2
Alert: 3500
Action: 4500
Figure 1: Summary of garment particle counts for 3rd Quarter 2013
Trend analysis
Garment particle counts for the 3rd Quarter of 2013 reflect a high level of consistency with regards to historical data, with all fabric types again conforming comfortably to Class B parameters. From figure 1 purple ultrashield (PUS) garments return consistent results whereas the Blue Polyester (BP) and Integrity (INT) garments trend increase over time. Not only does figure 1 demonstrate CRGs consistency, but also its ability to maintain low particle counts on the garments, since there was only one instance at which the results spiked, keeping trending within 25% of the action limits set.
C L E A N R O O M G A R M E N T S Q u a r t e r l y E n v i r o n m e n t a l R e p o r t
____________________________________________________________________________________________________________ CRG Quarterly Report; Q3 2013 Page 4 of 16
Garment Bioburden
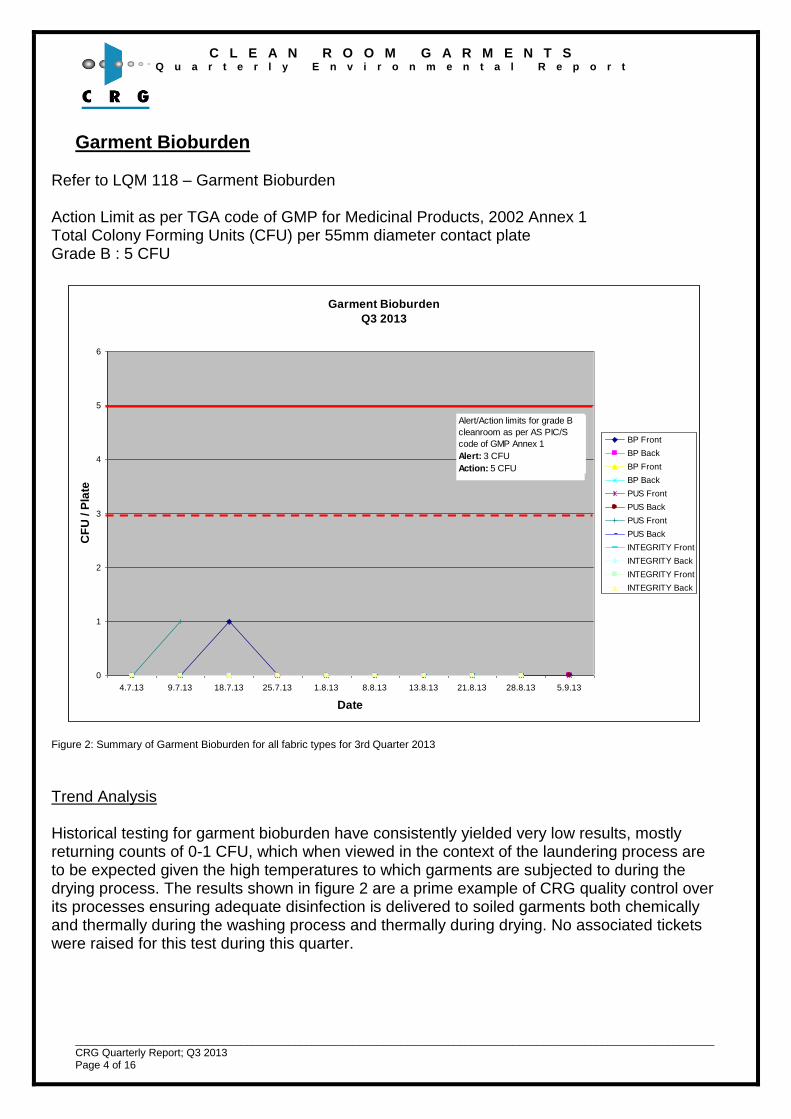
Refer to LQM 118 – Garment Bioburden Action Limit as per TGA code of GMP for Medicinal Products, 2002 Annex 1 Total Colony Forming Units (CFU) per 55mm diameter contact plate Grade B : 5 CFU
Garment Bioburden
Q3 2013
0
1
2
3
4
5
6
4.7.13 9.7.13 18.7.13 25.7.13 1.8.13 8.8.13 13.8.13 21.8.13 28.8.13 5.9.13
Date
CF
U / P
late
BP Front
BP Back
BP Front
BP Back
PUS Front
PUS Back
PUS Front
PUS Back
INTEGRITY Front
INTEGRITY Back
INTEGRITY Front
INTEGRITY Back
Alert/Action limits for grade B
cleanroom as per AS PIC/S
code of GMP Annex 1
Alert: 3 CFU
Action: 5 CFU
Alert/Action limits for grade B
cleanroom as per AS PIC/S
code of GMP Annex 1
Alert: 3 CFU
Action: 5 CFU
Figure 2: Summary of Garment Bioburden for all fabric types for 3rd Quarter 2013
Trend Analysis Historical testing for garment bioburden have consistently yielded very low results, mostly returning counts of 0-1 CFU, which when viewed in the context of the laundering process are to be expected given the high temperatures to which garments are subjected to during the drying process. The results shown in figure 2 are a prime example of CRG quality control over its processes ensuring adequate disinfection is delivered to soiled garments both chemically and thermally during the washing process and thermally during drying. No associated tickets were raised for this test during this quarter.
C L E A N R O O M G A R M E N T S Q u a r t e r l y E n v i r o n m e n t a l R e p o r t
____________________________________________________________________________________________________________ CRG Quarterly Report; Q3 2013 Page 5 of 16
Water Particle Counting
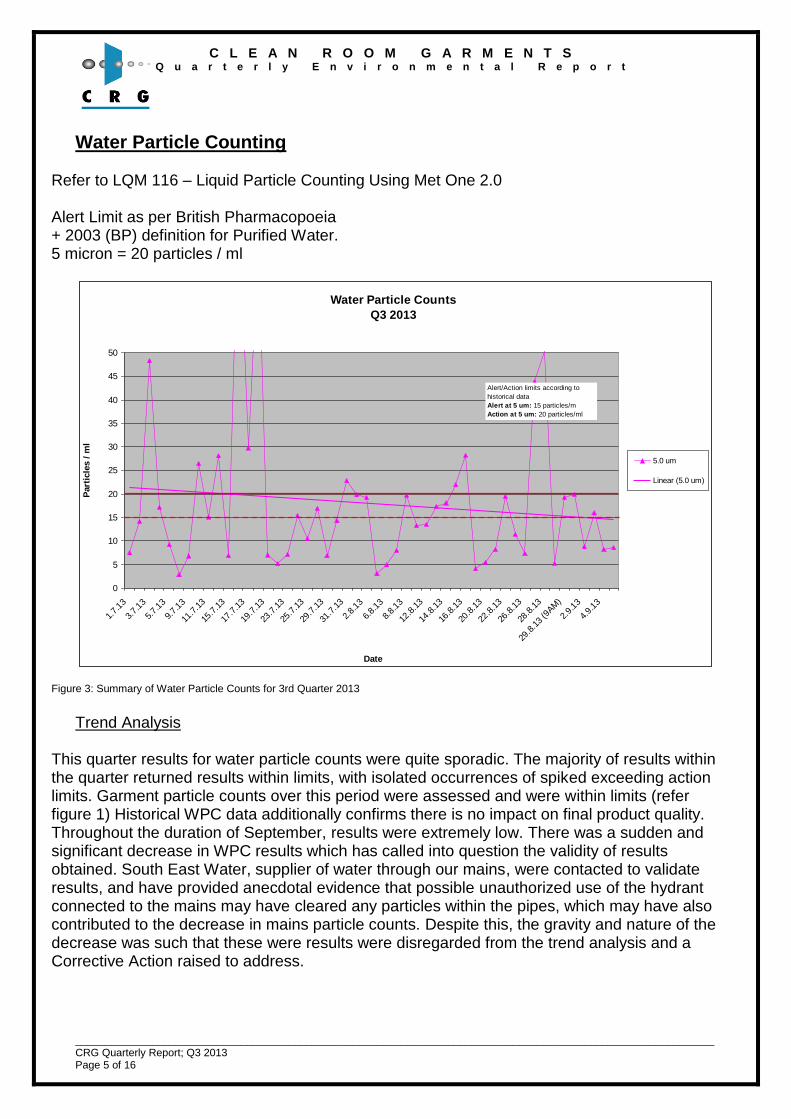
Refer to LQM 116 – Liquid Particle Counting Using Met One 2.0 Alert Limit as per British Pharmacopoeia + 2003 (BP) definition for Purified Water. 5 micron = 20 particles / ml
Water Particle Counts
Q3 2013
0
5
10
15
20
25
30
35
40
45
50
1.7.
13
3.7.
13
5.7.
13
9.7.
13
11.7
.13
15.7
.13
17.7
.13
19.7
.13
23.7
.13
25.7
.13
29.7
.13
31.7
.13
2.8.
13
6.8.
13
8.8.
13
12.8
.13
14.8
.13
16.8
.13
20.8
.13
22.8
.13
26.8
.13
28.8
.13
29.8
.13
(9AM
)
2.9.
13
4.9.
13
Date
Part
icle
s /
ml
5.0 um
Linear (5.0 um)
Alert/Action limits according to
historical data
Alert at 5 um: 15 particles/m
Action at 5 um: 20 particles/ml
Figure 3: Summary of Water Particle Counts for 3rd Quarter 2013
Trend Analysis
This quarter results for water particle counts were quite sporadic. The majority of results within the quarter returned results within limits, with isolated occurrences of spiked exceeding action limits. Garment particle counts over this period were assessed and were within limits (refer figure 1) Historical WPC data additionally confirms there is no impact on final product quality. Throughout the duration of September, results were extremely low. There was a sudden and significant decrease in WPC results which has called into question the validity of results obtained. South East Water, supplier of water through our mains, were contacted to validate results, and have provided anecdotal evidence that possible unauthorized use of the hydrant connected to the mains may have cleared any particles within the pipes, which may have also contributed to the decrease in mains particle counts. Despite this, the gravity and nature of the decrease was such that these were results were disregarded from the trend analysis and a Corrective Action raised to address.
C L E A N R O O M G A R M E N T S Q u a r t e r l y E n v i r o n m e n t a l R e p o r t
____________________________________________________________________________________________________________ CRG Quarterly Report; Q3 2013 Page 6 of 16
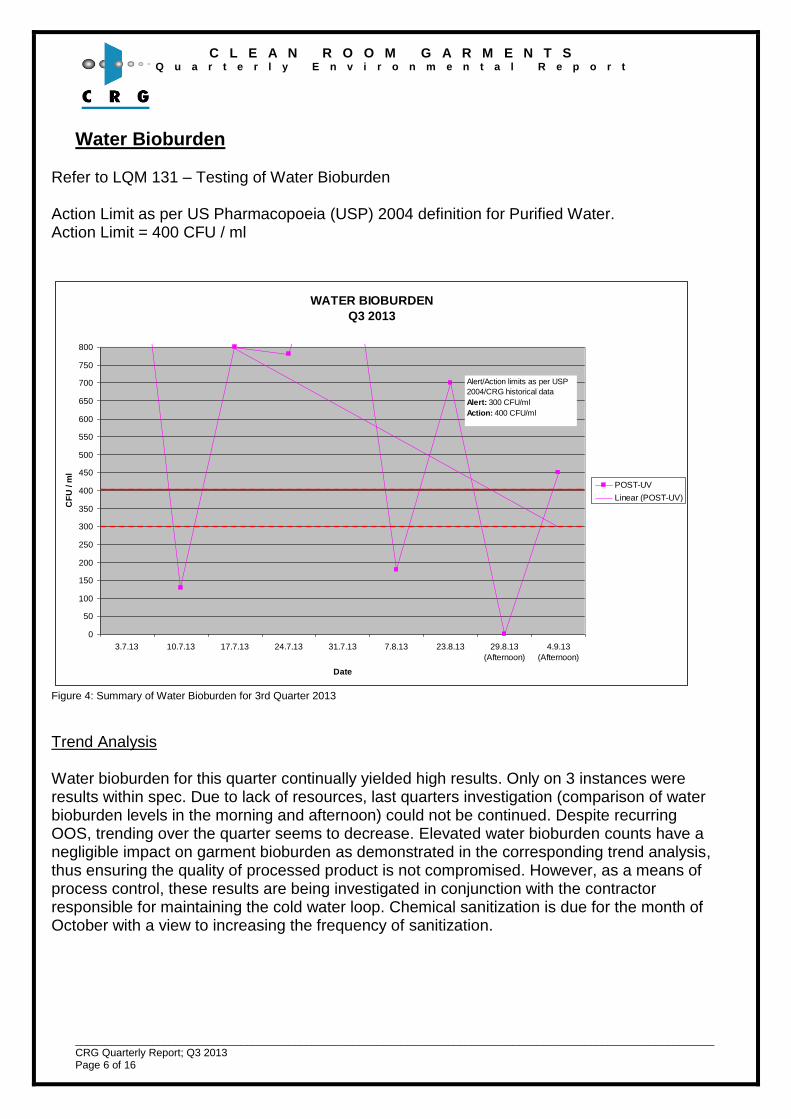
Water Bioburden Refer to LQM 131 – Testing of Water Bioburden Action Limit as per US Pharmacopoeia (USP) 2004 definition for Purified Water. Action Limit = 400 CFU / ml
WATER BIOBURDEN
Q3 2013
0
50
100
150
200
250
300
350
400
450
500
550
600
650
700
750
800
3.7.13 10.7.13 17.7.13 24.7.13 31.7.13 7.8.13 23.8.13 29.8.13
(Afternoon)
4.9.13
(Afternoon)
Date
CF
U / m
l
POST-UV
Linear (POST-UV)
Alert/Action limits as per USP
2004/CRG historical data
Alert: 300 CFU/ml
Action: 400 CFU/ml
Figure 4: Summary of Water Bioburden for 3rd Quarter 2013
Trend Analysis
Water bioburden for this quarter continually yielded high results. Only on 3 instances were results within spec. Due to lack of resources, last quarters investigation (comparison of water bioburden levels in the morning and afternoon) could not be continued. Despite recurring OOS, trending over the quarter seems to decrease. Elevated water bioburden counts have a negligible impact on garment bioburden as demonstrated in the corresponding trend analysis, thus ensuring the quality of processed product is not compromised. However, as a means of process control, these results are being investigated in conjunction with the contractor responsible for maintaining the cold water loop. Chemical sanitization is due for the month of October with a view to increasing the frequency of sanitization.
C L E A N R O O M G A R M E N T S Q u a r t e r l y E n v i r o n m e n t a l R e p o r t
____________________________________________________________________________________________________________ CRG Quarterly Report; Q3 2013 Page 7 of 16
Air Particle Monitoring
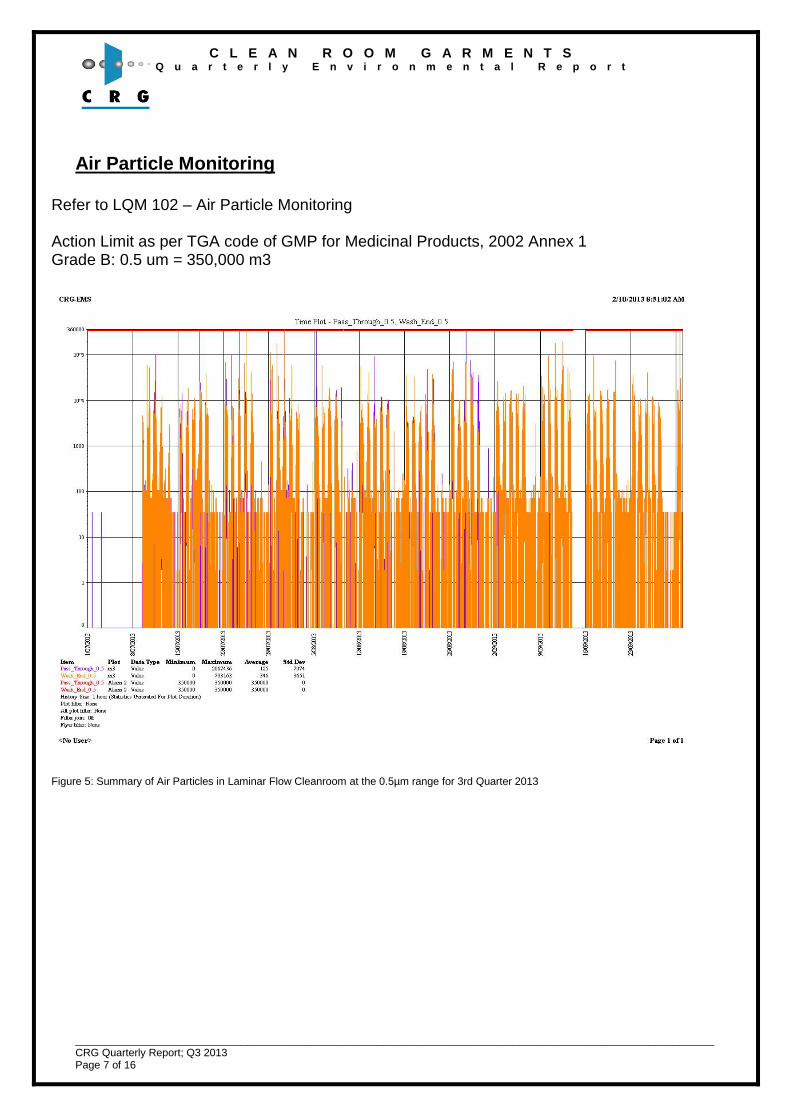
Refer to LQM 102 – Air Particle Monitoring Action Limit as per TGA code of GMP for Medicinal Products, 2002 Annex 1 Grade B: 0.5 um = 350,000 m3
Figure 5: Summary of Air Particles in Laminar Flow Cleanroom at the 0.5µm range for 3rd Quarter 2013
C L E A N R O O M G A R M E N T S Q u a r t e r l y E n v i r o n m e n t a l R e p o r t
____________________________________________________________________________________________________________ CRG Quarterly Report; Q3 2013 Page 8 of 16
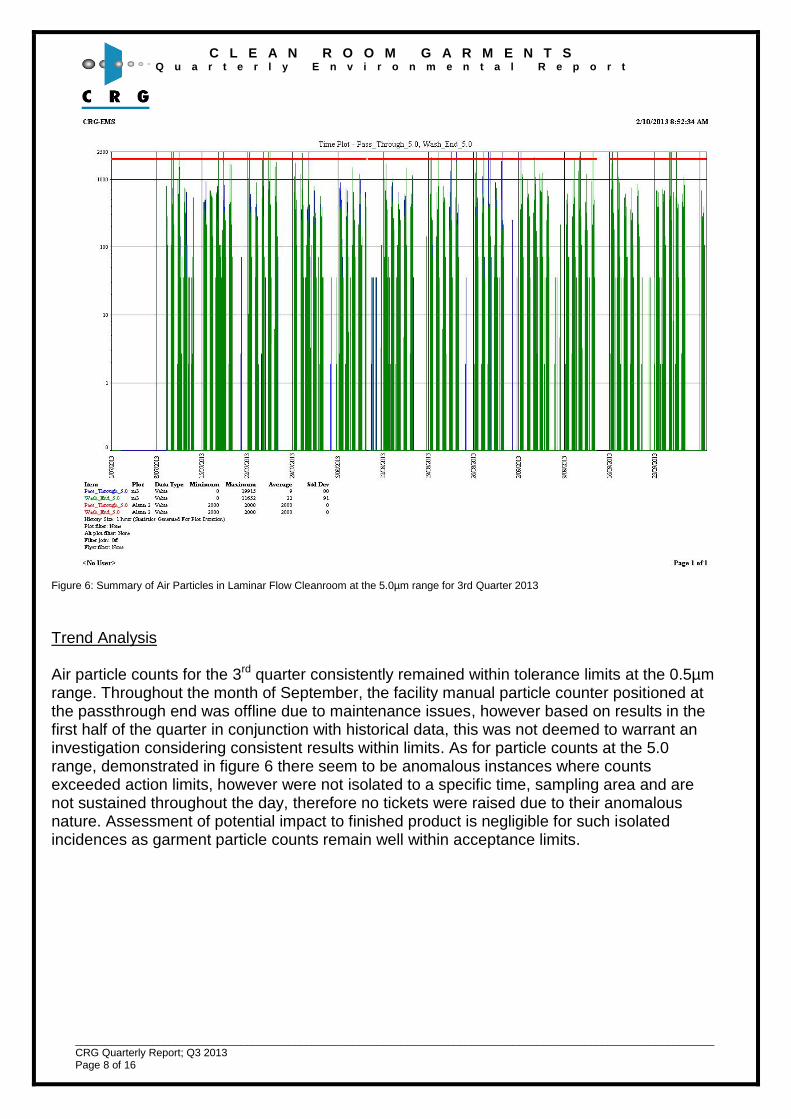
Figure 6: Summary of Air Particles in Laminar Flow Cleanroom at the 5.0µm range for 3rd Quarter 2013
Trend Analysis Air particle counts for the 3rd quarter consistently remained within tolerance limits at the 0.5µm range. Throughout the month of September, the facility manual particle counter positioned at the passthrough end was offline due to maintenance issues, however based on results in the first half of the quarter in conjunction with historical data, this was not deemed to warrant an investigation considering consistent results within limits. As for particle counts at the 5.0 range, demonstrated in figure 6 there seem to be anomalous instances where counts exceeded action limits, however were not isolated to a specific time, sampling area and are not sustained throughout the day, therefore no tickets were raised due to their anomalous nature. Assessment of potential impact to finished product is negligible for such isolated incidences as garment particle counts remain well within acceptance limits.
C L E A N R O O M G A R M E N T S Q u a r t e r l y E n v i r o n m e n t a l R e p o r t
____________________________________________________________________________________________________________ CRG Quarterly Report; Q3 2013 Page 9 of 16
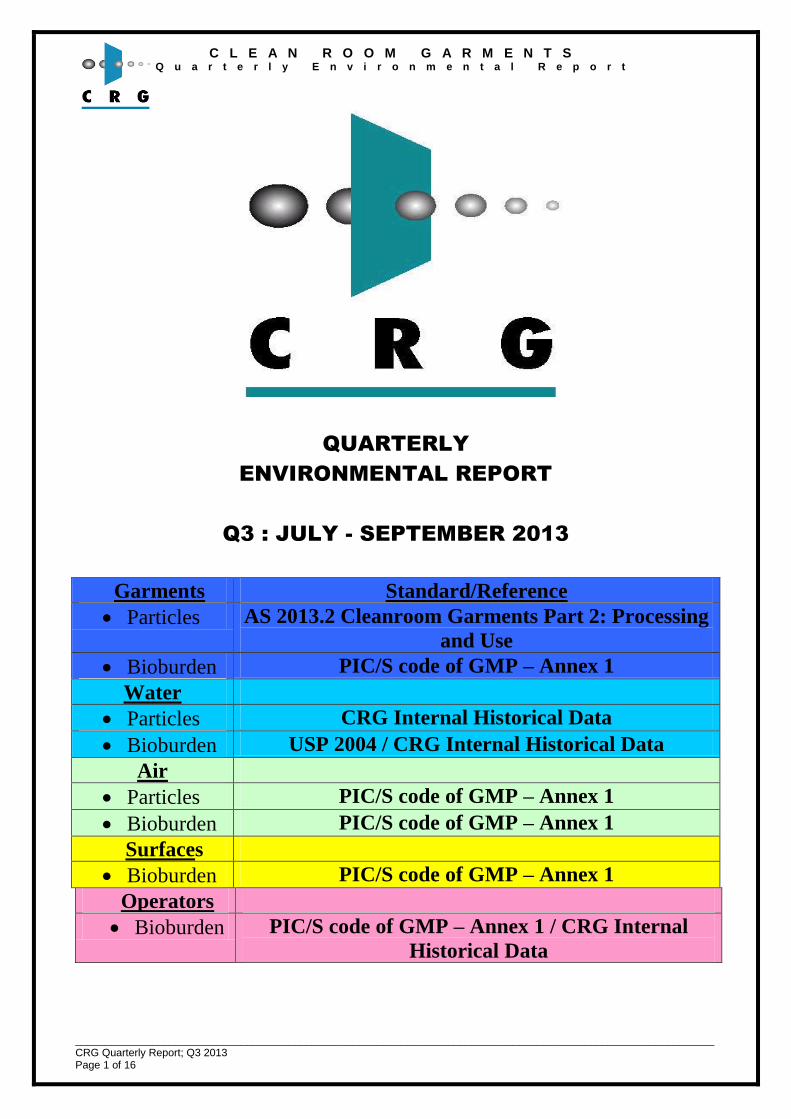
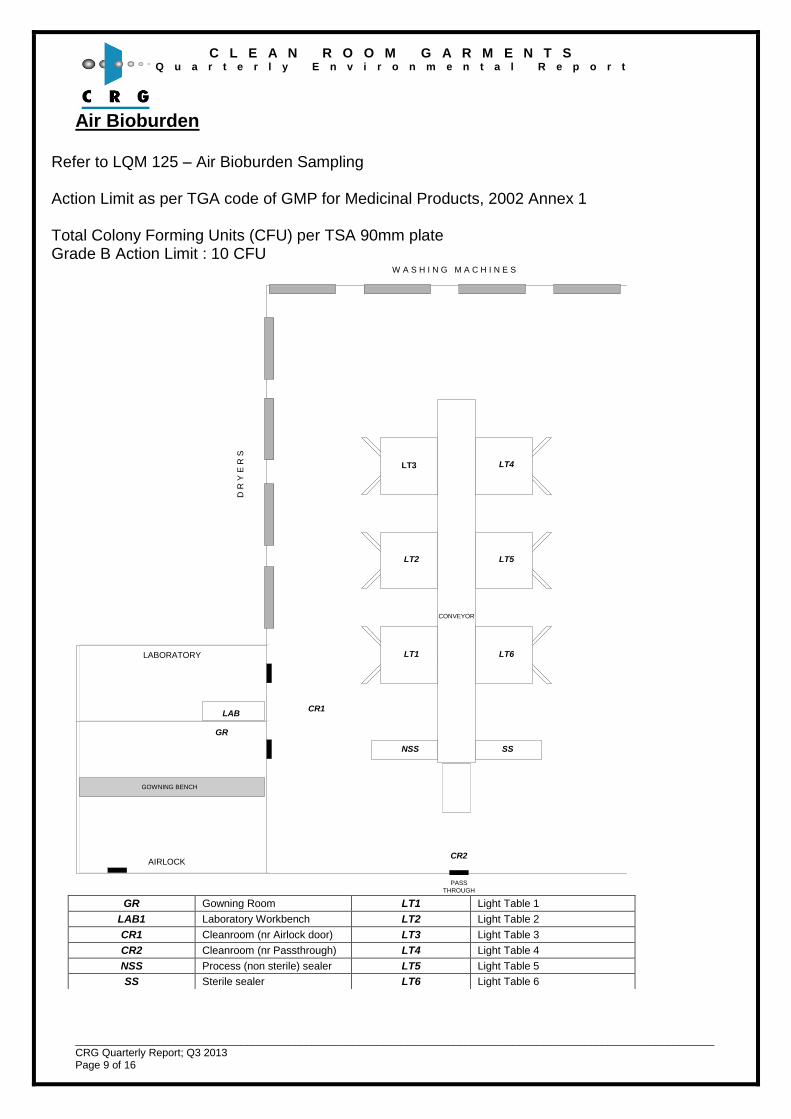
Air Bioburden Refer to LQM 125 – Air Bioburden Sampling Action Limit as per TGA code of GMP for Medicinal Products, 2002 Annex 1
Total Colony Forming Units (CFU) per TSA 90mm plate Grade B Action Limit : 10 CFU
LT3
LABORATORY
AIRLOCK
LT5
LT6
LT4
LT1
LT2
NSS SS
CONVEYOR
PASS
THROUGH
W A S H I N G M A C H I N E S
D R
Y E
R S
GOWNING BENCH
LAB
GR
CR1
CR2
GR Gowning Room LT1 Light Table 1
LAB1 Laboratory Workbench LT2 Light Table 2
CR1 Cleanroom (nr Airlock door) LT3 Light Table 3
CR2 Cleanroom (nr Passthrough) LT4 Light Table 4
NSS Process (non sterile) sealer LT5 Light Table 5
SS Sterile sealer LT6 Light Table 6
C L E A N R O O M G A R M E N T S Q u a r t e r l y E n v i r o n m e n t a l R e p o r t
____________________________________________________________________________________________________________ CRG Quarterly Report; Q3 2013 Page 10 of 16
Air Bioburden
Q3 2013
0
2
4
6
8
10
12
14
16
CR1 CR2 LT1 LT2 LT3 LT4 LT5 LT6 NSS SS LAB GR
Location
CF
U/P
late JUL
AUG
SEP
Alert/Action limits for Grade B
cleanroom as per PIC/s code of
GMP annex 1
Alert: 8 CFU
Action: 10 CFU
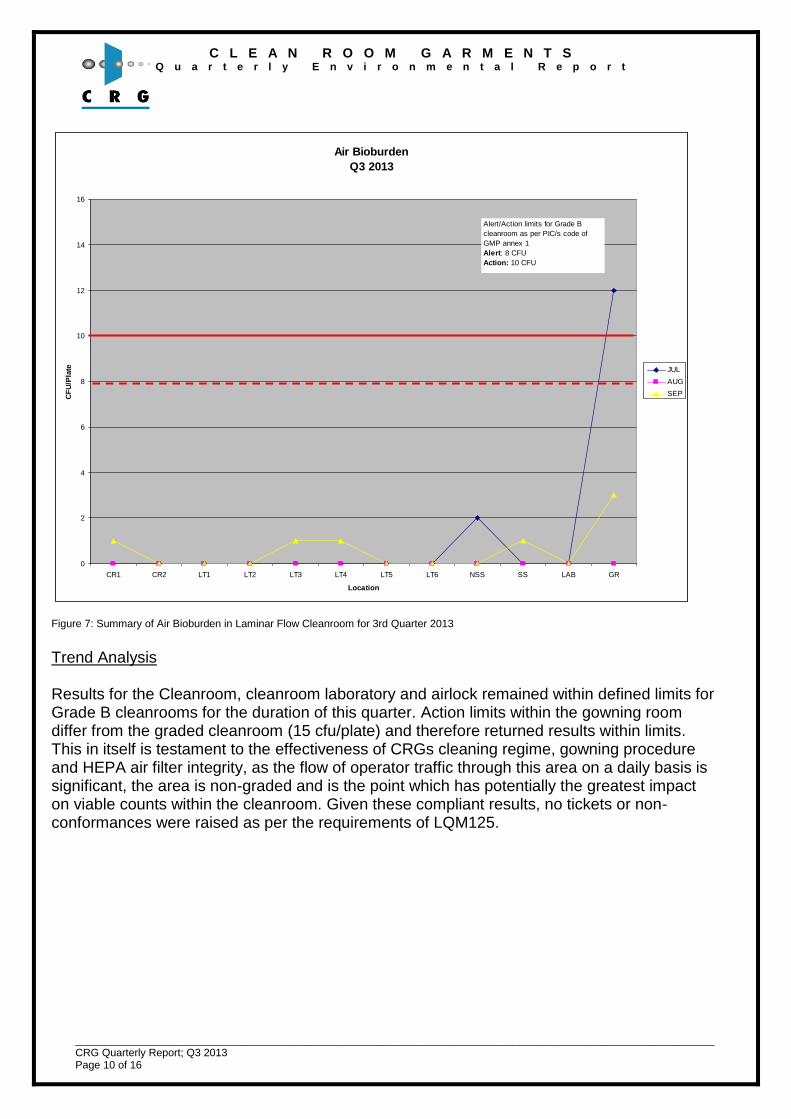
Figure 7: Summary of Air Bioburden in Laminar Flow Cleanroom for 3rd Quarter 2013
Trend Analysis
Results for the Cleanroom, cleanroom laboratory and airlock remained within defined limits for Grade B cleanrooms for the duration of this quarter. Action limits within the gowning room differ from the graded cleanroom (15 cfu/plate) and therefore returned results within limits. This in itself is testament to the effectiveness of CRGs cleaning regime, gowning procedure and HEPA air filter integrity, as the flow of operator traffic through this area on a daily basis is significant, the area is non-graded and is the point which has potentially the greatest impact on viable counts within the cleanroom. Given these compliant results, no tickets or non-conformances were raised as per the requirements of LQM125.
C L E A N R O O M G A R M E N T S Q u a r t e r l y E n v i r o n m e n t a l R e p o r t
____________________________________________________________________________________________________________ CRG Quarterly Report; Q3 2013 Page 11 of 16
Surface Bioburden
Refer to LQM 124 – Surface Bioburden Sampling and Testing Action Limit as per TGA code of GMP for Medicinal Products, 2002 Annex 1 Total Colony Forming Units (CFU) per 55mm diameter contact plate Grade B : 5 CFU
Surface Bioburden
Q3 2013
0
2
4
6
8
10
12
14
16
18
20
DR1
DR2
DR3
DR4
WM
1
WM
2
WM
3
WM
4LT
1LT
2LT
3LT
4LT
5LT
6LT
7LT
8LT
9
LT10
LT11
LT12 S
1S2
S3
K1
K2
F1 F2 F3 F4GB1
GB2
LAB
CV
Location
CF
U/p
late JUL
AUG
SEPT
Alert/Action limits for grade B
cleanroom as per PIC/S code of
GMP Annex 1
Alert: 4 CFU
Action: 5 CFU
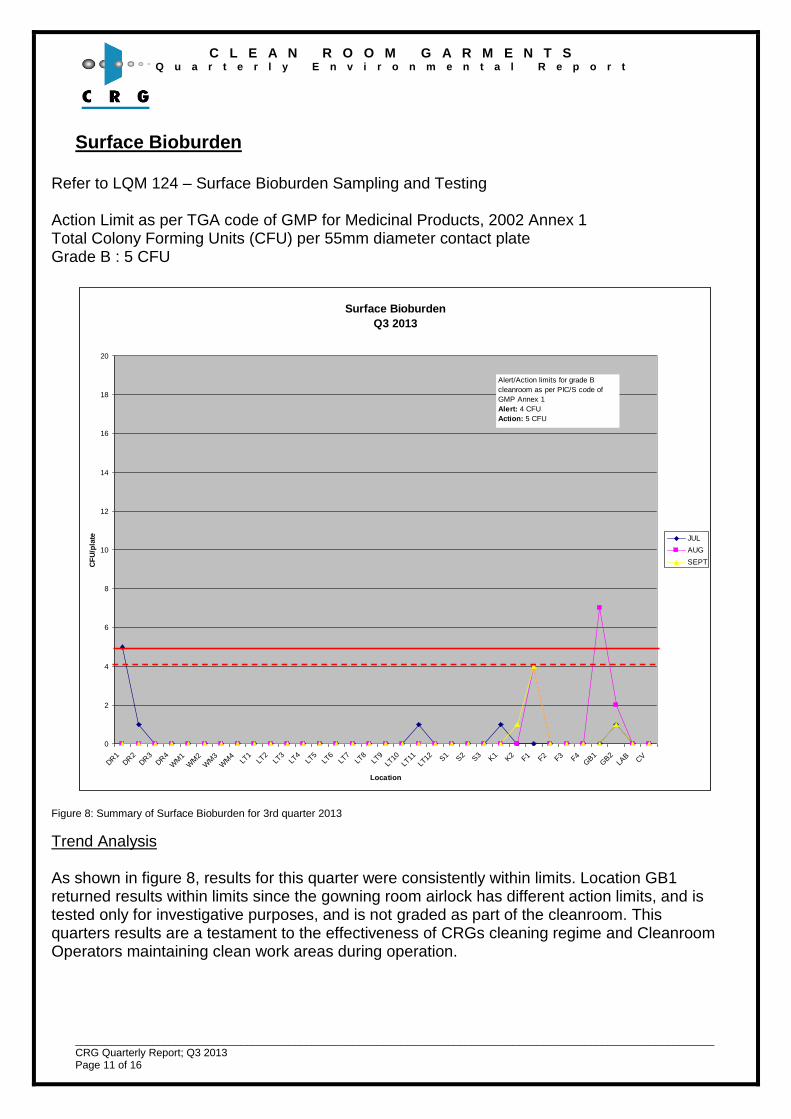
Figure 8: Summary of Surface Bioburden for 3rd quarter 2013
Trend Analysis
As shown in figure 8, results for this quarter were consistently within limits. Location GB1 returned results within limits since the gowning room airlock has different action limits, and is tested only for investigative purposes, and is not graded as part of the cleanroom. This quarters results are a testament to the effectiveness of CRGs cleaning regime and Cleanroom Operators maintaining clean work areas during operation.
C L E A N R O O M G A R M E N T S Q u a r t e r l y E n v i r o n m e n t a l R e p o r t
____________________________________________________________________________________________________________ CRG Quarterly Report; Q3 2013 Page 12 of 16
Operator Bioburden
Refer to LQM 123 – Operator Bioburden Testing Action Limit as per TGA code of GMP for Medicinal Products, 2002 Annex 1 Total Colony Forming Units (CFU) per 55mm diameter contact plate Grade B: 5 CFU
Operator BioburdenJuly 2013
0123456789
101112131415
EM FK
FN LL MR
PD
RK
BB
CS LH S
AAFX
SM N
FBBA
EC
FM
MR (R
ETE
ST)
NF (R
ETE
ST)
Operator
CF
U Fingers
Sleeve
Bench
Alert/Action Limits
As per GMP Annex 1
Alert: 8 CFU
Action: 10 CFU
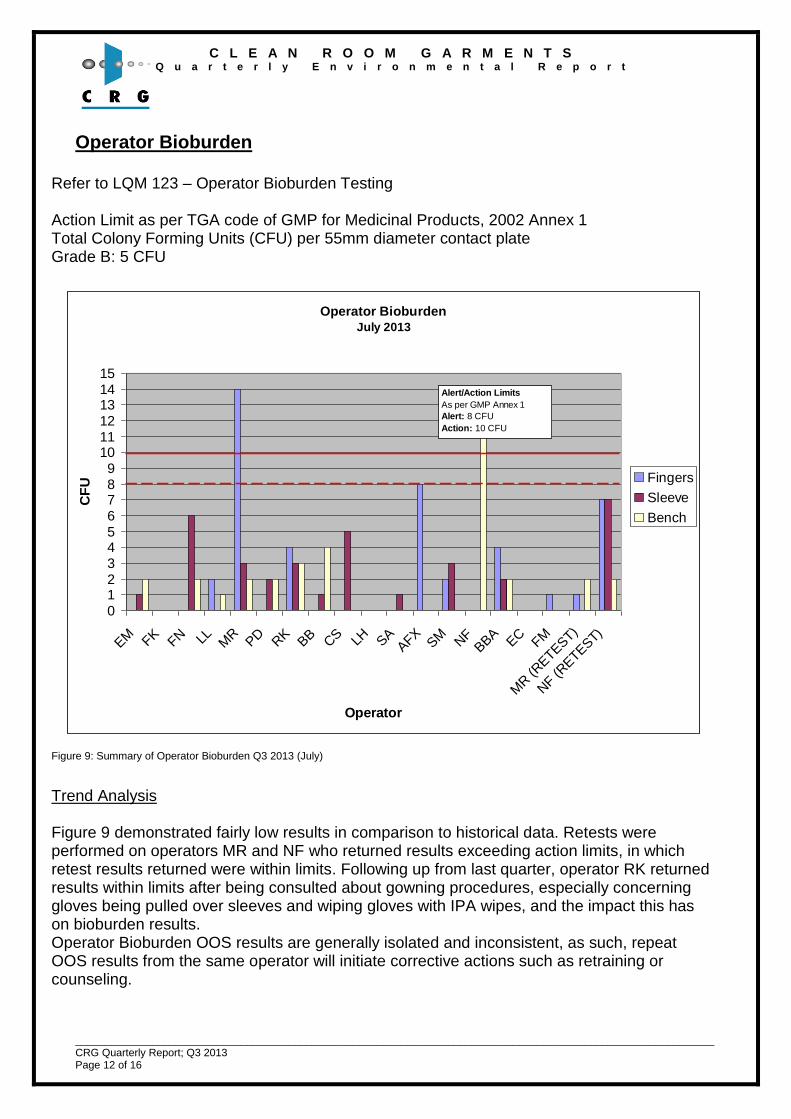
Figure 9: Summary of Operator Bioburden Q3 2013 (July)
Trend Analysis
Figure 9 demonstrated fairly low results in comparison to historical data. Retests were performed on operators MR and NF who returned results exceeding action limits, in which retest results returned were within limits. Following up from last quarter, operator RK returned results within limits after being consulted about gowning procedures, especially concerning gloves being pulled over sleeves and wiping gloves with IPA wipes, and the impact this has on bioburden results. Operator Bioburden OOS results are generally isolated and inconsistent, as such, repeat OOS results from the same operator will initiate corrective actions such as retraining or counseling.
C L E A N R O O M G A R M E N T S Q u a r t e r l y E n v i r o n m e n t a l R e p o r t
____________________________________________________________________________________________________________ CRG Quarterly Report; Q3 2013 Page 13 of 16
Operator BioburdenAugust 2013
0
1
2
3
4
5
6
7
8
9
10
11
12
13
14
15
EM FK LL M
RM
M RK
DS
BB
MN LH A
FXSM N
FBBA
EC
YG R
V
Operator
CF
U Fingers
Sleeve
Bench
Alert/Action Limits
As per GMP Annex 1
Alert: 8 CFU
Action: 10 CFU
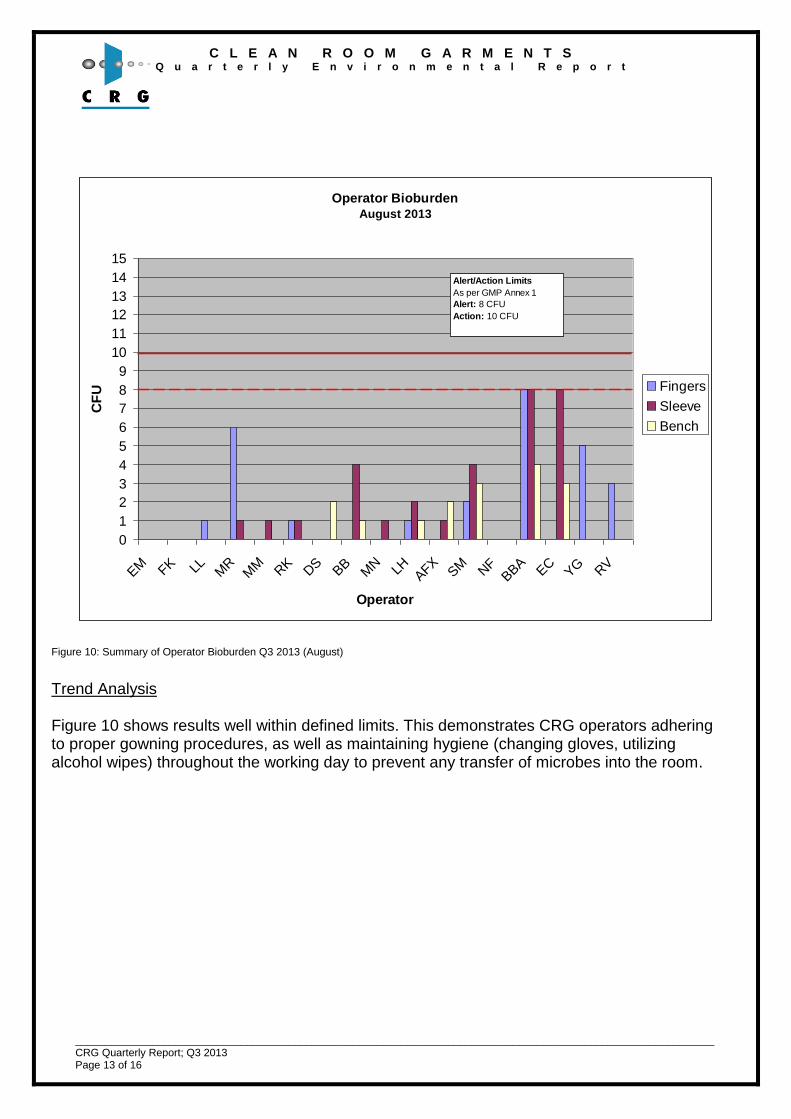
Figure 10: Summary of Operator Bioburden Q3 2013 (August)
Trend Analysis Figure 10 shows results well within defined limits. This demonstrates CRG operators adhering to proper gowning procedures, as well as maintaining hygiene (changing gloves, utilizing alcohol wipes) throughout the working day to prevent any transfer of microbes into the room.
C L E A N R O O M G A R M E N T S Q u a r t e r l y E n v i r o n m e n t a l R e p o r t
____________________________________________________________________________________________________________ CRG Quarterly Report; Q3 2013 Page 14 of 16
Operator BioburdenSeptember 2013
0
1
2
3
4
5
6
7
8
9
10
11
12
13
14
15
FK LL MR
MM P
DRK
BB
CS LH S
AAFX
SM N
FBBA
EC
YG
Operator
CF
U Fingers
Sleeve
Bench
Alert/Action Limits
As per GMP Annex 1
Alert: 8 CFU
Action: 10 CFU
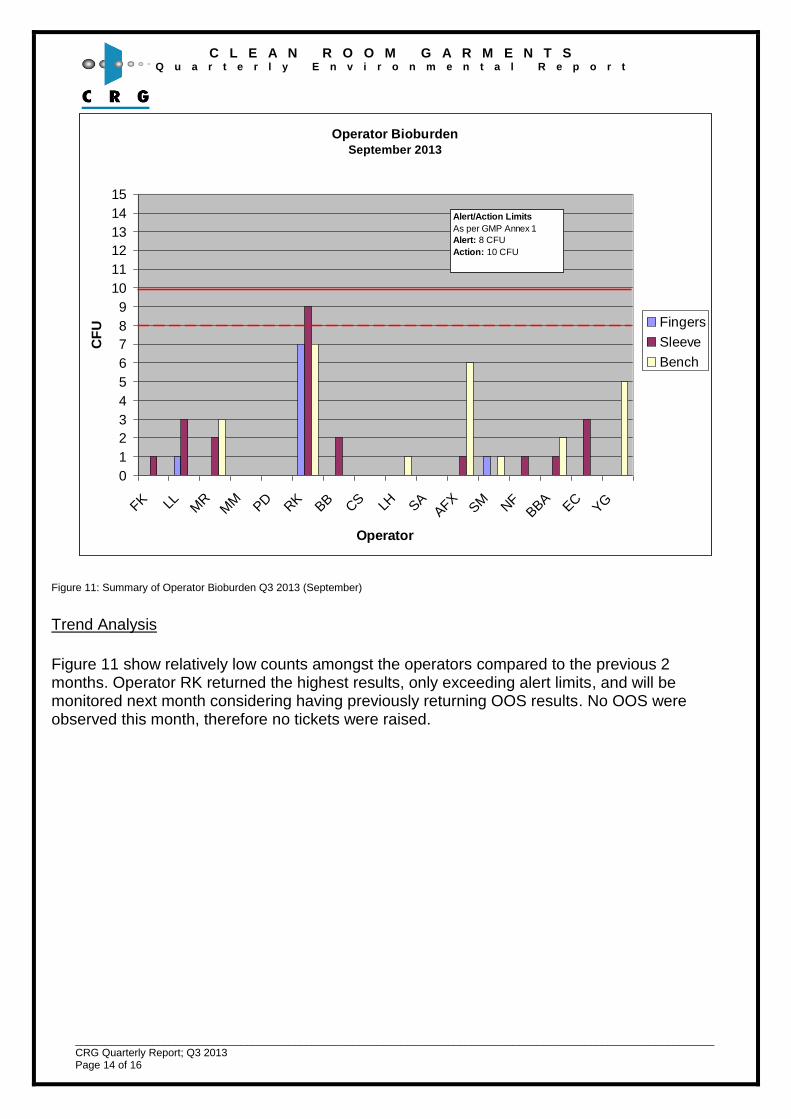
Figure 11: Summary of Operator Bioburden Q3 2013 (September)
Trend Analysis
Figure 11 show relatively low counts amongst the operators compared to the previous 2 months. Operator RK returned the highest results, only exceeding alert limits, and will be monitored next month considering having previously returning OOS results. No OOS were observed this month, therefore no tickets were raised.
C L E A N R O O M G A R M E N T S Q u a r t e r l y E n v i r o n m e n t a l R e p o r t
____________________________________________________________________________________________________________ CRG Quarterly Report; Q3 2013 Page 15 of 16
Conclusion
Environmental monitoring results for the third quarter of this year demonstrate consistency following on from last quarter. Garment particle counts and garment bioburden continually remain well within defined limits, as well as Air bioburden and surface bioburden. This reflects positively on CRGs cleaning regime, as nothing less is to be expected for a certified grade B cleanroom.
Water particle counts for this quarter had a few OOS results throughout. Due to the issues with the liquid particle counter, particle counts throughout September have been deemed invalid and disregarded. South East Water was also contacted and enquired about the quality of the water, as well as any changes made to the facility which may have caused the decrease. These investigative measures will be captured in a Corrective Action to address root cause and perform impact analysis. Water bioburden results for this quarter were inconsistent and warrant further investigation.This is being addressed in consultation with the contractor servicing the cold water loop. Chemical sanitization is scheduled for October and subsequent results will dictate the frequency of sanitization with a view to increase. Air particle counts for this quarter remained well within limits. During this quarter, issues arose with the Airnet II FMPC at the Passthrough end location. Therefore throughout the month of September, no samples were taken at this position. However, based on historical data, as well as results from the months of July and August and from the wash end, no further actions were deemed necessary. Once the issues with the FMPC at the Passthrough have been resolved, the trending of results will be analysed for any impact on the cleanroom during the time the FMPC has been offline. These investigative measures are to be captured in a Corrective Action to address root cause and perform impact analysis. Operator bioburden for this quarter also returned some isolated high counts with respect to historical data, however retest returned within spec. The consistency with low results among the operators is expected given the cleaning regime of the room and the adherence to gowning procedure by the operators. CRG from a quality perspective continues its effective regime in monitoring and maintaining control over its processes, which are in constant review to ensure that our products meet and exceed the standard to which our customers expect.
C L E A N R O O M G A R M E N T S Q u a r t e r l y E n v i r o n m e n t a l R e p o r t
____________________________________________________________________________________________________________ CRG Quarterly Report; Q3 2013 Page 16 of 16