Embed Size (px)
Citation preview

This is the author’s version of a work that was submitted/accepted for pub-lication in the following source:
Panitz, Konrad & Garcia-Hansen, Veronica Ruth (2013) Daylighting designand simulation : ease of use analysis of digital tools for architects. InCIB World Building Congress 2013-Construction and Society, BrisbaneConvention & Exhibition Centre, Brisbane, QLD. (In Press)
This file was downloaded from: http://eprints.qut.edu.au/58526/
c© Copyright 2013 (please consult the authors).
Notice: Changes introduced as a result of publishing processes such ascopy-editing and formatting may not be reflected in this document. For adefinitive version of this work, please refer to the published source:

Daylighting Design and Simulation:
Ease of use analysis of digital tools for architects
Konrad Panitz1, Veronica Garcia-Hansen2
ABSTRACT
Good daylighting design in buildings not only provides a comfortable luminous environment, but also delivers energy savings and comfortable and healthy environments for building occupants. Yet, there is still no consensus on how to assess what constitutes good daylighting design. Currently amongst building performance guidelines, Daylighting factors (DF) or minimum illuminance values are the standard; however, previous research has shown the shortcomings of these metrics. New computer software for daylighting analysis contains new more advanced metrics for daylighting (Climate Base Daylight Metrics-CBDM). Yet, these tools (new metrics or simulation tools) are not currently understood by architects and are not used within architectural firms in Australia.
A survey of architectural firms in Brisbane showed the most relevant tools used by industry. The purpose of this paper is to assess and compare these computer simulation tools and new tools available architects and designers for daylighting. The tools are assessed in terms of their ease of use (e.g. previous knowledge required, complexity of geometry input, etc.), efficiency (e.g. speed, render capabilities, etc.) and outcomes (e.g. presentation of results, etc. The study shows tools that are most accessible for architects, are those that import a wide variety of files, or can be integrated into the current 3d modelling software or package. These software’s need to be able to calculate for point in times simulations, and annual analysis. There is a current need in these software solutions for an open source program able to read raw data (in the form of spreadsheets) and show that graphically within a 3D medium. Currently, development into plug-in based software’s are trying to solve this need through third party analysis, however some of these packages are heavily reliant and their host program. These programs however which allow dynamic daylighting simulation, which will make it easier to calculate accurate daylighting no matter which modelling platform the designer uses, while producing more tangible analysis today, without the need to process raw data.
Keywords: Daylighting, Daylight simulation, Climatic base daylight metrics, Radiance, Daysim, Diva
1 Research Student; Lighting and Colour Lab, School of Design; QUT; 29 Glenwood Drive, Morayfield, 4506; [email protected]. 2 Lecturer in Architecture; Lighting and Colour Lab, School of Design; QUT; GPObox2434, Brisbane, 4001, QLD, Australia; [email protected]

Introduction:
Within the built environment, evidence-based design should be pursued either by looking at precedence works or the analysis of projects either physically (through observation and rules of thumb) or digitally (computer simulation) as they provide tangible information in terms of indoor environmental quality (IEQ) of the project. Research into the tools commonly used by architects has revealed that in terms of analysis, either digitally or physically, outputs, useability, efficiency and accuracy can be somewhat varied (Attia et al., 2009, Mardaljevic, 2001). The two main issues, as highlighted by Attia et al. (2009), are firstly the usability and information management of interface, and secondly the integration of intelligent design knowledge-base (Attia et al., 2009). According to a survey by Attia et al. (2009) the main software’s used for building performance analysis are Ecotect, eQUEST, Energy Plus and Energy Plus for SketchUp (plug-in), and IES VE (Revit plug-in), etc.
Evidence based design is particularly important for daylighting design in buildings, especially in climates such as those present in Australia (tropical and subtropical). Main issues with building in these climates are overheating and glare, resulting in buildings with tinted glassed and/or overshaded openings which reduce daylight levels availability. Main decisions that affect dayligthing (availability, orientation, building context, shading, location and shape of windows, etc) are decisions made by architects, and therefore visualization and understanding of how these design decisions could affect daylighting performance is paramount. Thus the need for easy to use daylight simulation tools for architects. Galasiu and Reinhart (2008) survey of current daylight design practices of design teams (in the USA, and Canada), found that during the early design stage practitioners tend to rely on experience from previous work and rules of thumb and that computer simulations are increasingly being used during the design development stage. Participants reported the use of up to 39 different softwares for daylight analysis, although 62% were based on radiance.
With industry focus on Build Information Technology (BIM) design decisions can be changed quickly, effectively and verified within the digital model for costs, time and effectiveness. Any advancement in daylighting analysis needs to be integrated into BIM technologies so that architects and other professionals can easily integrate their models into the analysis software. Current analysis software for BIM has been designed as an add-on premise where a third party program or plug-in that supports a variety of file types performs the analysis of the building. Due to the many different file types within industry a universal file type such as an IFC (Industry Foundation Classes) has been developed. Conversion to IFC needs to contain the base information of the model such as, location, orientation and materials. Currently most IFC’s do not contain this information (Lee et al., 2003). This leads to architects only using analysis software that’s compatible with their proprietary modelling solutions or rely purely on rules of thumb for daylighting.
The purpose of this paper is to evaluate the usability of daylighting simulation software from the architect or designer’s point of view in the particular context of Brisbane, Australia. This paper will explore daylighting metrics, sky components, building rating/certification guidelines, built information modelling and IFC’s while exploring the capabilities of digital analysis software. The development and understanding of all these components play a vital

role in the future of daylight analysis in architecture. This paper highlights the need for evaluation of metrics using today’s analysis software on a project, the capabilities and benefits of such analysis, as well as an exploration on the processes and issues that arise when architects use unfamiliar complex daylighting software.
The present state of daylighting and industry
The integration of light into a building is a fundamental part of creating space. Daylighting has numerous psychological and physiological effects on buildings’ occupants; still, it can have an adverse effect (i.e. glare, overheating) on the indoor environmental quality of that space if special care is not taken into the daylighting design. Galasiu and Reinhart's survey on daylighting design practice among design teams with interest in sustainable design found out that rules of thumb and daylighting factor (DF) are the main prediction methods for daylight (Galasiu and Reinhart, 2008). However, DF has it short comings as proved by studies on post occupancy evaluations (Thompson, 2011, Mardaljevic, 2011, Lee and Guerin, 2010). These studies show a general disparity between what is considered acceptable between performance guidelines on daylighting and acceptable indoor illuminance by occupants.
Within the context of Brisbane there are currently 2 main documents that architects use that qualify daylighting design, National Construction Code (NCC): Building Code of Australia (BCA), and Green Star (GS) rating system (Australian Building Codes Board, 2011, Green Building Council of Australia, 2008, Standards Australia, 2006). These documents outline a set of performance standards and metrics which architects and professionals within industry should achieve usually based on DF. DF is defined as “the ratio of internal illuminance to the external illuminance under a CIE overcast sky.” (MOON, 1942) It is a static metric measured on one day of the year as representation of the worst-case scenario. Nevertheless, there are new dynamic metrics (Climate based daylight modelling- CBDM) that predict luminous quantities using realistic sun and sky conditions derived from standardized meteorological data These metrics are Daylight Autonomy (DA), Useful Daylight Illuminance (UDI) and Daylight Availability (Dav) (Mardaljevic, 2001, Reinhart et al., 2006, Nabil and Mardaljevic, 2006) (Metrics are described under the assessment of daylighting simulation section).
New metrics for daylighting design could change the way in which architects and other professionals run analysis providing accurate legible data that could easily be applied to the design process by allowing more exploration and thus better designs. These new climate based daylight metrics (CBDM), are much more informative to professionals and disarmingly simple. Though, currently there is no consensus on targets let alone which metric should be used in standards (Nabil and Mardaljevic, 2006).
Methodology
This paper evaluates the usability of daylighting simulation software’s from the designer’s point of view. To this end, firstly, it identifies the simulation tools and methods most currently used by architects in Brisbane, to be selected for this study. Secondly, tests and compares their performance against real measurements from a real space (point in time simulations).
And finally, qualitatively assess the “friendliness” of application of simulation software into the workflow of architects.
Selection of tools
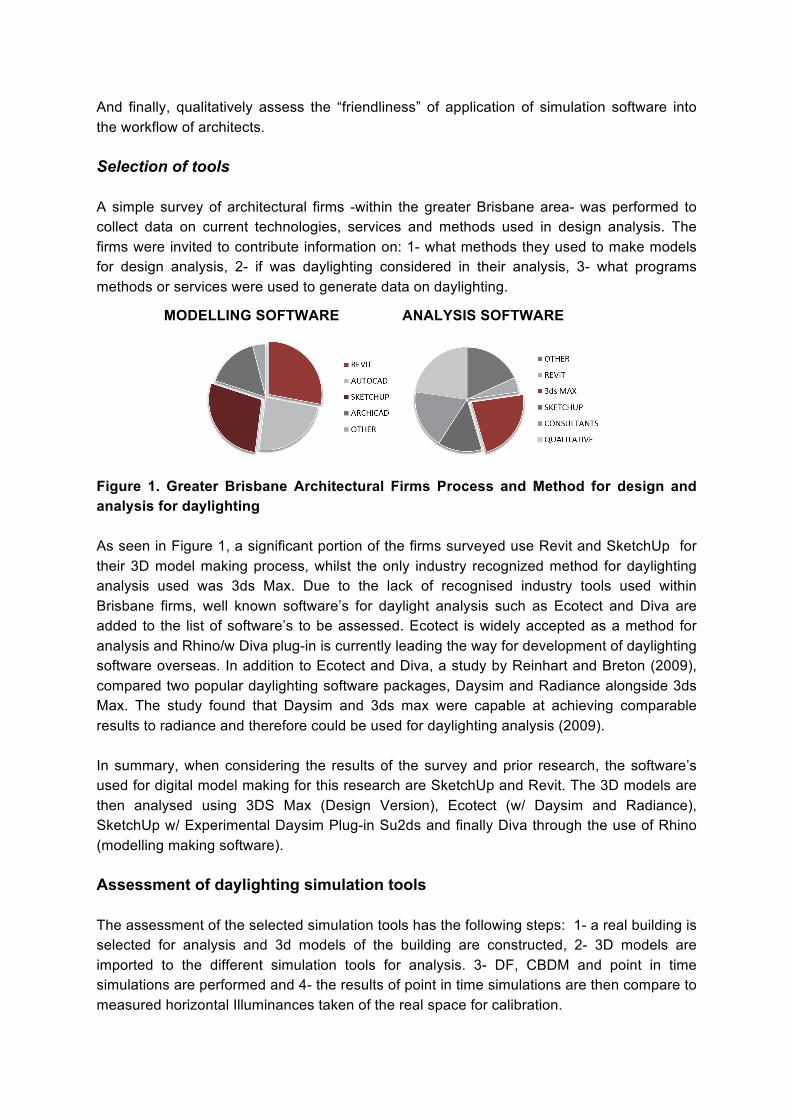
A simple survey of architectural firms -within the greater Brisbane area- was performed to collect data on current technologies, services and methods used in design analysis. The firms were invited to contribute information on: 1- what methods they used to make models for design analysis, 2- if was daylighting considered in their analysis, 3- what programs methods or services were used to generate data on daylighting.
Figure 1. Greater Brisbane Architectural Firms Process and Method for design and analysis for daylighting
As seen in Figure 1, a significant portion of the firms surveyed use Revit and SketchUp for their 3D model making process, whilst the only industry recognized method for daylighting analysis used was 3ds Max. Due to the lack of recognised industry tools used within Brisbane firms, well known software’s for daylight analysis such as Ecotect and Diva are added to the list of software’s to be assessed. Ecotect is widely accepted as a method for analysis and Rhino/w Diva plug-in is currently leading the way for development of daylighting software overseas. In addition to Ecotect and Diva, a study by Reinhart and Breton (2009), compared two popular daylighting software packages, Daysim and Radiance alongside 3ds Max. The study found that Daysim and 3ds max were capable at achieving comparable results to radiance and therefore could be used for daylighting analysis (2009).
In summary, when considering the results of the survey and prior research, the software’s used for digital model making for this research are SketchUp and Revit. The 3D models are then analysed using 3DS Max (Design Version), Ecotect (w/ Daysim and Radiance), SketchUp w/ Experimental Daysim Plug-in Su2ds and finally Diva through the use of Rhino (modelling making software).
Assessment of daylighting simulation tools
The assessment of the selected simulation tools has the following steps: 1- a real building is selected for analysis and 3d models of the building are constructed, 2- 3D models are imported to the different simulation tools for analysis. 3- DF, CBDM and point in time simulations are performed and 4- the results of point in time simulations are then compare to measured horizontal Illuminances taken of the real space for calibration.
MODELLING SOFTWARE ANALYSIS SOFTWARE

1- A studio space on a university campus in Brisbane was recreated within both SketchUp and Revit for analysis and modelling. The room was selected based on the most equatorial facing room within the building with good daylighting. Dimensions were kept as identical as possible such as wall thickness, window heights and sizes, etc. to retain accuracy. The model was oriented from true north by +35 degrees to comply with aerial photos of the site. Neighbouring buildings were also added in the model. Reflectances for the building materials are 60% for ceiling and floors, 40% for walls, and 80% transmittance for windows. The geo-location, climatic data was gathered and imported into both Revit and SketchUp. The climatic data was IWEC (International Weather for Energy Calculation) weather data for Brisbane.
2- The model was altered and redrawn were necessary within software packages to correct for errors in the export/import process but also to effectively document to process of “build-ability”. These programs are also run to produce annual data such as DA, continuous DA, UDI and DAv, as well as Point in Time illuminance measurements at 9am, 12pm, 3pm and 5pm (September 28th) as well as a DF for that day. These Metrics are as defined as follows.
1. DF: ratio of internal illuminance to the external illuminance under CIE overcast sky 2. DA: percentage of the year when an interior illuminance threshold is achieve by
daylight alone 3. UDI: percentage of the year when a target range of illuminances (e.g. 100 to
2000lux), no too low (for visual task performance) and not high causing issues with glare or heat gain., is achieved.
4. DAv: is a variation of UDI accounts for partial daylight within its calculation and highlights areas within the room with thermal/visual discomfort (10 times the target illuminance).
3- Illuminance measurements of the studio space: A Minolta T10 illuminance meter with 9 sensors was set up in the studio to measure the internal horizontal illuminance (28th of September) at 1 minute intervals and diffuse and direct external illuminance at 1hr intervals. The placement of sensor in the space can be seen below in Figure 2.
Figure 2. Sensor Grid, Light Meter Locations
4- Ease of use analysis of the different software was done via observations on legibility/output, speed, ease of use, and importing/exporting data capability with the aim to assess differences in workflow between programs.
2
01 OUTSIDE ILLUMINANCE
METER 3
7 6
8 9
4
5
Results
Measured horizontal illuminances and Point in time modelled illuminance for the studio space
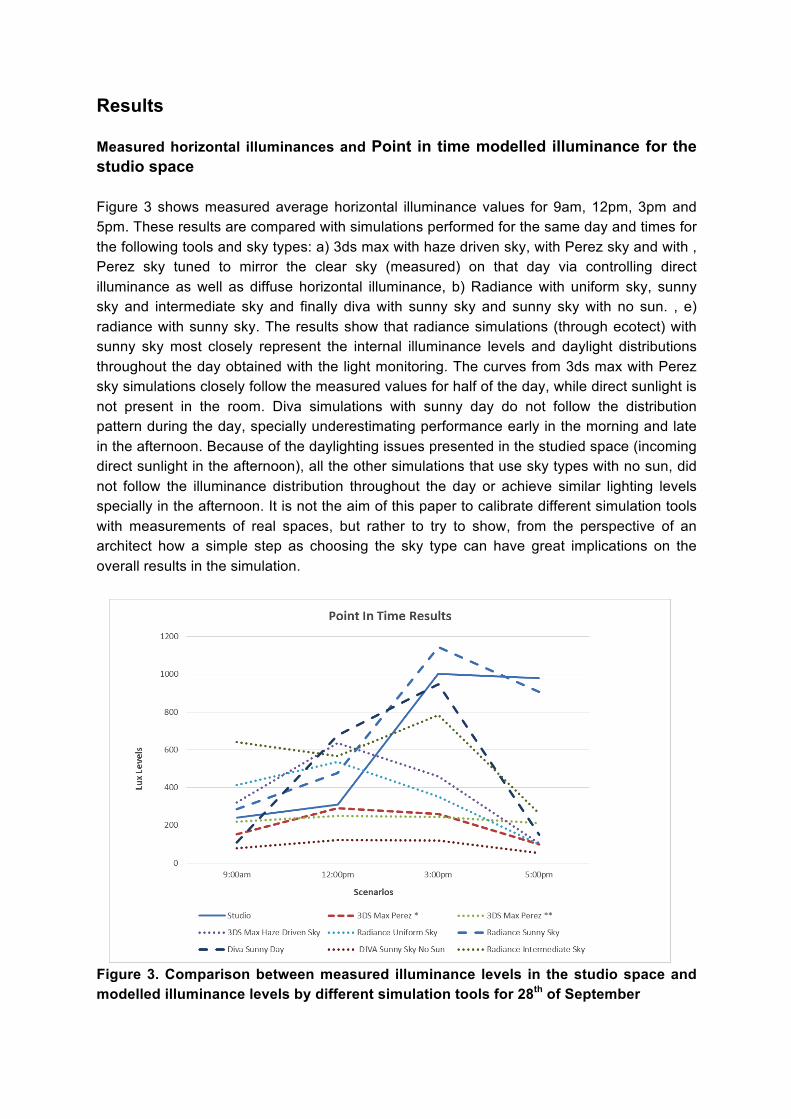
Figure 3 shows measured average horizontal illuminance values for 9am, 12pm, 3pm and 5pm. These results are compared with simulations performed for the same day and times for the following tools and sky types: a) 3ds max with haze driven sky, with Perez sky and with , Perez sky tuned to mirror the clear sky (measured) on that day via controlling direct illuminance as well as diffuse horizontal illuminance, b) Radiance with uniform sky, sunny sky and intermediate sky and finally diva with sunny sky and sunny sky with no sun. , e) radiance with sunny sky. The results show that radiance simulations (through ecotect) with sunny sky most closely represent the internal illuminance levels and daylight distributions throughout the day obtained with the light monitoring. The curves from 3ds max with Perez sky simulations closely follow the measured values for half of the day, while direct sunlight is not present in the room. Diva simulations with sunny day do not follow the distribution pattern during the day, specially underestimating performance early in the morning and late in the afternoon. Because of the daylighting issues presented in the studied space (incoming direct sunlight in the afternoon), all the other simulations that use sky types with no sun, did not follow the illuminance distribution throughout the day or achieve similar lighting levels specially in the afternoon. It is not the aim of this paper to calibrate different simulation tools with measurements of real spaces, but rather to try to show, from the perspective of an architect how a simple step as choosing the sky type can have great implications on the overall results in the simulation.
Figure 3. Comparison between measured illuminance levels in the studio space and modelled illuminance levels by different simulation tools for 28th of September

Climate base metrics and Daylighting factor simulations
Certain packages are able to perform more metric simulations than others, a list of which can be seen in Table 2 below. Rhino w/ Diva was the most comprehensive being able to generate data on, DF, DA, DAv and UDI. For the testing of DIVA the SketchUp model was used due to IFC issues when trying to import the Revit model into Rhino (host program for the DIVA plugin).
Table 1. Time Period and Annual Data Abilities within Selected Software
3DS Max Ecotect Radiance Daysim Diva Su2ds
DF R** R R*** R R R***
DA R* R T R R R*** DAv R* T T T R R*** UDI R* T T R R R*** DAcon* T T T R T T
* Raw format requires processing through excel or other software. ** Prone to inaccuracy *** Not able to be tested due to incompatibility with current software
For 3DS Max climate-based simulations like DA, DAv, UDI and DAcon are convoluted, and requited a lot of manual inputs. For this reason it was not included in the ease of use comparison analysis. While radiance, which is a rendering program, in its base form can calculated data over a time period but cannot calculate dynamic data, therefore cannot calculate climate based. However its algorithms are implemented into other analysis software’s. Su2ds a direct plugin to Daysim for SketchUp required a complicated manual entering of analysis grid points via their x,y,z co-ordinates, making it easy for simple models, but impracticable for larger models so wasn’t tested.
Table 2. DF and Climate-based simulation comparison within Selected Software
3d Model Simulation Tool DF DA UDI Dav Revit Ecotect 5% 98% - -
Daysim - 71% 69% - SketchUp Ecotect 4% 93% - -
Daysim - 62% 66% - Diva 1% 28% 60% 24%
The simulations from the different software’s show very different results. UDI 100-2000 shows some correlations between all the diva and Daysim plug in for Revit and Sketch up. While DA (with a target of 300lux) results do not compare closely between Daysim, Diva, and specially the results for Ecotect (Daysim plug in). The error in Ecotect could be related to the DA calculations being locality based the algorithm is only applicable at latitudes of 40-60 degrees +/-degrees from the equator. Brisbane is located at 25 degrees from the equator, so Ecotect cannot be used for DA calculations. Another issue is the skylights (present in the space and modelled in the 3D models) seemed to be more effective in the Revit model, resulting in higher results. The differences between Diva and Daysim on the other hand, could be explained through the method used for Daysim analysis, which involved exporting
data from Ecotect. Ecotect was used as a medium to generate data for Daysim. And then, painstaking imputing a sensor grid data manually using scripting (steps that are somewhat outside the skill set required from architects). To obtain more comparable results between all the software’s, more testing, and further study of the models and simulations tools is necessary. However, for this research is a first step in analysis these tools, and from the architect/designer point of view (including skill sets).
Graphics
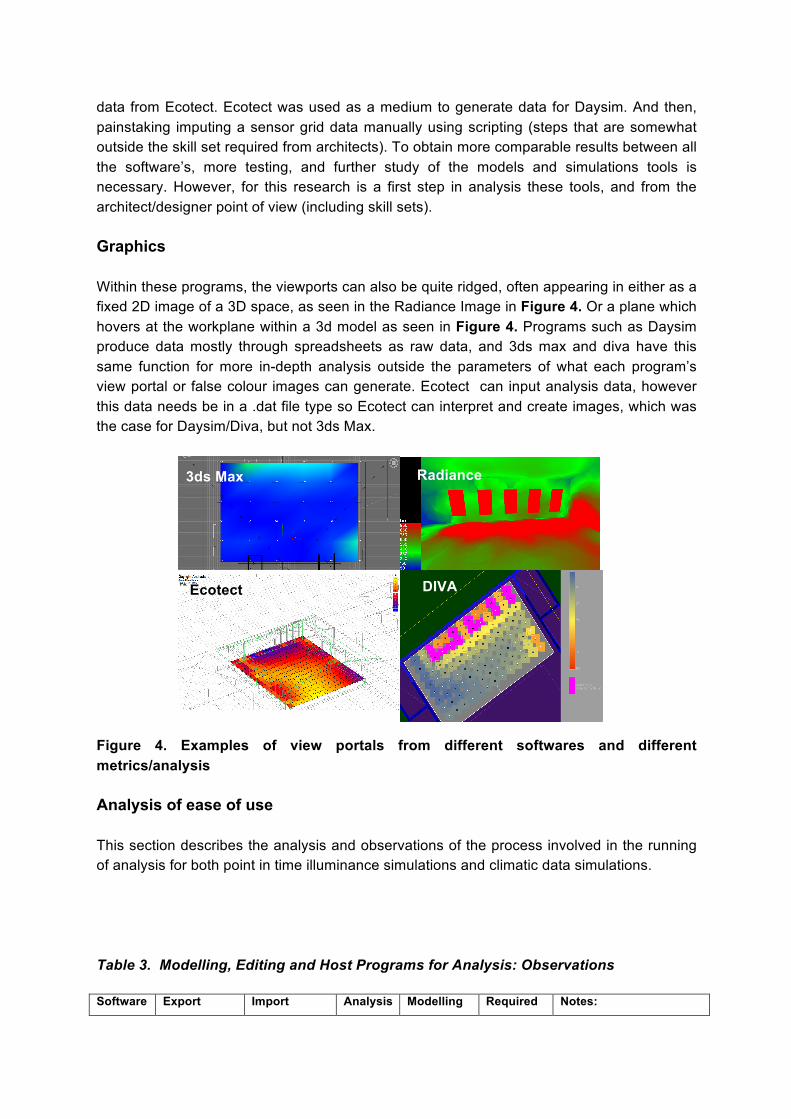
Within these programs, the viewports can also be quite ridged, often appearing in either as a fixed 2D image of a 3D space, as seen in the Radiance Image in Figure 4. Or a plane which hovers at the workplane within a 3d model as seen in Figure 4. Programs such as Daysim produce data mostly through spreadsheets as raw data, and 3ds max and diva have this same function for more in-depth analysis outside the parameters of what each program’s view portal or false colour images can generate. Ecotect can input analysis data, however this data needs be in a .dat file type so Ecotect can interpret and create images, which was the case for Daysim/Diva, but not 3ds Max.
Figure 4. Examples of view portals from different softwares and different metrics/analysis
Analysis of ease of use
This section describes the analysis and observations of the process involved in the running of analysis for both point in time illuminance simulations and climatic data simulations.
Table 3. Modelling, Editing and Host Programs for Analysis: Observations
Software Export Import Analysis Modelling Required Notes:
3ds Max Radiance
DIVA Ecotect

Table 4. Analysis Software Observations Part 1 of 2 Software Sky Renderer Raytracing Metrics Speed Sky Models Importability 3ds Max CIE
Perez Haze
Metal Ray Forward and Backward
DF, DA, DAv, UDI.
FAST SLOW SLOW SLOW
Overcast Clear Perez
Triangulation, great at retaining surface integrity.
Ecotect CIE Perez
none Split Flux Method
DF, DA.
FAST FAST
Uniform Overcast
Triangulation, loses surface integrity.
Radiance CIE Perez
Radiance Backward DF. FAST Sunny w/ Sun Sunny w/o Sun Intermediate w/ Sun Intermediate w/o Sun Overcast Sky Uniform Sky
Ecotect exports a dedicated radiance file for analysis. All model errors contained within modelling software.
Daysim Perez none Backward with Daylight Coefficient
DF, DA, UDI.
FAST SLOW SLOW
Perez As above due to Daysim being built upon radiance.
Diva CIE Perez
none Backward with Daylight Coefficient
DF, DA, DAv, UDI
FAST FAST FAST FAST
Clear Sky w/ Sun Clear Sky w/o Sun Cloudy Sky w/ Sun Cloudy Sky w/o Sun Uniform Custom (Perez) Perez
Some minor triangulation, North point data was lost on import. Most comprehensive Import options with fewest issues.
Table 4. Analysis Software Observations Part 2 of 2 Software Editing
Imported Geometry
Model Editing Interface
Analysis Interface
Analysis Viewports
Outcomes Notes
3ds Max Easy, Fast
Powerful, efficient, but complex
Complex Full 3D & 2d Viewports & 3D images
DF on Workplanes, Illuminance on Workplanes and surfaces. Raw data False Colour images
Raw data needs to be calculated though excel spreadsheets. Unique communication methods available through animation tools within 3ds Max
Options Options Plug-Ins Complexity Familiarity
3ds Max .FBX, .3DS, .DWG, .DGN, .DXF, .SKP, .XML
.FBX, .3DS,
.DWG, .DGN,
.DXF, .SKP,
.XML
Yes High Frequent Use
Complex program interface with multiple parameters to alter models requires prior experience
Revit .FBX, .3DS, .DWG, .DWF, .DGN, .DXF, .XML, .IFC
.DWG, .DGN,
.DXF, .SKP, Yes High Frequent
Use Works well exporting to 3ds Max, complex program requires prior experience
Rhino .3DM, .DXF, .DWG, .DGN, .SLDPRT, .FBX, .3DS, .RAW, .X, .SKP
.3DM.DXF
.DWG.3DS
.RAW.X
.WMF.TXT
.FBX.PLY
Yes High Infrequent Use
Not a common tool for modelling within Australia, simple program in terms of interface and usability
SketchUp
.FBX, .3DS,
.DWG, .DXF .3DS, .DWG, .DXF,.SKP
Yes Low Infrequent Use
Easy to use and install plug-ins. Exporting Directly into Radiance and Daysim requires experience with coding language and techniques.

Ecotect Difficult, Slow
Difficult, unlike modelling software
Simple Full 3d & some 2d Views & 3D images
Metrics and illuminance calculated on Workplanes
Imported data requires error checking, often large parts of the model needing to be redrawn or “traced” to fill missing surfaces.
Radiance n/a n/a Simple within Ecotect, Complex Standalone
3D images Illuminance on surfaces. (3D Image) False Colour images
Newer versions of radiance not compatible with Ecotect. Radiance own interface is limited. Direct importation from SketchUp through plug-ins still in Beta stages. Manual Method requires experience with coding language
Daysim n/a n/a Simple within Ecotect, Complex Standalone
n/a Metrics on Workplanes. In-depth PDF documents
Direct importation from plug-ins SketchUp still in Beta stages. Produces data that can be fed back into Ecotect to view the results effectively.
Diva Easy, Fast w/ Rhino
Simple, but a lack of tooltips.
Simple Full 3D & 2d Viewports & 3D images
Metrics on Workplanes In-depth PDF documents, False Colour Images.
Custom sky using direct horizontal irradiance can produces errors. Clear interface and comprehensive datasets from point in time calculations and climatic data.
Conclusion
The aim of this paper was to evaluate tools available (currently used and new tools) to architects for the analysis of daylight design and performance of buildings. To this end firstly the state of daylighting analysis in architectural firms within Brisbane was surveyed, and secondly the ease of use of the daylighting analysis tools was assessed. This assessment included: comparing modelled point in time simulations against a real scenario (studio space), climate based modelling of the studio space with different tools and observation of issues related to the process of creating models, adapting models and implementing for analysis.
The point in time illuminance calculations revealed that programs with common specific daylighting sky models that relate to realistic sky type lead to the most easily and realistic simulated results, furthermore, if the daylighting conditions can be recreated with direct and diffuse illuminance the results can be similar, however this leads to a variety of customizable options can easily confuse the user, which was seen with the use of Radiance and 3ds Max respectively. Radiance for indirect and direct were quite realistic, while 3ds Max for indirect results were realistic however, the direct component via the “Mr Sun” was difficult and produce inaccurate data without more specific data inputs. The simulations showed a direct correlation between the actual sky condition and the similar sky models used for analysis as seen in the Ecotect with Radiance and Rhino w/ Diva.
Climate-based simulations revealed that, Rhino as a modelling platform with the DIVA lighting analysis plug-in gives the most comprehensive data set when calculating daylighting metrics, being based on Daysim, DIVA, like Daysim generates documents that contains comprehensive data on illuminance measurements and glare ratings. Daysim as a plug-in
through Ecotect, unlike diva requires manual import to create visual data. However, while it is possible for 3ds Max/radiance software to easily produce point in time data, climate based analysis requires a much more time intensive method, by illuminance data input via spreadsheet data analysis. This same method can be done with radiance, however the advantage of Daysim, Diva and Ecotect, is that the same can be achieved in a much simpler way through their respective interfaces.
The most adaptable method for daylighting analysis within architectural practice at this point in time, is using programs what integrate effectively with current BIM based or modelling solutions, and as seen in the poll the majority of firms report modelling with either Revit (BIM based) or SketchUp. Integration with Revit workflow is possible and efficient using Ecotect with the appropriate lighting analysis software (Radiance and daysim), while integration with SketchUp, is not as efficient, as a more manual approach is required due to the scripting based plug-ins. These methods aren’t exactly architect friendly as advanced background in IT or scripting is required. Unless the users are looking to invest in either Ecotect, 3ds Max or Rhino w/ Diva. New programs are steadily being developed; existing plug-ins will likely be improved reducing the need to additional software.
Incompatibility between software is leading unknowing users to make design decisions on the assumption that these incompatibles are resolved within the software, and the results are correct. However this study has shown, they could be incorrect. More help features concerning input data, and simpler methods for creating analysis grids should help solve these problems as well as the expansion of what file types are supported for analysis. With the advancement of BIM and other analysis software packages such as DIVA and the upcoming Vasari, the software as well as plug-in compatibility should improve and enable architects to use the latest metrics within their analysis for daylighting.
The study findings agree with previous studies in that current lighting software isn’t “architect friendly” (Attia et al., 2009). The processes and methods discussed within the paper reveals that some software could be more easily integrated into the current workflow of an architect than others. Although the process for daylighting analysis of 3d models using third party solutions is improving, to obtain more reliable results the user may need to purchase additional modelling software so they can gain access to the desired analysis software (i.e. Rhino and Diva). This issue may be resolved via the use of plugins, however, they are bounded by scripting and algorithms and can be troublesome for architects. Finally, the development of a method that can facilitate the understanding of how the data is processed could give architects an understanding of what a realistic result should look like. Ultimately giving architects the ability to overcome these shortcomings enabling them to use these complex metrics to benefit their design process and producing better outcomes for their clients, environment, profession and industry.
REFERENCES:
1. ATTIA, S., BELTRAN, L., DE HERDE, A. & HENSEN, J. 2009. "Architect Friendly": A Comparison of Ten Different Building Performance Simulation Tools. IBPSA. Glasgow, Scotland.

2. AUSTRALIAN BUILDING CODES BOARD 2011. National Construction Code series 2011, Canberra, ABCB.
3. BRE GLOBAL LTD 2011. BREEAM 2011 New Construction Technical Guide. BRE
Global Ltd,. 4. GREEN BUILDING COUNCIL OF AUSTRALIA 2008. Green star office design & office
as built: technical manual, Sydney, Green Building Council of Australia.
5. GALASIU, A. D., & REINHART, C. F. 2008. Current daylighting design practice: Building Research & Information, 36(2), 159–174.
6. LEE, K., CHIN, S. & KIM, J. 2003. A Core System for Design Information Management
Using Industry Foundation Classes. Computer-Aided Civil and Infrastructure Engineering, 18, 286-298.
7. LEE, Y. S. & GUERIN, D. A. 2010. Indoor environmental quality differences between
office types in LEED-certified buildings in the US. Building and Environment, 45, 1104-1112.
8. MARDALJEVIC, J. 2001. The BRE-IDMP dataset: a new benchmark for the validation of
illuminance prediction techniques. Lighting Research and Technology, 33, 117-136.
9. MARDALJEVIC, J. 2011. Opinion: Daylighting prescriptions: Keep taking the pills? Lighting Research & Technology, 43, 142-142.
10. MOON, P., SPENCER, D. E. 1942. Illumination from a non-uniform sky., New York,
Illum. Eng.
11. NABIL, A. & MARDALJEVIC, J. 2006. Useful daylight illuminances: A replacement for daylight factors. Energy & Buildings, 38, 905-913.
12. REINHART, C. & BRETON, P.-F. 2009. Experimental Validation of Autodesk® 3ds
Max® Design 2009 and Daysim 3.0. Leukos, 6, 7-35.
13. REINHART, C., LANDRY, MARION., BRETON, PIERRE-FELIX. 2009. Daylight Simulation in 3ds Max Design 2009 - Getting Started. Autodesk White Paper.
14. REINHART, C., MARDALJEVIC, J. & ROGERS, Z. 2006. Dynamic Daylight
Performance Metrics for Sustainable Building Design. Leukos, 3, 7.
15. STANDARDS AUSTRALIA 2006. Interior and workplace lighting Part 1: General prinicples and recommendations. AS NZS 1680.1. 2006 ed. Sydney: Standards Australia,.
16. THOMPSON, J., DONN, M., OSBORNE, J. 2011. Variation of Green Building Ratings
Due to Variances in Sky Definitions. Proceedings of Building Simulation 2011:12th Conference of International Building Performance Simulation Assoication. Sydney, 14-16 November.