Embed Size (px)
Citation preview

This is the author’s version of a work that was submitted/accepted for pub-lication in the following source:
Campbell, Patrick G., Peake, Jonathan M., & Minett, Geoffrey M.(2018)The specificity of Rugby Union training sessions in preparation for matchdemands.International Journal of Sports Physiology and Performance, 13(4), pp.496-503.
This file was downloaded from: https://eprints.qut.edu.au/111974/
c© 2017 Human Kinetics
Notice: Changes introduced as a result of publishing processes such ascopy-editing and formatting may not be reflected in this document. For adefinitive version of this work, please refer to the published source:
https://doi.org/10.1123/ijspp.2017-0082

1
Title: The specificity of rugby union training sessions in 1
preparation for match demands 2
Submission type: Original Investigation 3
Authors: Patrick G Campbell1,2, Jonathan M Peake2,3, and 4
Geoffrey M Minett1,2 5
Affiliations: 1 School of Exercise and Nutrition Sciences, 6
Queensland University of Technology, Kelvin 7
Grove, QLD, Australia 8
2 Institute of Health and Biomedical Innovation, 9
Queensland University of Technology, Kelvin 10
Grove, QLD, Australia 11
3 School of Biomedical Sciences, Queensland 12
University of Technology, Kelvin Grove, QLD, 13
Australia 14
15
Correspondence: Patrick Campbell 16
School of Exercise and Nutrition 17
Sciences 18
Faculty of Health 19
Queensland University of 20
Technology 21
Victoria Park Road, Kelvin 22
Grove QLD 4059 23
Telephone: +61 7 31386096 24
Email: 25
27
Running title: Comparison of training and match demands 28
29
Keywords: Physical preparation, team sport, athlete 30
development, time-motion analysis, game-specific skills 31
32
Word count: 3592 33
Abstract word count: 246 34
Number of figures: 2 35
Number of tables: 3 36
37

2
Abstract 38
Purpose: Investigations into the specificity of rugby union 39
training practices in preparation for competitive demands has 40
predominantly focussed on physical and physiological demands. 41
The evaluation of the contextual variance in perceptual strain or 42
skill requirements between training and matches in rugby union 43
is unclear, yet holistic understanding may assist to optimise 44
training design. This study evaluated the specificity of physical, 45
physiological, perceptual and skill demands of training sessions 46
compared with competitive match-play in pre-professional, elite 47
club rugby union. Methods: Global positioning system (GPS) 48
devices, video capture, heart rate (HR), and session ratings of 49
perceived exertion (sRPE) were used to assess movement 50
patterns, skill completions, physiologic, and perceptual 51
responses, respectively. Data were collected across a season 52
(training sessions n=29; matches n=14). Participants (n=32) 53
were grouped in playing positions as: outside backs, centres, 54
halves, loose forwards, lock forwards, and front row forwards. 55
Results: Greater total distance, low-intensity activity, maximal 56
speed and metres per min were apparent in matches compared to 57
training in all positions (P<0.02; d>0.90). Similarly, match HR, 58
and sRPE responses were higher than those recorded in training 59
(P<0.05; d>0.8). Key skill completions for forwards (i.e., 60
scrums, rucks and lineouts) and backs (i.e., kicks) were greater 61
under match conditions than in training (P<0.001; d>1.50). 62
Conclusion: Considerable disparities exist between the 63
perceptual, physiological, and key skill demands of competitive 64
matches versus training sessions in pre-professional rugby union 65
players. Practitioners should consider the specificity of training 66
tasks for pre-professional rugby players to ensure the best 67
preparation for match demands. 68
Introduction 69
The specificity of training principle states that training 70
adaptations are closely related to the training stimulus, and is 71
considered important to optimise physical performance 72 1. Training practices in rugby union have predominantly 73
focussed on the physical and physiological demands of match-74
play alone 2-4. Notably, this contrasts the multifaceted position-75
specific demands of rugby union competition 5,6. The differences 76
in physical and physiological characteristics of rugby union 77
training and competitive matches have been reported 3,4, yet no 78
data exists to evaluate contextual variance in perceptual strain or 79
skill requirements. Omitting the considerable perceptual and 80
skill demands of rugby union provides a limited analysis of 81
training and match-play. Accordingly, additional analysis of 82
rugby union is required to understand the position-specific, 83
broad and multifactorial demands of rugby union. Of particular 84

3
importance is the specificity of current training practices in 85
preparation for competitive match demands. 86
Rugby coaching practices are anecdotally known to 87
extensively utilise strategies that remove the performance 88
context from the skill (e.g., unopposed or passive skills practice) 89 7. It is unclear if this interpretation is justified, and if accurate, 90
whether these training practices differ from rugby union match 91
activities, as suggested in other sports 8. The current literature 92
clearly recommends designing skills-focused training sessions to 93
be representative of the competitive environment, which imitates 94
the variable nature of a match 7,9. While some evidence suggests 95
that match-specific or games-based training has increased in 96
professional teams 3,4, this may point to a difference in training 97
method used between elite and pre-elite coaches. Providing a 98
broad, multidisciplinary analysis of training and match demands 99
could afford insight into such a discrepancy between coaches 100
and playing standards. This data may have particular 101
implications for pre-professional players, because the 102
understanding of match demands is proposed as the first step in 103
the development of an elite rugby union player 10. 104
Although the physical and physiological demands of 105
professional 5,11 and adolescent 2 rugby union matches have been 106
established, less is known about these demands at the pre-107
professional standard. Importantly, elite club, pre-professional 108
rugby union provides a platform for the development of 109
emerging players. For example, current elite club rugby players 110
are often presently, or previously involved in professional clubs. 111
The Australian Rugby Union development and competition 112
pathway indicates elite club, pre-professional rugby as a 113
consistent component in player development. Identifying the 114
physical, physiological, perceptual and skill demands could have 115
important implications for players transitioning into professional 116
rugby union. Understanding specific skill outputs and physical 117
demands during matches may also assist in identifying potential 118
training limitations and providing opportunities to enhance 119
performance outcomes. The aim of this study was to examine the 120
position-specific physiological, perceptual and skill demand 121
requirements of pre-professional rugby players in matches and 122
training sessions. The specificity of current on-field rugby 123
training sessions was then compared with competitive match-124
play demands. 125
Methods 126
Participants 127
Thirty-two male Premier Grade club rugby union players 128
volunteered to participate in this study (24 ± 4 y, 88 ± 20 kg, 177 129
± 10 cm). At the time of data collection, participants were highly 130
trained individuals, free of injury and collectively had 131

4
experienced four different standards of representative rugby 132
union playing experience: a) Queensland Reds U20 (n = 3), b) 133
Australian U20 (n = 3), c) National Rugby Championship (n = 134
12), d) Super 15 Rugby experience (n = 10). Additionally, 135
participants were completing at least three rugby sessions (two 136
training, one match) and two to three resistance training sessions 137
per week (on-field training time = 147 ± 46.7 min.week-1). All 138
participants provided written informed consent, and ethics 139
approval for study procedures was provided by the University 140
Human Research Ethics Committee. 141
Overview 142
An observational time-motion analysis study was conducted 143
throughout a season of a Premier Grade rugby union competition 144
(Brisbane, Australia) to examine the movement patterns, skill 145
demands and perceptual exertion required of pre-professional 146
players. Players were familiar with all measures as part of their 147
normal monitoring routine. Data were collected throughout the 148
competition period (spanning 19 weeks) to evaluate the key 149
physical (i.e., movement patterns, skill completions), 150
physiological (i.e., heart rate), and subjective markers (i.e., 151
perceived exertion) of rugby union performance during on-field 152
rugby training sessions (n = 29; 294 observations) and 153
competitive matches (n = 14; 146 observations). Training 154
sessions typically consisted of the following elements: warm-up 155
(12.9 ± 7.1 min.week-1), conditioning (19.4 ± 12.9 min.week-1), 156
forward (24.8 ± 5.1 min.week-1) and backs (20.8 ± 5.0 min.week-157 1), unit skills, captain’s run (15.2 ± 7.9 min.week-1), and modified 158
game periods (20.4 ± 7.2 min.week-1). 159
Eleven injury-free Premier Grade squad players were randomly 160
selected for involvement each week to accommodate the limited 161
global positioning satellite (GPS) devices available to record 162
movement patterns. Participants wore the same GPS unit during 163
that week’s training and match. The frequency of skill 164
completions was coded using video footage after each session. 165
Similarly, a session rating of perceived exertion (sRPE) was 166
recorded 30 min following training and match-play. Data were 167
divided into six position groups: outside backs (n = 57 training, 168
26 match (85.5 ± 9.5 min.match-1) observations); wingers (n = 169
29 training, 13 match (88.4 ± 4.2 min.match-1) observations; 170
centres (n = 21 training, 11 match (85.3 ± 12.6 min.match-1) 171
observations); halves (n = 53 training, 25 match (87.2 ± 10.1 172
min.match-1) observations); loose forwards (n = 63 training, 36 173
match (87.9 ± 5.6 min.match-1) observations); lock forwards (n 174
= 36 training, 14 match (81.7 ± 16.2 min.match-1) observations), 175
and front row forwards (n = 64 training, 34 match (80.8 ± 20.8 176
min.match-1) observations) to allow for specific comparisons 177
between playing positions. 178
Measures 179

5
External Load 180
Participants wore a GPS device (15 Hz; SPI HPU GPSports, 181
Canberra, Australia) during all training sessions and competitive 182
matches. The devices were harnessed to the upper thoracic spine 183
between the superior sections of the scapulae. Raw GPS data 184
were downloaded post-session to a personal laptop running 185
specialised software (Team AMS, GPSports, Canberra, 186
Australia). This GPS device reportedly demonstrates a 1.9% 187
typical error of measurement (TEM) and 0.20 intra-class 188
correlation (ICC) for total distance measured, and a TEM of 189
8.1% and ICC of 0.14 for peak speed 12. The movement pattern 190
variables included for analysis comprised: total distance, mean 191
speed, sprint count and very high-intensity activity (VHIA; >20 192
km·h-1) 13,14. GPS variables were processed as both absolute 193
forms and relative to time. 194
Internal Load 195
Players wore a heart rate (HR) transmitter belt (T34, Polar 196
Electro-Oy, Kempele, Finland), with the data recorded 197
synchronously with the GPS device and downloaded post-198
session to a personal laptop running specialised software (Team 199
AMS, GPSports, Canberra, Australia). Recorded game and 200
training HR was categorised into six pre-determined HR zones. 201
The HR maximum, mean HR and HR Zone 4-6 were included in 202
the data analysis. The HR zones were categorised as: Zone 4 203
(160-170 beats.min-1), Zone 5 (170-180 beats.min-1) and Zone 6 204
(180-220 beats.min-1) 15. HR Zones were presented as the time 205
spent within each zone throughout training and match-play. 206
Perceptual measures of internal load were collected using the 207
sRPE method 16. Participants recorded sRPE (Borg’s CR-10 208
scale) 30 min after all training and competitive matches using a 209
smartphone application (SportsMed Global, Newstead, 210
Australia). 211
Skill Notational Analysis 212
Video recordings of all sessions were performed using a digital 213
camcorder (Legria HF R506, Canon, Tokyo, Japan) positioned 214
on a stationary tripod 35 m above the height of the playing field. 215
The footage was taken from a vantage point 1020 m from the 216
field either side of the 22 m and halfway lines. All video footage 217
was recorded onto a digital SD card (SDHCTM UHS-I, SanDisk, 218
Sydney, Australia). All video recordings were then analysed 219
post-session for frequency and volume of key match event 220
demands that are specific to backs and forwards 6,11,17,18. One 221
analyst performed coding of each video recording. The key 222
match event demands analysed in absolute form and relative to 223
time included: passes, ball carries, tackles, kicks, kicks under 224
pressure, rucks, lineouts (attack and defence), and scrums. 225
Analysis of ten match and training files were performed in 226

6
duplicate to ensure the reliability of the data. Reliability of all 227
notational skill variables demonstrate 0.0 – 8.5% standard error 228
of measurement and ICC equal to 0.93 – 1.0. 229
Statistical Analysis 230
Data are reported as a mean ± standard deviation unless 231
otherwise specified. Movement pattern and skill variable values 232
were normalised to time and divided into positional playing 233
groups for both training and match comparisons. A one-way 234 analysis of variance with Tukey corrected post hoc analysis was 235
used to determine differences between training and match-play 236
data specific to playing positions. The analysis was performed 237
using Statistical Package for Social Sciences (IBM SPSS v.22, 238
Chicago, USA). Significance was accepted when P<0.05. 239
Standardised effect sizes (Cohen’s d) were calculated by 240
dividing the mean difference (between positional groups and 241
training versus matches) by the average of their standard 242
deviations. Effect sizes were then evaluated based on the 243
smallest worthwhile difference, whereby an effect size of ≤0.2 is 244
trivial, 0.20.49 is small, 0.50.79 is medium, and ≥0.8 is large 245 19. 246
Results 247
External Load 248
Differences between Positional Groups 249
Running speed variables for matches and training are shown in 250
Table 1. Outside backs (P<0.001; d=1.63) and halves (P=0.02; 251
d=1.13) covered greater total distances than front row forwards 252
during match-play. Outside backs, centres and halves also 253 accumulated greater total distances than loose forwards and front 254
row forwards in training (P<0.001–0.004; d=0.84–1.47). 255
Outside backs completed more VHIA during competitive 256
matches than other playing positions (P<0.001; d=1.54–3.46), 257
with the exception of centres only (P=0.321; d=0.8). Similarly, 258
centres completed more VHIA than all forwards (P<0.001–0.04; 259
d=1.51–2.70), while halves also attained more VHIA than front 260
row forwards during competitive matches (P<0.001; d=1.01–261
2.47). 262
Outside backs and halves achieved greater maximum speeds 263
than loose forwards, lock forwards and front row forwards 264
during competitive matches (P<0.001–0.01; d=1.35–3.34). 265
Centres and loose forwards also attained higher speeds than front 266
row forwards during competitive match-play (P<0.009; d=1.04–267
2.29). Outside backs and halves maintained a higher average 268
speed than front row forwards during competitive match-play 269
(P<0.001–0.01; d=1.09–1.64). Centres and halves attained a 270 higher sprint count during competitive match-play than loose 271
forwards, lock forwards and front row forwards, while outside 272

7
backs were higher in both categories than front row forwards 273
(P<0.001–0.02; d=0.98–2.90). Notably, maximum speeds were 274
higher during matches for outside backs, centres, halves and 275
loose forwards than in training (P<0.001–0.01; d=0.93–2.00). 276
Differences between Training and Matches 277
Comparisons between matches and training showed that outside 278
backs, loose forwards and front row forwards all covered greater 279
total distances compared with training (P<0.001; d=1.01–2.05). 280
Relative analyses (mmin-1) indicated that loose and front row 281
forwards completed higher activity output during competitive 282 match-play compared with full training sessions (P=0.013–283
0.015; d=1.70–1.82). There were no differences observed in 284
absolute comparisons between competitive matches and training 285
for VHIA (P=0.083–0.982; d=0.01–0.61). 286
Internal Load 287
Heart Rate 288
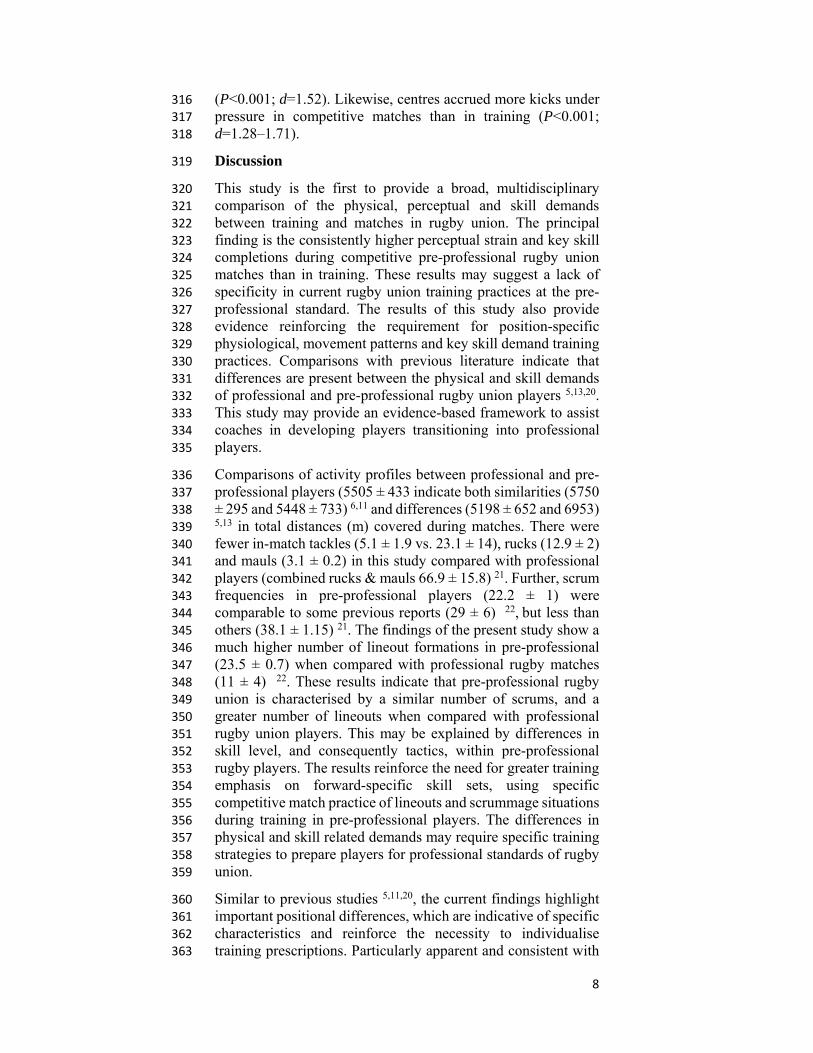
Figure 1 indicates differences between competitive matches and 289
training for average HR and HR Zones 4-6. Results show more 290
time was spent within HR Zones 4, 5 and 6 during competitive 291
matches than training sessions in all positional groups, except 292
centres in HR Zone 4 (P<0.001–0.02; d=0.80–2.62). 293
Session Rating of Perceived Exertion 294
Higher sRPE values were reported after competitive matches 295
when compared to training for all positional groups (Figure 2, 296
P<0.001–0.03; d=1.24–2.92).297
Skill Notational Analysis 298
Differences between Positional Groups 299
Skill completion frequencies for backs and forwards are 300
displayed in Table 2 and Table 3, respectively. All forward 301
positions completed more ruck involvements during matches 302
than any backline player (P<0.001; d=1.42–4.96), with lock 303
forwards completing more involvements than front row forwards 304
(P=0.012; d=1.03). Outside backs made more kicks than centres 305
and halves during competitive matches (P<0.001; d=1.26–1.62). 306
However, the halves made more kicks under pressure and passes 307
than the outside backs and centres (P<0.008; d=1.14–2.52). 308
Differences between Training and Matches 309
Competitive match-play involved greater quantities of opposed 310
rucking, scrum, lineout attack and lineout defence occurrences 311
(P<0.001; d=1.62–8.25) for all forward positions compared with 312
training sessions in absolute and relative conditions. 313
Competitive matches involved a higher number of kicks in 314
absolute and relative analyses for outside backs than training 315
8
(P<0.001; d=1.52). Likewise, centres accrued more kicks under 316
pressure in competitive matches than in training (P<0.001; 317
d=1.28–1.71). 318
Discussion 319
This study is the first to provide a broad, multidisciplinary 320
comparison of the physical, perceptual and skill demands 321
between training and matches in rugby union. The principal 322
finding is the consistently higher perceptual strain and key skill 323 completions during competitive pre-professional rugby union 324
matches than in training. These results may suggest a lack of 325
specificity in current rugby union training practices at the pre-326
professional standard. The results of this study also provide 327
evidence reinforcing the requirement for position-specific 328
physiological, movement patterns and key skill demand training 329
practices. Comparisons with previous literature indicate that 330
differences are present between the physical and skill demands 331
of professional and pre-professional rugby union players 5,13,20. 332
This study may provide an evidence-based framework to assist 333
coaches in developing players transitioning into professional 334
players. 335
Comparisons of activity profiles between professional and pre-336
professional players (5505 ± 433 indicate both similarities (5750 337
± 295 and 5448 ± 733) 6,11 and differences (5198 ± 652 and 6953) 338 5,13 in total distances (m) covered during matches. There were 339
fewer in-match tackles (5.1 ± 1.9 vs. 23.1 ± 14), rucks (12.9 ± 2) 340 and mauls (3.1 ± 0.2) in this study compared with professional 341
players (combined rucks & mauls 66.9 ± 15.8) 21. Further, scrum 342
frequencies in pre-professional players (22.2 ± 1) were 343
comparable to some previous reports (29 ± 6) 22, but less than 344
others (38.1 ± 1.15) 21. The findings of the present study show a 345
much higher number of lineout formations in pre-professional 346
(23.5 ± 0.7) when compared with professional rugby matches 347
(11 ± 4) 22. These results indicate that pre-professional rugby 348
union is characterised by a similar number of scrums, and a 349
greater number of lineouts when compared with professional 350
rugby union players. This may be explained by differences in 351
skill level, and consequently tactics, within pre-professional 352
rugby players. The results reinforce the need for greater training 353
emphasis on forward-specific skill sets, using specific 354
competitive match practice of lineouts and scrummage situations 355
during training in pre-professional players. The differences in 356
physical and skill related demands may require specific training 357
strategies to prepare players for professional standards of rugby 358
union. 359
Similar to previous studies 5,11,20, the current findings highlight 360
important positional differences, which are indicative of specific 361
characteristics and reinforce the necessity to individualise 362
training prescriptions. Particularly apparent and consistent with 363

9
studies in professional players, positional differences were found 364
in maximum speed, sprint count and very-high-intensity activity 365
ranges. Backline players accumulated greater distances in these 366
zones due to their specific traits (e.g., greater speed) 6,22 and 367
game requirements (e.g., set-plays) that allows for higher 368
running speeds to be achieved. In contrast, match demands 369
experienced by forwards reflected greater amounts of physical 370
interactions (e.g., tackles, rucks, scrums and lineouts) compared 371
to the backs. Such observations might indicate a need for training 372
to incorporate repeated exposures to high-intensity activities 373
(static and dynamic), with a greater emphasis on speed and 374
endurance for backs, versus strength and physical contacts for 375
forwards. 376
Interestingly, activity pattern data suggest that pre-professional 377
rugby union players may be well prepared for the high-intensity 378
and sprint running demands of match-play (Table 1). This result 379
is in contrast with existing literature typically reporting training 380
sessions to involve significantly less high-intensity running 381
demands than competition 2,3. It is possible that this is an 382
example of differences in elite and pre-elite coaching practices, 383
whereby coaches of professional players may be more likely to 384
utilise games-based scenarios that are known to involve less 385
high-intensity running 4. Alternatively, these coaches may 386
implement a high volume of repeated sprint scenarios in training 387
based on evidence that repeat sprint ability is an important 388
quality for team sport performance 23. These findings 389
demonstrate the need for more research providing comparisons 390
between matches and training. 391
Training approaches aim to develop specific athletic qualities 392
(e.g., physical, psychological, perceptual and technical/tactical 393
skills) to maximise preparedness for the competitive 394
environment. This is consistent with the longstanding belief 395
among team sport coaches that players should train the way they 396
play 24. In practice, this requires training to simulate and 397
represent the inherently dynamic and variable nature of 398
competitive match-play 7,9,25. However, clear differences in load 399
were apparent in the current data, with both heart rate (Figure 1) 400
and perceptual (sRPE; Figure 2) responses higher during 401
matches than in training. This may be reflective of the greater 402
physiological, skill-demand, emotional and psychological 403
stressors involved in decision-making scenarios occurring 404
throughout competitive matches 13. Rugby matches involve 405
substantial incidences and time spent within intense static or 406
low-movement situations (e.g., rucks, scrums). These bouts of 407
physical effort will register as low-intensity activity by a GPS; 408
however, intense static muscular contractions will produce 409
marked HR responses13. The results of the study appear to 410
substantiate this, with players experiencing greater absolute and 411
relative incidences of skill scenarios such as contested kicking, 412

10
lineouts, ruck and scrums during matches when compared with 413
training (Table 2 and 3). 414
These findings appear to support the anecdotal belief that 415
training sessions largely consist of skills performed in isolated 416
environments removed from performance contexts 8. From a 417
match skill demand perspective, previous research has shown 418
changes in decision making based on player positioning 26 and 419
variations in movement based on specific task constraints 27. The 420
results of the present study would appear to support the need for 421
rugby union training to incorporate greater volume and 422
specificity of skill demands (e.g., contested/opposed lineouts, 423
scrums, rucking and kicking practice). 424
Despite evidence emphasising the importance of training 425
specificity in improving performance 1,3, it should be expected 426
that competitive matches include aspects that are different to 427
training sessions. Attempts to precisely replicate match-play 428
during training would likely both decrease skill acquisition and 429
overgeneralise the complex multifactorial strategies of position-430
specific physical, psychological, technical and tactical 431
development. Coaches are also reluctant to place athletes at 432
further risk of injury during training sessions, particularly 433
throughout in-season periods 24. Although a balance between the 434
risk (i.e., fatigue and injury) and reward (i.e., match 435
performance) must be managed, the specificity of current rugby 436
union training practices may be inadequate to elicit optimal 437
training adaptations in a specific practice environment that align 438
with the competitive match-play 3,7. 439
Training approaches could be developed that are centred on the 440
integrative and concurrent development of necessary qualities. 441
For example, previous recommendations of skill-based 442
conditioning games and tactical metabolic conditioning 443
scenarios can be periodised into training practices 28. This 444
affords the development of a combined tactical and technical 445
approach within environments that imitate competitive matches. 446
The use of modified games requires players to adapt to changing 447
environmental and task constraints (i.e., the positioning of other 448
players, ball positioning, opposition, referee, the wind, sunlight, 449
etc.) 26,27 and make modifications to their decisions and 450
consequent actions. Additional benefits may be seen while 451
training in a fatigued state, as this has been shown to impair 452
cognitive decision-making skills, and is effective in replicating 453
match-play scenarios 5,29. 454
The development of practical solutions to both address the lack 455
of representative match scenarios during training sessions, and 456
to assuage injury risk concerns by coaches is clearly required 24. 457
The use of personal protective gear (body armour/padding) and 458
a modification of the skill or situation could provide methods to 459
prepare for these scenarios, and decrease potential injury risk. 460

11
While careful interpretation of the findings should be applied, 461
alongside practical considerations, it is clear that improvements 462
can be made to pre-professional rugby union training practices. 463
Practical Applications 464
Comparisons between competitive matches and training provide 465
frameworks to develop specific training stimuli, which should 466
efficiently and effectively prepare players for competitive 467
demands. The current study findings indicate the specificity of 468 current rugby union training practices may be inadequate to elicit 469
optimal training adaptations in a specific practice environment 470
that matches competitive demands 3,7. Previous research 471
identifying that successful teams win more lineouts on the 472
oppositions throw and are effective at stealing the ball in rucking 473
situations, may provide greater emphasis to these findings 17,18. 474
Coaches should attempt to provide position-specific training 475
methodologies to prepare pre-professional rugby union players 476
for competitive match demands. The authors acknowledge the 477
study is limited by data from a single club and season. Future 478
work attempting to assess the efficacy of traditional practice 479
methods, including unopposed training against a constraints-480
based approach to training in multiple pre-professional rugby 481
union players should be undertaken. This may provide a 482
scientific framework for developing pre-professional players 483
and improving insights into the relative importance of training 484
specificity in contact sports. 485
Conclusion 486
This study provides the first insight into position-specific 487
physiological, perceptual and key match event requirements of 488
pre-professional rugby union training practices and competitive 489
matches. The results emphasise the discrepancies between match 490
demands and training sessions, particularly involving rucking, 491
scrummaging, lineouts and kicking situations. There is clearly 492
an apparent lack of specificity within on-field rugby union 493
training sessions, which may potentially impede training 494
attempts to maximise competitive performance. It is important 495
however to consider the practicalities in replicating match 496
demands during training sessions and the potential negative costs 497
involved. Nonetheless, the results indicate current rugby union 498
training strategies are sub-optimal in preparing players for 499
competitive demands, and new strategies may need to be 500
developed. 501
Acknowledgements 502
The authors have no conflicts of interest to declare. We would 503
like to thank Bryon Davis and Anita Sirotic for their support of 504
this project (SportsMed Corp, Newstead, Australia). Further, we 505
acknowledge Grant Jenkins (GPS Rugby Union Club, Ashgrove, 506
Australia) for his assistance in facilitating data collection, as well 507

12
as the participants for their cooperation and allowing this 508
research to be conducted. 509
References 510
1. Reilly T, Morris T, Whyte G. The specificity of training 511
prescription and physiological assessment: A review. J 512
Sports Sci. 2009;27(6):575-589. 513
2. Hartwig TB, Naughton G, Searl J. Motion analyses of 514
adolescent rugby union players: a comparison of 515
training and game demands. J Strength Cond Res. 516
2011;25(4):966-972. 517
3. Higham DG, Pyne DB, Anson JM, Hopkins WG, Eddy 518
A. Comparison of activity profiles and physiological 519
demands between international rugby sevens matches 520
and training. J Strength Cond Res. 2016;30(5):1287-521
1294. 522
4. Tee JC, Lambert MI, Coopoo Y. GPS comparison of 523
training activities and game demands of professional 524
rugby union. Int J Sports Sci Coach. 2016;11(2):200-525
211. 526
5. Roberts SP, Trewartha G, Higgitt RJ, El-Abd J, Stokes 527
KA. The physical demands of elite English rugby union. 528
J Sports Sci. 2008;26(8):825-833. 529
6. Quarrie KL, Hopkins WG, Anthony MJ, Gill ND. 530
Positional demands of international rugby union: 531
Evaluation of player actions and movements. J Sci Med 532
Sport. 2013;16(4):353-359. 533
7. Passos P, Araújo D, Davids K, Shuttleworth R. 534
Manipulating constraints to train decision making in 535
rugby union. Int J Sports Sci Coach. 2008;3(1):125-536
140. 537
8. Phillips E, Davids K, Renshaw I, Portus M. Expert 538
performance in sport and the dynamics of talent 539
development. Sports Med. 2010;40(4):271-283. 540
9. Pinder RA, Davids KW, Renshaw I, Araújo D. 541
Representative learning design and functionality of 542
research and practice in sport. J Sport Exerc Psychol. 543
2011;33(1):146-155. 544
10. Duthie GM. A framework for the physical development 545
of elite rugby union players. Int J Sports Physiol 546
Performance. 2006;1(1):2. 547
11. Jones MR, West DJ, Crewther BT, Cook CJ, Kilduff 548
LP. Quantifying positional and temporal movement 549
patterns in professional rugby union using global 550
positioning system. Eur J Sport Sci. 2015;15(6):488-551
496. 552
12. Johnston RJ, Watsford ML, Kelly SJ, Pine MJ, Spurrs 553
RW. Validity and interunit reliability of 10 Hz and 15 554
Hz GPS units for assessing athlete movement demands. 555
J Strength Cond Res. 2014;28(6):1649-1655 556

13
13. Cunniffe B, Proctor W, Baker JS, Davies B. An 557
evaluation of the physiological demands of elite rugby 558
union using global positioning system tracking 559
software. J Strength Cond Res. 2009;23(4):1195-1203. 560
14. Rampinini E, Coutts A, Castagna C, Sassi R, 561
Impellizzeri F. Variation in top level soccer match 562
performance. Int J Sports Med. 2007(28):1018-1024. 563
15. Portillo J, Abián P, Navia JA, Sánchez M, Abian-Vicen 564
J. Movement patterns in under-19 rugby union players: 565
Evaluation of physical demands by playing position. Int 566
J Perform Anal Sport. 2014;14(3):934-945. 567
16. Foster C, Florhaug JA, Franklin J, et al. A new 568
approach to monitoring exercise training. J Strength 569
Cond Res. 2001;15(1):109-115. 570
17. Vaz L, Van Rooyen M, Sampaio J. Rugby game-related 571
statistics that discriminate between winning and losing 572
teams in IRB and Super twelve close games. 573
J Sports Sci Med. 2010;9(1):51.. 574
18. Jones NM, Mellalieu SD, James N. Team performance 575
indicators as a function of winning and losing in rugby 576
union. Int J Perform Anal Sport. 2004;4(1):61-71. 577
19. Cohen J. Statistical power analysis for the behavioral 578
sciences (rev. Lawrence Erlbaum Associates, Inc; 1977. 579
20. Austin D, Gabbett T, Jenkins D. The physical demands 580
of Super 14 rugby union. J Sci Med Sport. 581
2011;14(3):259-263. 582
21. Deutsch M, Kearney G, Rehrer N. Time–motion 583
analysis of professional rugby union players during 584
match-play. J Sports Sci. 2007;25(4):461-472. 585
22. Eaton C, George K. Position specific rehabilitation for 586
rugby union players. Part I: Empirical movement 587
analysis data. Phys Ther Sport . 2006;7(1):22-29. 588
23. Spencer M, Bishop D, Dawson B, Goodman C. 589
Physiological and metabolic responses of repeated-590
sprint activities. Sports Med. 2005;35(12):1025-1044. 591
24. Dawson B, Hopkinson R, Appleby B, Stewart G, 592
Roberts C. Comparison of training activities and game 593
demands in the Australian Football League. J Sci Med 594
Sport. 2004;7(3):292-301. 595
25. Renshaw I, Chow JY, Davids K, Hammond J. A 596
constraints-led perspective to understanding skill 597
acquisition and game play: A basis for integration of 598
motor learning theory and physical education praxis? 599
Phys Educ Sport Pedagogy. 2010;15(2):117-137. 600
26. Passos P, Cordovil R, Fernandes O, Barreiros J. 601
Perceiving affordances in rugby union. J Sports Sci. 602
2012;30(11):1175-1182. 603
27. Pinder RA, Davids K, Renshaw I, Araújo D. 604
Manipulating informational constraints shapes 605

14
movement reorganization in interceptive actions. Atten 606
Percept Psychophys. 2011;73(4):1242-1254. 607
28. Gamble P. Periodization of Training for Team Sports 608
Athletes. Strength Cond J . 2006;28(5):56-66. 609
29. Gabbett TJ. Skill-based conditioning games as an 610
alternative to traditional conditioning for rugby league 611
players. J Strength Cond Res. 2006;20(2):306-315. 612
613

15
Table Headings.
Table 1. Mean ± SD for backs and forwards of total distance, metres per minute, very high intensity activity, maximum speed, sprint count and sprints per minute for competitive matches and training sessions.
* Significant difference and large effect size compared to the match (P < 0.05; d > 0.80).
a Significant difference compared with outside backs (P < 0.05).
b Significant difference compared with centres (P < 0.05).
c Significant difference compared with halves (P < 0.05).
d Significant difference compared with loose forwards (P < 0.05).
e Significant difference compared with lock forwards (P < 0.05).
1 Large effect size compared with outside backs (d > 0.80).
2 Large effect size compared with centres (d > 0.80).
3 Large effect size compared with halves (d > 0.80).
4 Large effect size compared with loose forwards (d > 0.80).
5 Large effect size compared with lock forwards (d > 0.80).
Table 2.
Notational Analysis (Mean ± SD) displayed in absolute and relative values during competitive matches and training sessions for backs.
* Significant difference and large effect size compared to the match (P < 0.05; d > 0.80).
a Significant difference compared with outside backs (P < 0.05).
b Significant difference compared with centres (P < 0.05).
1 Large effect size compared with outside backs (d > 0.80).
2 Large effect size compared with centres (d > 0.80).
Table 3. Notational Analysis (Mean ± SD) displayed in absolute and relative values during competitive matches and training sessions for forwards.
* Significant difference and large effect size compared to the match (P < 0.05; d > 0.80).

16
Figure Headings.
Figure 1. A comparison of competitive match and training session heart rate values.
* Significant difference and large effect size compared to the match (P < 0.05; d > 0.80).
Figure 2. A comparison of competitive match and training session sRPE values.
a Significant difference between matches and training sessions (P < 0.05).
1 Large effect size between matches and training sessions (d > 0.80).

17
Table 1. Mean ± SD for backs and forwards of total distance, metres per minute, very high intensity activity, maximum speed, sprint count and
sprints per minute for competitive matches and training sessions.
* Significant difference and large effect size compared to the match (P < 0.05; d > 0.80). a Significant difference compared with outside backs (P < 0.05). b Significant difference compared with centres (P < 0.05). c Significant difference compared with halves (P < 0.05). d Significant difference compared with loose forwards (P < 0.05). e Significant difference compared with lock forwards (P < 0.05). 1 Large effect size compared with outside backs (d > 0.80). 2 Large effect size compared with centres (d > 0.80). 3 Large effect size compared with halves (d > 0.80). 4 Large effect size compared with loose forwards (d > 0.80). 5 Large effect size compared with lock forwards (d > 0.80).
Position Variable Distance (m) Total (mmin-1) VHIA (m) VHIA (mmin-1) Max Speed (km·h-1) Sprint Count (n) Sprint (mmin-1)
Outside Backs Match 6166 ± 929 70.8 ± 8.1 400 ± 170 4.5 ± 1.8 30.5 ± 2.4 21.8 ± 8.3 0.2 ± 0.09
Training 4978 ± 1203* 59.7 ± 12.5 320 ± 202 3.8 ± 2.4 27.4 ± 1.8* 31.1 ± 17.9* 0.3 ± 0.201
Centres Match 5482 ± 11511 64.0 ± 7.7 308 ± 1521 3.5 ± 1.5 28.4 ± 2.41 28 ± 8.61 0.3 ± 0.07
Training 5217 ± 1208 59.7 ± 8.6 307 ± 173 3.4 ± 1.6 26.6 ± 1.4* 40.5 ± 15.5* 0.4 ± 0.172
Halves Match 5760 ± 885 66.2 ± 7.7 244 ± 110a1 2.7 ± 1.2 28.8 ± 2.21 27.4 ± 8.31 0.3 ± 0.09
Training 5259 ± 1345 60.8 ± 12.3 227 ± 230 2.6 ± 3.0 26 ± 2.1*a1 42.8 ± 18.3*a1, 0.4 ± 0.193
Loose-Forwards Match 5457 ± 7481 62.0 ± 7.8 159 ± 124a1,3 1.8 ± 1.4 26.1 ± 3.2a1,c3,2 19.2 ± 8.5b2,c3 0.2 ± 0.09
Training 4173 ± 1003*a1,b2,c3 48.4 ± 12.6* 129 ± 156a1,b2 1.4 ± 1.6 24.4 ± 2.0*a1,b2,c3 25.7 ± 19.4b2,c3 0.2 ± 0.22
Locks Match 5278 ± 12501 64.1 ± 6.2 159 ± 124a1,b2,3 1.9 ± 1.4 25.7 ± 2.8a1,c3,2 16.6 ± 7.9b2,c3,1 0.1 ± 0.08
Training 4698 ± 1120 54.1 ± 14.9 211 ± 208 2.3 ± 2.1 24.8 ± 2.2a1,b2 33.8 ± 21.2* 0.3 ± 0.245
Front Rows Match 4885 ± 1272a1,c3 61.6 ± 8.7 78 ± 76.3a1,b2,c3,4,5, 0.9 ± 0.8 23.8 ± 3.2a1,b2,c3,d4,5 12.6 ± 6.9a1,b2,c3,d4 0.1 ± 0.07
Training 4074 ± 974*a1,b2,c3,5 48.7 ± 12.4* 91.1 ± 80.2a1,b2,c3,e5 1.0 ± 0.9 23.3 ± 2.1a1,b2,c3,d4.e5 25.3 ± 19.2*b2,c3 0.2 ± 0.206

18
Table 2. Notational Analysis (Mean ± SD) displayed in absolute and relative values during competitive matches and training sessions for backs.
Position Outside Backs Centres Halves Variable Match Training Match Training Match Training Tackles 1.5 ± 1.0 1.1 ± 1.5 5.7 ± 2.6a1 2.9 ± 3.1*1 4.5 ± 2.4a1,b2 1.8 ± 2.2*
Tacklesmin-1 0.01 ± 0.01 0.01 ± 0.01 0.06 ± 0.02 0.03 ± 0.04 0.05 ± 0.02 0.02 ± 0.02 Kicks 6.6 ± 8.2 0.3 ± 0.9* 0.2 ± 0.8a1 0.1 ± 0.4 1.1 ± 2.9a1 0.6 ± 1.1
Kicksmin-1 0.07 ± 0.09 0.004 ± 0.01* 0.003 ± 0.01 0.001 ± 0.004 0.01 ± 0.03 0.006 ± 0.01 Kicks under pressure 1.1 ± 1.9 0.1 ± 0.4* 0.6 ± 0.7 0 ± 0*1 3.0 ± 2.4a1,b2 0.6 ± 1.1*a1
Kicks under pressuremin-1 0.01 ± 0.02 0.001 ± 0.004 0.006 ± 0.007 0.001 ± 0.004* 0.03 ± 0.02 0.008 ± 0.01 Passes 3.3 ± 2.2 8.6 ± 8.4* 4.6 ± 2.41 10.5 ± 10.0* 33.6 ± 15.2a1,b2 37.8 ± 20.6a1,b2
Passesmin-1 0.03 ± 0.02 0.10 ± 0.08 0.05 ± 0.02 0.12 ± 0.11 0.39 ± 0.17 0.44 ± 0.23
* Significant difference and large effect size compared to the match (P < 0.05; d > 0.80).
a Significant difference compared with outside backs (P < 0.05).
b Significant difference compared with centres (P < 0.05).
1 Large effect size compared with outside backs (d > 0.80).
2 Large effect size compared with centres (d > 0.80).

19
Table 3. Notational Analysis (Mean ± SD) displayed in absolute and relative values during competitive matches and training sessions for forwards.
Position Loose Forwards Locks Forwards Front Row Forwards Variable Match Training Match Training Match Training Tackles 7.2 ± 3.2a1,b2 2.4 ± 2.6*1 6.0 ± 2.9a1,3 2.4 ± 2.6*1 5.6 ± 3.0a1 1.7 ± 1.8*
Tacklesmin-1 0.08 ± 0.03 0.02 ± 0.04 0.07 ± 0.04 0.02 ± 0.02 0.07 ± 0.05 0.02 ± 0.02 Rucks 12.9 ± 4.2 1.3 ± 3.8* 15.0 ± 6.4 1.0 ± 4.1* 10.9 ± 4.5 1.2 ± 3.6*
Rucksmin-1 0.14 ± 0.04 0.01 ± 0.04* 0.20 ± 0.12 0.01 ± 0.04* 0.15 ± 0.13 0.01 ± 0.03* Mauls 3.1 ± 2.7 1.5 ± 3.0* 3.3 ± 3.0 1.9 ± 3.3 2.9 ± 2.6 1.8 ± 3.4
Maulsmin-1 0.03 ± 0.03 0.01 ± 0.03 0.03 ± 0.03 0.02 ± 0.03 0.04 ± 0.04 0.02 ± 0.04 Scrums 23.4 ± 3.9 1.8 ± 3.4* 21.4 ± 7.2 1.6 ± 3.2* 21.7 ± 5.5 1.6 ± 3.2*
Scrumsmin-1 0.27 ± 0.06 0.02 ± 0.06* 0.28 ± 0.13 0.01 ± 0.03* 0.31 ± 0.21 0.01 ± 0.03* Lineout Attack 12.7 ± 4.8 4.3 ± 5.9* 13.0 ± 5.1 4.1 ± 5.4* 12.2 ± 5.3 3.7 ± 5.3*
Lineout Attack.min-1 0.14 ± 0.05 0.05 ± 0.08* 0.16 ± 0.06 0.04 ± 0.06* 0.17 ± 0.13 0.04 ± 0.06* Lineout Defence 11.6 ± 2.7 4.1 ± 6.2* 10.2 ± 4.3 3.9 ± 5.6* 10.7 ± 3.6 3.5 ± 5.7*
Lineout Defencemin-1 0.13 ± 0.03 0.05 ± 0.08* 0.14 ± 0.09 0.04 ± 0.06 0.145± 0.07 0.04 ± 0.07* * Significant difference and large effect size compared to the match (P < 0.05; d > 0.80). a Significant difference compared with outside backs (P < 0.05). b Significant difference compared with centres (P < 0.05). c Significant difference compared with halves (P < 0.05). 1 Large effect size compared with outside backs (d > 0.80). 2 Large effect size compared with centres (d > 0.80). 3 Large effect size compared with halves (d > 0.80). 4 Large effect size compared with loose forwards (d > 0.80).

20
Figure 1. A comparison of competitive match and training session heart rate values.
* Significant difference and large effect size compared to the match (P < 0.05; d > 0.80).

21
Figure 2. A comparison of competitive match and training session sRPE values.
a Significant difference between matches and training (P < 0.05).
1 Large effect size between positions (d > 0.80).