Embed Size (px)
Citation preview

This is the author’s version of a work that was submitted/accepted for pub-lication in the following source:
Webb, Robert M., White, Ryan, & Young, Lachlan (2011) Industrial JIGmeasurements : survey measurements assisting QUT motorsport. SpatialScience Queensland E-Magazine, pp. 29-35.
This file was downloaded from: http://eprints.qut.edu.au/46612/
c© Copyright 2011 Queensland Regional Group of the Surveying andSpatial Sciences Institute Surveying and Spatial Sciences Institute
Copies and extracts from Spatial Science Queensland are permitted underthe Creative Commons framework on an Attribution and Share Alike basis.
Notice: Changes introduced as a result of publishing processes such ascopy-editing and formatting may not be reflected in this document. For adefinitive version of this work, please refer to the published source:
brought to you by COREView metadata, citation and similar papers at core.ac.uk
provided by Queensland University of Technology ePrints Archive

1
Industrial JIG Measurements: Survey Measurements assisting QUT Motorsport
Mr Ryan White Mr Lachlan Young
Final-year Spatial Science Students, Queensland University of Technology, Brisbane, Australia.
Mr Robert Webb
Spatial Science Program Coordinator, School of Urban Development,
Faculty of Built Environment & Engineering, Queensland University of Technology.
ABSTRACT:
This paper outlines our literature review background, investigation and practical application utilizing a precise optical survey level and total station technology for a specialist industrial measurement application. The practical part of the project was to measure and check specific critical features of the Industrial JIG assembly table used by the Queensland University of Technology (QUT) Motorsport group. The JIG is used in constructing a new Formula SAE race-car frame each year and is used throughout the racing season to check the production frame for twists, bends and potential stresses. The industrial JIG table required two survey approaches, firstly determination of the overall flatness throughout its’ steel base surface. Secondly was the validation of verticality of the steel uprights used to support and hold the race-car frame in place during construction and checking alignment for key suspension components. In addition the investigation brings realisations that there are far more accurate, efficient and economical technologies to be harnessed in industrial metrology. Keywords: Industrial Metrology, Photogrammetry, Precise Surveying, 3-D Modelling

2
INTRODUCTION QUT Motorsport group utilize a steel JIG table for construction and assembly of the formula race-car assembly. The aim of a rigid industrial JIG is to provide reliable dimensional control of 3-dimensional relationships for the consistent assembly of components. The JIG table to be surveyed forms a so-called “point-of-truth” from which the frame chassis and components are constructed and assembled each year and furthermore, throughout the racing season, the chassis frame is checked for warps, bends and stresses. The JIG table stands about 0.7m high and is 2.4m long and 1.2m wide. After consulting with the Motorsport team and supervisors it was established which critical features of the JIG table structure required checking, validation and modelling. The JIG table base required checking and modelling for flatness throughout its’ surface. Secondary to the flatness was the verticality of the upright structures used to support and hold the race-car chassis frame in place during construction. The verticality of these uprights was assumed to be fairly accurate; as they had been positioned and welded using laser cutting and welding devices. Our survey role was to confirm that this assumption was valid. This paper is written to highlight our findings and methodology using the equipment available to us through the University. It was also to provide guidance to the Motorsport team on the condition of the table and its upright structures, through verbal confirmation on the flatness, and by providing a thematic rise and fall map as a deliverable. In addition, this paper looks at other avenues of conducting the survey whilst achieving the same, or better, outcomes. The literature review showed with the advent of high accuracy photogrammetric technology allowing monitoring and measuring to be carried out in real time, along with the increasing availability and affordability of laser scanning systems. We have conducted research into these new and improving methods and have collated some of the techniques and processes being developed. Equipped with this new information, other methods for completing the task for QUT Motorsport were explored. Optical methods of metrology have been an integral part in the production of many engineering components. According to Schwenke et al (2002), in their paper entitled, ‘Optical Methods for Dimensional Metrology in Production Engineering’, metrology must be, “fast, accurate, robust and automated.” Recent innovations in optical technology have focussed us towards laser trackers and digital photogrammetry for metrology purposes (Estler et al, 2002: 587). It is with the improvement in computers and associated software that the development of these new industrial methods for measuring dimensions and coordinates can even be considered (Schwenke et al, 2002: 685). Despite the advancement in metrological applications the measurement of the QUT Motorsport team race-car was conducted using 2-D Levelling in order to examine the deformation (if any) of the industrial JIG. The surface level of the JIG needed to be checked to determine if it was within an acceptable deformation range. R.J. Hocken, N. Chakraborty, and C. Brown mention that,
“As we go into an era where engineered surfaces are becoming the rule, we expect that the instruments will play an increasingly important part in the development of manufacturing processes and quality control. With modern computers and our increasing ability to handle large volumes of data, the ability to “visualize” micro and even nano-scale surface geometry and parameters will be of increasing importance.” (Hocken et al, 2005:169).
QUT MOTORSPORT GROUP Formula SAE is an annual competition focused upon the design, construction and racing of a 610cc Formula race car. Teams entering the competitions are run and operated solely by university students, presenting them with the opportunity to further develop their skills in design, management, communication and research in a real-world environment. The final product is to be marketable to a hypothetical weekend auto-crosser. There are now six competitions worldwide, including Australasia, East & West Coast USA, Japan , United Kingdom and Italy . Each competition runs over a period of about four days, with teams being judged in both static and dynamic events, under criteria of innovation, cost effectiveness, ergonomics, aesthetics and performance. Teams compete directly against one another in all areas of the competition. For each event the best performing car receives the highest points and the rest are scored comparatively.

3
Chassis • Triangulated space frame - basic reliable structure.
• Chromoly 4130 steel – square and round hollow section tubes - easy to repair and durable.
Suspension • Unique set up designed for tight cornering events, three dampener and spring system, front and rear, third spring allows for tuning of bump and roll damping separately.
Braking • Front wheels – individual disc rotors and callipers, back - single inboard disk.
• Adjustable pedal box.
Engine • 2003 Yamaha YZF R6 engine, with a displacement of 599cc.
• Custom sump and lubrication delivery system.
• Detuned using custom intake and exhaust manifold - allow for more desirable power at lower engine revolutions, generates more torque at low speeds.
Electrical • MoTeC SDL with 8MB of memory to log data – various sensors log driver feedback, engine and suspension performance and diagnostics
• Steering Wheel - gear shifting and clutch controls via paddles. Includes displays of engine temperature, oil pressure, gear display, a tachometer and shift light.
Bodywork • Front to rear streamline stemming from nose cone to dual side pods, to reduce frontal area and drag.
• Carbon fibre, reinforced with epoxy resin – providing sufficient strength, flexibility and crack resistance.
Table 1: Brief overview of the current "The Ozanne" formula SAE race-car. (Source: WebPages for QUT Motorsport)
The competition is a valuable learning experience. Teamwork, communication and an effective time management plan are essential for success. Students also develop invaluable hands-on skills while seeing a project through from concept to completion. Presentation, marketing and budgeting are scored events of the competition. Driven by the enthusiasm to extend their learning and education beyond the classroom, students are annually presented with the challenge to fully design, manufacture and race a small open wheel race vehicle in the Australasian Formula SAE competition. Being a dynamic multidisciplinary project, QUT Motorsport provides practical experience for QUT students to apply theory taught in class and ultimately gain experience and skills in project management, design, budgeting, procurement and manufacturing processes.
With students coming from discipline areas including; mechanical, electrical, infomechatronics and avionics engineering, to industrial design, business and journalism and film and television, QUT Motorsport continues to grow from strength to strength each year in the pursuit of becoming Australia’s Number One FSAE team.
INDUSTRIAL METROLOGY: PAST, PRESENT & FUTURE The first article perused as part of our literature review was “STATE OF THE ART OF 3D MEASUREMENT SYSTEMS FOR INDUSTRIAL AND ENGINEERING APPLICATIONS” as prepared and delivered at Commission 6 of the 21st International Congress of FIG held in Brighton, United Kingdom from the 19th – 25th
July 1998, authored by Mark Shortis and Clive Fraser both from the Department of Geomatics in the University of Melbourne. This article out-looked the rapid development encountered in the close range photogrammetry field,
“The acceptance of optical systems is due to many factors. Perhaps the principal amongst these factors has been the continual improvement of theodolite and photogrammetric systems, partly due to advances in the technology and partly due the demands of industry.” Shortis, Fraser (1998).
The report then continues to look at the specific uses of photogrammetry and theodolite systems in industrial metrology and 3D measurement and imaging. Using a range of equipment theodolites, total stations, vision metrology and laser rangers were all assessed for their metrology capabilities.

4
In 1999 Fraser submitted a paper, “AUTOMATED VISION METROLOGY: A MATURE TECHNOLOGY FOR INDUSTRIAL INSPECTION AND ENGINEERING SURVEYS”, to the 6th East Asian Surveyors Congress, this time highlighting the achievements of his Department of Geomatics in the University of Melbourne, and in particular delves into the use of close range photogrammetry for three dimensional modelling for both monitoring and engineering applications. He discusses at length the advancements that had been made since the advent of computer based processing and capturing technology, and in recent years the strong advancement of the photogrammetry area from a very elite and specific area, to more user friendly applications and use. He alludes to two factors which caused the slow uptake of this highly efficient, precise and radically advancing technology, “…the measurement process was slow - in spite of the data capture being rapid - and it was perceived to be too skill intensive.” Fraser (1999). These two issues were overcome by automating the process, these changes came quickly, as it closely followed and kept pace with the leaps made by computer technology. Better resolution cameras, faster cameras, ease of interface with computers, faster computers and processing, easier to use software and better outputs all worked together to create a far more accurate photogrammetry products. Furthermore, Fraser looks at specific advances in productivity and accuracy on five projects conducted by the Vision Metrology Services Unit of The University of Melbourne. In December 1953 A.G. Thomson delivered his paper, “Dimensional Metrology in Aircraft Production”, about the Symposium on Engineering Dimensional Metrology held at Teddington on October 21-23 1953. Thomsons paper discusses all of the papers delivered at the symposium, and gives a brief overview of the key points raised, while the symposium dealt mainly with aircraft production, the methods discussed and reviewed are still relevant to the history of industrial metrology. Thomson looks at all of the key areas at the Symposium and provides very brief but thorough definitions and key points raised from each of the sections; a very interesting point is made in relation to small scale metrology,
“From examination of the subject in a number of factories throughout Britain, and from discussions with those responsible for production and inspection, the opinion was formed that there was ample scope for the development of special methods and instruments of metrology for application to horology and small instrument production. There are also many problems in measurement to which a satisfactory solution has yet to be found.” Thomson (1953).
This point demonstrates that while industrial metrology has been in use for over half a decade in aeronautical applications, it was realised that there must be more efficient, easier and higher quality methods for acquiring the measurements required. Clive Fraser, in 1998, released yet another paper entitled, “Automated Processes in Digital Photogrammetric Calibration, Orientation, and Triangulation”. This paper builds upon and supports his earlier papers, which have already been discussed, taking a detailed look at the innovations and applications which were being discussed and put into action in 1998, this is still very relevant to metrology today as we strive to even more accurate and easier to use systems, especially in vision metrology (VM). The advent of digital technology to photogrammetry caused great upheaval in the already established systems, but meant that the new technology would be more readily accepted and the advances in accuracy and ease of use it brought with it would be better recognised.
“…there are around 150 high precision VM systems in commercial use worldwide, primarily in the aircraft, automobile, and aerospace manufacturing sectors and in shipbuilding and the nuclear power industry. Most are employed in 3D coordinate measurement tasks involving relatively dense arrays of object points, where fast data acquisition is required and accuracies of point determination of between 1:30,000 and 1:100,000 of the object’s principal dimension are sought.” (Fraser, 1998: 277).
This proves clearly that the technology has been available for at least a decade now to capture and process very high accuracy visual data for industrial metrology applications. The key factor here is the ease of use associated far less time is required with each object to be surveyed, as only a small series of photographs is required, rather than a long winded series of levels and measurements. The biggest change to this system in recent years is the price and availability to small scale operations and applications. A vast majority of police crime scene and crash scene investigation is done by vision metrology of a sort due to its affordability, ease of setup, ease of use and efficiency.

5
The use of jigs for monitoring deformations in the structure of an object has been around for a long time. Although these days, the quality of the jig monitoring results is greatly improving. Tom Vaughan and James Tallon have invented a production jig to be used primarily for the automotive industry. The production jig obtains dimensional information by means of fixing reflective targets onto the jig so that the surface of the target is clearly visible. Each target is placed in a predefined position for when measurements are being conducted. In order to maintain tolerances of less than tenths of a millimetre the precise location of each target must be known. To determine whether the jig is in its’ specific location, a camera is needed to take a number of photographs from a variety of different directions. This Photogrammetry method is capable of achieving quite substantial results. By using a photogrammetric application any anomalies with the jig can be determined. The aim of the production is to provide a way of obtaining results without the need for repetition of measurements when the targets deteriorate and become too damaged for the duration of the manufacturing. To do this Vaughan and Tallon have invented a system for obtaining the relevant information by using cover elements (Vaughan and Tallon, 2004). The system is comprised of,
“The jig and a plurality of reflective targets wherein the reflective targets are fixed in defined positions on the jig so that a reflective surface of the respective target can be visible. The system is characterized by a plurality of cover elements wherein the cover elements, the jig and/or the reflective targets are adapted so that the cover elements can removably be fixed to the jig and/or to at least one of the reflective targets so as to cover at least some of the reflective surfaces.” (Vaughan and Tallon, 2004).
In doing this the targets are protected against any sparks, dirt, dust and other material that may interfere and deteriorate them. According to their initial research it shows that repeated use of the targets does not reduce their quality. Although the first setup is more time consuming, subsequent measurements are less significant and can complete a round of 20 targets within thirty minutes. The cover elements can consist of a suitable metal or alternatively strong and durable plastic would also be preferred. The design would encompass one or more of the targets being recessed into the actual jig so that they can be used as a specific benchmark and datum point (Vaughan and Tallon, 2004). This invention of Vaughan and Tallon has proven to present accuracies of 0.1 to 0.2mm. It is an inexpensive and arguably an easy method that allows for accurate results time and time again (Vaughan and Tallon, 2004). Large scale metrology is the scientific study of measurement. Although one might think that the measurement of length is of greater importance to the metrologist, it is in actual fact the alignment and angle measurement that is of the utmost importance (Estler et al, 2002: 587). This need for the fundamental aspect of large scale metrology has many challenges with being able to provide accurate alignment of considerable sized machines and structures. W.T. Estler, K. L. Edmundson, G. N. Peggs and D. H. Parker in their paper entitled, ‘Large-Scale Metrology – An Update’, state that large scale metrology is the,
“...transfer of information between the measurement instrumentation and the measured object via light rays propagating in the atmosphere. In some cases, such as photogrammetry, this can be a purely passive process, while in other cases, such as a laser tracker, the position of a target is 'interrogated' by a beam that is transmitted, reflected, and then received back at the transmitter.” (Estler et al, 2002: 587).
M. J. Puttock wrote in his survey paper in 1978 that, “The field of large-scale metrology is one which provides a significant challenge to the metrologist since virtually every project is different and, moreover, accuracy requirements are becoming more demanding. It is necessary in almost every case to adapt available instrumentation and techniques to meet particular requirements and a considerable degree of ingenuity is a necessary attribute of the metrologist undertaking work in this field.” (Estler et al, 2002: 587).
While large scale metrology has its’ many difficulties and challenges, it also has its’ benefits. With the advancement in technology the accuracies of performing a large scale metrological measurement have since been increased. Laser trackers, reflector-less searching systems, interferometry, photogrammetry, distance measurement devices and exceedingly powerful computer systems have assisted in making the metrology field the level it is now (Estler et al, 2002: 587). Another point to be addressed is the exclusive use of the QUT Motorsport JIG table, and due to its importance and susceptibility to knocks and bumps, a somewhat high potential exists for deformation of its inherit flatness. “Vibration isolation of precision equipment”, by Eugene Rivin in 1995, investigates the development and relative cheapness of vibration isolation systems, used to keep high-accuracy jigs and cutting toolset cetera free from bumps and knocks. While the QUT Motorsport jig is not of this high an accuracy situation, it is apparent

6
that the less it is moved, and so forth, the better for the stability and accuracy of the JIG table and therefore the frame checks and production.
“…sensitivity to external vibrations does not necessarily increase with increasing accuracy requirements, because improvements in accuracy of precision machines and apparatus are usually accompanied by better designs.” (Rivin, 1995: 41-42).
SURVEY METHODOLOGY FOR JIG TABLE Initially, the surveying discipline in the School of Urban Development was approached in relation to the QUT Motorsport team requiring modelling done of their JIG table. After further consultation with our academic supervisor, we decided upon a course of action. Firstly, contacting one of the QUT Motorsport Team Co-ordinators, Mr Anthony Morris, through his consultations we established which parts and elements of the JIG table were critical to them. The JIG table is basically a rigid table on wheels, with a so-called table-top consisting of a 3mm steel plate. That is secured by 4 bolts, offset from the corners to the table frame. Outside of these securing bolts the plate moves up and down freely, however inside these bolts the metal surface appears taut and secure, furthermore at the front and back there are vertical uprights which the frame is built too and also supports it prior to welding. The critical factors of the JIG table to the Motorsport team were established to be the flatness of the 3mm steel plate JIG table, the overall level is negligible; and of secondary concern, was the verticality of the uprights. Access to the jig was the next issue to be resolved, because it was racing season it was being very heavily used for monitoring of the current race-car chassis, and in addition the team was in the process of building a new chassis for the next racing season. In essence, it was being moved around from the bottom of one building where the design team was working to another building for welding. This situation made finding a period of time where it was accessible somewhat difficult. Eventually it was decided that the only way sufficient time could be spent with the JIG, was while it had the chassis under construction in it. This was of a benefit and a hindrance- it allowed an insight into the process and the accuracies required by the team, however the half built body did not permit us from achieving a handful of measurements. This was seen as a minor problem in the overall dimensional checking analysis as we had already established a tight network.
Figure 1: Grid Points and Bolt Positions of Jig Table

7
The JIG table itself was 2.4 metres long and 1.2 metres wide and approximately 700mm above the floor casters, with scribed grid intervals of 200mm along the length of the table and 300mm along the width. Figure 1 shows the grid network, established and confirmed to collect measurements. Several different instruments were considered for completing the task; the first choice was using a photogrammetric method. However the QUT Faculty of Built Environment and Engineering has limited access and resources for photogrammetry applications. This meant that a second preference had to be considered. This consideration involved a two-part survey measurement approach of using a precise optical level instrument in combination with a steel ruler to gather the heighting data and also the use of an electronic Total Station mounted upon a precision translation stage. The precise level used was an older precise instrument, WILD NAK2, which was chosen as it is an automatic level. It also contained a compensator which can compensate for any setup errors in levelling and can be levelled accurately by manual setup translating to obtaining very precise results for this practical application. In addition we also found that this instrument had a very good focus setup and lenses making it ideal for the close-range application and dark conditions. The electronic total station used was a Leica TC1700, while not an amazing instrument; it was able to be used easily and in conjunction with the translation stage allowing us to provide sufficient checks to the verticality of the uprights. The survey data capture was carried out in September 2009. Additionally, atmospheric observations were taken, although were considered to have no real impact on the data capture. It should be noted however that the steel JIG plate could potentially contract and expand noticeably in cold or hot temperatures. This will be discussed later in the paper, along with other areas of concern/reflection which could be addressed if a resurvey was conducted. The atmospherics data were recorded as, Temperature: 23oC and Pressure: 1017mba. No changes to these data were noted from the commencement, middle and end of the survey data observations. The first step was to set-out the grid points to be used on the table. These node points were established by using a precision tape measure and at each grid point placing a small piece of blu-tac to mark and scribe them. Once this was completed, a 1200mm spirit level was used to bring the JIG table to a rough level, allowing the survey measurements to be recorded more easily and also allow the vertical checks of the uprights to be carried out in an effective manner. Once the grid points were set-out the measurement process commenced, whereby the precise level was setup and survey measurements were read to the steel ruler on the steel surface at the points. These observations were then manually booked on a scale diagram of the JIG table. This data was then inserted into Microsoft EXCEL such that it could be processed by SURFER, a 3D Modelling program which allowed us to provide the graphical outputs as seen in figures 2 and 3. Not all of the data could be captured from the one survey station setup, so two of the bolt positions were used as localised change-points/ backsights and additional instrument establishments. The level instrument was then moved and the same two bolts backsighted allowing us to continue the survey on the same effective datum. The upright verticality checks were then performed using the electronic total station and translation stage. The total station instrument was setup along the line of the uprights as close as possible by eye. Once setup, using the translation stage allowed us to gradually transition the total station angle stationary but move the entire setup side-to-side, allowing each upright to be checked from bottom to top and the difference noted by using the micrometer on the translation stage. Very minor differences were observed and noted on the steel upright structures and as such no data needed to be processed. In consultation with the supervisor of the QUT motorsport team, verbal confirmation was provided directly to the technical support staff of the upright structures verticality characteristics. This was an expected outcome commented and assumed by the supervisor at the initial meeting. ANALYSIS AND RESULTS After the practical component of the survey application was performed on the JIG Table, we checked our observations and input the data for post-processing into a software program called Surfer, where 3-dimensional models of the survey results were created. The raw data was considered as a matrix form and required some manipulation to achieve the expected outcome. Some overall rotation was performed to obtain estimation of a best fitted surface. Table 2 shows the positions of each measured point on the jig in matrix form with its corresponding heights in relation to the datum point as pre-determined by top surface of the fixture bolt at position 130, 130. It should be noted that the dashes in place of the z values is because we could not obtain a measurement due to the upright structures of the JIG table obscuring a direct line-of sight.
8
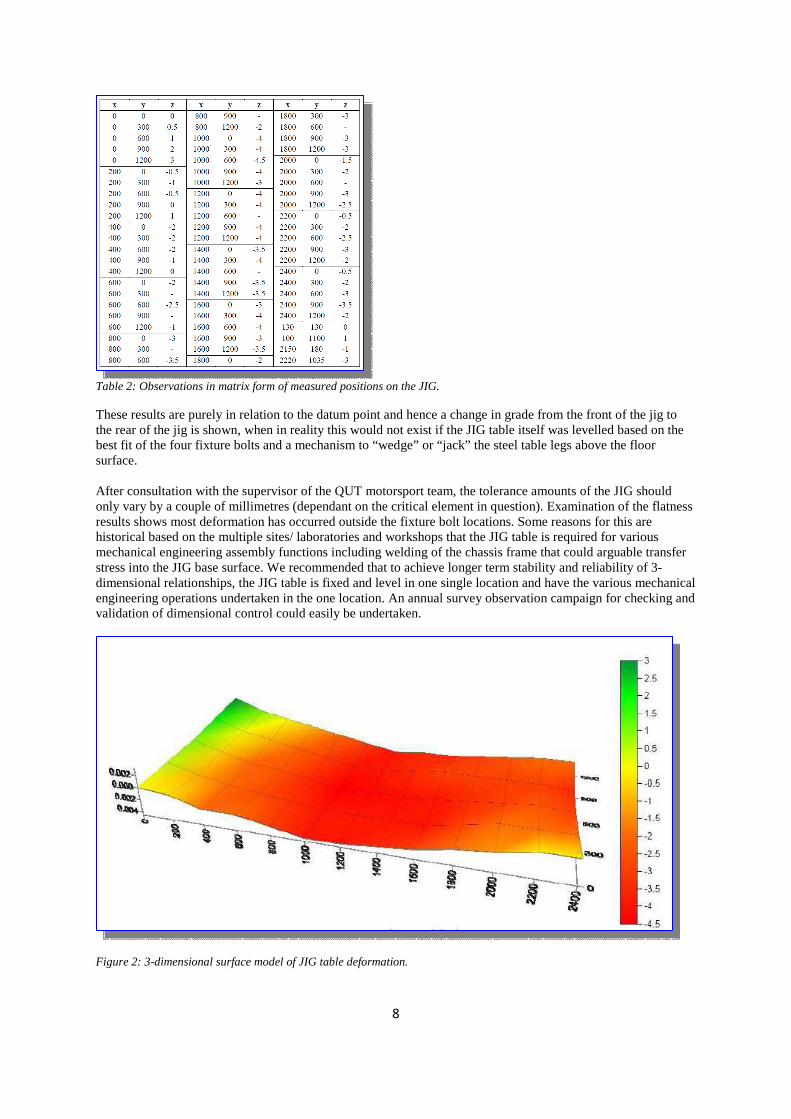
Table 2: Observations in matrix form of measured positions on the JIG. These results are purely in relation to the datum point and hence a change in grade from the front of the jig to the rear of the jig is shown, when in reality this would not exist if the JIG table itself was levelled based on the best fit of the four fixture bolts and a mechanism to “wedge” or “jack” the steel table legs above the floor surface. After consultation with the supervisor of the QUT motorsport team, the tolerance amounts of the JIG should only vary by a couple of millimetres (dependant on the critical element in question). Examination of the flatness results shows most deformation has occurred outside the fixture bolt locations. Some reasons for this are historical based on the multiple sites/ laboratories and workshops that the JIG table is required for various mechanical engineering assembly functions including welding of the chassis frame that could arguable transfer stress into the JIG base surface. We recommended that to achieve longer term stability and reliability of 3-dimensional relationships, the JIG table is fixed and level in one single location and have the various mechanical engineering operations undertaken in the one location. An annual survey observation campaign for checking and validation of dimensional control could easily be undertaken.
Figure 2: 3-dimensional surface model of JIG table deformation.
9
Figure 2 shows the positions of each data collection point and how far above or below the datum point (bolt location 130,130) each of the Survey points are. The resultant colour graded surface indicates that yellow is the height of the datum point across the rear and front left; green is above the datum point and red is below the datum. As can be observed from Figure 2, the JIG table is relatively flat despite the extremities of the four corners and outer edges. The four hold-down bolts are located inside the boundaries by approximately 100 to 250mm depending on the particular corner. Most localised deformation appears outside these four fixture bolts due to the mobile nature of the JIG table and collisions during movements between building locations.
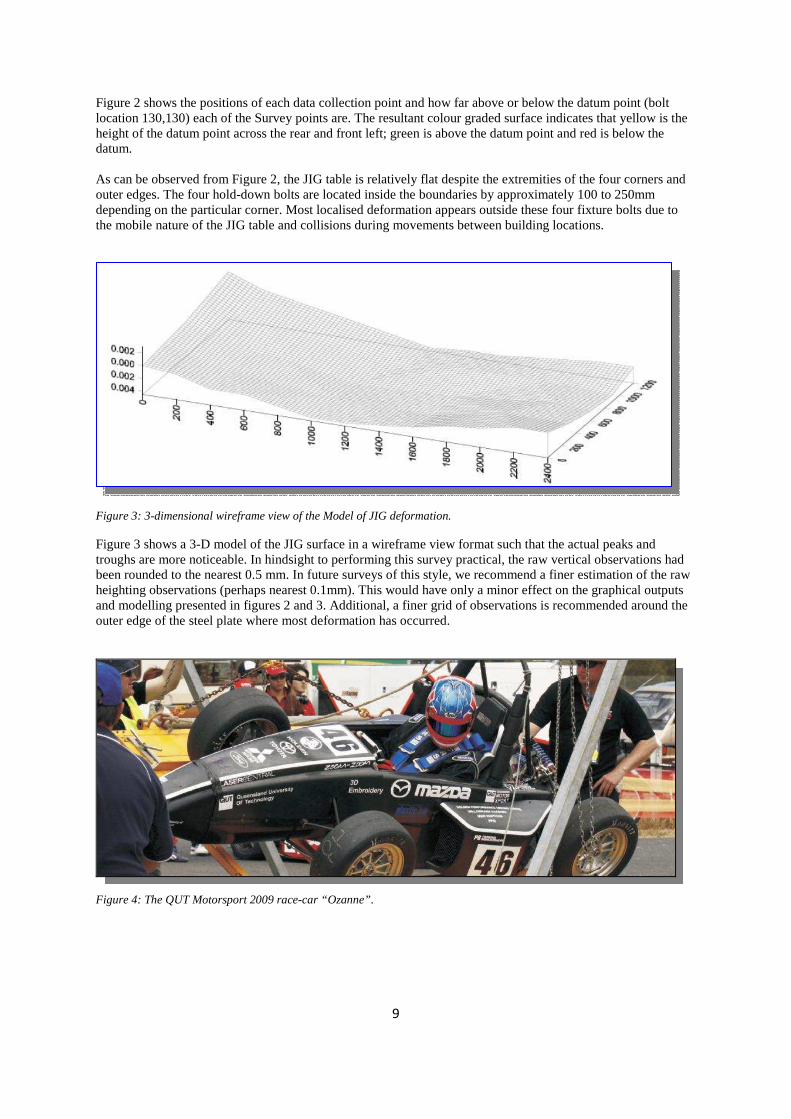
Figure 3: 3-dimensional wireframe view of the Model of JIG deformation. Figure 3 shows a 3-D model of the JIG surface in a wireframe view format such that the actual peaks and troughs are more noticeable. In hindsight to performing this survey practical, the raw vertical observations had been rounded to the nearest 0.5 mm. In future surveys of this style, we recommend a finer estimation of the raw heighting observations (perhaps nearest 0.1mm). This would have only a minor effect on the graphical outputs and modelling presented in figures 2 and 3. Additional, a finer grid of observations is recommended around the outer edge of the steel plate where most deformation has occurred.
Figure 4: The QUT Motorsport 2009 race-car “Ozanne”.

10
CONCLUSIONS & DISCUSSION In concluding this paper it is clear to see that the methods implemented were successful in completing the task. It should be noted that far more efficient methods of obtaining the data and post-processing of results may be available using state-of-the art technology approaches. The best of these approaches would be using photogrammetric technology to capture the survey data for several reasons. By using photogrammetry the measurement job could have been completed in a far shorter period of time, making the access issue insignificant. Furthermore, the data capture process would have been to a higher accuracy, due to less setup errors and the ability to take all of the measurements in quick succession. The final advantage to using photogrammetry is the processing capabilities. The software programs are becoming more user-friendly and also allow greater data and output manipulation in a variety of formats. Photogrammetric methods aside, this applied survey approach went very well and we were able to capture all of the necessary data to provide the QUT Motorsport Team with sufficient deformation information for the condition of the JIG table and additionally were able to provide them with validity with careful checking on the vertical upright structures. At initial visual inspection it was not clear if the base steel surface contained much deformation. Our survey observations and results have demonstrated some deformation across its outer surface; however it appears to be of insignificant concern to the Motorsport team. However, this should be monitored as the continual moving and jarring of the JIG table will potentially advance its deformation further and cause potential errors in the dimensional frame relationship and alignment of components. We recommend that to resolve this situation now and into the future, the best course of action would be to immobilise the JIG table in a solid/rigid state. This would ultimately allow it to be measured and the deformation mapped far more accurately. This would then allow the JIG to then have alterations made, so that it was “perfectly” level and flat. Having it immobilized would then allow confidence to be maintained as the deformation would be minimised substantially. In essence and supported by the literature review, this JIG table should be kept in a solid state and not moved. So when welding needs to be undertaken to the race-car chassis frame in the JIG, the welding equipment should be brought to it, not the other way around. The JIG is the integral part of the framework, it is the basis from which the entire chassis is built and therefore the entire integrity of the Motorsport Teams work lies within it. The literature articles reviewed at the start of this paper fully support our findings and conclusions that the JIG table be kept stationary and immobilized. Furthermore, digital photogrammetry is an advancing technology and has many potential applications, especially in industrial metrology and could have provided our investigation with far more accurate results much more efficiently.

11
REFRERENCES Estler, W. T., K. L. Edmundson, G. N. Peggs, D. H. Parker. 2002. Large Scale Metrology – An Update. CIRP Annals –Manufacturing Technology 51 (2) : 587 – 609. http://www.sciencedirect.com.ezp01.library.qut.edu.au/science?_ob=MImg&_imagekey=B8CXH-4P3DTXG-5&_cdi=40087&_user=62921&_orig=search&_coverDate=12%2F31%2F2002&_sk=999489997&view=c&w chp=dGLbVlb-zSkWA&md5=f083b063d94539a591a770d383fc50ea&ie=/sdarticle.pdf (accessed October 5, 2009). Fraser, C. S. 1998. Automated Processes in Digital Photgrammetric Calibration, Orientation, and Triangulation. Digital Signal Processing 8 (4) : 277 – 283. http://www.sciencedirect.com.ezp01.library.qut.edu.au/science?_ob=MImg&_imagekey=B6WDJ-45JB79T-8- 1&_cdi=6768&_user=62921&_orig=search&_coverDate=10%2F31%2F1998&_sk=999919995&view=c&wc hp=dGLzVtb-zSkzk&md5=04d659f07a629c85560c9ffa9f4b61ed&ie=/sdarticle.pdf (accessed October 7, 2009). Fraser, C. S. 1999. Automated Vision Metrology: A Mature Technology for Industrial Inspection and Engineering Surveys. http://www.sli.unimelb.edu.au/vms/vms_papers/pdffiles/Perth99-AutoVM.pdf (accessed October 7, 2009). Hocken, R. J., N. Chakraborty, C. Brown. 2005. Optical Metrology of Surfaces. CIRP Annals – Manufacturing Technology 54 (2) : 169 – 183. http://www.sciencedirect.com.ezp01.library.qut.edu.au/science?_ob=MImg&_imagekey=B8CXH-4SRVXM5- 9- 1&_cdi=40087&_user=62921&_orig=search&_coverDate=12%2F31%2F2005&_sk=999459997&view=c&w chp=dGLzVtb-zSkWA&md5=fffb289e1f6c80f054e46dc53239e17a&ie=/sdarticle.pdf (accessed October 5, 2009). Queensland University of Technology 2001. QUT Motorsport Webpages. http://www.motorsport.bee.qut.edu.au/ (accessed November, 2009) Riven, E. I. 1995. Vibration Isolation of Precision Equipment. Precision Engineering 17 (1) : 41 – 56. http://www.sciencedirect.com.ezp01.library.qut.edu.au/science?_ob=MImg&_imagekey=B6V4K-3Y6PGC7- Y- 1&_cdi=5761&_user=62921&_orig=search&_coverDate=01%2F31%2F1995&_sk=999829998&view=c&wc hp=dGLbVzz-zSkWz&md5=798bf38e9ab07e15edeb9adff7101008&ie=/sdarticle.pdf (accessed October 7, 2009). Schwenke, H., U. Neuschaefer-Rube, T. Pfeifer and H. Kunzmann. 2002. Optical Methods for Dimensional Metrology in Production Engineering. CIRP Annals – Manufacturing Technology 51 (2) : 685-699. http://www.sciencedirect.com.ezp01.library.qut.edu.au/science?_ob=MImg&_imagekey=B8CXH-4P3DTXGB- 1&_cdi=40087&_user=62921&_orig=search&_coverDate=12%2F31%2F2002&_sk=999489997&view=c&w chp=dGLbVzz-zSkWz&md5=afc797dc7ad36479634b5441c090a1e0&ie=/sdarticle.pdf (accessed October 5, 2009). Shortis, M. R. and C. S. 1998. Fraser. State of the Art of 3D Measurement Systems for Industrial and Engineering Applications. FIG98. http://www.geomsoft.com/markss/papers/ShortisFraserFIG1998.pdf (accessed October 7, 2009). Vaughan, T. and J. Tallon. 2004. Method and system for production jig metrology. European Patent Application EP1475602, filed Jun. 5, 2003, and issued Oct. 11, 2004.
![2020 QTA Central Queensland regional award … · Web viewOpening ReelPre-recorded show reel with voice over] MC: Welcome to the Central Queensland regional final of the 2020 Queensland](https://img.pdfslide.us/doc/110x75/5ff8b95b2854c429003f40f5/2020-qta-central-queensland-regional-award-web-view-opening-reelpre-recorded-show.jpg)