Embed Size (px)
Citation preview

__________________________________________________________________
IDART DATA MART
By
ZUKILE RORO
A thesis submitted in partial fulfillment of the
requirements for the degree of BSc Honours
(Computer Science)
University of the Western Cape
2010
___________________________________________________________________
University of the Western Cape
Department of Computer Science Supervisor: Dr William D. Tucker
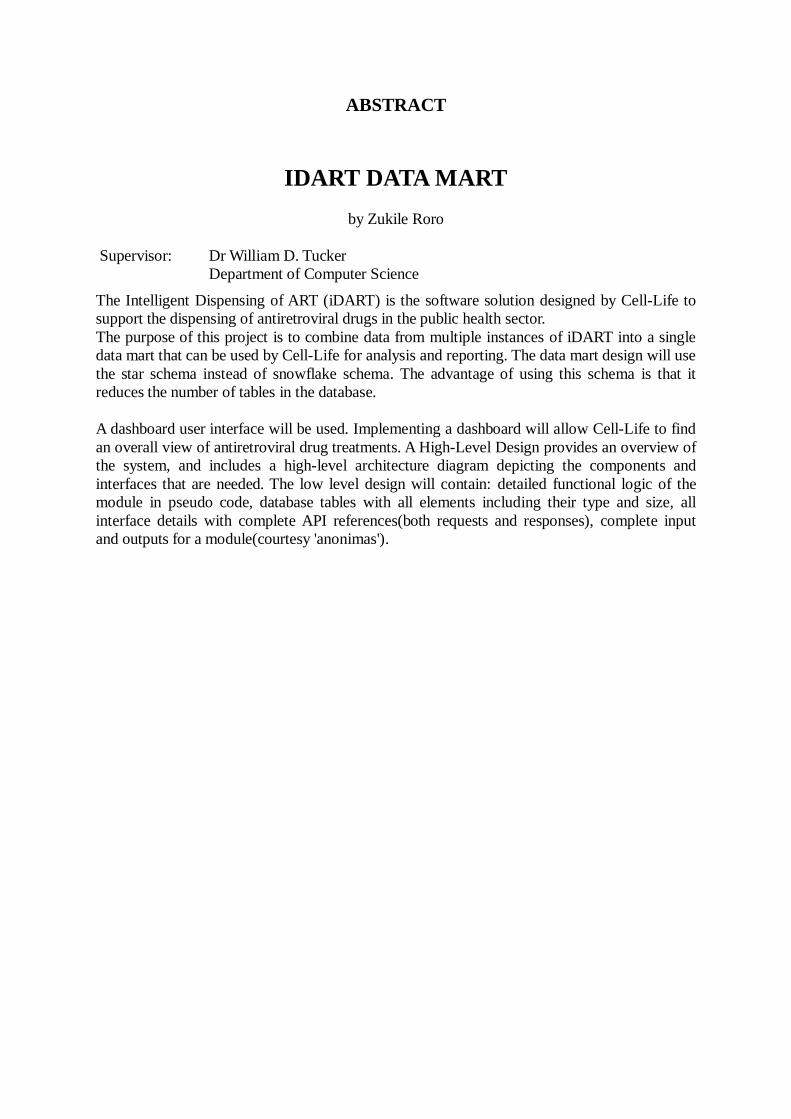
ABSTRACT
IDART DATA MART
by Zukile Roro
Supervisor: Dr William D. Tucker
Department of Computer Science
The Intelligent Dispensing of ART (iDART) is the software solution designed by Cell-Life to
support the dispensing of antiretroviral drugs in the public health sector.
The purpose of this project is to combine data from multiple instances of iDART into a single
data mart that can be used by Cell-Life for analysis and reporting. The data mart design will use
the star schema instead of snowflake schema. The advantage of using this schema is that it
reduces the number of tables in the database.
A dashboard user interface will be used. Implementing a dashboard will allow Cell-Life to find
an overall view of antiretroviral drug treatments. A High-Level Design provides an overview of
the system, and includes a high-level architecture diagram depicting the components and
interfaces that are needed. The low level design will contain: detailed functional logic of the
module in pseudo code, database tables with all elements including their type and size, all
interface details with complete API references(both requests and responses), complete input
and outputs for a module(courtesy 'anonimas').

ACKNOWLEDGMENTS
First and foremost I would like to thank my family for their support, without them I wouldn’t
be where I am today. Then I wish to thank my supervisor Dr William D. Tucker for his kind
supervision, advices and support.

Table of contents
Abstract ............................................................................................................................................. i
Acknowledgements .......................................................................................................................... ii
Table of contents ............................................................................................................................. iii
List of figures ................................................................................................................................... iv
List of Tables ..................................................................................................................................... v
Glossary .......................................................................................................................................... vi
Chapter 1: Introduction .................................................................................................................... 1
Chapter 2: User requirements .......................................................................................................... 3
2.1 User's view of the problem ...................................................................................................... 3
2.2 Expectations from a system ..................................................................................................... 3
2.3 Not expected from a system ..................................................................................................... 3
2.4 General constraints .................................................................................................................. 3
Chapter 3: Requirements Analysis ................................................................................................... 5
3.2 User requirements interpretation ............................................................................................ 5
3.3 Suggested system .................................................................................................................... 5
3.4 Testing the suggested solution ................................................................................................ 6
Chapter 4: User Interface Specification ............................................................................................ 7
4.1 What the user interface looks like to the user........................................................................... 7
4.2 How the user interface behaves ............................................................................................... 7
4.3 How the user interacts with the system .................................................................................... 8
4.4 Suggested system .................................................................................................................... 8
Chapter 5: High Level Design .......................................................................................................... 11
5.1 Components .......................................................................................................................... 11
5.2 User interface design ............................................................................................................ 11
5.3 Use case index ....................................................................................................................... 11
5.4 Class diagram ......................................................................................................................... 12
5.5 Schema .................................................................................................................................. 12
Chapter 6: Low Level Design ........................................................................................................... 13
6.1 Details of class attributes ...................................................................................................... 15
6.2 Details of class methods/functions ........................................................................................ 15
6.3 Pseudo-code ......................................................................................................................... 16
Chapter 7: Implementation ............................................................................................................ 21

7.1 Design step ........................................................................................................................... 21
7.2 Construction step .................................................................................................................. 21
7.3 Populating step ..................................................................................................................... 24
7.43 Accessing step ..................................................................................................................... 24
Chapter 8: Testing .......................................................................................................................... 25
Chapter 9: User guide .................................................................................................................... 27
Bibliography ................................................................................................................................... 34
Appendix A .................................................................................................................................... 35
Cell liferequirements ................................................................................................................... 24
Appendix B ..................................................................................................................................... 36
Project plan diagram .................................................................................................................... 36
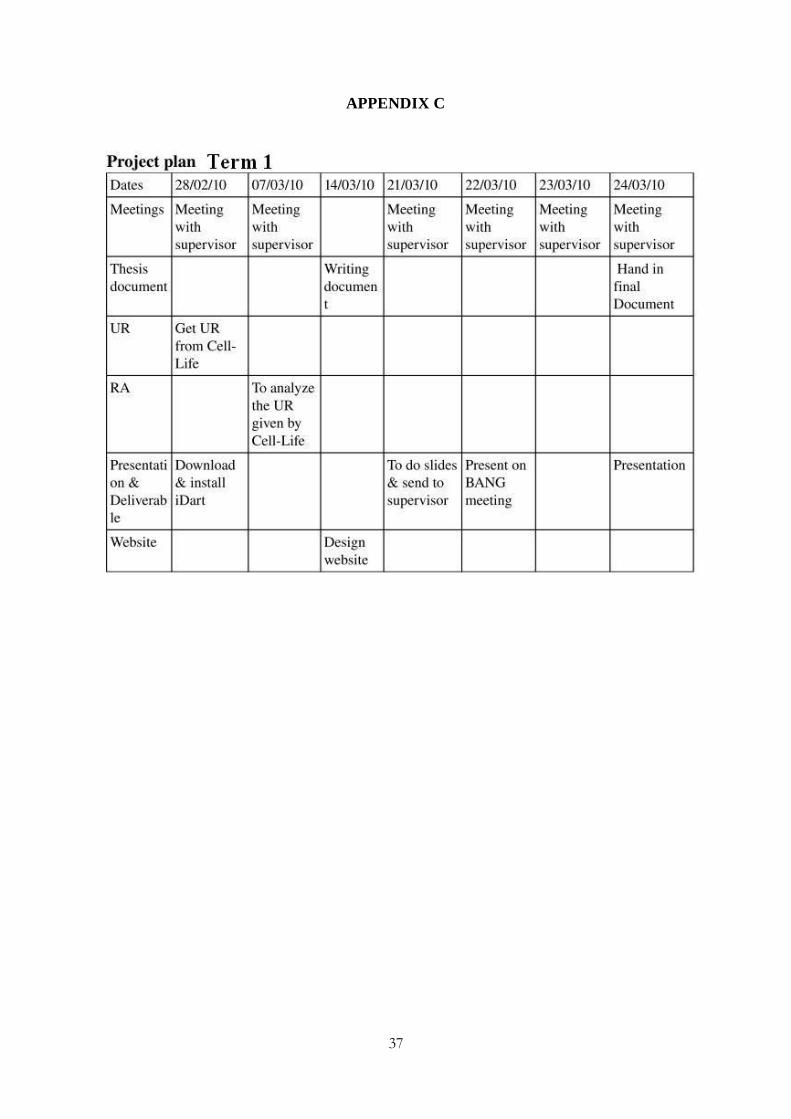
Appendix C ..................................................................................................................................... 37
Project plan: Term 1 ..................................................................................................................... 37
Appendix D .................................................................................................................................... 38
Project plan: Term 2 .................................................................................................................... 38
Appendix E ..................................................................................................................................... 39
Project plan: Term 3 .................................................................................................................... 39

LIST OF FIGURES
Figure 1: IDART DATA MART CONCEPT ............................................................................................. 1
Figure 2: STAR SCHEMA .................................................................................................................... 2
Figure 3: SNOWFLAKE SCHEMA ........................................................................................................ 3
Figure 2: OVERVIEW OF THE SYSTEM ............................................................................................... 6
Figure 3: USER INTERFACE SPECIFICATION ........................................................................................ 8
Figure 4: KPI TOOLBAR ..................................................................................................................... 8
Figure 5: KPI EXAMPLE ...................................................................................................................... 9
Figure 6: KPI EXAMPLE CASE 1 .......................................................................................................... 9
Figure 7: KPI EXAMPLE CASE 2 ........................................................................................................ 10
Figure 8: USE CASE .......................................................................................................................... 12
Figure 9: CLASS DIAGRAM ............................................................................................................... 13
Figure 9: DATA MART SCHEMA ........................................................................................................ 13
Figure 10(a): PROVINSIAL STATS (Before ETL) ................................................................................. 25
Figure 10(b): PROVINSIAL STATS (After ETL) .................................................................................... 26
Figure 11: PENTAHO BI PLATFORM WELCOME SCREEN ................................................................... 35
Figure 12: IDART DATA MART DASHBOARD..................................................................................... 36

LIST OF TABLES
Table 1: OBJECTS REQUIRED ........................................................................................................... 11
Table 2: USE CASE INDEX TABLE ..................................................................................................... 12
Table 3: A DESCRIPTION OF ATTRIBUTE .......................................................................................... 15
Table 4: A DESCRIPTION OF CLASS METHODS ................................................................................ 15
Table 5: A DESCRIPTION OF FUNCTIONS/METHODS ....................................................................... 16

GLOSSARY
ARV–AntiRetroViral
iDART – Intelligent Dispensing of ART
Dashboard – A reporting tool that presents key indicators on a single screen, which includes
measurements, metrics, and scorecards.
Data mart - It is a simple form of a data warehouse that is focused on a single functional area.
ETL - Extract, Transform, and Load is a process in database usage.
GUI - Graphical User Interface
HIV – Human Immunodeficiency Virus
IDE - Integrated Development Environment is a software application that provides
comprehensive facilities to computer programmers for software development.
KPI – Key Performance Indicators
OLAP– Online Analytical Processing
OLTP– Online Transactional processing
OOA – Object Oriented Analysis
OOD – Object Oriented Design
Packages-
Pentaho – The Pentaho BI Project is open source application software for enterprise reporting,
analysis, dashboard, data mining, workflow and ETL capabilities for business intelligence
needs.

PostgreSQL– PostgreSQL, often simply Postgres, is an object-relational database management
system (ORDBMS).
RA – Requirement Analysis
Representation Term- is a word, or a combination of words, that semantically represent the data type (value domain) of a data element.
Star schema - is the simplest style of data warehouse schema.
Talend - is an open source data integration software vendor which produces several enterprise
software products, including Talend Open Studio.
UIS - User Interface Specification
UR – User Requirements

1
C h a p t e r 1
INTRODUCTION
Any online transaction processing (OLTP) data contains information that can help in making
informed decisions about businesses. For example, one can calculate your net profits for last
quarter and compare them with the same quarter of the previous year. The process of analyzing
data for that type of information, and the data that results, are collectively called business
intelligence. Because most operational databases are designed to store data, not to help analyze
it, it’s expensive and time consuming to extract business intelligence information from
databases. The solution: an online analytical processing (OLAP) database, a specialized
database designed to help extract business intelligence information from data.
In response to a request from the Desmond Tutu HIV Foundation to assist the management of
anti retro-viral (ARV) dispensing, the Intelligent Dispensing of Anti-Retroviral Treatment
(iDART) system was developed by Cell-life which in 2009 is in over 20 clinics dispensing
drugs to more than 45,000 patients. This system is used by pharmacists to manage the supply of
ARV stocks, print reports and manage collection of drugs by patients. One of many iDART
sites is the ARV pharmacy at the Tsepong Wellness Centre which became the third Elton Aids
Foundation sponsored health care facility to receive the iDART system. The Tsepong Wellness
Centre is currently servicing over 6000 HIV+ patients.
The goal of this project is to combine data from multiple instances of iDART into a single data
mart that can be used for reporting and analysis by Cell-life (see Figure 1). A data mart is a
simple form of a data warehouse that is focused on a single functional area. A data warehouse
incorporates information about many subject areas, often the entire enterprise/organisation
while the data mart focuses on one or more subject areas. The data mart represents only a
portion of an enterprise's data, perhaps data related to a business unit or work group. Data marts
represent the retail level of the data warehouse, where data is accessed directly by end users.[3]

2
A schema is a collection of database objects, including tables, views, indexes and synonyms.
Concerning the data mart design, two commonly used schemas are the star and snowflake
schema. In star schema the fact is denormalised, all dimension tables are normalised and there
will be primary foreignkey relationship between fact and dimension tables. For better
performance we use star schema when compare to snow flake schema where fact table and
dimension tables are normalised. Every dimension table there will be a look table meaning that
we have to dig from top to bottom in the snowflake schema. The main advantages in star
schema are that they:
Provide a direct and intuitive mapping between the business entities being analyzed by
end users and the schema design.
Provide highly optimized performance for typical start queries
A widely supported by a large number of business intelligence tools, which may
anticipate or even require that the data mart schema contains dimension tables.
Figure 2: The Fact Table References Each Dimension Table.

3
Figure 2: The Fact Table References a Dimension Table which may reference another
Dimension Table.
This document is intended to guide development of iDART data mart. It also will give
overview of the project, including why it was conceived, what it will do when complete.
Screenshots showing how the final product will look like and behave are provided.
The object oriented view of the system is presented, analysis of the high level design and
describes the objects needed to implement the system is provided.
This document also presents the object oriented design of the system, analysis of the low level
design and provides details for the object oriented analysis of the system.
The rest of this document is organized as follows. Chapter 2 specifies the requirements the user
expects from software solution to be constructed in this project.
Chapter 3 provides the user requirement analysis, Chapter 4 provides the user interface
specification, Chapter 5 specifies the high level design, Chapter 6 the low level design.
Chapter 7 and Chapter 8

4
C h a p t e r 2
USER REQUIREMENTS
This chapter contains the user requirements of iDART data mart. These requirements have been
derived from Cell-life’s project specification. This chapter is intended to guide development of
iDART data mart. This also will give overview of the project, including why it was conceived,
what it will do when complete, and the types of people we expect will use it. Section 2.1
identifies the user's view of the problem, section 2.2 tells what is expected from the software
solution, section 2.3 tells what is not expected from the software solution and section 2.4
identifies general constraints for this data mart design.
2.1 User’s view of the problem
The time and expense involved in retrieving answers from databases means that a lot of
business intelligence information often goes unused. Some organizations use a dozen different
software packages to produce simple reports. If the report doesn't have the proper information,
its creators have to start over. Also, the cost of implementing a full Data warehouse is higher
than that of implementing a data mart. The iDART data mart will help minimize cost of
extracting business intelligence information from iDART instances around the country.
2.2 What is expected from a software solution?
The software system is expected to provide easy access to frequently needed data and creates a
collective view by a group of users.
Cell-Life expects a software solution that can be used for analysis and reporting purposes.
Cell-life would like to be able to generate the following statistics on a monthly/annual basis:
Number of patients treated(based on packages created )
Number of patients enroll on treatment
Number of patients terminating treatment(including reason for termination)
by date, site, gender and age groups (see Appendix A).
2.3 What is not expected from a software solution?
The software solution is not expected to be deployed to all the Cell-Life branches and it is not
expected to be able to function in times of power failure unless a backup power supply is in
place.
Also the software solution is not expected to be used by multiple business units except what it’s
designed for.
2.4 General Constraints

5
We will work under a few number of constraints such as development environment which in
this case has to be the integrated development environment (IDE). Also the database we’ll have
to use is PostgreSQL, to make sure that our product (iDART data mart) is compatible with
existing database which is currently in use.

6
C h a p t e r 3
REQUIREMENT ANALYSIS
Requirements analysis is critical to the success of a development project. [2] Requirements
must be documented, actionable, measurable, testable, related to identified business needs, and
defined to a level of detail sufficient for system design. Requirements can be functional and
non-functional. Section 3.1 identifies the designer's interpretation of the user’s requirements,
Section 3.2 describes suggested the software solution and Section 3.3 identifies types of testing
strategies to be used when testing the suggested software solution.
3.1 Designer’s interpretation of the user’s requirements
Cell-Life has clearly expressed the requirements for the iDART data mart in the previous
chapter (Chapter 1). Now we will focus on the business and technical requirements needed to
implement the given user requirements. Existing solutions will also be considered.
A basic desktop computer running Windows/Linux will work and a PostgreSQL Database
Management System with Java. For data integration, any data integration software tool with
Extract, transform and load (ETL) functionality can used. A Business intelligence (BI) Server
that will provide common functions of business intelligence technologies like reporting, online
analytical processing, analytics, data mining, business performance management,
benchmarking, text mining, and predictive analytics. Any BI Server will work.
The basic building block to use in data mart design is the star schema because of the advantages
this schema has. A star schema consist of one large central table called fact table, and a number
of smaller tables called dimension tables which radiate out from the fact table.
After classifying data from the requirements in Chapter 1 and looking at the representation
terms, facts and dimensions are as follows:
Date, location/site and patient are dimensions
Number of patient treated, enrolled for treatment, terminating treatment are facts.
3.2 Suggested solution
The suggested solution will make use of a desktop personal computer (PC) running
Windows/Linux and can be broken down into various parts.
The first stage uses Extract, transform and load (ETL) tool to retrieve data from stand alone
iDART databases to the iDART data mart. Second stage is accessing data in the data mart,
analyzing it, creating reports, graphs, and charts using a dashboard.

7
3.3 Testing the suggested solution
There are many different approaches to test software. For this project, functional and usability
testing will be performed.
1. Functional Testing:
This is a new system and critical, so I must ensure its functional quality. All the features will be
tested to ensure all functions provide the expected output.
2. Usability Testing:
Usability testing of this system will evaluate the potential for errors and difficulties involved in
using the system for Cell-Life related activities.

8
C h a p t e r 4
USER INTERFACE SPECIFICATION
The purpose of this chapter is to provide a detailed specification of the iDART DATA MART
user interface. These requirements will detail the outwardly observable behavior of the
program. The user interface provides the means for the user, to interact with the program. This
User Interface Specification is intended to convey the general idea for the user interface design
and the operational concept for the software. Many details have been omitted for both clarity
and because they have not been addressed yet. This document will be updated with additional
detail as our analysis and design activities progress.
Section 4.1 gives a description of the complete user interface, Section 4.2 shows what the user
interface looks like to the user, Section 4.3 tells how the interface behaves and Section 4.4 tells
how the user interacts with the system.
4.1 Description of the complete user interface
The User Interface Specification (UIS) consists of one main graphical user interface (GUI),
which consists with different operations enlisted in the options.
4.2 What the user interface looks like to the user
The Login page consists of two text boxes, namely Username and Password, and a Login
command button allowing the users to log into the system. The login page helps the users
to login as a user who visualizes and analyze data contained in the database, and as an
Administrator (someone from the IT department) whose duty is to update, edit and modify the
dashboard.
Once logged on, the user is presented with the dashboard.
Figure 3 shows the complete User Interface Specification (UIS). This is what a simple typical
dashboard for any organization would look like.

9
Figure 3: User Interface Specification (UIS).
4.3 How the user interface behaves
How the dashboard interface behaves during manipulation is interesting. Each Key
Performance Indicator (KPI) on a page is contained with a portlet featuring up to 7 controls in
the upper right corner (Figure 4) used telling the object how to move, resize or do anything else
according to a certain user input.
Figure 4: Example of KPI
With these controls, the KPI can be deleted from the page, enlarged, repositioned over the one
above it and so on. Such behavior provides the user will full control of how data represented
appears in the dashboard.
4.4How the user interacts with the system
A dashboard report is an important tool for any C-level executive and other business manager.
While keeping them on top of vital statistics and KPIs, dashboard reports help them visualize
and track trends on every level of the business and to align activities with key goals. The user
interface enables users to visualize and analyze data stored in the data mart database. The
interface will enable users to choose what data they want to view (measures) and how they
want to view it (dimensions). Figure 5: illustrates how this is achieved:
Consider a scenario where a user wants to see the total number of patients treated province/site
name. By clicking the Open Preference menu icon on the Where do most treatments
come from? KPI, third in the left column Figure 4 will be shown.

10
Figure 5:
If the user chooses to view number of treatments by province the output would be as shown in
Figure 6.
Figure 6:KPI example 1.
Where as if the user chooses to view number of treatments by site name the output would be as
shown in Figure 7.

11
Figure 7: KPI example 2.

12
C h a p t e r 5
HIGH LEVEL DESIGN
This chapter presents the object oriented view of the system, analysis of the high level design
and describes the objects needed to implement the system. Each one of these objects is
described and documented, and a data dictionary providing details of each object is provided.
5.1 Components
Component name Component description
Talend Open Studio Talend Open Studio is an open source data
integration product designed to combine,
convert and update data in various locations
across a business.
Pentaho BI Server The BI Server is an enterprise-class Business
Intelligence (BI) platform that supports
Pentaho’s end-user reporting, analysis, and
dashboard capabilities.
Pentaho Dashboard Designer Pentaho Dashboard Designer is within the
Pentaho User Console. Self-service dashboard
designer that lets business users easily create
personalized dashboards with little to zero
training
Table 1: Objects required.
5.2 User interface design (Use Case Diagram)
Optimized User Interface Design requires a systematic approach to the design process. The
importance of good User Interface Design can be the difference between system acceptance
and rejection in the marketplace. If end-users feel it is not easy to learn, not easy to use, an
otherwise excellent product could fail. Good User Interface Design can make a product easy to
understand and use, which results in greater user acceptance. The use case diagram below
shows some functional activities of the system that a user can perform.

13
The above use case diagram illustrates that a generic user requests data from the data mart by
dimension, creates and view reports and can view dashboards and that an administrator has its
own behavior but also have the behavior of the generic user. The benefits of generalization
eliminates duplicate behavior and attributes that will ultimately make the system more
understandable and flexible.
5.3 Use case index
Use Case Use Case Name Primary Actor Scope Complexity
1 Request Data Generic User In Low
2 Get Status Generic User In Low
3 Create Reports Generic User In Mid
4 Edit Dashboard Administrator In High
5 Edit Dashboard
Content
Administrator In High
Table 2: Use case index table.

14
5.4 Class Diagram
Structure diagrams are useful throughout the software lifecycle. Here we’ve used class
diagrams to design and document the system's soon-to-be-coded classes. The purpose of the
class diagrams is to show the types being modeled within the system. These types include:
a class
an interface
a data type
a component
Due to the nature of this project, we have a few number of classes and the reason for this is the
fact that java script is mainly used. Figure 7 shows a more detailed description of the class
diagrams.
Figure 7. Class diagrams.

15
5.5 Data mart schema
The figure below (Figure 8) shows the data mart schema for the proposed system. It consist of
the three dimension tables and one fact table. The three dimension tables are PatientDimension,
SiteDimension and TimeDimension. Each of these tables contains a number of fields and a
description of data types.

16
C h a p t e r 6
LOW LEVEL DESIGN
This chapter presents the object oriented design of the system, analysis of the low level design
and provides details for the object oriented analysis of the system.
6.1 Details of class attributes
Class Attributes
User Int Userid- uniquely identifies the user
String Username- stores the username of the
user
String password- stores the user password
adminuser Int adminnumber- uniquely identifies the
admin user
countMeasures String measurename- stores the name of the
mesure.
Int count- stores the number of measures
login String Username- stores the username of the
user
String password- stores the user password
Table 3. A description of attributes of each class.
6.2 Details of class methods
Class Function
User Public int setUserid()- sets the userid
Public void setUsername()- sets the
username of the user.
Public void setPassword()- sets the user
password
Public int getUserid()- returns the user id
when invoked.
Public int getUsername()- returns the user
name when invoked.
Public int getPassword()- returns the user
password when invoked.
17
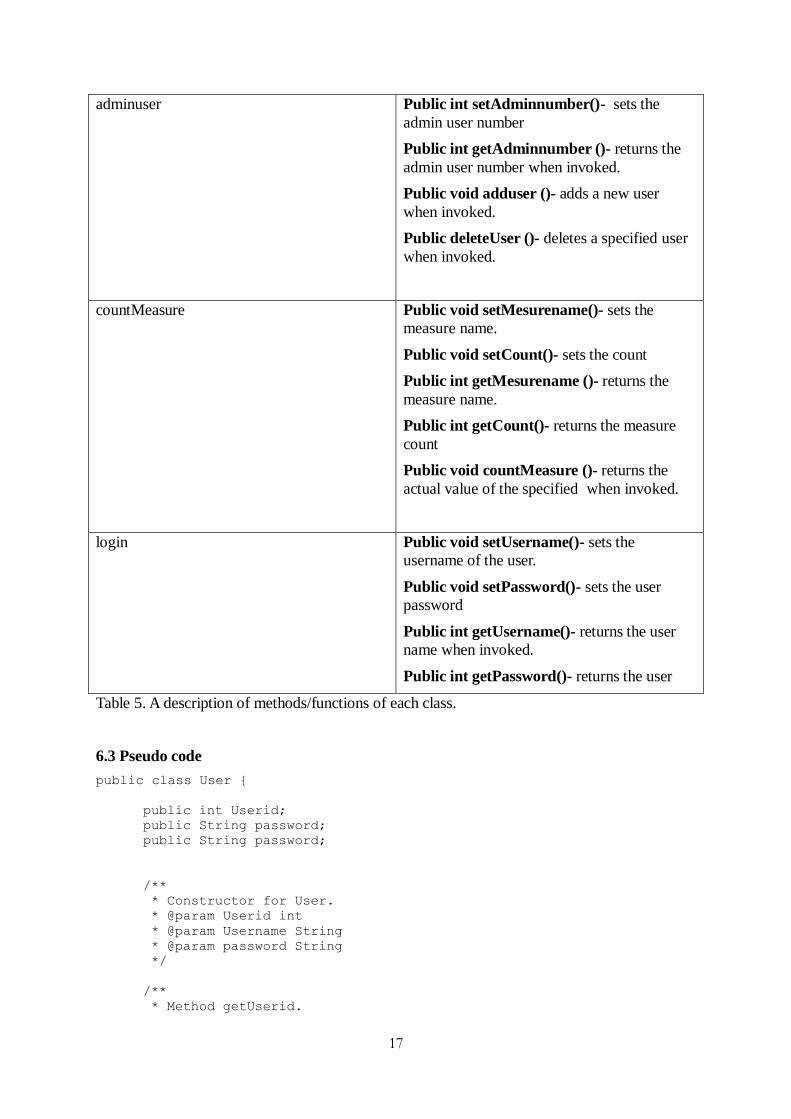
adminuser Public int setAdminnumber()- sets the
admin user number
Public int getAdminnumber ()- returns the
admin user number when invoked.
Public void adduser ()- adds a new user
when invoked.
Public deleteUser ()- deletes a specified user
when invoked.
countMeasure Public void setMesurename()- sets the
measure name.
Public void setCount()- sets the count
Public int getMesurename ()- returns the
measure name.
Public int getCount()- returns the measure
count
Public void countMeasure ()- returns the
actual value of the specified when invoked.
login Public void setUsername()- sets the
username of the user.
Public void setPassword()- sets the user
password
Public int getUsername()- returns the user
name when invoked.
Public int getPassword()- returns the user
Table 5. A description of methods/functions of each class.
6.3 Pseudo code
public class User {
public int Userid;
public String password;
public String password;
/**
* Constructor for User.
* @param Userid int
* @param Username String
* @param password String
*/
/**
* Method getUserid.

18
* @return int
*/
public int getUserid() {
return Userid;
}
/**
* Method setUserid.
* @param Userid int
*/
public void setUserid(String Userid) {
this.Userid = Userid;
}
/**
* Method getUsername.
* @return String
*/
public String getUsername() {
return Username;
}
/**
* Method setUsername.
* @param Username String
*/
public void setUsername (String Username) {
this. Username = Username;
}
/**
* Method getPassword.
* @return String
*/
public String getPassword() {
return Password;
}
/**
* Method setPassword.
* @param Password String
*/
public void setPassword (String password) {
this.password = password;
}
}
public class admin_user extends User {
public int adminnumber;
/**
* Constructor for admin_user.
* @param adminnumber int
*/

19
/**
* Method getAdminnumber.
* @return int
*/
public int getAdminnumber () {
return adminnumber;
}
/**
* Method setUserid.
* @param adminnumber int
*/
public void setAdminnumber (String adminnumber) {
this.adminnumber = adminnumber;
}
public void adduser() // delete & update are similar
{
String name, password;
Int userid;
Connection db; // A connection to the database
Statement sql; // Our statement to run queries with
DatabaseMetaData dbmd; // This is basically info the driver delivers
// about the DB it just connected to.
Class.forName("org.postgresql.Driver"); //load the driver
db = DriverManager.getConnection("jdbc:postgresql:"+database,
username,
password); //connect to the db
dbmd = db.getMetaData(); //get MetaData to confirm connection
System.out.println("Connection to "+dbmd.getDatabaseProductName()+" "+
dbmd.getDatabaseProductVersion()+" successful.\n");
sql = db.createStatement(); //create a statement that we can use later
String sqlText = "insert into usertable values (name,userid,password
etc)";
sql.executeUpdate(sqlText);
. . . . .
. . . . . . //some exception handling code for invalid password, etc.
}
}
Public class countMeasure{
import java.sql.*; // Everything we need for JDBC
import java.text.*;
import java.io.*;
public void countMeasure()
{
Int measure;
Connection db; // A connection to the database
Statement sql; // Our statement to run queries with
DatabaseMetaData dbmd; // This is basically info the driver delivers

20
// about the DB it just connected to.
Class.forName("org.postgresql.Driver"); //load the driver
db = DriverManager.getConnection("jdbc:postgresql:"+database,
username,
password); //connect to the db
dbmd = db.getMetaData(); //get MetaData to confirm connection
System.out.println("Connection to "+dbmd.getDatabaseProductName()+" "+
dbmd.getDatabaseProductVersion()+" successful.\n");
sql = db.createStatement(); //create a statement that we can use later
// Here will be a code that will actually count each of the measures
This is tricky since on our data sources these measures aren’t
Counted.
String sqlText = "";
sql.executeUpdate(sqlText);
measure = sql.getUpdateCount();
}

21
C h a p t e r 7
IMPLEMENTATION
This chapter provides the major steps involved in implementing a data mart. These steps are to
design the schema, construct the physical storage, populate the data mart with data from source
databases and accessing data from data mart.
Section 3.1 is the design step, Section 3.2 describes the construction step, Section 3.3 describes
the populating step and Section 3.4 describes the access step.
For IDART DATA MART implementation the following Business Intelligent (BI) technologies
will be used:
PostgreSQL 8.3
Pentaho Business Intelligent suite Community Edirion 3.6.0
Talend Open Studio 4.0.1
There are no restrictions, any BI technologies can be used.
3.1 Design step
Design step is the first step of the data mart process. Design step covers all of the tasks from
initiating the request of for a data mart through gathering user requirements (Chapter 2),
analyzing user requirements (Chapter 3) and developing the logical and physical design of the
data mart.
This step consists of the following tasks:
Getting business and technical requirements
Identification of data sources
Choosing an appropriate data subset
Designing logical and physical structure of the data mart
Chapters 2 & 3 covered all these tasks.
3.2 Construction step
This step includes creating the physical database and the logical structures associated with the
data mart to provide fast and efficient access to the data. This step consists of the following
tasks:
Creating the physical database and storage structures like tablespaces associated with
the data mart.
Creating schema objects
Determining how best to set up the tables and access structures
An SQL script to create the physical database is included in the source code pack that contains
all the source files for IDART DATA MART.
Here’s a partial content of this file.
-- PostgreSQL database dump
--
drop database if exists sampledata;

22
CREATE DATABASE sampledata WITH OWNER = postgres ENCODING = 'UTF8'
TABLESPACE = pg_default;
\connect sampledata postgres
SET statement_timeout = 0;
SET client_encoding = 'UTF8';
SET standard_conforming_strings = off;
SET check_function_bodies = false;
SET client_min_messages = warning;
SET escape_string_warning = off;
SET search_path = public, pg_catalog;
SET default_tablespace = '';
SET default_with_oids = false;
--
-- Name: clinic; Type: TABLE; Schema: public; Owner: postgres; Tablespace:
--
CREATE TABLE clinic
(
id integer NOT NULL,
address1 character varying(255),
address2 character varying(255),
notes character varying(255),
postalcode character varying(255),
province character varying(255),
telephone character varying(255),
mainclinic boolean,
clinicname character varying(255),
city character varying(255),
modified character(1),
CONSTRAINT clinic_pkey PRIMARY KEY (id),
CONSTRAINT unique_clinicname UNIQUE (clinicname)
);
ALTER TABLE public.clinic OWNER TO postgres;
.
.
.
.

23
This script creates all a database named sampledata and grants access to users that will use the
data mart. This database has six tables named clinic, patient, episode, package, idartfact and
time. A step-by-step guide on how to run an SQL script is included on the user guide which is
on the last chapter.
Next a star schema to be used for analysis view is created. This schema has for dimensions
namely:
Site/Location
Time
Gender
Age group
Here’s an xml schema file.
<?xml version="1"?>
<Schema name="iDARTSchema">
<!-- Shared dimensions -->
<Dimension name="Site">
<Hierarchy hasAll="true" allMemberName="All Sites">
<Table name="CLINIC"/>
<Level name="Site" column="CLINICNAME" uniqueMembers="true"/>
</Hierarchy>
</Dimension>
<Dimension name="Time" foreignKey="TIME_ID" >
<Hierarchy hasAll="true" allMemberName="All Years" primaryKey="TIME_ID">
<Table name="DIM_TIME"></Table>
<Level name="Years" column="YEAR_ID" type="String" uniqueMembers="true"/>
<Level name="Quarters" column="QTR_NAME" type="String" uniqueMembers="true"/>
<Level name="Months" column="MONTH_NAME" type="String"
uniqueMembers="true"/>
</Hierarchy>
</Dimension>
<Dimension name="Gender">
<Hierarchy hasAll="true" allMemberName="All Genders">
<Table name="PATIENT"/>
<Level name="Gender" column="SEX" uniqueMembers="true"/>
</Hierarchy>
</Dimension>
<Cube name="Treatment Analysis">
<Table name="CLINIC"/>
<DimensionUsage name="Site" source="Site"/>
<DimensionUsage name="Time" source="Time" />
<DimensionUsage name="Gender" source="Gender" />
<Measure name="Treated patients" column="TREATED" aggregator="sum"
formatString="#,###"/>
<Measure name="Enrolled patients" column="ENROLLED" aggregator="sum"
formatString="#,###"/>

24
</Cube>
</Schema>
3.3 Populating step
This step includes all the tasks related to getting the data from the sources, modifying it to the
right format and level of detail and moving it into the data mart. This step consists of the
following tasks:
Mapping data sources to target data structures
Extracting data
Loading extracted data into the data mart
On this step Talend Open Studio 4.0.1 is used. From this tool a job named iDART_ETL is
created, then three database connections to the IDART instances from where data will be
extracted are created. Another database connection is created to the data mart. After running the
job the data will be extracted from the data sources through the database connections created to
the data mart. A step-by-step guide on how to create an ETL job, how to run it and how to
create database connections using Talend Open Studio 4.0.1 is included in the user guide which
is on the last chapter.
3.4 Accessing step
This step involves putting the data in the data mart into use: query the data, analyzing it,
creating reports, graphs, charts and publishing these. The end user uses a graphical front-end
tool to submit queries to the database and display the results of the queries. This step consists of
the following tasks:
Setting up an intermediate layer for the front-end tool to use. This layer translates
database structures and object names into business terms, this helps end users interact
with the data mart using terms that are related to the business function.
Manage and maintain business interfaces.
To help queries submitted through the front-end tool execute quickly and efficiently, set
up and manage database structures.
Pentaho Business Intelligent suite Community Edirion 3.6.0 will provide common functions of
business intelligence technologies such as reporting, online analytical processing, analytics, etc.
All the components (xaction and xml files) that will be used to provide and view data are
included is included in the user guide which is on the last chapter.
The jsp script file named SampleDashboard is created.
The script in this jsp file controls the layout and content generation of the dashboard.
The above steps provide a roadmap to data mart design and implementation.

25
C h a p t e r 8
TESTING
Software testing is an investigation conducted to provide stakeholders with information about
the quality of the product or service under the test.[1]
This chapter provides the steps involved testing a data mart.
Now that the data mart is up and running, what kinds of things need to be tested in a data mart?
Well, one doesn’t need to test transactions as this is the responsibility of the ETL system
(Talend Open Studio in this case). What one needs to test is the quality of the data in the data
mart. This includes both measures in the fact table and data in the dimension tables.
To prepare for the test, we set up three Windows XP virtual machines with each running an
instance of IDART. Then created a virtual network with these virtual machines, configured the
servers on these machines to allow non-local connections by adding more host records and
made PostgreSQL listen on a non-local interface via the listen_addresses configuration
parameter.
Now that these machines are up and running and can ping each other we are ready to go.
Pentaho BI server is also up and running and Talend Open Studio on one of them. Each
instance of IDART has its own sample data.
There are two different times that we need to test our data mart. We need to test it before our
ETL load and also after.[7] We can then run the regular or standard ETL process into the fact or
dimension table and then re-run the test with the new expected results. These two sets of tests
are to be run on known and static data.
The figure below (Figure 10) shows the number of patients that are on treatment on each
province running IDART. From the figure one can see that Free State is sitting at 65% and both
Mpumalanga and Western Cape at 18%.
Figure 10 (a): Provincial Statistics before ETL process.

26
Now, after adding more patients in Mpumalanga then running the ETL process we expect to see
some changes on the dashboard. From the figure below one can see that now Free State is still
sitting at 65% and Western Cape still at 18% but Mpumalanga is now at 22% as expected.
Figure 10 (b): Provincial Statistics after the ETL process.

27
C h a p t e r 9
USER GUIDE
Getting Started [6]
Installing and Configuring Java
The Pentaho BI Platform requires a JVM (Java Virtual Machine) to be installed on your PC or
server. To check if Java is already installed issue the following command (seen in bold) at the
command prompt:
C:\>java -version
java version "1.6.0_13"
Java(TM) SE Runtime Environment (build 1.6.0_13-b03)
Java HotSpot(TM) Client VM (build 11.3-b02, mixed mode, sharing)
If a similar output (seen above) is displayed Java is already installed. If not, to install Java on
Windows you will need to download the Java installation file from the Sun Developer Network
downloads page.
The next step is to check if the JAVA_HOME environment variable is setup correctly, issue the
following command (seen in bold) at the command prompt:
C:\>echo %JAVA_HOME%
C:\Program Files\Java\jdk1.6.0_13
If a similar output (seen above) is displayed the JAVA_HOME environment variable is already
setup. To setup the JAVA_HOME environment variable right click on My Computer and click
the Properties option then the Advanced tab and click the Environment Variables button.
Depending on your setup (User variables or System variables)click on the New button to create
a new Environment Variable (in this guide I will be adding them for the user). For the variable
name enter JAVA_HOME and for the variable value find the location of your Java installation
in this example it is c:\Program Files\Java\jdk1.6.0_13:
The CATALINA_OPTS environment variable should also be set to tell the Apache-Tomcat
server to use more than the default memory, to do this follow the same steps from above but
this time make sure you set the variable name to CATALINA_OPTS and the variable value to -
Xms256m -Xmx768m -XX:MaxPermSize=256m -Dsun.rmi.dgc.client.gcInterval=3600000 -
Dsun.rmi.dgc.server.gcInterval=3600000
From now on every time the PC or server is started/restarted the JAVA_HOME and
CATALINA_OPTS environment variables will be set automatically.
Packaged Apache-Tomcat Server
You will need to first download the pentaho-ce-3.6.x.stable.zip file from the Pentaho
Sourceforge projects page - this file contains all the files/packages needed for setting up our
platform. After downloading extract its contents into a folder you would like to store the
Pentaho BI Server - in this example I have chosen c:\pentaho\.
Use 7-Zip to extract the file contents to C:\pentaho\ folder.

28
The following folders should be visible after you have extracted the ZIP file:
C:\
|-- pentaho
| |-- adminstration-console
| |-- biserver-ce
Copy the SQL Script Pack for PostgreSQL 8.3 to a temporary location. These are the five SQL
scripts which should be inside the pack:
1_create_repository_postgresql.sql
Creates the Hibernate database
2_create_quartz_postgresql.sql
Creates the Quartz database
3_create_sample_datasource_postgresql.sql
Loads the sample data data source into the Hibernate database
4_load_sample_users_postgresql.sql
Creates all the sample users and roles into the Hibernate database
5_sample_data_postgresql.sql
Creates the sample data database
You must load the above scripts in the order they are listed. Load these SQL scripts using the
PostgreSQL console.
Load the SQL scripts
Before you start make sure that you place all your SQL scripts in the folder which you will be
logging into the PostgreSQL console, in this example that is C:\pentaho\tmp\.
Issue the following commands found in bold one after the other:
c:\pentaho\tmp psql --username=postgres -f create_repository_postgresql.sql
Password for user postgres:
...output
Password for user hibuser: [enter "password"]
c:\pentaho\tmp psql --username=postgres -f create_quartz_postgresql.sql
Password for user postgres:
...output
Password for user pentaho_user: [enter "password"]
c:\pentaho\tmp psql --username=postgres -f create_sample_datasource_postgresql.sql
Password for user postgres:
Password for user hibuser: [enter "password"]
...output
c:\pentaho\tmp psql --username=postgres -f load_sample_users_postgresqlsql
Password for user postgres:
Password for user hibuser: [enter "password"]
...output
c:\pentaho\tmp psql --username=postgres -f sample_data_postgresql.sql
Password for user postgres:
...output
Now run the following command (in bold) to see if you have successfully created the hibernate,
quartz and sampledata databases:
psql> show databases;

29
Just for reference here are the databases and tables which should of been created after loading
the contents of the PostgreSQL 8.x.x SQL Script pack:
hibernate*
o authorities
o datasource
o granted_authorities
o users
quartz
o qrtz_blob_triggers
o qrtz_calendars
o qrtz_cron_triggers
o qrtz_fired_triggers
o qrtz_job_details
o qrtz_job_listeners
o qrtz_locks
o qrtz_paused_trigger_grps
o qrtz_scheduler_state
o qrtz_simple_triggers
o qrtz_trigger_listeners
o qrtz_triggers
sampledata
o clinic
o patients
o episode
o package
o idartfact
Configuring JDBC Security
This section describes how to configure the Pentaho BI Platform JDBC security to use a
PostgreSQL server, this means the Pentaho BI Platform will now point to the hibernate
database on the PostgreSQL server instead of the packaged HSQL database.
NOTE↴
If you already have a user which you prefer to have access to the hibernate database instead of
the default user hibuser, you will need to modify all occurances of hibuser/password in this
section.
applicationContext-spring-security-jdbc.xml
This file is located under the pentaho-solutions\system\ folder.
Once the file has opened locate this snippet of code:
<!-- This is only for Hypersonic. Please update this section for any other database you are using
-->
<bean id="dataSource"
class="org.springframework.jdbc.datasource.DriverManagerDataSource">
<property name="driverClassName" value="org.hsqldb.jdbcDriver" />
<property name="url"
value="jdbc:hsqldb:hsql://localhost:9001/hibernate" />
<property name="username" value="hibuser" />
<property name="password" value="password" />
</bean>

30
Make changes to the highlighted sections so that the section of code looks similar to this:
<!-- This is only for Hypersonic. Please update this section for any other database you are
using -->
<bean id="dataSource"
class="org.springframework.jdbc.datasource.DriverManagerDataSource">
<property name="driverClassName" value="org.postgresql.Driver" />
<property name="url"
value="jdbc:postgresql://localhost:5432/hibernate" />
<property name="username" value="hibuser" />
<property name="password" value="password" />
</bean>
applicationContext-spring-security-hibernate.properties
This file is located under the pentaho-solutions\system\ folder.
Once the file has opened locate this snippet of code:
jdbc.driver=org.hsqldb.jdbcDriver
jdbc.url=jdbc:hsqldb:hsql://localhost:9001/hibernate
jdbc.username=hibuser
jdbc.password=password
hibernate.dialect=org.hibernate.dialect.HSQLDialect
Make changes to the highlighted sections so that the section of code looks similar to this:
jdbc.driver=org.postgresql.Driver
jdbc.url=jdbc:postgresql://localhost:5432/hibernate
jdbc.username=hibuser
jdbc.password=password
hibernate.dialect=org.hibernate.dialect.PostgreSQLDialect
hibernate-settings.xml
This file is located under the pentaho-solutions\system\hibernate\ folder.
Once the file has opened locate this snippet of code:
<config-file>system/hibernate/hsql.hibernate.cfg.xml</config-file>
Make changes to the highlighted section so that the section of code looks similar to this:
<config-file>system/hibernate/postgresql.hibernate.cfg.xml</config-file>
postgresql.hibernate.cfg.xml (optional)
This file is located under the pentaho-solutions/system/hibernate/ folder.
You do not need to make any changes to this file if you would like to use the default user
hibuser (which was created with the 4_load_sample_users_postgresql.sql file). However, if you
would like to specify your own user find and change the following two lines of code:
<property name="connection.username">hibuser</property>
<property name="connection.password">password</property>
Make changes to the highlighted sections to a username and password of your choice.
Configuring Hibernate and Quartz
Hibernate and Quartz need to specifically use the hibernate and quartz databases which were
created on the PostgreSQL server. To do so modifications need to be made to the context.xml
file which is located in the \tomcat\webapps\pentaho\META-INF folder.
NOTE↴

31
If you already have a user which you prefer to have access the hibernate database instead of the
default user hibuser, you will need to modify all occurances of hibuser/password in this
section.This also applies to the pentaho_user/password used to connect to the Quartz database.
context.xml
Once the file has opened the following piece of code should be visible:
<?xml version="1.0" encoding="UTF-8"?>
<Context path="/pentaho" docbase="webapps/pentaho/">
<Resource name="jdbc/Hibernate" auth="Container" type="javax.sql.DataSource"
factory="org.apache.commons.dbcp.BasicDataSourceFactory" maxActive="20" maxIdle="5"
maxWait="10000" username="hibuser" password="password"
driverClassName="org.hsqldb.jdbcDriver" url="jdbc:hsqldb:hsql://localhost/hibernate"
validationQuery="select count(*) from
INFORMATION_SCHEMA.SYSTEM_SEQUENCES" />
<Resource name="jdbc/Quartz" auth="Container" type="javax.sql.DataSource"
factory="org.apache.commons.dbcp.BasicDataSourceFactory" maxActive="20" maxIdle="5"
maxWait="10000" username="pentaho_user" password="password"
driverClassName="org.hsqldb.jdbcDriver" url="jdbc:hsqldb:hsql://localhost/quartz"
validationQuery="select count(*) from
INFORMATION_SCHEMA.SYSTEM_SEQUENCES"/>
</Context>
Make changes to the highlighted sections so that the section of code looks similar to this:
<?xml version="1.0" encoding="UTF-8"?>
<Context path="/pentaho" docbase="webapps/pentaho/">
<Resource name="jdbc/Hibernate" auth="Container" type="javax.sql.DataSource"
factory="org.apache.commons.dbcp.BasicDataSourceFactory" maxActive="20" maxIdle="5"
maxWait="10000" username="hibuser" password="password"
driverClassName="org.postgresql.Driver" url="jdbc:postgresql://localhost:5432/hibernate"
validationQuery="select 1" />
<Resource name="jdbc/Quartz" auth="Container" type="javax.sql.DataSource"
factory="org.apache.commons.dbcp.BasicDataSourceFactory" maxActive="20" maxIdle="5"
maxWait="10000" username="pentaho_user" password="password"
driverClassName="org.postgresql.Driver" url="jdbc:postgresql://localhost:5432/quartz"
validationQuery="select 1"/>
</Context>
quartz.properties
An extra change that needs to be done to get PostgreSQL 8.x.x working with Quartz is to open
the quartz.properties file which located under the \pentaho-solutions\system\quartz\ folder.
Locate the following snippet of code:
#org.quartz.jobStore.driverDelegateClass =
Make changes to the highlighted sections so that your code looks similar to this (in bold):
org.quartz.jobStore.driverDelegateClass = org.quartz.impl.jdbcjobstore.PostgreSQLDelegate
Starting the Business Intelligence Platform
The Pentaho BI Platform is a webapp on the Apache-Tomcat server. To start Apache-Tomcat
you will need to setup Apache-Tomcat as a service which is a lot easier to start and stop (skip
this step if you are using an existing installation of Apache-Tomcat). At the command prompt
issue the following command (in bold):
C:\pentaho\biserver-ce\tomcat\bin> service.bat install tomcat5
Installing the service 'tomcat5' ...

32
Using CATALINA_HOME: D:\pentaho\biserver-ce\tomcat
Using CATALINA_BASE: D:\pentaho\biserver-ce\tomcat
Using JAVA_HOME: C:\Program Files\Java\jdk1.6.0_13
Using JVM: C:\Program Files\Java\jdk1.6.0_13\jre\bin\server\jvm.dll
The service 'tomcat5' has been installed.
Once you have received the above output the next step is to start the Tomcat service. To do this
firstly click on the Start button then Run and type in services.msc and click OK. A Services
window should appear and it will list all available services, locate the Apache Tomcat tomcat5
service and double click on it to open up the Properties dialog box
To start Tomcat click on the Start button (to stop Tomcat simply click on the Stop button).
If the Pentaho BI Platform has started successfully you should see the following welcome
screen when you visit http://localhost:8080/pentaho:
Figure 11: Pentaho BI Platform welcome screen.
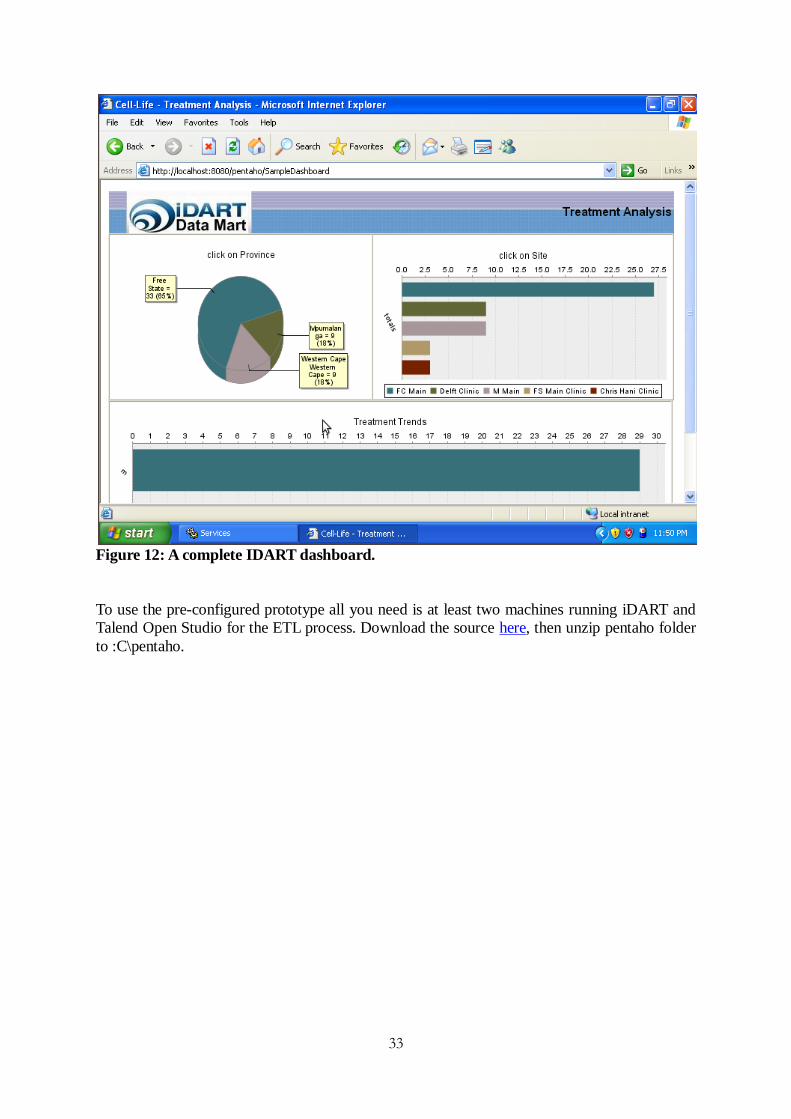
To navigate to iDART dashboard go to http://localhost:8080/pentaho/SampleDashboard
33
Figure 12: A complete IDART dashboard.
To use the pre-configured prototype all you need is at least two machines running iDART and
Talend Open Studio for the ETL process. Download the source here, then unzip pentaho folder
to :C\pentaho.

34
BIBLIOGRAPHY
[1] BATIN, C., SERI, S., AND NAVATE, S.B, (1994) Conceptual Database Design: An Entity
Relational Approach, Redwood City, California
[2] Executive editors: Alain Abran, James W. Moore; editors Pierre Bourque, Robert Dupuis, ed
(March 2005).
[3] InfoManagement Direct, November 1999. Data Mart Does Not Equal Data Warehouse
[online]. Available http://www.information-management.com/infodirect/19991120/1675-1.html
[accessed 7 March 2010]
[4] KIMBALL, R.,(1996): The Data Warehouse Toolkit, New York: J. Wiley & Sons.
[5] KIMBALL, R.,(1997): DBMS Online,A Dimensional Manifesto August, 1997.
[6] http://www.prashantraju.com/projects/pentaho/
[7] http://mgarner.wordpress.com/2006/09/27/automated-testing-for-datamarts/

35
APPENDIX A

36
APPENDIX B
37
APPENDIX C

38
APPENDIX D

39
APPENDIX E
TERM 3