Embed Size (px)
Citation preview
THE ASSESMENT OF MARKETING MIX ELEMENTS
IN PROMOTING CUSTOMER SATISFACTION:
A CASE STUDY ON HABESHA BREWERY SHARE COMPANY
By: Yohanne G/Senbet
GSD/9108/08
Advisor: Temesgen Belayneh (PHD)
A Thesis Submitted to the School of Graduate Studies of Addis Ababa University in Partial Fulfillment of the requirement for
the Award of Masters of Arts in Marketing Management
Department of Marketing Management Addis Ababa University School of Commerce
Dec, 2018
Addis Ababa
I

INTENTIONALLY
BLANK PAGE
I

TABLE OF CONTENT
Approval…………………………………………………………………………..….i Declaration ..................................................................................................................... iiVI
Acknowledgement ........................................................................................................ VIIiii
Abstract .............................................................................................................................. iv
CHAPTER ONE .................................................................................................................. 1
INTRODUCTION ............................................................................................................... 1
1.1. Background of the Study .............................................................................................. 1
1.2. Statement of the problem ............................................................................................. 3
1.3 Objective of the Study ................................................................................................... 5
1.3.1 General Objective of the Study ........................................................................... 5
1.3.2 Specific Objectives of the Study ......................................................................... 5
1.4. Research Questions ...................................................................................................... 5
1.5 Significance of the study ............................................................................................... 6
1.6 Definition of Key Terms ............................................................................................... 6
1.7 Limitation and Scope of the study ................................................................................. 7
1.7.1 Limitation ............................................................................................................ 7
1.7.2 Scope ................................................................................................................... 7
1.8 Organization of the study .............................................................................................. 7
CHAPTER TWO ................................................................................................................. 8
Introduction ......................................................................................................................... 8
2.1 Theoretical Review ........................................................................................................ 8
2.1.1. Product ............................................................................................................... 9
2.1.2 Price .................................................................................................................. 13
2.1.3 Promotion .......................................................................................................... 15
2.1.4 Place .................................................................................................................. 17
2.2 Empirical Review ........................................................................................................ 21
2.3 Conceptual Framework ............................................................................................... 22
II

CHAPTER THREE ........................................................................................................... 23
RESEARCH DESIGN & METHODS .............................................................................. 23
3.1 Research Approach ...................................................................................................... 23
3.2 Research Design .......................................................................................................... 24
3.3 Population of the Study ............................................................................................... 25
3.4 Sampling Procedure .................................................................................................... 25
3.4.1 Sampling Technique ......................................................................................... 25
3.4.2 Sample size ....................................................................................................... 25
3.5 Validity ........................................................................................................................ 26
3.6 Reliability .................................................................................................................... 27
3.7 Data Gathering Instrument .......................................................................................... 27
3.8 Method of Data Analysis ............................................................................................. 27
3.9 Ethical Considerations ................................................................................................. 28
CHAPTER FOUR ............................................................................................................. 29
4.1 Data Analysis and Interpretation ................................................................................. 29
4.1.1 Rates of Response ............................................................................................. 29
4.1.2 Reliability Test Result ....................................................................................... 29
4.1.3 Demographic Characteristics of Respondents .................................................. 30
4.2Descriptive Statistics of Scale Type Questionnaire ..................................................... 33
4.2.1Analysis of Marketing mix elements and Customer s’ Satisfaction .................. 34
4.3 Pearson Correlation Analysis ...................................................................................... 39
4.4. Discussion of the Result ............................................................................................. 41
CHAPTER FIVE ............................................................................................................... 44
SUMMARY OF FINDINGS, CONCLUSION AND RECOMMENDATION ................ 44
5.1. Summary of the Major Finding .............................................................................. 44
5.2. Conclusion .............................................................................................................. 45
5.3. Recommendations ................................................................................................... 46
5.4. Further implications ................................................................................................ 46
References ......................................................................................................................... 47
III

List of tables
Table 1: Rates of Response……………………………………………………..…………......29
Table 2: Cronbach's Alpha result……………………………………………………………...30
Table 3: Demographic Characteristics of the Respondents….................................................31
Table 4: Measuring customer satisfaction towards product attributes ……………................34
Table 5: Measuring customer satisfaction towards price attributes…………………………...36
Table 6: Measuring customer satisfaction towards promotion attributes…………………......37
Table 7: Measuring customer satisfaction towards place/Distribution attributes ..…………...38
Table 8: Correlation analysis …………………………………………………..…………......40
Table 9: Summary of hypothesis………………………..…………………..………………...43
IV

APPROVAL
The undersigned certify that they have read and hereby recommend to the Addis
Ababa University School of Commerce to accept the thesis of Yohannes
G/senbetDubale and entitled “The Assessment of Marketing Mix Elements in
Promoting Customer Satisfaction: in case of Habesha Brewery Share Company,” In
partial fulfillment of requirement for the award of Master’sDegree in Marketing
Resource Management.
________________________ ____________________ _______________
Chairperson Signature Date
______________________ ____________________ _________________
Internal Examiner Signature Date
____________________ ____________________ ___________________
External Examiner Signature Date
_____________________ ____________________ __________________
Advisor Signature Date
V

Declaration
I Yohannes G/senbet, Registration Number/I.D GSD/9108/08, do here by declare that
this Thesis is my original work and that it has not been submitted partially or in full,
by any other person for an award of a degree in any other university/ institution.
Yohannes G/senbet
Name Signature Date
VI

Acknowledgement
This study would not have been completed if it were not for the help of numerous
people and institution. Foremost I would like to thank Almighty God who gave me the
patience and grace throughout the years. I would especially like to express my deep
gratitude to my advisor Dr. Temesgen Belayneh for his constrictive thoughts,
insightful suggestions, and useful guidance throughout the research project works.
Meanwhile I would like to thank all respondents for your willingness, patience, and
trust to respond the questionnaires. Also I am very much thankful to Dr.
MesfinWerkineh (marketing department head) for his comment and suggestions
throughout the thesis works. Furthermore I am enormously thankful to my families
(Mom and Dad) for their unlimited moral encouragement, material and financial
support throughout the course years and research work. Finally I would like to
gratitude my Wife Meron Zinabu for her love, care and support throughout the whole
course season.
Yohannes G/senbet 2018 G.C.
VII

Abstract
The marketing mix is the means by which marketing objectives of the organization will
be achieved and comprises of product, price, promotion and place of the marketing
activities. Companies can win the competition by doing a better job in order to satisfy
the customers’ needs and wants, and customer-centered companies are adopt at
building customers not just building a product. This study focuses on the assessments
of marketing mix elements in prompting customer satisfaction of the Habesha Brewery
Share Company. The main objective of the study was that to find out whether
customers are satisfied with regard to the four controllable variable marketing mix
factors (product, price promotion and place/distribution). Such study helps the factory
to be aware of its customer’s satisfaction level that will move in parallel with the
changing customers need and want. The necessary data have been collected using
primary sources of data collection (Questionnaires) from a total of 384 respondents.
The data were processed, analyzed and interpreted usingDescriptive statistics (mean
and St. Deviation). This study concludes that customers are satisfied with the
promotion and place attributes more than price and product attributes. From the
finding we can noted that Habesha beer customers are highly satisfied with its
promotion attributes and least satisfied with its product attributes. soI recommended
that the factory mustassure the quality of its products and other product related
attributes (like packaging & labeling) in order to win customers’ satisfaction and
consequentlyachieve a competitive advantage and long run survival.
Keywords:customer satisfaction, marketing mix, product, price, promotion,
distribution,
VIII

CHAPTER ONE
INTRODUCTION
1.1. Background of the Study
Today’s companies are facing toughest competition than ever. Companies can win the
competition by doing a better job in order to satisfy the customers’ needs and wants,
and customer-centered companies are adept at building customers not just building a
product (Johansson J, 2000:12). Customer satisfaction is a person feeling of pleasure
or disappointment resulting from comparing a product’s perceived performance
(outcome) in relation to his/her expectation (Kotler P and Armstrong G, 2010:7). It
may be clear from the above definition customers’ satisfaction is a function of
perceived performance and expectations. If the performance falls short of expectations,
the customer is dissatisfied. If the performance matches the expectations, the customer
is satisfied, and if the performance exceeds expectations, the customer is highly
satisfied or delighted.
There for Due to the growing competition in the market place, more demanding and
assertive customers, and rapid advancement in technology has changed the marketing
environment dramatically and is becoming more turbulent. In order to be successful in
the business, companies should have a competitive marketing mix strategy. The main
reason that makes marketing mix a powerful concept is, it makes marketing easy to
handle and allow the separation of marketing activities from other activities of the firm
and the delegation of marketing tasks to specialists (Goi, 2009).
The company should constantly compare the value and customer satisfaction delivered
by its products, prices, distribution channels and promotion with those of its close
competitors. By doing this, the company can identify areas of potential advantage and
disadvantage. By the competitor analysis the company can start to formulate their
marketing mix strategies (Kotler, 2002).
1

The term marketing mix has its origins when Neil Borden identified the controllable
marketing elements that properly managed would result to a profitable business
operation. But McCarthy reduced Borden's factors to a simple four-element framework
commonly known as the 4Ps, i.e., Product, Price, Promotion and Place (McCarthy,
1960 in Shaw, 2012). According to Dacko (2008) marketing mix is all the key
activities which are used in marketing business products.
As a result of the country continuous economic development, the beer market of
Ethiopia exposing an amazing increasing trend every year, especially in recent years.
Because of this attractive industrial growth new domestic and foreign investors are
investing in the sector. This makes the competition stiff and brewery companies
should have sound marketing mix strategy to satisfy their consumers.
This study will be conducted in beer manufacturing company. Brewing has been
mentioned in history as early as Egyptian times and has continued on to the present
day with relatively few changes to the basic recipe. Beer is the world most widely
consumed alcoholic beverage; it is the third-most popular drink overall, after water
and tea. For instance, according to the Brewing Industry Report (2011), in Europe beer
is one of the most favorite drinks, best enjoyed and valued in a social atmosphere.
Beer in Ethiopia is the most popular alcoholic beverage in Ethiopia with lager being
the most consumed type of beer; Lager is a type of beer conditioned at low
temperatures. The first brewery in Ethiopia was established in 1922 by St. George
Beer (named after the patron saint of Ethiopia). Brands like Meta and Bedele are also
older brands in Ethiopia but have since been acquired by foreign companies and re-
branded. Beer industry in Ethiopia has gone through tremendous growth in the last
two decades.The competitiveness of the industry has led to more investment the
farming sector such as in malt production. There are lots of beer brands offered to the
Ethiopian beer market currently, some of them are BGI groups, Dashen, Harar, Meta,
Bedele, and Habesha. In addition to this, there are many new companies which come
into to the beer market in recent times and others are under construction which
indicates that the competition will becoming quite big.
2

This study will try to assess the marketing mix elements (product, price, promotion
and place) in promoting customer satisfaction of the Habesha Brewery Share
Company. Because of the Ethiopian government privatization policy of the beer
industries, large and well known foreign beer companies are entering into the
Ethiopian beer market and the existing breweries are expanding their production
capacity. This creates a high treat to the local companies like Habesha breweries. In
order to compete with these international beer companies in the local market, the
factory should have a sound marketing mix strategy. This study will try to show the
marketing mix elements by considering the consumers of the company’s product and
making the company successful.
Therefore, in order to be successful or a leading organization it should be able to
satisfy in the 4p’s. Habesha Beer: the authentic, golden beer, founded and owned by
thousands of proud Ethiopians. Habesha stands for gratitude, and the celebration of
togetherness. It defines the shared pride and culture of all Ethiopians,and encourages
those who dare to be authentic. Its striking natural beauty, generous people and truly
authentic culture are unique. Its ancient civilization, with colorful traditions and rich
diversity, never ceases to amaze. Habesha is the reflection of the “Ethiopian pride
grounded on past achievements, and a bright outlook into the future.” Habesha
Breweries Share Company is a brewery company, engages in the production, sales,
and distribution of beer in Ethiopia. The company headquarter is based in Addis
Ababa, Ethiopia, and its brewery located in Debre Brehan, 130km north of Addis
Ababa.
1.2. Statement of the problem Customer satisfaction is a very vital and it is a determinant factor for the long term
survival of any business organization (Jeans F, 2004:54). So in today’s competitive
business world it has come out as a decisive factor for the success or failure of
business objectives. For this reason, companies meeting their customers’ needs and
wants are enjoying the market with the customer loyalty and getting positive response
for their product. But without satisfying customers the above mentioned marketing
3

success could be unthinkable. There are growing numbers of tough competitions in the
beer industry of Ethiopia from time to time, as so many brewery companies are
entering in to the market, but still there are unmeet customer needs.
Despite the flow in beer production in the country, industry insiders believe that the
market is not saturated yet. Alazar Ahmed, a private marketing expert and consultant
in the brewery industry, is among those who believe there is a mass market in the
industry."The market is still untapped, yet to see new players in the field," he said.
"The expansion of brewers is inevitable considering that beer consumption in the
country is too low."The per capita consumption of beer in Ethiopia stands at 10 litters,
which is low compared with Kenya, whose population is two times lower than
Ethiopia and has a per capita beer consumption of 12 litters.
Some believe although per capita beer consumption in Ethiopia is small by regional
standards, the degree of urbanization and soaring disposable income will hike up the
demand in the coming years.
Recent investment seen in the brewery market indicates that there is a growing
demand in the market, says Tewolde Asfaw, CEO of Raya Brewery. “The growth in
population and income helps the industry to revive. Market differentiation with the
introduction of new brands to the country will further help the industry to boom in the
coming years.”
In this regard, a research should be carried out for these growing and highly
competative market environment to evaluate the customer satisfaction level of
Habesha beer s.co. by assesing the marketing mix elements; product, price, promotion
and place/Distribution, which are the independent variables.For the past years, a few
researches have done in relating with customer satisfaction on Brewery companys and
most of them are how pricing in hence the company’s profitability. “The Assessment
of marketing mix in increasing Customer Satisfaction by Zelalem June, 2011
concludes that customers are satisfied with the quality of the products and the
distribution (place) systems of the factory yet they are not satisfied with the price and
that of the promotional practices of the factory.” And also “the assessment of the
4

marketing mix strategy, by hassen 2014 concludes that “when price of the product is
reduced, the company should consider its impact on the consumers' perception on
quality”. but there is no research done at Habesha Breweries regarding to the
Assessment of marketing mix elements in promoting customer satisfaction, but my
study will helps to fill the gap related to the highly growing market competition and
competitors and the level of customer satisfaction with regard to the 4p’s utilized by
the company and it helps the factory to be aware of its customer’s satisfaction level
that will move in parallel with the changing customers need and want, with regard to
the product, the price charged, the promotion and available placement (distribution)
utilized by the Habesha Breweries S. Co. There is the traditional thinking to get profit
through increasing volume of sales should be changed to the thinking that profit
should be made from customer satisfaction.
1.3 Objective of the Study
1.3.1 General Objective of the Study The general objective of the study was to assess the marketing mix elements of the
Habesha Brewery share company; the product, price, promotion and distribution, in
promoting customer satisfaction.
1.3.2 Specific Objectives of the Study While assessing the marketing mix of the Habesha Brewery, the researcher will focus
on the following specific objectives;
To examine the product quality and the customer satisfaction.
To assess the price of the company’s product and the customer satisfaction.
To analyze the effect of promotionon customer satisfaction.
To examine the impact of product distribution on customer satisfaction.
1.4. Research Questions The researcher will try to address the following questions: -
How product quality affect customer satisfaction?
To what extenet price of the product affect customer satisfaction?
5
What is the effect of promotions on customer satisfaction?
Does product distribution affect customer satisfaction?
1.5 Significance of the study Under taking such study will be very crucial or vital for any business entity (special
regard to Habesha Breweries S. Co) to know its customer satisfaction level with regard
to the product, Setting price, promotion and placement (distribution) of the company
that will move in parallel with the changing customers’ need and wants. Because in
today’s, competitive business world effective manipulation of these marketing mix
elements strongly determines the long run survival of the company. Furthermore, the
study will acquire knowledge about the way of conducting a research with Identified
problems, and it will contribute further explanations for studies on the subject matter.
1.6 Definition of Key Terms Marketing: - is the social process by which individuals and groups obtain what
they need and want through creating and exchanging products and value to each
other’s.
Product: - a product is anything that can be offered to a market for attention, use
or consumption that satisfies a want or need.
Price: - it is probably the single most important decision in marketing and it is the
mechanism which ensures that the two forces (demand and supply) are in
equilibrium.
Promotion: - it is a marketing activity that disseminating information about a
product, Products line, brand, or the company.
Distribution: - it is the set of firms and individuals that take title or assist in
transferring title to a good or service as it moves from the producer to the
consumer.
Customer Satisfaction: - It is defined as a result of a cognitive and effective
evaluation, where some comparison started is compared to the actually perceived
performance.
6

1.7 Limitation and Scope of the study
1.7.1 Limitation While doing this research the researcher will face the following limitation. Firstas the
case is marketing research, the researcher also studies the customer behaviors that are
rational. Sometimes, they may not express their feelings correctly what they think. In
such cases, their habits, practices, references will not be assessed without limitation of
bias.Second because of applying non-probability (judgmental or deliberate/purposive).
sampling approach the unit in the universe do not enjoy equal chance of getting
included in the sample. As a result there will be element of bias in selection too and
finally the researcher has not participated in such a research at a post graduate level
before, so the study will face limitation of the researcher experience.
1.7.2 Scope This research paper will try to focus on, “The Assessment of marketing mix elements
in promoting customer satisfaction” of Habesha beer share company individual
customers found in Addis Ababa city administration. While doing this paper Both
probability (simple random sampling) and non-probability (deliberate or purposive or
judgmental) sampling approach will be applied in contacting target units (respondents)
of the study using questionnaire in both English and Amharic languages considering
that target audiences will be Ethiopian citizens.
1.8 Organization of the study The arrangement of the research paper will be organized into five chapters; The first
chapter deal about background of the study, statement of the problem, research
question, research objectives, significant of the study, definition of key terms,
Limitation and Scope of the study and organization of the study. The second chapter of
the study will be concerned on presenting the review of the related literatures. The
third chapter will focus on research design and methodology. The fourth chapter will
devote to data presentation, analysis and Interpretation and finally the fifth chapter
deals with the summary, conclusion and recommendation of the study.
7

CHAPTER TWO
REVIEW OF RELATED LITERATURE
Introduction
Under this part of the research the researcher will tries to assess the related literatures
and specifically the theoretical, empirical and conceptual reviews of the research topic.
2.1 Theoretical Review The starting point for the discipline of marketing lies in human needs of wants. All
human beings have a need to satisfy human needs are states of felt deprivation.
Therefore, human beings try to satisfy these needs by exchanging goods and services
with other interested parties. Thus, the concept of exchange leads to the concept of a
market. Kotler P and Armstrong G, (2010:7) defines a market as: “A public gathering
consisting of all the potential customers sharing in exchange to satisfy that needs or
wants”. From the above definition we can interpret that marketing is the exchange
between the customer and the marketer and each party gives something of value to the
other, with the goal of satisfying their respective needs and wants, and then in the
process both parties gain as much as possible.
Marketing can be defined as series of activities to promote and sell products and/or
services to gain profit (Amit &Zott, 2001). Marketing activities concentrate on
organization efforts to satisfy needs and desires of customers by offering competitive
valuable products and services (Barney, 2001). The aim of Marketing is to create value
for beneficiary individuals and groups whom are the most important customers (Jafar
Nejad, 2006).While customers have a major influence on marketing decisions,
companies are devoting more attention than ever before to customers’ wants and needs
(Anderson and Vince, 2004:4).
Hence, marketing efforts are more focused on attracting, retaining and developing
relationship with their present and potential customers. Therefore, it is necessary to
know precisely who the customers are, why they buy, and what it takes to satisfy
8
them. Marketers have four tools to use to develop an offering to meet the needs of
their targeted customers. Collectively they are called as the marketing mix (Product,
Price, placement and promotion). The basic idea is first the product of the factory
produced, then setting the affordable price, and then promoting that product on the
basis of customer’s media habit and finally distributes the product on the targeted
customers.According to McGraw, (2004) states that the marketing mix is the tools
organizations use to develop offerings to satisfy their target market(s). If your
marketing mix doesn’t meet their needs, they won’t be satisfied-and if they aren’t
satisfied, you are unlikely to meet your objectives. Thus, the more the marketer is
effective in combining the four elements of the marketing mix, the more the customers
are satisfied and stay loyal, and as a result, the more the profitable sales of the product
should result.
In general, there are four marketing mix elements which impact on the sale rate and
producer success in competitive markets (Hakkak & Ghodsi, 2015). The four elements
of the marketing mix (product, price, promotion and place) are discussed as follows:
2.1.1. Product The first element in the marketing mix is the product of the company as I have
mentioned above. A product is defined as: “a set of tangible and intangible attributes,
including packaging, color, price, quality and brand plus the reputation of the seller”
(Hart.S.et al, 2004:168). Since one of the basic function of marketing is that
developing products and services that will meet legitimate customer (consumer) needs,
then, consumers are buying more than a set of tangible attributes. They are buying
want satisfaction in the form of product benefit. Product is the most significant
element of marketing mix as firms’ celebrity is based on their products (Keegan,
1989). Kotler and Armstrong (2010) also define the product as anything which is
offered to a market to attend, acquire, use or consume and it may satisfy the
consumers.
9

i. Product Quality
Product quality is the overall characteristics of a product that allow it to perform as
expected in Satisfying customer needs (Jean F, 2004). Level of quality is the amount
of quality possessed by a product and consistency of quality is the degree to which a
product is the same level of quality overtime. It can also be compared across
competing products.
Therefore, simply we can say that quality is the satisfaction for customers and it is an
investment for owners. Poor product quality can destroy the reputation of your
company’s products, but in most cases has an even more serious impact-when people
see a company put out poor quality products, they strongly associate those poor quality
products as coming from a poor quality company.
A company that attains good reputation for the quality of its products and able to
build the confidence of its customers and attracts them not only earns personal
satisfaction and benefit but also contributes to the country’s economic development”
(Quality and Standards Authority of Ethiopia,Dec,2003 Vol.4.No 5,pp-29). Thus, we
can interpret that poor quality products imply a poor quality company.
One important point what we have to know is that products fail for a variety of reasons
such as failure to match product offering to customer needs, therefore, in order to
protect such problems effective planning and management systems are critical that will
be successful.
ii. The Product (Service) Strategy
The product strategy, the route by which to reach your long term product objectives
will need to be developed specifically for each product or service. But, in general there
are said to be four basic products strategies for growth in volume and profit:
Market penetration: the most frequently used strategy is to take the
existing product in the existing market and try to obtain improved
penetration of that market (Kotler P and Armstrong G, 2010, .pp. 29-30).
10

Product development: this involves a relatively major modification of the
product or service, such as quality, style, performance, variety and so on
(ibid, pp. 31-32).
Market development: this depends on finding new uses for the existing
product or service by taking it in to entirely new markets (ibid, pp. 33-34).
Diversification: this quantum leap to a new product and market, involves
more risk, and is more normally undertaken by organization which find
themselves in markets which have limited, often potential (ibid , pp. 35).
iii. Branding, Packaging and Labeling
When conceiving, developing and managing its products, a firm needs to make and
enact a variety of decisions regarding the brand, package and labels used with each
item.
Branding
A brand is a name, term, design, symbol, or other features that identifies the goods and
services of one seller from those of other sellers (Armstrong, 2009, pp. 21). Marketers
should realize that the more customers equate quality with their brands, the more they
will buy. Consumers simply do not purchase brands that they either do not recognize
or do not trust, no matter how much promotional activity is put behind them
(Engle,2004,pp.29-31). Therefore, managers need to brand their products in the best
way possible to gain brand awareness by uses in a better way than competitors.
Packaging
Packaging is the activity of designing and producing the container or wrapper for a
product (McDonald, 2004:90). Since in recent times, packaging has become a
potential marketing tool, a company needs to design the package for the safety of the
product, to make the product identifiable, and to make it more appealing so as to
increase profit.
11

Labeling
A label is a tag or sticker attached to a container or package that provides information
about the seller or the manufacture (McDonald, 2004: 203-204). Labeling performs
several functions:
• It identifies the product or brand and might also grade the product.
• It also convey such information as who made it, where it was made, when it was
made, what it contains, how is it to be used, and how to use it safety . But one thing
what we have to know is that misleading information is illegal action. Therefore,
careful labeling should be necessary for the factory.
iv. Product quality and customer satisfaction
Product quality is a dominant factor of customer satisfaction and loyalty, and it is an
important aspect in marketing theory and practice.
Increased product durability or design lifetime mapped into an additional flow of
utility from the system (Saleh, 2008). Product quality has direct link with positive
effect on market share (Tellis, Yin, & Niraj, 2009). Improving insights of the quality
of goods motivate customer satisfaction (Cameroon, Moizer, & Pettiniccbio, 2010).
Hence, quality impact on customer satisfaction affects higher lifetime value for
consumers and businesses (Bolton, 1998; Hogan et al., 2002; Fetscherin & Toncar,
2009; Verhoef, & Lemon, 2013).
Superior product quality (Besio & Pronzini, 2010; Knudsen, 2010; Tsekeris, 2010,
Fetscherin & Toncar, 2009; Wolf, 1986) lead to good reputation of firms (Yen-
KuandKung-Don, 2009) hence, great number of CEOs establish strategic goals for
quality improvement and performance monitoring to improve product quality (Joanna,
Lockee, & Bass, 2008). Therefore, taking corrective actions to improve customer
perception of quality changes is of paramount importance because the strategies
motivate consumer behaviors to incremental revenue acquisitions (Iyer & Kuksov,
2010). Herrington and Weaven (2009) echoed Feigenbaum (1991) findings and argued
for the introduction of quality control and high-quality production to appraise product
safety that leads consumer satisfactions. The postulation of Weaven (2009) contain a
12

range of diversified knowledge of quality product and services, such as total quality
control, buyer's profile, quality responsibility, system approach to quality, quality
assurance inspection, modern quality-control equipment, and product reliability. These
concepts argue for product control systems that minimize product cost without
negatively compromising on product costs so that consumer satisfactions related to
safety achieved (Mahapatra, Kumar, & Chauhan, 2010; McCollough, 2010).
H1; There is a significant relationship between product and customer satisfaction.
2.1.2 Price As mentioned earlier price is the second marketing mix element and probably the
single most important decision in marketing is that of price. Price could be considered
an attribute that must be scarified to obtain certain kinds of products or services
(Kushwaha et al., 2015). Price is the most sensitive element of marketing mix and it
entails of money that customers pay for delivered products. Pricing a product is the
only element in marketing mix that creates income whereas the other elements are
costly (Haghighi, 2009). This is partly because price may have an impact on sales
volumes. According to Jean F, (2004) if the price is too high, and the market is
competitive, sales may be correspondingly reduced. Indeed, many economists would
see price as the main determinants of sales volume. “On the other hand, many of the
most sophisticated marketers have found ways to reduce the impact of price (Kurtz
and Boone, 2007:87).
Therefore, you need to balance the costs of producing a product with competition and
the perception of your target customers to select the right product price. That is the
reason why pricing takes creativity, time, research, good record keeping and
flexibility. This Price consists of themes such as Trade Discount, Quantity Discount,
Cash Discount, Seasonal Discount and Trade Allowances (Kotler & Armstrong, 2010).
Trade Discount- Members of supplier’s distribution chain (for example
retailers and wholesalers) will demand and payment for their services (Kotler
and Armstrong, 2010, .pp. 29-30).
13

Quantity Discount-these who offer to buy larger quantities of the product or
service arefrequently given incentives). Sellers use the quantity discount to
encourage buyers to buy more. This in turn can help the seller to reduce their
own production costs, which can help reduce price for the buyers (Kotler and
Armstrong, 2010, .pp. 31).
Cash Discount- Where credit is offered, it is sometimes decided to offer an
incentive for cash payment or for prompt payment (Kotler and Armstrong,
2010, .pp. 32-33).
Seasonal Discount- Suppliers to markets which are highly seasonal (such as
holiday market) will often price their product or service to match the day and
with the highest prices at peak demand (Kotler and Armstrong, 2010, .pp. 35-
36).
Trade Allowances -In the durable goods market suppliers often attempt to
persuade consumers to buy a new pieces of equipment by offering allowance
against trade-in of their old one(Kotler and Armstrong, 2010, .pp. 40-41).
Generally speaking, these are simply hidden discounts targeted at a group of
existing competitive users.
During Holiday seasons-simply the holidays is an annual festive period that
surrounds Christmas and various other holidays (Kotler and Armstrong, 2010,
.pp. 45-46).
Defective products are among those purchased products- are also one of the
seasons that price discount takes place.
i. Price and customer satisfaction
Here below we will see the relationship between price and customer satisfaction. Price
is one of the biggest factors that can affect a customer’s satisfaction. Pricing is
complex and has many components, but it is important to keep psychological pricing
in mind. Sometimes customers aren’t looking for the cheapest products, because a low
price can be associated with low quality.
14

To determine price, it is important to benchmark against the competition to understand
the industry standards and fluctuations. Furthermore, by measuring the price elasticity
of demand you can gain insights on how much the quantity demanded changes with a
shift in price. The trick is to test pricing strategies to find the sweet spot that
maximizes sales and margins at the highest price consumers are willing to pay. This
can ensure the customer is happy with their purchase and the value they received for
the price which can increase customer satisfaction.
Customers love reasonable prices, not necessarily low prices. The key term above is
reasonable, not necessarily low or high. When pricing appears to be fair and in line
with the amount of value the product provides, customers are more likely to develop a
trusting, loyal commercial relationship, as per the report of a 2004 study by the Solvay
Brussels School.
Other studies, such as the study by Vinita Kaura, show that perceived price has a
significant positive impact on price fairness. When people believe prices are fair,
they’re far more likely to form a positive opinion of the product, company and brand.
If your product is underpriced – which means that it offers value far greater than its
cost your pricing strategy could be damaging both your profit margin and your ability
to maximize satisfaction from customers who view its pricing as too good of a deal.
Low pricing can also affect your ability to support your product and its customers. If
your weak profit margin makes it hard to offer good support or a generous return
policy, for example, it’s likely to have a negative effect on customer satisfaction.
Successfully pricing products or services will create happy customers that are content
with their purchase and the amount paid for the value received, making them more
excited to return to shop with you again.
H2; There is a significant relationship between price and customer satisfaction.
2.1.3 Promotion Promotion is the third marketing mix element that disseminating information about a
product, product line, brand or company. Promotion is concerned with any vehicle you
15

employ for getting people to know more about your product or service. Advertising,
public relations, point-of-sale displays, and word-of-mouth promotion are all
traditional ways for promoting a product. Promotion can be viewed as a way of closing
the information gap between would-be sellers and would-be buyers (Jones, 2007).
Zeithaml et al. (1995) described promotion as part of a specific effort to encourage
customers to tell others about their services (Owomoyela and Oyeniyi, 2013).
According to Keller (2005) before a business can be successful, it must attract people
in buying its goods or services. Even though the product is available or where it can be
purchased, customers will not usually know what the product does or how it is
performing than other products they are currently using (ibid, pp. 43). Thus,
particularly a business uses a product promotion in order to convince prospects to
select its products or services instead of competitors. If the marketer effectively
combines the four elements of the marketing mix, the more customers are satisfied and
stay loyal, and as a result the more profitable sale of the product should result (ibid,
pp. 98). Therefore, promotion is necessary for the success in serving customers.
Consumers also benefit from promotion because it is through this process that they
determine which product or service will satisfy their needs. Promotion consists of
themes such as advertisement, personal selling and public relations to achieve supper
aims of sales (Kotler & Armstrong, 2010). (Journal of Business and Management,
Volume 3, Issue 6 (Sep,-Oct. 2012) Advertising is a powerful element of promotion
mix. The main aim of the advertising is to create and develop the image of a product in
the market. It is one of the important tools of competition which maintains the
dynamism of industry. Promotion mix decides the positioning of the product in the
target market. It should be considered as expenditure and hence added to the cost of a
product.
i. Promotion and customer satisfaction
Promotions are another big factor that affect customer satisfaction. personalized
promotions can be very effective at increasing customer satisfaction. The
16
personalization of promotions is now very easy to do with technology to track
customer preferences and history. Companies can leverage historical promotions and
sales data to see which discounts resonate most with customers on what products and
when. By providing personalized promotions based on past actions, customers feel
important and catered to, and are more likely to follow through with purchases, which
can decrease cart abandonment rates. Furthermore, providing personalized and
relevant promotions can lead your customers to feel important and catered to, causing
customer satisfaction to increase.
H3; There is a significant relationship between Promotion and customer satisfaction.
2.1.4 Place It is one of the four marketing mix elements. Kotler and Armstrong (2006), defined
place or distribution as a set of interdependent organizations involved in the process of
making a product available for use or consumption by consumers. Jones, (2007)
defined place as any way that the customer can obtain a product or receive a service
(Owomoyela and Oyeniyi, 2013). As Engle, (2009, pp.: 189) states that the marketer
must choose distributors that reach its customers most effectively and other
intermediaries that add value to the distributive process. To support the above-
concepts, it is the fact that the objectives of distribution channel is to make the
products effectively available to the greatest possible number of users at the lowest
possible distribution and selling cost.
The field of distribution is made up of two distinct branches: channel of distribution
and physical distribution that will be discussed as follow.
Channel of Distribution
Channel of distribution consists of a network of intermediaries those managers that
manage the flow of goods and services from the producer to the final customer. The
distribution system consists of channel intermediaries that provide a link between
producers and final consumers. The idea that marketing system uses channels that
17

maximizes efficiency and effectiveness, minimizes costs, and delivers the greatest
customer satisfaction (Kotler and Armstrong, 2010:pp.: 87).
• Merchant middlemen: include merchant wholesalers and retailers who take
title to and resell the goods.
• Agent middlemen: include agents, brokers and manufacturer’s sales
branches and offices who do not take title to the goods involved. They rather
negotiate purchase, sales or both.
The longest most indirect channel includes producer, one or more wholesalers or
agents, retailers and consumers. This channel is the most appropriate when the
producer’s objective is to achieve maximum market penetration with intensive
distribution.
The shortest channel, from producer to consumers, offers the most direct and quickest
distribution route because no intermediaries are involved. It is easiest to manage and
control (Anderson and Vince, 2000:280-282).
Physical Distribution
Physical distribution involves planning, implementing, and controlling the physical
flows of materials and final goods from points of origin to points of use to meet
customer needs at a profit (Engle, 2009: pp. 196).
The starting point for designing the physical distribution system is to study what
customers want and what competitors are offering.
There are a number of decisions that should be undertaken by the marketing
executives of an organizations concerning physical distribution that affect customer
satisfaction. They are described by Palmer (2004) as follows:
• Order processing
Physical distribution begins with a customer order. The order department prepares
multi copy invoice and dispatches them to various departments. Items out of stock are
back ordered. Shipped items are accompanied by shipping and billing documents with
copies going to various departments.
18

• Ware Housing
It involves the physical facilities used primarily for storage of goods held in
anticipation of sales and transfers with in a distribution channel. Every company has to
store its goods while they wait to be sold. A storage function is necessary because
production and consumption cycles rarely match. The company must decide on a
desirable number of stocking locations.
• Inventory
Inventory level represents another physical-distribution decision affecting customer
satisfaction. Marketers would like their companies to carry enough stock to fill all
customer orders immediately. The intent of inventory management is to provide a
continuous flow of goods and to match the quantity of goods in inventory as closely as
possible with sales demand.
• Transportation
Marketers need to take an interest in their company’s transportation decisions. The
choice of transportation carrier will affect the pricing of the products, on-time delivery
performance and the conditions of the goods when they arrive all of which affect
customer satisfaction (Palmer, 2000:405-410).
Place/Distribution and customer satisfaction
Physical distribution is an integral part of the marketing process, which concerns the
effective and efficient movement of finished goods from the end of the production
operation to the consumers. It takes place with numerous wholesaling and retailing
distribution channels, and covers important decision areas such as inventory control,
materials handling, packaging, transportation, and warehouse site selection.
The importance of physical distribution is mostly based on its relevance to customer
service and satisfaction. Including physical distribution in customer service programs
is not only crucial; assessing the effectiveness of the process at satisfying customers is
also a must.
19

Here are ways to assure and measure your physical distribution process’s effectiveness
to increase customer satisfaction.
i. Setting Your Customer Goal
A business must set and prioritize customer-oriented goals that relate to physical
distribution activities. These include timeliness of delivery, order cycle time, and
merchandise availability. Also important is the condition merchandise arrives in, as
well as the percentage of inventory orders filled accurately. Other customer service
goals relate to the variety and assortment of merchandise, percentage of items
unavailable or out of stock, and the percentage of returns due to damaged or defective
merchandise.
ii. Set Realistic Standards
Physical distribution costs can consume up to about 50 percent of a business’ budget
that it’s important to set realistic customer service standards. You may set a lofty
benchmark that is unreachable and, on the one hand, opt to provide a level of customer
service above what is required or appreciated by customers. When deciding thus on
service level standards, consider the trade-off between physical distribution costs and
the service level you can realistically extend.
iii. Come Up with a Supplier Report Card
Keep track of the trends that affect customer service through internal evaluations
typically determined by quantitative measurements. You may also analyze the rate of
change over time and come up with a supplier report card. Ratio calculations such as
percentage of on-time deliveries, order accuracy and percentages of stock-outs or
substitutions are common — and important — metrics. Also, note evaluation items for
each supplier throughout the month and conduct evaluations at the end of each month.
Assess this using the customer standard you set.
20

iv. Openly Communicate with Your Customers
It is important to build an open communication with your customers. External
evaluations may comprise ratio calculations but more often used are qualitative
assessments. The customer satisfaction rate is a common ratio assessment too.
Quantitative numbers are more helpful if a business includes questions that focus on
aspects of physical distribution that point out dissatisfaction among customers.
Questionnaires, surveys, focus groups and telephone or in-person interviews are
among the best ways to collect qualitative customer service data.
H4; There is a significant relationship between Place and customer satisfaction.
2.2 Empirical Review March 2013 vol.4, in the interdisciplinary journal of contemporary research in
Business Research in the title of “investigating the impact of marketing mix elements
on consumer satisfaction: an empirical study on Nigerian breweries plc.” The research
result showed that there is strong relationship between marketing mix elements (price,
product, place and promotion) and consumer satisfaction. On the basis of the findings
of this study, it can be concluded that price, product, place and promotion were jointly
and independently predict consumer satisfaction. This result supported Kotler, (2005)
who discovered that marketing mix elements have become major business tools for
company to pursue its marketing objective. It is concluded that marketing mix
elements have significant effect on consumer satisfaction. Therefore, management of
Nigerian breweries should produce superior products; charge competitive prices,
position appropriately, promote widely, and provide other distinctive functional
benefits to consumers. They also need to pay more attention to their customers in order
to understand their needs and expectations as well and to keep in touch with them.
Customer's satisfaction surveys should be conducted in a systematic and continues
way.
Also in the International Journal of Applied Research 2016, in the title of “Effects of
marketing mix on customer satisfaction: empirical study on tourism industry in
21

Malaysia” research result showed that there is a significant positive relationship
among the four elements of marketing mix and customer satisfaction. Furthermore the
results suggest that tourism industry in Malaysia should consider the importance of
marketing mix while designing their marketing strategy. The findings of the study are
helpful for the tourism industry of Malaysia in particular and the global tourism
industry in general so as to focus on the improvement in particular elements as they
have significant impact on customers’ satisfaction towards the tourism.
2.3 Conceptual Framework
In accordance with the research question, the conceptual framework was developed by
the researcher to guide this study.
Product
Price
Promotion Customer satisfaction
Place
Figure 1: Conceptual framework
22

CHAPTER THREE
RESEARCH DESIGN & METHODS
This part of the research deals with over all approach of the research. And it includes
Research Approach, Research design, source of data, Population of the study,
Sampling procedure, validity, reliability, Data gathering instrument, Data Analysis
techniques, and ethical consideration.
3.1 Research Approach Based on what a researcher is going to accomplish research can be divided into three,
those are explore a new topic, describe social phenomena and explain why something
occurs. Studies may have multiple purpose (e.g. both to explore and describe) but one
purpose usually dominate.
In Exploratory or Formative approach you may be exploring a new topic or
issue in order to learn about it. If the issue was new or the researcher has written little
on it, you began at the beginning. This is called explanatory research. In this type of
research the goal of researcher is to formulate more precise question that future
researcher can answer. An exploratory research may be the first stage in sequence of
studies. Exploratory types of research have the following goals becoming familiars
with basic facts, setting and concern, develop well-grounded picture if the situation
and developing techniques and sense of direction for future research.
Descriptive approach presents the pictures of specific details of a situation, social
setting or situation. It seeks to determine the answers to who, what, when, where, and
how questions. Descriptive study offers to a researcher a profile of relevant aspect of
phenomena of interest and create set of categories.
In explanatory approach the desire to know why to explain the purpose of
explanatory research. It builds on explanatory or descriptive research and goes on to
identify the reason for something that occurs. Explanatory looks for causes and
23

reasons. It explains things not just reporting, determine which of several explanations
is best, and determine the accuracy of theory: test a theories prediction or principle.
In This study the researcher was adopted descriptive method of research approach. The
purpose of the researcher in using this method is it tries to explain the characteristics
of the population and define problems in proper manner. Descriptive research
approach is a scientific method which involves observing and describing the behavior
of a subject without influencing it in any way. Descriptive study sets out to collect,
organize, and summarize information about the matter being studied (Punch, 2006).
3.2 Research Design
Research design is a plan and procedure for the research that span the decision from
broad assumption to detail methods of data collection and it’s of three types
qualitative, quantitative and mixed methods (Creswell john W, 2009).
Qualitative research is a means of exploring and understanding the meaning
individual or group ascribe to a social or human problem and those who engage in this
form of enquiry support a way of looking at research that honor an individual style, a
focus on individual meaning and importance of rendering complexity of a situation
(Creswell John w. 2009).
Quantitative research is a means for testing objective theories by examining
relationship among variables and this variables can be measured typically on
instrument, so that data can be measured using statistical procedure (Creswell John
W. 2009) .
Mixed research methods involve the philosophies assumption, the use of
qualitative and quantitative approach, and the mixing of both approach in the study.
Thus it’s more than simply collecting and analyzing of both kind data: it also involves
the use of both approaches in tandem so that the overall strength of the study is greater
than either qualitative or quantitative research (Creswell and plano clark, 2007).
Because of the researcher is intended to assess the marketing mix elements in
promoting customer satisfaction and for the sake of realizing this relationship the
study will adopt quantitative research method. Qualitative research is a means for
24

testing objective theories by examining relationship among variables and this variables
can be measured typically on instrument, so that data can be measured using
statistical procedure (Creswell John W. 2009) .
3.3 Population of the Study
Population is defined as the complete set of units of analysis that are under
investigation (Davis 2000). Proctor (2003) defines population as the total group to be
studied. Therefore, the target population for this study was customers of the Habesha
beer, found at the different hotels, bars, restaurants and groceries found in the Addis
Ababa town.
3.4 Sampling Procedure
Sampling is the selection of a fraction of the total number of units of interest for the
ultimate purpose of being able to draw general conclusions about the entire body of
unit (Parasurman, 2004). There are several decisions to be made in organizing a
sample such as identifying target population, selecting sampling technique and
determining the sample size.
3.4.1 Sampling Technique Based on the literature, there are two main sampling methods, probability and non-
probability sampling (Zikmund, 2000). For this purpose the researcher will use both
probability (simple random sampling) and non-probability (deliberate or purposive or
judgment) sampling approach will be applied in contacting target units (respondents)
of the study. The study used simple random sampling method to distribute
questionnaires to the respondents.
3.4.2 Sample size As the number of consumers is infinite and is difficult to prepare source list, the
researcher will use survey from infinite population. In this case, the researcher was
generates samples from the total population using sample size formula, which is
presented in (Bill Godden, January 2004.)
Sample Size – for Infinite Population (where the population is greater than 50,000)
25

SS = Z2 x (p) x (1 – p)
C2
Whereas,
SS = Sample Size
Z = Z-value(e.g., 1.96 for a 95 percent confidence level)
P = Percentage of population picking a choice, expressed as decimal (0.5
standard deviation)
C = Confidence interval, expressed as decimal (e.g., .05 = +/- 5 percentage
points)
A Z-value (Cumulative Normal Probability Table) represents the probability
that a sample will fall within a certain distribution.
The Z-values for confidence levels is 1.96 = 95 percent confidence level
:
Ss = (1.96)2 *0.5*0.5 = 0.9604
(0.05)2 0.0025
Sample size = 384.16 ≅ 384
3.5 Validity
Validity is the degree to which a test measures what it rationales to measure (Creswell,
2003: 190-92). A pilot study was conducted to refine the methodology and test
instrument such as a questionnaire before administering the final phase.
Questionnaires were tested on potential respondents to make the data collecting
instruments objective, relevant, suitable to the problem and reliable as recommended
by Dawson (2002: 95). Issues raised by respondents were corrected and questionnaires
were refined. Besides, proper detection by an advisor will be also taken to ensure
26

validity of the instruments. Finally, the improved version of the questionnaire will be
printed, duplicated and dispatched.
3.6 Reliability
The reliability of instruments measures the consistency of instruments. Creswell
(2003: 190-92) considers the reliability of the instruments as the degree of consistency
that the instruments or procedure demonstrates. The reliability of a standardized test is
usually expressed as a correlation coefficient, which measures the strength of
association between variables.
3.7 Data Gathering Instrument
According to Kothari (2004:95), a researcher should consider two types of data,
primary and secondary. The researcher, hence, used primary sources of data in order to
gather relevant information. Primary sources of data collected directly from the
aforementioned respondents through questionnaires. According to Kibera and
Waruinge (1998), a questionnaire is used when researchers require information on
consumer feelings and attitudes. The researcher was designed questionnaires based on
the conceptual framework. Each question will be analyzed from different aspects of
customer satisfaction. It was designed in a way that was clear, brief and
understandable to the respondents as well as covers the relevant aspects of the model
used. According to Fisher (2007) it is recommended to keep the questionnaire as short
as possible and give it a logical and sequential structure so that the respondent can
easily see what the questionnaire is about and can follow its themes as they go through
them. For that reason, the researcher will design questionnaire in both English and
Amharic languages considering that target audiences were Ethiopian citizens.
3.8 Method of Data Analysis
The collected data was processed by classifying the data in to its homogeneity of the
respondents. As the data that was collected are both qualitative and quantitative in
nature, it was analyzed and presented by using descriptive statistical analysis
techniques such as tables, graphs, and different types of charts. Percentage for the data
27

was calculated in order to facilitate the analysis and to make it easily understandable
for the readers. To facilitate the analysis of data SPSS version 23.0 software was used.
3.9 Ethical Considerations
While conducting the study, ethical issues will be primarily considered. Before
conducting the data collection all the necessary information about the study will
provide to the sample respondents, i.e. who is conducting the study, for what purpose,
and the like, this has helped them to decide whether or not to participate in this study.
They will also have notified that their participation in the study is voluntary; they are
not harmed as a result of their participation or non-participation in the study. They will
be also aware that anonymity and confidentiality of their response are guaranteed.
28

CHAPTER FOUR
DATA PRESENTATION, ANALYSIS AND INTERPRETATION
This chapter gives an overview of the findings of the research based on the
questionnaire survey. The study aims at assessing the marketing mix elements in
promoting customer satisfaction in case of Habesha beer Sh.co.
4.1 Data Analysis and Interpretation
4.1.1 Rates of Response
Table: 1 Rates of Response
Questionnaire N Response %
Distributed 384 100
Collected 384 100
Uncollected 0 0
From the above table 1, all the questionnaires distributed were returned. This shows
that the returned questionnaire of respondents is high which show very good to make
conclusion from the collected data.
4.1.2 Reliability Test Result
The reliability test is an important instrument to measure the degree of consistency of
an attribute which is supposed to be measured. As stated by Mahon and Yarcheski
(2002), the less variation of the instruments produces in repeated measurements of an
attribute the higher its reliability. Reliability can be equated with the stability,
consistency, or dependability of a measuring tool. Cronbach’s alpha is one of the most
commonly accepted measures of reliability. It measures the internal consistency of the
items in a scale. It indicates that the extent to which the items in a questionnaire are
related to each other. It also indicates that whether a scale is one-dimensional or
29
multidimensional. The normal range of Cronbach‟s coefficient alpha value ranges
between 0-1 and the higher values reflects a higher degree of internal consistency.
Different authors accept different values of this test in order to achieve internal
reliability, but the most commonly accepted value is 0.70 as it should be equal to or
higher than to reach internal reliability (Hair et al., 2003).
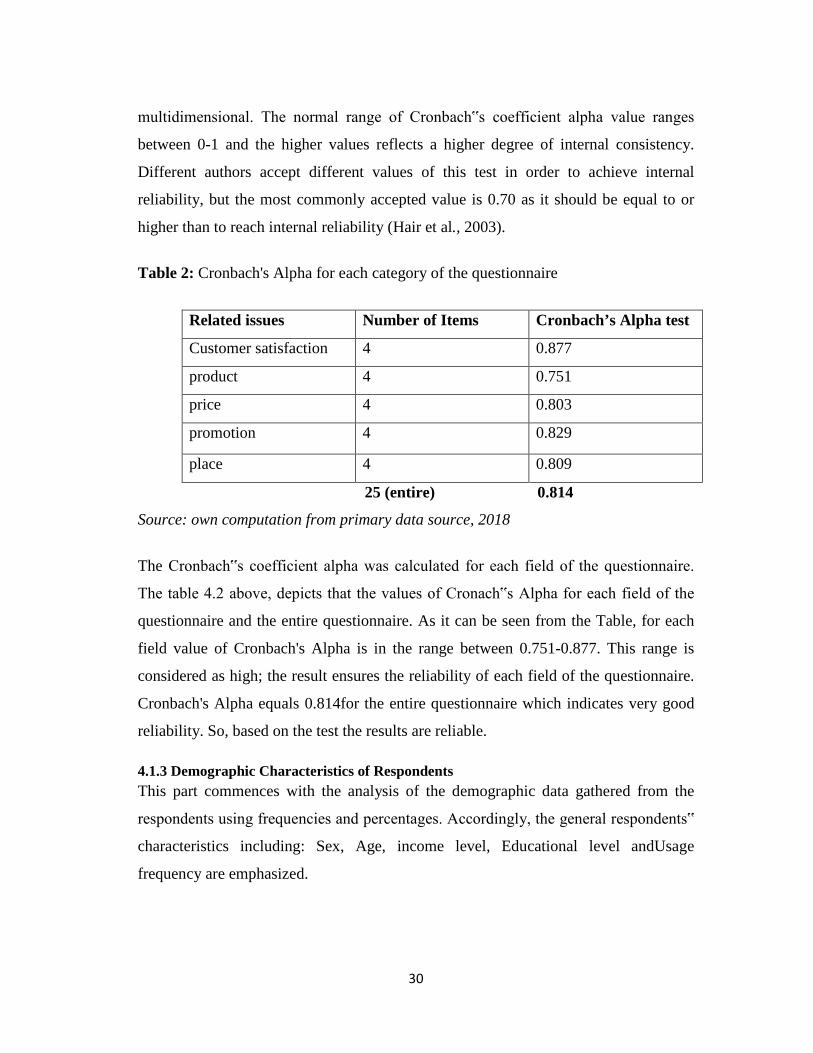
Table 2: Cronbach's Alpha for each category of the questionnaire
Related issues Number of Items Cronbach’s Alpha test
Customer satisfaction 4 0.877
product 4 0.751
price 4 0.803
promotion 4 0.829
place 4 0.809
25 (entire) 0.814
Source: own computation from primary data source, 2018
The Cronbach‟s coefficient alpha was calculated for each field of the questionnaire.
The table 4.2 above, depicts that the values of Cronach‟s Alpha for each field of the
questionnaire and the entire questionnaire. As it can be seen from the Table, for each
field value of Cronbach's Alpha is in the range between 0.751-0.877. This range is
considered as high; the result ensures the reliability of each field of the questionnaire.
Cronbach's Alpha equals 0.814for the entire questionnaire which indicates very good
reliability. So, based on the test the results are reliable.
4.1.3 Demographic Characteristics of Respondents This part commences with the analysis of the demographic data gathered from the
respondents using frequencies and percentages. Accordingly, the general respondents‟
characteristics including: Sex, Age, income level, Educational level andUsage
frequency are emphasized.
30

Table 3: Demographic Characteristics of the Respondents
Respondents’
characteristics
Categories Frequency Percent
Sex
MALE 259 67.4
FEMALE 125 32.6
TOTAL 384 100.0
Age
18-25 122 31.8
26-35 109 28.4
36-45 76 19.8
above 46 years 77 20.1
TOTAL 384 100.0
Education level Never been to school 46 12.0
Completed primary school 77 20.1
Completed high school 105 27.3
Completed diploma 63 16.4
Obtained a bachelor’s Degree 63 16.4
Obtained a master degree &
above 30 7.8
Total 384 100.0
Income level (in below 2000 90 23.4
31

birr/month) 2001-4000 138 35.9
4001-6000 110 28.6
Above 6000 46 12.0
Total 384 100.0
Usage frequency once per week 91 23.7
2-5 days per week 78 20.3
every day 154 40.1
less than once per week 61 15.9
Total 384 100.0
Source: own computation from primary data source, 2018
The above table was designed to display the respondent’s demographic characteristics.
When we look at the sex of respondents 67.4% and 32.6% were male and female
respectively. This result reveals that majority of the customers of Habesha beer are
males. Therefore, the company should go to work extra miles to attract female
customers through different strategies.
Regarding age of respondents 31.8% and 28.2% of the respondents were categorized
with age group of 18-25, 26-35 years respectively and the remaining follows. This
clearly indicates that almost half of the respondents are at an adult age which is
sensitive to product quality, price, promotion and place/distribution. Therefore, the
company is expected work hard to maintain those customers at productive age.
From the above table, when we see educational level of the respondents, 27.3% of
them were Completed high school, 20.1% of the respondents were primary school
graduate, 16.4% were diploma completed, 16.4% of the respondents were obtained
32

their bachelor’s Degree, 12% were never enrolled to the school and the remaining
7.8% of the respondents were Obtained a master degree & above. This shows that
majority of the people who drink the products of Habesha brewery are educated
people, which is good opportunity to Habesha beer sh.co to deliver and communicate
with its customers easily.
From the above table, when we see the income level category of customers of Habesha
beer sh.co. 35.9% and 28.6% of the total respondents earn 2001-4000 birr and 4001-
6000 birr/month respectively, 23.4% of the total respondents earn below 2000 birr per
month and the remaining 12% of the total respondent earn above 6000 birr/month.
Therefore the company should consider the income generated by majority of its
customers during the time of formulating its pricing strategy.
Regarding to frequency of consumption of Habesha beer, the respondents were asked
how often they drink or purchase. As table 3; above depicts that 40.1% of the
respondents were consumeevery days of the week, 23.7% consume once per week,
where as 20.3% of the respondents consume Habesha beer 2-5 days per week and the
remaining 15.9% of the respondents consume even less than once per week or not
consume the whole days of the week. Therefore, the company should aggressively
work in developing the consumption rate of its consumers by applying various
motivational tools.
4.2 Descriptive Statistics of Scale Type Questionnaire
In this part descriptive statistics in the form of mean and standard deviation were
presented to illustrate the feedback of the respondents. The feedback of the
respondents for the variables indicated below were measured on five point Likert scale
with measurement value 1= Strongly disagree; i.e. very much dissatisfied with the case
described; 2= Disagree, i.e. not satisfied with the case described; 3= Neutral, i.e.,
uncertain with the case described; 4= Agree, i.e., feeling all right with the case
described and considered as satisfy; and 5 =strongly agree, i.e. very much supporting
33

the case described and considered as highly satisfy. To make easy interpretation, the
following ranges of values were reassigned to each scale: 1-1.8= strongly disagree;
1.81-2.6 = Disagree; 2.61-3.4= Neutral; 3.41-4.20= Agree; and 4.21-5 = Strongly
Agree Best, (cited in SIMACHEW, 2014). To analyze the collected data in line with
the overall objective of the research undertaking, statistical procedures were carried
out using SPSS version 23.0 software.
4.2.1Analysis of Marketing mix elements and Customer s’ Satisfaction Here, customers were asked to separately evaluate each marketing mix elements and
overall satisfaction, according to the gap between their perception and expectations,
using a five point likert scale: ‘strongly disagree’, ‘disagree, ‘neutral, ‘agree’, and
‘strongly agree’.
Table 4 Measuring customer satisfaction towards product attributes
Source: own computation from primary data source, 2018
The respondents were asked four questions to measure the level of their satisfaction
towards the company product. The questionnaires were designed to collect the
respondents’ attitude towards how the company products fulfilled their needs, want &
desire; demand & preference; Let us see it in detail in the following manner.
Mean Std. Deviation N I believe Habesha beer have the quality of my expectation. (PD1) 3.7578 1.017 384
do you agree that Habesha beer have attractive packaging(PD2)
3.8359 .923 384
do you agree that Habesha beer have well labeling on its package(PD3)
3.7396 .969 384
I believe Habesha beer have consistence on its product quality(PD4)
3.7448 1.090 384
34

As shown in the above table , the scored mean value of the first sub-construct, i.e. I
believe Habesha beer have the quality of my expectationwas 3.75, indicating that the
respondents agreed on and feel all right with the case described and the sub-construct’s
standard deviation was 1.017. The results of this analysis proved that respondent are
satisfied with the Habesha beer product as it is delivered as per their expected quality.
The scored mean value for the second sub-construct i.e. do you agree that Habesha
beer have attractive packaging was 3.83 indicating that the respondents agreed on this
sub-construct. The sub-construct’s standard deviation was 0.923, the resultof this
analysis proved that respondents are satisfied with the packaging design of the
company’s product.
As shown in the above table 4 the majority of respondents were agreed with the sub
constructs i.e. I believe Habesha beer have the quality of my expectation, with the
scored mean value points out that the satisfaction of the respondents with the case
described and the standard deviation was 1.017. The second sub-construct i.e. do you
agree that Habesha beer have attractive packaging was 3.83. With regard to the third
sub-construct i.e. do you agree that Habesha beer has well labeling on its package was
3.73, with a standard deviation of 0.969 Fourthly the sub constructs i.e. I believe
Habesha beer have consistence on its product quality and favorable with the scored
mean value points out that the satisfaction of the respondents with the case described
and the standard deviation was 1.090. The average mean of product attributes are 3.77
which signify that the consumers have positive attitude towards the companies offer.
35

Table 5: Measuring customer satisfaction towards price attributes
Mean Std. Deviation N Do you think that the price charged for Habesha beer products deserve the actual quality(PR1)
4.0156 1.06683 384
Do you get a price discount on Habesha beer product during your consumption(PR2)
4.2135 .77912 384
Do you think that can you switch to other beer brands if you get a price discount there(PR3)
3.7578 1.20104 384
Do you think that are you satisfied with Habesha beer product price relative to other beer brands(PR4)
3.9349 1.10703 384
Source: own computation from primary data source, 2018
The respondents were asked four questions to measure the level of their satisfaction
towards the company product pricing. The questionnaires were designed to collect the
respondents’ attitude towards how the company product pricing fulfilled their needs,
want & desire; demand & preference; Let us see it in detail in the following manner.
As shown in the above table the of respondents were agreed with the sub constructs
i.e. Do you think that the price charged for Habesha beer products deserve the actual
quality, with the scored mean value points out that the satisfaction of the respondents
with the case described and the standard deviation was 1.066.in this regard the
Habesha beer customers believe that the price charged for the product deserves its
quality and they are agreed with this issue.
The scored mean value for the second sub-construct i.e. Do you get a price discount on
Habesha beer product during your consumption was 4.21, the standard deviation was
36

0.779, this result proven that the Habesha beer customers are satisfied with the product
because they got a discount on it and they are agreed with this attributes.
The scored mean value for the third sub-construct i.e. Do you think that can you
switch to other beer brands if you get a price discount there was 3.75, with standard
deviation of 1.201, with this result we can understand that customers of Habesha beer
are price sensitive to switch this brand because as they replied and the mean value for
this attribute shows that customers are agreed, for the issue they will turn to other
brands if they got a price discount there.
The scored mean value for the fourth sub-construct i.e. Do you think that are you
satisfied with Habesha beer product price relative to other beer brands was 3.93 with
standard deviation of 1.107, with this result we proven that customers are agreed as the
mean value reflected and satisfied with the price charged by the company relative to
other beer brands.
Table 6: Measuring customer satisfaction towards promotion attributes
Mean Std. Deviation N The promotions made by the company can initiate customers for purchasing (PM1)
4.2682 .79057 384
The products of the company by itself communicate what makes it unique to customers (PM2)
4.4219 .68107 384
Habesha beer share Co. products are clearly and definitively Communicated to the customer (PM3)
4.1849 .87893 384
Do you think that Habesha beer promotion address its customers effectively (PM4)
4.3750 .71171 384
Source: own computation from primary data source, 2018
37

The respondents were asked four questions to measure the level of their satisfaction
towards the company’spromotion. The questionnaires were designed to collect the
respondents’ attitude towards how the company promote its product to fulfill their
needs, want & desire; demand & preference of customers; Let us see it in detail in the
following manner.
As shown in the above table the respondents were strongly agreed with the sub-
constructsi.e. (pm1)the promotions made by the company can initiate customers for
purchasing with the scored mean value of 4.26, with standard deviation of 0.790,
(pm2) the products of the company by itself communicate what makes it unique to
customers with mean value of 4.42 and standard deviation of 0.681 and (pm4) Do you
think that Habesha beer promotion address its customers effectively with the scored
mean value of 4.37 and standard deviation of 0.711 in this all three attributes there
scored mean vales ranges between 4.21—5, this proved that Habesha beer customers
are strongly agreed with these issues and they are satisfied strongly. And in the third
attribute i.e (pm3) Habesha beer share Co. products are clearly and definitively
communicated to the customer with scored mean value of 4.18 and standard deviation
of 0.878 customers are agreed with this attribute.
Finally regarding the promotion attributes of Habesha beer company’s the average
mean value was 4.31, this reflects the company executed its effort strategically that
attract and take the attentions of its customers and this proven that customers are
strongly agreed with the product promotion of Habesha beer and they feel strong
satisfaction.
Table 7 Measuring customer satisfaction towards place/Distribution attributes
Mean Std. Deviation N do you get the Habesha beer product near to your neighborhood as you needed (PL1)
4.2813 .77430 384
38

do you get Habesha beer product easily as per your requested quantity (PL2)
4.4870 .63397 384
do you agree that the company distribute its product as promised with consistence product and customer demand (PL3)
3.9661 1.10843 384
I am satisfied with the Habesha beer product availability (PL4) 4.2552 .94633 384
Source: own computation from primary data source, 2018
As shown in the above table the respondents were strongly agreed with the sub-
constructs i.e.(PL1) do you get the Habesha beer product near to your neighborhood as
you needed with the scored mea value of 4.28 and standard deviation of 0.774, (PL2)
do you get Habesha beer product easily as per your requested quantity with scored
mean value of 4.48 and standard deviation of 0.633 and (pl4) I am satisfied with the
Habesha beer product availability with the scored mean value of 4.25 and standard
deviation of 0.946. and also the respondents agreed with the attribute (pl3) do you
agree that the company distribute its product as promised with consistence product and
customer demand with mean value of 3.96. these results proved that Habesha beer
customers were satisfied with the placement and distribution strategies that the
company apply and make them satisfied.
4.3 Pearson Correlation Analysis
Correlation means relationship between two variables. It measures the degree to which
two sets of data are related. Higher correlation value indicates stronger relationship
between both sets of Data (Coetzee, 2003). Correlation Analysis is to show the
strength of the association between the variables involved. Inter-correlations
coefficients (r) were calculated by using the Pearson’s Product Moment (Gaur, A., &
Gaur, S. (2009). (Gaur, A., & Gaur, S. (2009) also state that the output of correlation
matrix can be the correlation coefficient that lies between -1 and +1 within this
39

framework, a correlation coefficient of +1 indicates a perfect positive relationship, and
a correlation coefficient of -1 indicates a perfect negative relationship; whereas a
coefficient of 0 indicates no liner relationship.According to Gaur, A., & Gaur, S.
(2009)Value of coefficient Relation between variables 0.70-1.00 Very strong
association, 0.50-0.69 moderate association, 0.30-0.49 low association, 0.10- 0.29 very
Low association, and 0.01-0.09 negligible association.
Table 8 Correlation analysis
PD PR PM PL CS
PD Pearson Correlation 1 Sig. (2-tailed) N 384
PR Pearson Correlation .468** 1 Sig. (2-tailed) .000 N 384 384
PM Pearson Correlation .378** .642** 1
Sig. (2-tailed) .000 .000
N 384 384 384
PL Pearson Correlation .750** .512** .816** 1
Sig. (2-tailed) .000 .000 .000
N 384 384 384 384
CS Pearson Correlation .721** .205** .860** .582** 1
Sig. (2-tailed) .000 .000 .000 .000
N 384 384 384 384 384
**. Correlation is significant at the 0.01 level (2-tailed). Source: own computation from primary data source, 2018
As per the above table, the coefficient show that all independent variables were
positively related with dependent variable (customer satisfaction) within the range of
0.205-0.860, were all are significant at p<0.01 level.
40

The independent variables promotion and product shows highest and strong positive
relation (0.860and 0.721 respectively). While one independent variables called place
show a moderate level of positive relation (i.e. 0.582) with customer satisfaction.
Among all variables only price indicates low but positive relation with customer
satisfaction (i.e. 0.205). And the Table also shows that the correlation of the
independent variables within themselves. It can be noted that all variables are
positively correlated with each other where the strongest correlation goes
betweenpromotion and place at 0.816 and product and place 0.750,while the moderate
correlation goes between price and promotion with the value of 0.642 and price and
place with the value of .512. But the correlation is low between product and promotion
with the value of .378 and product and price with the value of .468.
4.4. Discussion of the Result This study was aimed to assess the marketing mix elements in promoting the customer
satisfaction on Habesha Brewery Share Company. For the purpose of this study four
hypotheses were developed, brief discussion on each hypothesis is given below.
H1: There is a positive and significant relationship between product and customer
satisfaction.
According to the test result of this study, the data collected support the hypothesis
developed and showed product has a significant relationship with customer
satisfaction. The grand mean value of the independent variable result shows the value
of 3.85 which is between the range of score (3.41-4.20) that shows important level.
The correlation analysis reveals product show the second highest and positive relation
(i.e. 0.721) with the dependent variable Customer satisfaction.
H2: There is a positive and significant relationship between price and customer
satisfaction.
The study result has proven that price has a positive and significant relation with
customer satisfaction in Habesha brewery Share Company so the researcher rejected
null hypothesis. The average mean value of the independent variable price is 3.98.
41

Correlation analysis proves that the independent variable is correlated with dependent
variable by 0.205.
H3: There is a positive and significant relationship between promotion and customer
satisfaction.
The study result has proven that promotion has a positive and significant relation with
customer satisfaction in Habesha brewery Share Company so the researcher rejected
null hypothesis. The mean value of the independent variable promotion is 4.31 which
are between the range of score (4.21-5.00) that shows a very important level. The
independent variable promotion holds the first position in determining customer
satisfaction of Habesha beer. Correlation analysis proves that the independent variable
is correlated with dependent variable by 0.860 correlation value.
The degree of promotion, with the goal to have Habesha beer is critical to what extent
customer is satisfied for Habesha brewery product. Promotion, in recent times, has
become the life birth of the modern business. It is a device for gaining and maintaining
a competitive advantage in the market by communicating the benefits of products of a
factory to a large number of people, which in turn facilitates sales to achieve long run
profitability performance. The promotional message should be carefully designed in
such a way that it can easily be understood to the potential and target customers. The
result was also supported by a study which was conducted on the assessment of
marketing mix strategy on Dashen beer by (Hassen 2014) and the result showed that
Promotion is not only stimulates sales but also create customer loyalty and hence
market expansion.
H4: There is a positive and significant relationship between place and customer
satisfaction.
According to the test result of this study, the data collected support the hypothesis
developed and showed place has a positive and significant relationship with customer
satisfaction. The grand mean value of the independent variable result shows the value
of 4.24.The correlation analysis reveals place show the third highest and positive
42

relation (i.e. 0.582) with the dependent variable Customer satisfaction. The result was
also supported by a study which was conducted on the Assessment of marketing mix
in increasing Customer Satisfaction by (Zelalem, 2011) and the result showed that
distribution system of the factory products, majority of the respondents are satisfied
with the product availability and distribution practices of the company.
Table 9 summary of hypothesis
Hypothesis Independent
Variables
Correlation
value
Dependent Variables Grand
Mean
Results
H1 product .721** Customer satisfaction 3.77 Supports
H2 price .205** Customer satisfaction 3.98 Supports
H3 promotion .860** Customer satisfaction 4.31 Supports
H4 place .582** Customer satisfaction 4.24 Supports
Source: own computation from primary data source, 2018
43

CHAPTER FIVE
SUMMARY OF FINDINGS, CONCLUSION AND RECOMMENDATION
In this chapter of the study, summary of findings, conclusion drawn and
recommendations are stated. The purpose of the study was to assess the marketing mix
elements in promoting customer satisfaction, by assessing the four elements of
marketing mix elements directly which are product, price, promotion and place.
5.1. Summary of the Major Finding Among the four elements of Marketing mix elements, all of them i.e. product, price,
promotion and place have a positive and significant effect on customer satisfaction.
Let us summarize the findings in detail.
Based on assessment of the respondents promotion has a positive and
significant positive relation with customer satisfaction in Habesha brewery
Share Company. The independent variable promotion holds the first position in
determining customer satisfaction of Habesha beer among elements of
marketing mix. The mean value of the independent variable (promotion) is
4.31 which show significant level of importance. Correlation analysis proves
that the independent variable is correlated with dependent variable by 0.860
correlation value.
The study has shown that the correlation value proves that the variable
(product) is the second highest correlated value with customer satisfaction
(dependent variable) by 0.721 correlation value. Again the mean score of
product is 3.77. As a result there is a positive and significant relationship
between product and customer satisfaction.
According to the test result of this study, place has a significant relationship
with customer satisfaction. The correlation analysis reveals place show the
third highest and positive relation (i.e. 0.582) with the dependent variable
44

Customer satisfaction. According to the descriptive analysis the mean score of
place is 4.24 which is the second highest scored mean next to promotion.
According to the correlation analysis the value of the independent variable
(price) shows the lowest compared to other listed variables with 0.205
correlation value. However, it still shows significant level of importance. The
mean value of the independent variable (price) result shows the value of 3.98
which is between the range of score (3.41-4.20) that shows important level.
5.2. Conclusion The main purpose of the study was to assess the marketing mix elements in promting
customer satisfaction. The study was conducted on Habesha brewery Share Company
in Addis Ababa. In order to meet this general objective, Non-probability (deliberate or
purposive or judgment) sampling approach was used. Questionnaire containing
questions on dimension of marketing mix i:e product, price, promotion and place were
developed and distributed to areas as per the information the researcher collected from
different sources, those are Around stadium, Piassa area, Megenagna and Saris areas
which have huge sales volumes.
The entire research objective for this study was attained; the general objective of this
study was to assess the marketing mix elements in promoting customer satisfaction.
The study was conducted on Habesha brewery Share Company in Addis Ababa. All
selected marketing mix elements have significant relation with customer satisfaction.
The finding from the descriptive statistics shows that promotion has the highest mean
value which is 4.31 and product, price and place shows (3.77, 3.98 & 4.24) mean value
respectively. Correlation analysis was conducted to analyze if there is relation between
variables used, the correlation matrix revealed that all coefficient of correlation were
positive and significant. According to the findings, independent variables; product,
price, promotion and place has a significant positive relation with customer
satisfaction. Therefore, all selected elements of marketing mix have effect on
promoting customer satisfaction.
45

5.3. Recommendations The focus of this research was on Habesha beer consumers that could provide useful
insight for any concerned organs especially for the company’s management, industry
societies and researchers. The main goal of this paper was to assess the marketing mix
elements in promoting customer satisfaction.
From the findings and conclusions of this study promotion and place are the
most important influencing factors of customer satisfaction for consumers of
Habesha beer. Habesha brewery Share Company should take into consideration
that the important determinants in promoting their consumers satisfaction is
promotion and place. Therefore, in order to avoid easy switch of consumers
Habesha Brewery should not only concentrate on promotion and place
attributes in creating high satisfaction for its consumers but also it should have
improve especially its price related issues why because this study proven that
consumers may switch to other beer brands if they got a price discount there.
5.4. Further implications The research can be furthers expanded to other country sides and cultures and
other countries too. It would help to understand in detail marketing mix
elements in promoting customer satisfaction of Habesha beer consumers.
Moreover by using a larger and diverse sample size and even distribution
among different social groups helps to better understanding of their satisfaction
level.
Further studies can be carried out on the assessment ofmarketing mix
elementseven by considering additional elements to enhancing customer
satisfaction on the performance of the organization. Since the study only cased
studied Habesha brewery Share Company. A survey on all Brewery industry
would be an effective research.
46

References
• Anderson and Vince, (2000). Principles of marketing, 1st Ed, Oxford University press
New York.
• Bryman, A., & Bell, E. (2003).Business Research Methods. Oxford University Press.
• Coetzee, O. (2003). The Relationship between Personality Variables and
WorkPerformance of Credit Controllers in a Bank. Pretoria.
• Gaur, A., & Gaur, S. (2009). Statistical Methods for Practice and Research :A guide to
data analysis using SPSS (2 ed.). New Delhi: Response Books.
• Godden, B. (2004). Sample Size Formulas. Journal of Statistics, 3, 66. • Jean F, (2004). Quality, Available at http;//www.The times 100.co.uk/theory Accessed
on Jun, 2018.
• Kotler, P. & Armstrong, G. (2011). Principle of marketing, 14th ed., Prentice Hall,
New Jersey.
• Kotler, P. (2002). Marketing Management, Millennium Edition, Pearson Custom
Publishing, New Jersey.
• Kotler and Armstrong (2006), Principle of marketing, 11th ed., Prentice Hall, New
Jersey.
• Kotler P and Armstrong G, (2010). Principles of marketing, 13thed, Pearson Prentice
Hall, New Jersey.
• Kurtz and Boone, (2007). Principles of marketing. Central Learning India Pvt. Ltd.
• McCarthy, E.J. (1964), Basic Marketing, Richard D. Irwin, Homewood, IL.
• McDonald, (2007). Marketing plan: How to prepare them, how to use them.6th Ed,
Oxford printing press.
• Palmer, A. (2004), Introduction to Marketing: Theory and Practice, Oxford
University Press.
• Palmer A, (2000). Principles of Marketing, 1st Ed, Oxford Press.
47

• Saleh, J. H. (2008). Analysis of marginal cost of durability and cost per day: A first
step towards a rational choice of durability. Journal of Engineering Design, 19(1), 55-
74.
• Zaidatol A.L., & Bagheri A. (2009), Entrepreneurship as a center choice: An analysis
of Entrepreneurial self- efficiency and intention of university student. European
Journal ofsocial science, 9(2): 338-346.
48

Appendix
49

Appendix A - Questioners
ADDIS ABABA UNIVERSITY
SCHOOL OF COMMERCE
DEPARTMENT OF MARKETING MANAGEMENT
MASTERS PROGRAM
Questionnaires to be filled by customers of Habesha Beer
Dear respondents,
The purpose of this questionnaire is to carry out a research for the partial fulfillment of
master's degree in Marketing Management. Any information you present will be
kept confidential and will be used only for academic purpose. Your cooperation and
prompt response will be highly appreciated.
General instruction
• This questionnaire is to be filled by customers of the Habesha Beer.
• You are not required to write your name.
• Please put "X" or mark in the box/letter of your choice.
• If there is any question please contact the researcher through the following
address YohannesG/senbet Tel. +251921128996 &e-mail:
Thank you for your cooperation in advance!
SECTION I. Demographics
1. Sex A.Male B.Female
2. Age A.between 18-25 years B.between 26- 35 years
C.between 36-45 years D.Above 46 years
3. Select your level of education you have completed?
A.Never been to school B.Completed primary school
50

C.Completed high school D. Completed diploma
E.Obtained a bachelor’s DegreeF.Obtained a master degree & above
4. Select your income level (in birr/month)
A. Below2000 B.2001-4000
C.4001-6000 D. above 6000
5 How frequently do you drink /purchase Habesha Beer?
A. once per week B. 2-5 days per week
C.everyday D.less than once per week
SECTION II: Questions related to marketing mix & customer satisfaction
Instruction: Please read each statement and indicate your level of agreement (on the
response Scale: 1 to 5) by taking from the options provided as strongly agree, agree,
neutral, disagree, and strongly disagree. (Tick one from the given five scales.)
Response scale:
-1 strongly disagrees -2 Disagree -3 Neutral -4 Agree -5 strongly Agree.
Customer satisfaction related issues 1 2 3 4 5
6. I am satisfied with the company’s product because the
design, feature, style & benefits are sympathetic to use
it.
7. I would be glad to purchase Habesha beer product
8. I would be recommend Habesha beer to my family and
friends
9. overall,are you satisfied with Habesha beer product
51

Product related issues 1 2 3 4 5
10. I believe Habesha beer have the quality of my expectation
11. do you agree that Habesha beer have attractive packaging
12. do you agree that Habesha beer have well labeling on its package
13. I believe Habesha beer have consistence on its product quality
Price related issues 1 2 3 4 5
14. Do you think that the price charged for Habesha beer products deserve the actual quality?
15. Do you get a price discount on Habesha beer product during your consumption?
16. Do you think that can you switch to other beer brands if you get a price discount there?
17. Do you think that are you satisfied with Habesha beer product price relative to other beer brands?
Promotion related issues 1 2 3 4 5
18. The promotions made by the company can initiate customers for purchasing.
19. The products of the company by itself communicate what makes it unique to customers.
52

20. Habesha beer share Co. products are clearly and definitively Communicated to the customer.
21. Do you think that Habesha beer promotion address its customers effectively
Distribution/place related issues 1 2 3 4 5
22.do you get the Habesha beer product near to your neighborhood as you needed
23. do you get Habesha beer product easily as per your requested quantity
24. do you agree that the company distribute its product as promised with consistence product and customer demand
25. I am satisfied with the Habesha beer product availability
Thank you!
53

Appendix B - Descriptive Statistics results
Descriptive Statistics
product Mean Std. Deviation N I believe Habesha beer have the quality of my expectation. (PD1)
3.7578 1.01744 384
do you agree that Habesha beer have attractive packaging (PD2)
3.8359 .92353 384
do you agree that Habesha beer have well labeling on its package (PD3) 3.7396 .96945 384
I believe Habesha beer have consistence on its product quality (PD4)
3.7448 1.08994 384
price Mean Std. Deviation N Do you think that the price charged for Habesha beer products deserve the actual quality (PR1)
4.0156 1.06683 384
Do you get a price discount on Habesha beer product during your consumption (PR2)
4.2135 .77912 384
Do you think that can you switch to other beer brands if you get a price discount there (PR3)
3.7578 1.20104 384
Do you think that are you satisfied with Habesha beer product price relative to other beer brands (PR4)
3.9349 1.10703 384
promotion Mean Std. Deviation N The promotions made by the company can initiate customers for purchasing (PM1)
4.2682 .79057 384
The products of the company by itself communicate what makes it unique to customers (PM2)
4.4219 .68107 384
54

Habesha beer share Co. products are clearly and definitively Communicated to the customer (PM3) 4.1849 .87893 384
Do you think that Habesha beer promotion address its customers effectively (PM4)
4.3750 .71171 384
place Mean Std. Deviation N do you get the Habesha beer product near to your neighborhood as you needed (PL1) 4.2813 .77430 384
do you get Habesha beer product easily as per your requested quantity (PL2)
4.4870 .63397 384
do you agree that the company distribute its product as promised with consistence product and customer demand (PL3)
3.9661 1.10843 384
I am satisfied with the Habesha beer product availability (PL4) 4.2552 .94633 384
55