Embed Size (px)
Citation preview
AERC and Diaspora
Lemma Senbet*University of Maryland
*Keynote address at the 25 anniversary celebration of African Finance and Economic Association, ASSA Conference, San Diego, January 5, 2013
BACKGROUND
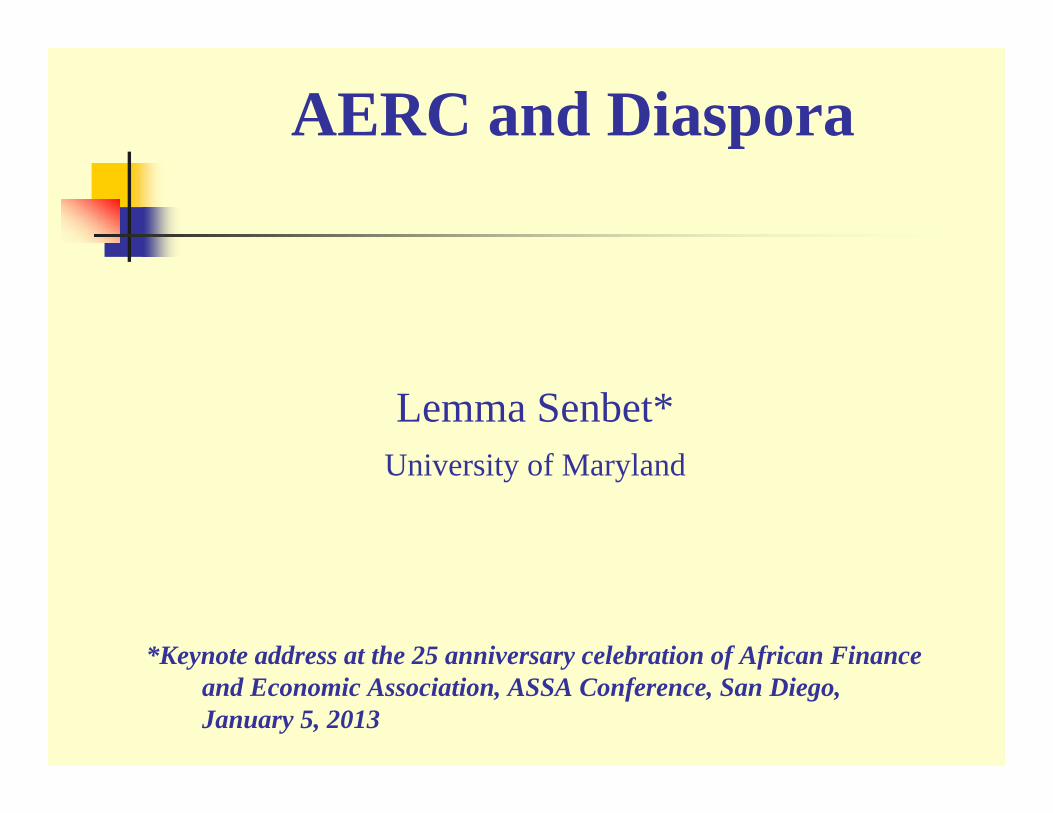
BackgroundAfrica is Rising
In late 50s into early 60s most African countries were regarded at par or ahead of most developing countries in Asia and Latin America in terms of economic development.Yet, Africa’s growth performance has long been disappointing, referred to as a tragedyby some commentators.But changing: Africa growth renaissanceAfrica rising!
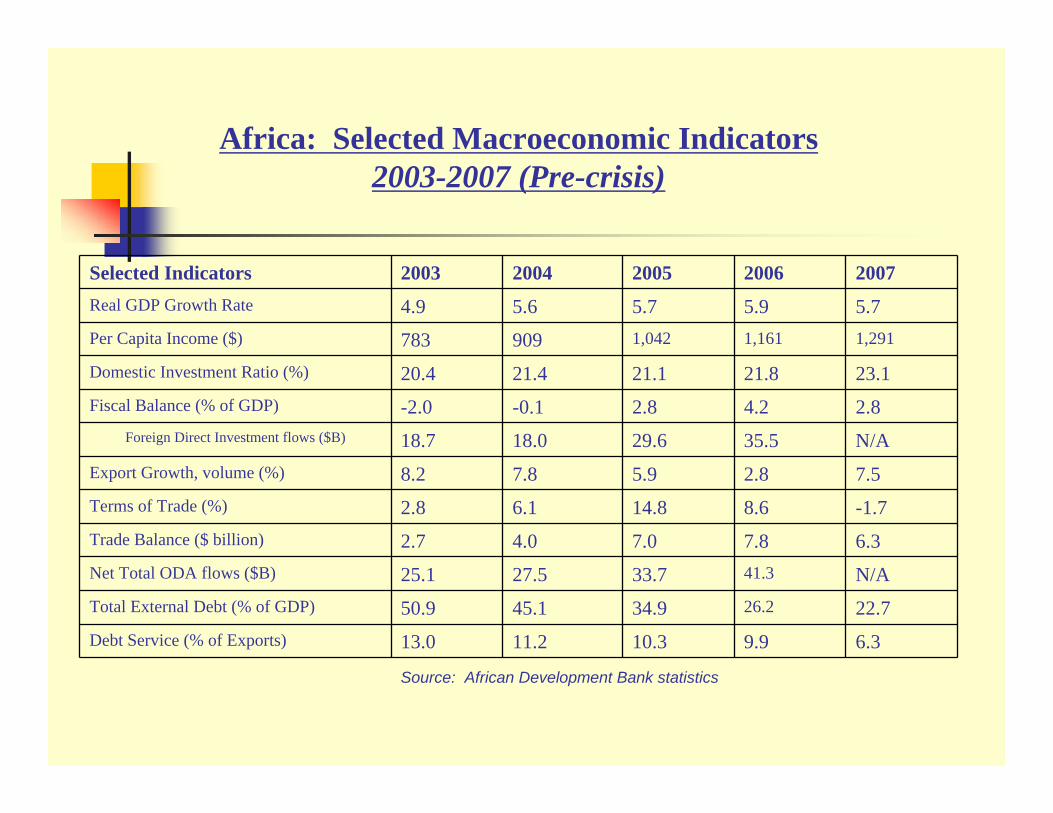
Africa: Selected Macroeconomic Indicators2003-2007 (Pre-crisis)
Selected Indicators 2003 2004 2005 2006 2007Real GDP Growth Rate 4.9 5.6 5.7 5.9 5.7Per Capita Income ($) 783 909 1,042 1,161 1,291
Domestic Investment Ratio (%) 20.4 21.4 21.1 21.8 23.1Fiscal Balance (% of GDP) -2.0 -0.1 2.8 4.2 2.8
Foreign Direct Investment flows ($B) 18.7 18.0 29.6 35.5 N/AExport Growth, volume (%) 8.2 7.8 5.9 2.8 7.5Terms of Trade (%) 2.8 6.1 14.8 8.6 -1.7Trade Balance ($ billion) 2.7 4.0 7.0 7.8 6.3Net Total ODA flows ($B) 25.1 27.5 33.7 41.3 N/ATotal External Debt (% of GDP) 50.9 45.1 34.9 26.2 22.7Debt Service (% of Exports) 13.0 11.2 10.3 9.9 6.3
Source: African Development Bank statistics
Africa On the MovePre-Crisis Period
In the aggregate, Africa began rising in the wake of the 21st century and had, in fact, experienced, what amounts to growth renaissanceThat was before it got caught up in the global crisis.GDP growth of 5.2% for the three year period (2002-2007) prior to the crisis, outpacing population growth Inflation was brought under controlImprovement in fiscal disciplineDeclining debt burden/increasing capacity for debt serviceIncreasing foreign investment and remittance flows
Performance not Accidental Payoffs to Reforms
Impressive performance outcomes are payoffs to economic and financial sector reforms – not accidentalExtensive economic and financial sector reforms over the last two decades, including large scale privatization programs as well as measures to empower private initiative, measures for capital market developmentEmergence of stock markets in Sub-Saharan Africa as a particularly interesting feature, including a regional market
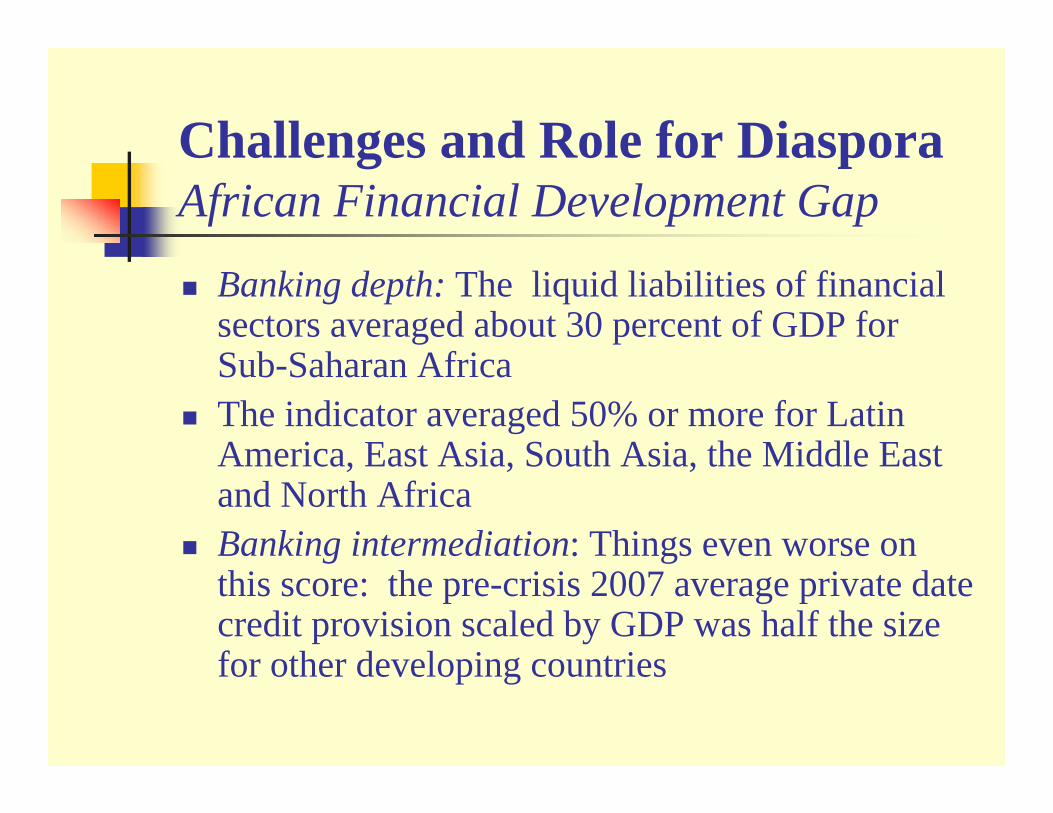
Challenges and Role for DiasporaAfrican Financial Development Gap
Banking depth: The liquid liabilities of financial sectors averaged about 30 percent of GDP for Sub-Saharan AfricaThe indicator averaged 50% or more for Latin America, East Asia, South Asia, the Middle East and North Africa Banking intermediation: Things even worse on this score: the pre-crisis 2007 average private date credit provision scaled by GDP was half the size for other developing countries
8
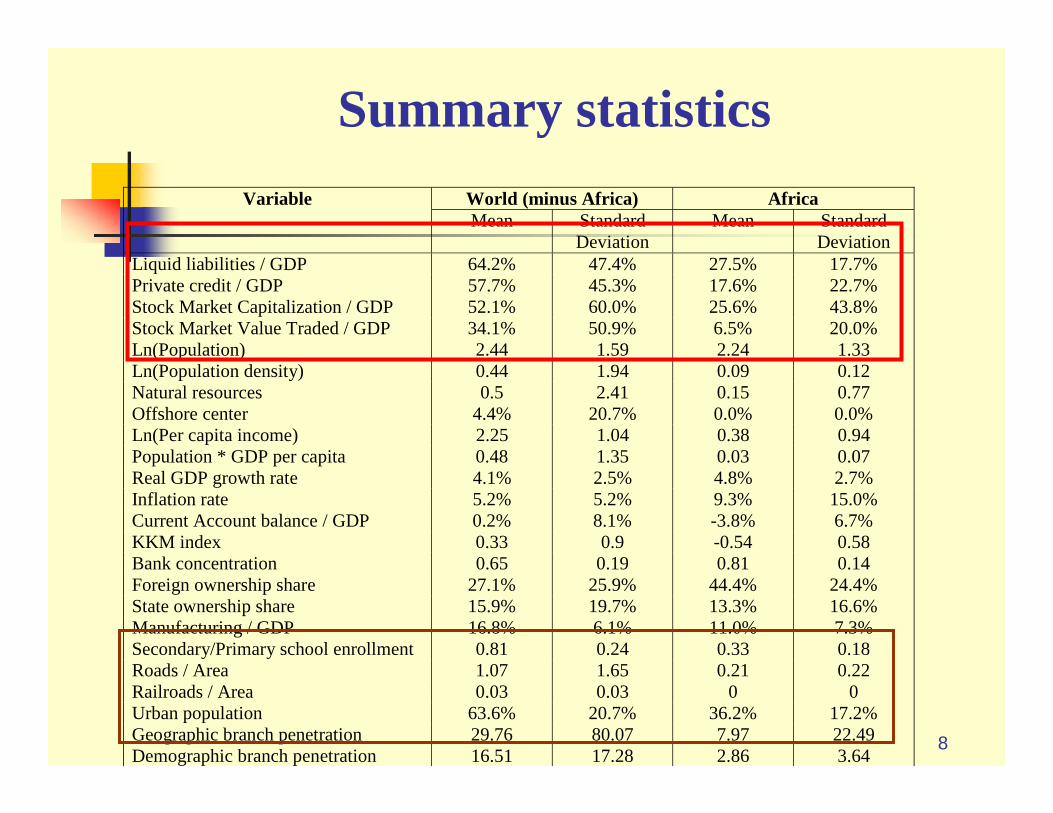
Summary statisticsWorld (minus Africa) Africa Variable Mean Standard
Deviation Mean Standard
Deviation Liquid liabilities / GDP 64.2% 47.4% 27.5% 17.7% Private credit / GDP 57.7% 45.3% 17.6% 22.7% Stock Market Capitalization / GDP 52.1% 60.0% 25.6% 43.8% Stock Market Value Traded / GDP 34.1% 50.9% 6.5% 20.0% Ln(Population) 2.44 1.59 2.24 1.33 Ln(Population density) 0.44 1.94 0.09 0.12 Natural resources 0.5 2.41 0.15 0.77 Offshore center 4.4% 20.7% 0.0% 0.0% Ln(Per capita income) 2.25 1.04 0.38 0.94 Population * GDP per capita 0.48 1.35 0.03 0.07 Real GDP growth rate 4.1% 2.5% 4.8% 2.7% Inflation rate 5.2% 5.2% 9.3% 15.0% Current Account balance / GDP 0.2% 8.1% -3.8% 6.7% KKM index 0.33 0.9 -0.54 0.58 Bank concentration 0.65 0.19 0.81 0.14 Foreign ownership share 27.1% 25.9% 44.4% 24.4% State ownership share 15.9% 19.7% 13.3% 16.6% Manufacturing / GDP 16.8% 6.1% 11.0% 7.3% Secondary/Primary school enrollment 0.81 0.24 0.33 0.18 Roads / Area 1.07 1.65 0.21 0.22 Railroads / Area 0.03 0.03 0 0 Urban population 63.6% 20.7% 36.2% 17.2% Geographic branch penetration 29.76 80.07 7.97 22.49 Demographic branch penetration 16.51 17.28 2.86 3.64
9
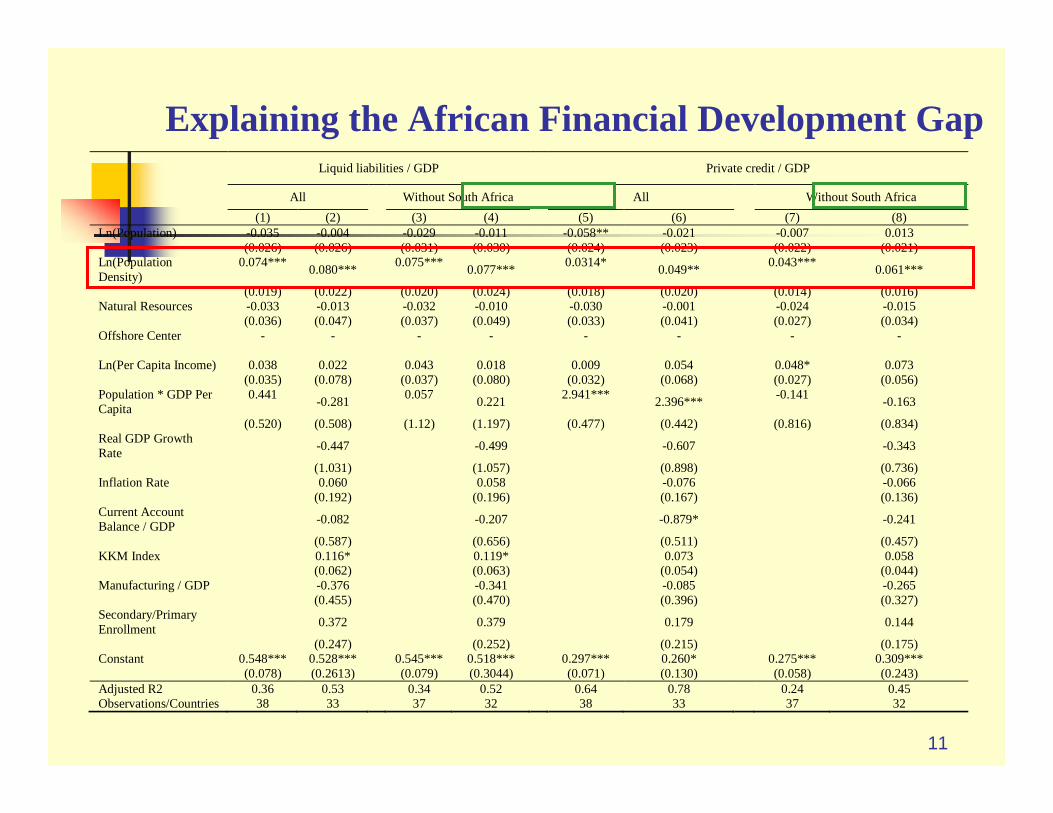
Measuring African Financial Development Gap
Measuring the African financial development gap:Obtain predicted levels of financial development for SSA countries, based on regression analyses of other low- and middle-income countriesFor the majority of SSA countries, the actual levels of banking sector development are below predicted levels
Analyzing determinants of financial development:Population density seems to matter more for Africa;
Natural resources ‘curse’: Similar in Africa and elsewhere;
Macroeconomic conditions and institutional environment: Not as important
10
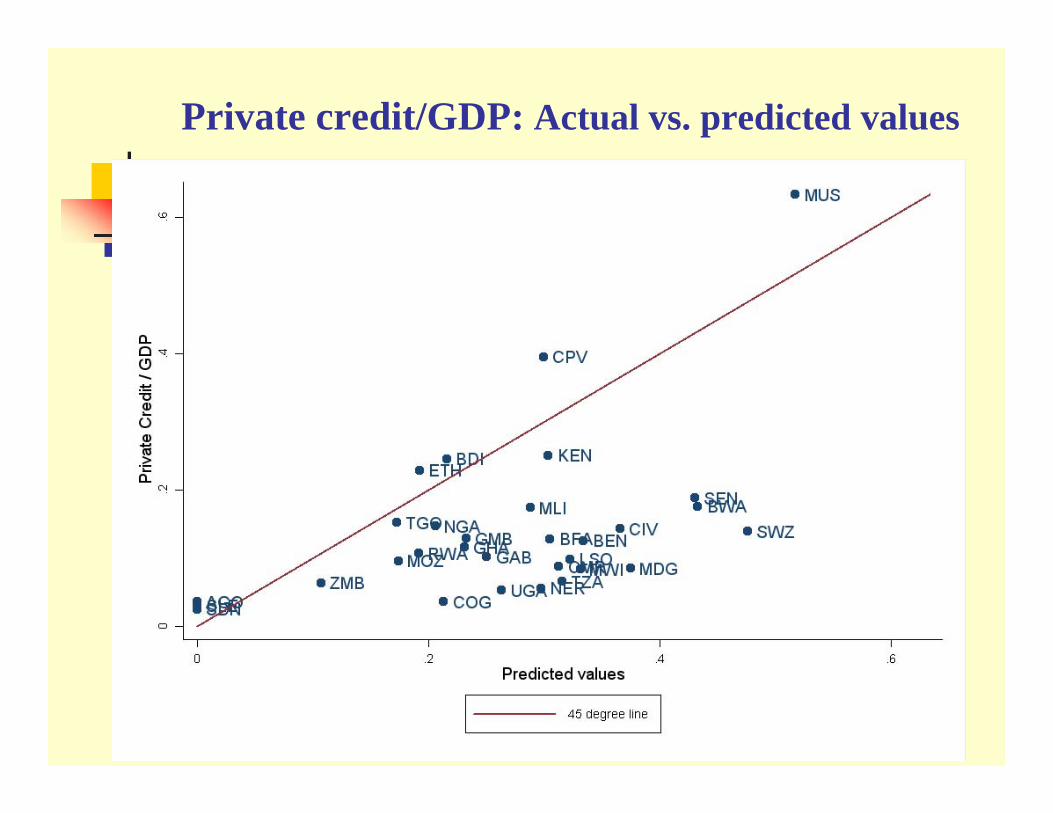
Private credit/GDP: Actual vs. predicted values
11
Explaining the African Financial Development Gap Liquid liabilities / GDP Private credit / GDP
All Without South Africa All Without South Africa (1) (2) (3) (4) (5) (6) (7) (8) Ln(Population) -0.035 -0.004 -0.029 -0.011 -0.058** -0.021 -0.007 0.013 (0.026) (0.026) (0.031) (0.030) (0.024) (0.023) (0.022) (0.021) Ln(Population Density)
0.074*** 0.080*** 0.075*** 0.077*** 0.0314* 0.049** 0.043*** 0.061***
(0.019) (0.022) (0.020) (0.024) (0.018) (0.020) (0.014) (0.016) Natural Resources -0.033 -0.013 -0.032 -0.010 -0.030 -0.001 -0.024 -0.015 (0.036) (0.047) (0.037) (0.049) (0.033) (0.041) (0.027) (0.034) Offshore Center - - - - - - - - Ln(Per Capita Income) 0.038 0.022 0.043 0.018 0.009 0.054 0.048* 0.073 (0.035) (0.078) (0.037) (0.080) (0.032) (0.068) (0.027) (0.056) Population * GDP Per Capita
0.441 -0.281 0.057 0.221 2.941*** 2.396*** -0.141 -0.163
(0.520) (0.508) (1.12) (1.197) (0.477) (0.442) (0.816) (0.834) Real GDP Growth Rate
-0.447 -0.499 -0.607 -0.343
(1.031) (1.057) (0.898) (0.736) Inflation Rate 0.060 0.058 -0.076 -0.066 (0.192) (0.196) (0.167) (0.136) Current Account Balance / GDP
-0.082 -0.207 -0.879* -0.241
(0.587) (0.656) (0.511) (0.457) KKM Index 0.116* 0.119* 0.073 0.058 (0.062) (0.063) (0.054) (0.044) Manufacturing / GDP -0.376 -0.341 -0.085 -0.265 (0.455) (0.470) (0.396) (0.327) Secondary/Primary Enrollment
0.372 0.379 0.179 0.144
(0.247) (0.252) (0.215) (0.175) Constant 0.548*** 0.528*** 0.545*** 0.518*** 0.297*** 0.260* 0.275*** 0.309*** (0.078) (0.2613) (0.079) (0.3044) (0.071) (0.130) (0.058) (0.243) Adjusted R2 0.36 0.53 0.34 0.52 0.64 0.78 0.24 0.45 Observations/Countries 38 33 37 32 38 33 37 32
Good News out of AfricaPost-Crisis
Stock market phenomenon Stock exchanges have proliferated in AfricaTwo decades ago, just 5 in SSA and 3 in North Africa; now about 25 stock exchanges in AfricaThe phenomenal growth was registered particularly in Sub-Saharan Africa, excluding the older markets in South Africa and EgyptDespite the challenges faced in terms of low capitalization and liquidity, recent performance of African stock markets has been remarkable, both in absolute and risk-adjusted basisMobile Banking and the Rise of Equity BankToward resolution of financial development gap – also promotion of integration of informal/formal.
Resilience and Diversity of African Economic Performance
Overall, African economies have been resilient to the global crisisThe effect of the crisis was, nonetheless, significantThe growth dropped to 2.5% from a three-year pre-crisis average of 6% [Channel for crisis transmission]However, no bailouts, no large bank failures, no large company failuresGrowth has resumed, even accelerating For years, oil and other commodities have been drivers of growth, but currently non-oil producing countries are growing at a similar rateNow seven African countries are among the fastest growing in theworldSSA is growing faster than Asia, except China and India
Seizing the MomentumCall for Greater Diaspora Engagement
Urgency for Africa stakeholders to seize the momentum
AfricansDiaspora US trading partnersDevelopment partners
The stakeholders should have a voice in the development of policies regarding business, investment and trade – and research and training to inform economic policies in Africa
African Economic Research Consortium (AERC)
Established in 1988
A not-for-profit organization incorporated in the US (Delaware Corporation)
Registered in Kenya as an international, not-for-profit organization and operates under a host country agreement with the Government of Kenya
AERCCore Agenda
Capacity building for advancement of economic policy research and training:
Locally-based economic researchersAcademicsPolicy practionersPromote retention of such capacity
Research ArmTraining Arm: Masters and doctoral programs Policy Arm: Forums for direct interface with policy makers Network
AERCResearch
Develop a credible local capacity for policy-oriented researchThematic Programs
Poverty, Income Distribution and Food SecurityMacroeconomic policiesTrade and Regional IntegrationPolitical Economy
Finance and Resource Mobilization
AERCResearch Monitoring and SupportBiannual research workshopsBiannual plenary conferencesPeer review: a network of African researchers External review: a network of resource people drawn from around the globe Technical workshops and individual technical sessionsFinancial support for various stages of research development: New proposals, WIP, Final Report
AERC Collaboration and Policy Dialogue
Collaborative research programLarge-scale projects to team up African researchers and their counterparts elsewhere
To sustain interest in African economic research by those outside the regionTo generate policy-relevant literature for African academic and policy communities
Senior Policy SeminarSenior scholars research program: new initiative to sustain the interest of senior African researchers
AERC Training Arm
Graduate training programs in economics to support individual studies and enhance capacity of economics departments, including agricultural economics, in SSA public universities
Goal: deliver economic programs that meet international standards but relevant to Africa.
Joint efforts of participating universitiesCommon curriculum and its development by participating universitiesJoint development of teaching materialsJoint facility for teaching elective coursesJoint enforcement of standards through annual evaluation, including external examiners
AERCCollaborative Training ProgramsCollaborative Masters Program (CMAP)
20 participating universities (9A and 11B)A send their students to BAg Econ and Applied Econ (CMAE)
Collaborative Ph.D Program (CPP)Participants: Cape Town, Dar, Ibadan, Nairobi, Benin, Wits, Younde II, Cocody
Joint facility for electivesThesis workshops at AERC biannuals
Academic boards and Role of AERC
AERC NetworkResearchersResource personsStudentsUniversitiesGovernance bodiesOther stakeholders in the Consortium
AERC GovernanceBoard of Directors
Institutional MembersAt large members
Executive Director reports to the board and an ex-officio member of the boardProgram Committee
Leading scholars, policy makers, international resource persons,ED
Academic boards (mostly heads of participating universities)AERC Secretariat
AERCGlobal Resource Partners
Donor governmentsInternational organizationsAfrican organizationsPrivate foundations
AERC is an African Success StoryOver 2500 researchers supportedOver 600 thematic research projectsMany who have gone through AERC programs are now at high places in leading African policy institutions, universities, and other institutions (e.g., numerous governors of central banks, successive chief economists of the African Development Bank)AERC poised for the next level of excellence
My VisionThe AERC will be globally recognized as a premier capacity building institution in the advancement of research and training that inform economic policies in Africa, particularly SSA.
This vision globalizes my understanding of the vision of the AERC founders for sustainable development of SSA based on policies guided by rigorous research and training.
Global integration of the AERC at the center of agendaWith increasing global interconnectedness, need to keep abreast of advances globally and promote best practices in whatever we do.
Strategies
Global integrationResource sustainabilityBranding and enhancing profileIdentifying and building comparative advantage for AERCFostering culture of excellence
Global Integration of AERCAERC should strive for best global practices in its research and training programs. Researchers should target high quality international conferences and outlets for presentations and publications. Expanding network to have productive partnerships with African and non-African institutions to foster frontier research and training. Global integration strategies are consistent with the AERC’s mission of building and retaining local capacity.
Beyond local capacity building, AERC should also encompass a strategy for brain gain. Brain gain and retention of local capacity can be mutually reinforcing.
Resource SustainabilityMobilizing Africa-based resources
Formulating value proposition for policy institutions in AfricaEffective communication of what the AERC has achieved in the policy arena, senior policy seminars, collaborative research programs, and even highlighting the AERC impact on regulatory human capital
Mobilizing private-sector resourcesDevising a strategy for the value proposition for the private sectorTargeting both Africa-based and external private firms, including the Diaspora Expanding the AERC agenda to embrace the private sector issues both in research and policy
Transparency and governance, risk management capacity, access to capital, financial regulation, and capital market institutions
Gradually building endowmentPossible seeding: channeling a small fraction of current contributions
Enhancing AERC ProfileEffective communication strategy that reaches out to all the stakeholders, including policy makers and donors, so that AERC’s programs and outreach are widely appreciated. Providing clarity for what the AERC stands for, what it has accomplished over the years, and what it wishes to achieve moving forward. Leveraging global integration strategy to enhance profile
Utilizing the growing network of alumni, researchers, resource persons, and visiting faculty and partner institutions as vehicles
Adherence to best practices in research generation by targeting first-tier publication outlets and exposure of AERC research at first-tier forums around the world.
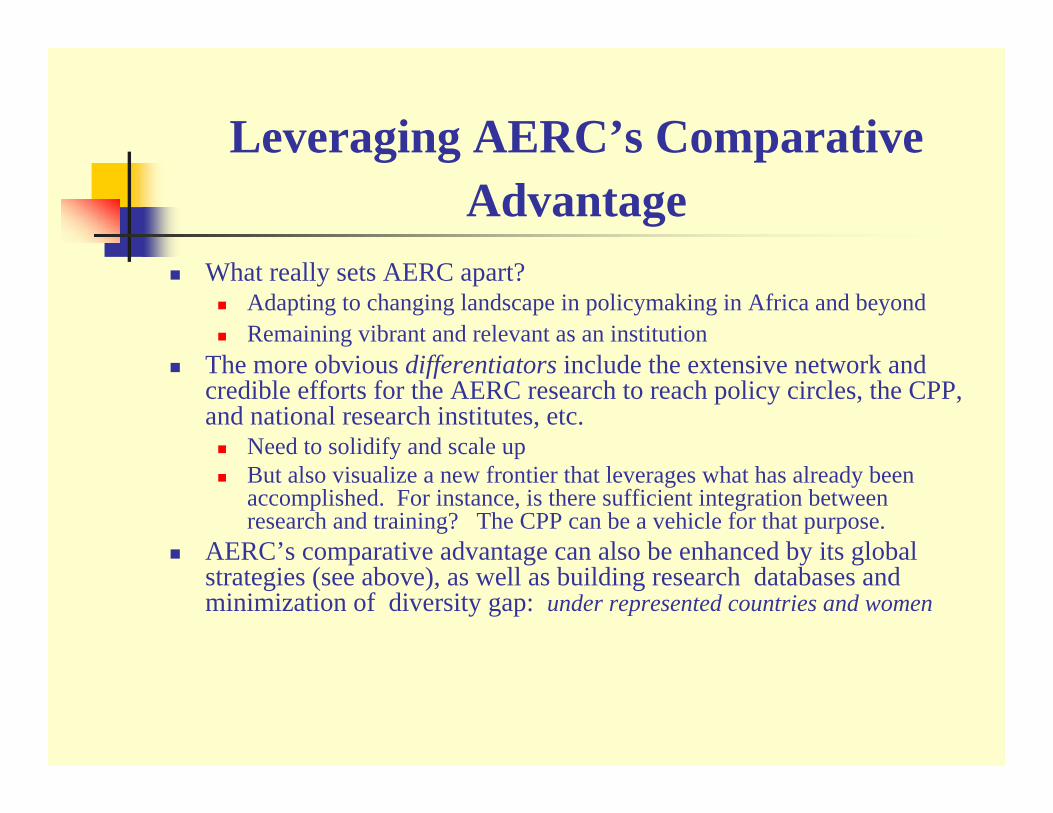
Leveraging AERC’s Comparative Advantage
What really sets AERC apart? Adapting to changing landscape in policymaking in Africa and beyondRemaining vibrant and relevant as an institution
The more obvious differentiators include the extensive network and credible efforts for the AERC research to reach policy circles, the CPP, and national research institutes, etc.
Need to solidify and scale up But also visualize a new frontier that leverages what has already been accomplished. For instance, is there sufficient integration between research and training? The CPP can be a vehicle for that purpose.
AERC’s comparative advantage can also be enhanced by its global strategies (see above), as well as building research databases and minimization of diversity gap: under represented countries and women
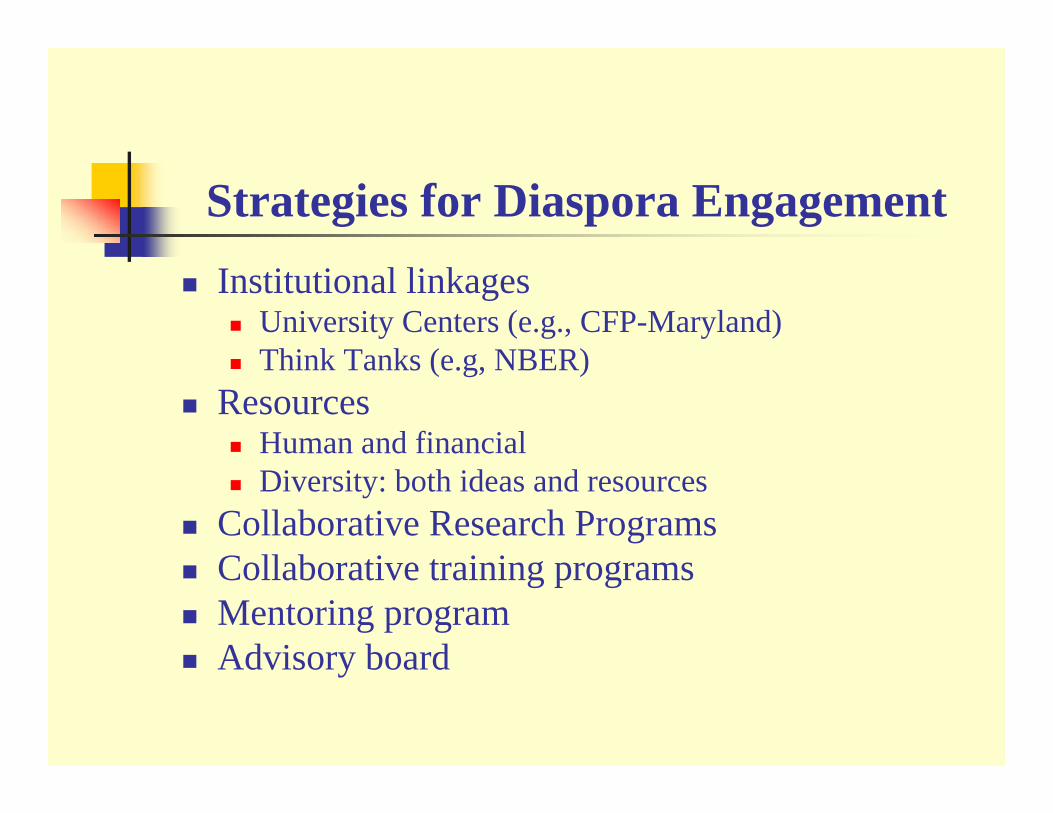
Strategies for Diaspora EngagementInstitutional linkages
University Centers (e.g., CFP-Maryland)Think Tanks (e.g, NBER)
ResourcesHuman and financialDiversity: both ideas and resources
Collaborative Research ProgramsCollaborative training programsMentoring programAdvisory board


![Aerc%20 Presentation[1]](https://img.pdfslide.us/doc/110x75/558650dcd8b42a1b498b4704/aerc20-presentation1.jpg)