Embed Size (px)
Citation preview
PASPerformance Testing
Part 1: The PAS Phono Sectionby George Ronnenkamp
Pacific Audio Regenesis
Pacific Audio Regenesiscopyright 2014
There are few devotees of vacuum tube audio who will not have at least a passing familiarity with the the Dynaco PAS stereo preamplifier. Introduced in1960, it was the brain child of Ed Laurent and superceded the popular PAM 1 mono preamplifier. Glowing reviews by popular audio publications of the day praised its high performance and excellent value. More recently, however, many resident "experts" on popular online audio forums, as well as some suppliers of PAS "upgrade" products, have taken to some rather harsh criticism of the venerable PAS. Encompassing almost everything from inferior performance to outright faulty design, it has even been suggested that the PAS is worthy only of being stripped bare, and the chassis used for DIY projects. But, given it's rich history, and positive reviews, are these recent claims credible?
The intent of this series of articles is to perform an objective analysis of the PAS preamplifier and to explore the validity of some of the most common criticisms. The analysis will include both computer modeled and laboratory measured performance.
Part I: The PAS Phono Section
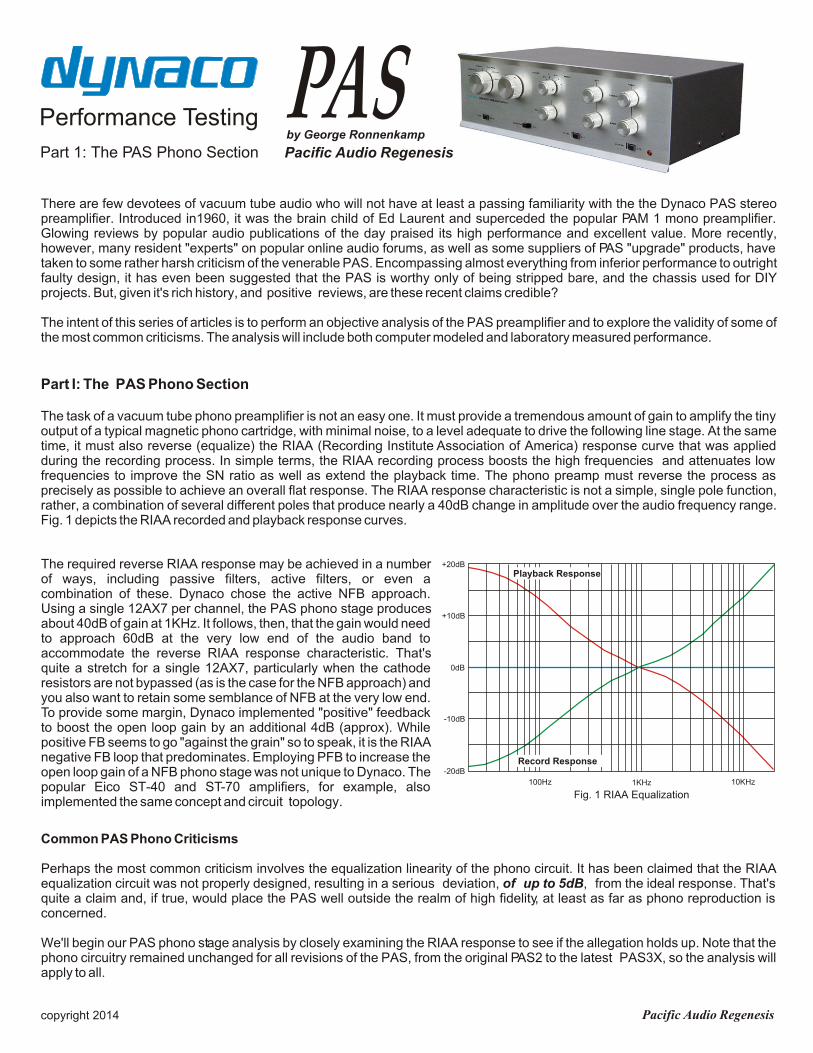
The task of a vacuum tube phono preamplifier is not an easy one. It must provide a tremendous amount of gain to amplify the tiny output of a typical magnetic phono cartridge, with minimal noise, to a level adequate to drive the following line stage. At the same time, it must also reverse (equalize) the RIAA (Recording Institute Association of America) response curve that was applied during the recording process. In simple terms, the RIAA recording process boosts the high frequencies and attenuates low frequencies to improve the SN ratio as well as extend the playback time. The phono preamp must reverse the process as precisely as possible to achieve an overall flat response. The RIAA response characteristic is not a simple, single pole function, rather, a combination of several different poles that produce nearly a 40dB change in amplitude over the audio frequency range. Fig. 1 depicts the RIAA recorded and playback response curves.
The required reverse RIAA response may be achieved in a number of ways, including passive filters, active filters, or even a combination of these. Dynaco chose the active NFB approach. Using a single 12AX7 per channel, the PAS phono stage produces about 40dB of gain at 1KHz. It follows, then, that the gain would need to approach 60dB at the very low end of the audio band to accommodate the reverse RIAA response characteristic. That's quite a stretch for a single 12AX7, particularly when the cathode resistors are not bypassed (as is the case for the NFB approach) and you also want to retain some semblance of NFB at the very low end. To provide some margin, Dynaco implemented "positive" feedback to boost the open loop gain by an additional 4dB (approx). While positive FB seems to go "against the grain" so to speak, it is the RIAA negative FB loop that predominates. Employing PFB to increase the open loop gain of a NFB phono stage was not unique to Dynaco. The popular Eico ST-40 and ST-70 amplifiers, for example, also implemented the same concept and circuit topology.
100Hz
0dB
+10dB
-10dB
+20dB
-20dB
1KHz 10KHz
Record Response
Playback Response
Fig. 1 RIAA Equalization
Common PAS Phono Criticisms
Perhaps the most common criticism involves the equalization linearity of the phono circuit. It has been claimed that the RIAA equalization circuit was not properly designed, resulting in a serious deviation, of up to 5dB, from the ideal response. That's quite a claim and, if true, would place the PAS well outside the realm of high fidelity, at least as far as phono reproduction is concerned.
We'll begin our PAS phono stage analysis by closely examining the RIAA response to see if the allegation holds up. Note that the phono circuitry remained unchanged for all revisions of the PAS, from the original PAS2 to the latest PAS3X, so the analysis will apply to all.

RIAA Performance Claimed by Dynaco
It was quite common, in the day, for the even high-end audio equipment manufacturers to state only that their amplifiers actually had an RIAA equalized input, along with, perhaps, the sensitivity. Dynaco, however, provided a graphical representation of the full equalization curve. While this was meaningful for the more technically inclined, it likely meant little to the average user. However, those familiar with RIAA equalization could easily confirm that the performance was very respectable, indeed. At 20Hz, the graph just touches on +20db. This corresponds to about a 0.7db deviation from ideal. At 20KHz, we see approximately -19db, which corresponds to a deviation of 0.6db. The entire response curve remains well within the max deviations exhibited at the extremes of the audio range. Thus, the response could be stated as: 20Hz - 20KHz, +/- 0.7dB max. There is certainly no evidence of any significant error.
Note: the RIAA plot shown in Fig 2. was derived from the actual graph Dynaco provided in the owner/assembly manual. For clarity here, the small image in the manual was scanned into Corel , enlarged, then carefully traced. Every possible care was taken to make sure it is an accurate representation of the original, published plot.
As far as RIAA equalization specifications published by Dynaco, I am not aware of any other than the graph depicted in Fig. 2. The only other tidbit of information I could find was an advertisement that appeared in audio publications of the day. Although it does not contain any "specifications" as such, the advertisement shown in Fig. 3 does allude to RIAA performance (highlighted). It is also incredibly bold in its claims and confirms that Dynaco was quite confident in the phono performance of the PAS.
From their own published RIAA response plot, and advertisements, it seems clear that Dynaco expected high quality phono reproduction from the PAS preamplifier.
Fig. 3 Dynaco Advertisement Stereo Review 1966
Fig. 2 Dynaco Published RIAA Response
20
-30
-20
-10
0+
10
+20
+3
0
FREQUENCY, CPS
RE
SP
ON
SE
, D
B
1K 10K100
20
RE
SP
ON
SE
IN D
B
FREQUENCY IN Hz
RIAA
NAB
EQUALIZATION CHARACTERISTICS
+5
-5
-5
+5
0
0
50 100 300 500 1K 3K 5K 10K 20K
"The curves for frequency response, RIAA (disc) equalization, and NAB (tape head) equalization turned out to be extremely linear."
High Fidelity Magazine June 1966
High Fidelity Magazine June 1966
"The tape and phono equalization were by far the mostaccurate we have ever measured, within 0.8db of the ideal response from 20 to 20000 Hz."
Stereo Review July, 1966
Stereo Review Magazine July, 1966
Independent Laboratory Reviews
from Hirsch-Houck Laboratories:
from High FidelityMagazine:
Considering the source of this review, it's highly unlikely that a serious error in the phono response would just "slip by".
Manufacturers claims are one thing, but what about independent confirmation? Fortunately, we can still look to the past where reviews were typically supported with laboratory measurements, not just subjective fluff.
Pacific Audio Regenesiscopyright 2014 2

So far, there is nothing to indicate a serious deviation in the RIAA equalization. Certainly nothing remotely approaching the magnitude of error that has been claimed. From Dynaco's published specifications, to respected independent laboratory test reviews, all seem to indicate a very respectable level of performance. What then, is the basis for these claims of serious error?
Origin for Claims of RIAA Error
Once something becomes "common knowledge", and propagated as fact, over time, it can be difficult to trace to its origin. In this case, however, there is a document trail. At the time of this writing, a well known online Dynaco "upgrade" board vendor continued to display a document that contains the following statement:
"Unfortunately, the moving magnet phono response of the Dynaco PAS preamplifier as designed departs significantly from the standard by as much as 5db at the lowest frequencies.."
A response plot is also provided which displays the elleged error showing approximately +5db error at 10Hz, and +3.8db at 20Hz. To avoid any type of copyright violation, I have chosen not to reproduce the plot image from that website in this document. However, those who wish to investigate, may want to try a Google search using "Dynaco Doctor" as the search phrase.
To me, the response plot appears to be a computer simulation performed in what looks very much like LT Spice (with which I'm familiar). The circuit model itself is not presented for analysis, nor are any supporting laboratory measurements provided. Having actually measured the phono response of numerous PAS preamps over the years, my own results have always compared favorably with those of the renowned reviewers of the past. As well, my own more recent modeling efforts only served to confirm the measured results. In other words, no significant error!
In addition to the claimed large error, modifications are recommended which claim to bring the response to within +/- 0.25dB. In support of this, again, only what appears to be a computer simulation. These modifications have become widely known, and propagated over various online forums, where they are repeated as "gospel". Actual "measured" results to verify the validity of either the claimed error, or the recommended "fix", are never provided. Should the claim prove false, then it is also likely that the "fix" will not provide an improvement, and perhaps even the opposite.
And so again, I will model, as well as measure, the response of yet another stock PAS phono stage for the purpose of this article.
Simulating the PAS Phono Circuit
Fig. 4 LT Spice Model of PAS Phono CIrcuit
I simulated the phono circuit with LT Spice, using the NH12AX7 triode model downloaded from Duncan's Amp Pages (www.duncanamps.com). Before modeling the entire PAS phono circuit, I began by separately modeling the common cathode stages of the preamp for the purpose of verifying the accuracy of the NH12AX7 tube model. With the DC bias voltages, gain, and impedances modeling close to what I had expected, I then proceeded to model the entire phono circuit as shown Fig. 4 below.
Note:
The supply voltage has been set to 210VDC, as indicated in voltage chart in the Dynaco assembly manual. The line stage load is the load the phono stage actually "sees". The 47K resistor is located on the blend switch, and is easy to overlook. The 750K resistor represents the balance pot. The 200K and 50K resistors represent the volume potentiometer, and the 4.7K resistor is the load at the loudness tap. I mention these points specifically because they are important, and often "mis"modeled by others.
Pacific Audio Regenesiscopyright 2014 3
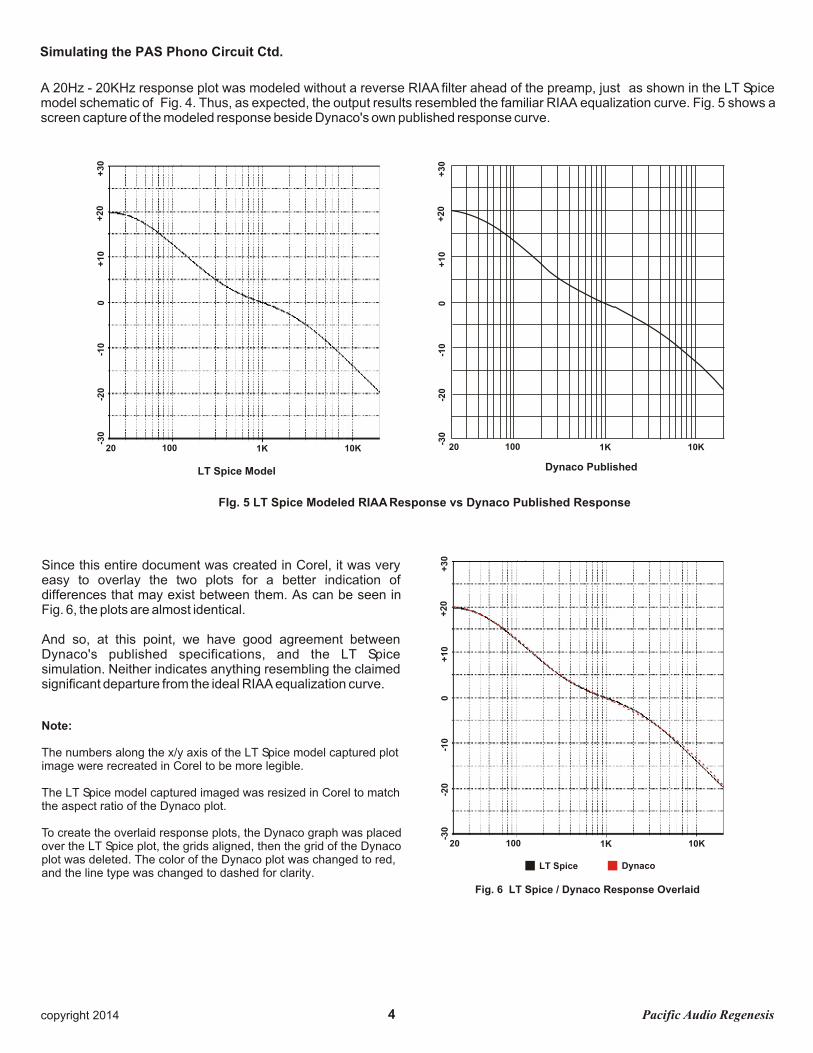
FIg. 5 LT Spice Modeled RIAA Response vs Dynaco Published Response
LT Spice Model Dynaco Published
-30
-20
-10
0+
10
+20
+3
020 1K 10K100
-30
-20
-10
0+
10
+2
0+
30
20 1K 10K100
A 20Hz - 20KHz response plot was modeled without a reverse RIAA filter ahead of the preamp, just as shown in the LT Spice model schematic of Fig. 4. Thus, as expected, the output results resembled the familiar RIAA equalization curve. Fig. 5 shows a screen capture of the modeled response beside Dynaco's own published response curve.
Fig. 6 LT Spice / Dynaco Response Overlaid
-30
-20
-10
0+
10
+20
+3
0
20 1K 10K100
LT Spice Dynaco
Since this entire document was created in Corel, it was very easy to overlay the two plots for a better indication of differences that may exist between them. As can be seen in Fig. 6, the plots are almost identical.
And so, at this point, we have good agreement between Dynaco's published specifications, and the LT Spice simulation. Neither indicates anything resembling the claimed significant departure from the ideal RIAA equalization curve.
Note:
The numbers along the x/y axis of the LT Spice model captured plot image were recreated in Corel to be more legible.
The LT Spice model captured imaged was resized in Corel to match the aspect ratio of the Dynaco plot.
To create the overlaid response plots, the Dynaco graph was placed over the LT Spice plot, the grids aligned, then the grid of the Dynaco plot was deleted. The color of the Dynaco plot was changed to red, and the line type was changed to dashed for clarity.
Pacific Audio Regenesiscopyright 2014
Simulating the PAS Phono Circuit Ctd.
4

While the simulated plot of the RIAA equalization curve is helpful in making a direct comparison to Dynaco's published specifications, it is easier to comprehend the results when presented in a more traditional, linear format. To do that, the LT spice model was modified to include a reverse RIAA filter ahead of the preamp, as shown in Fig. 7. This is, perhaps, the more common way phono response would be modeled. Of course, the reverse RIAA filter must be as near perfect as possible in response so as to not adversely affect the modeled response. This is also true in the real world where reverse RIAA filters are constructed and used to actually measure the response in the lab. Creating a near perfect computer model of such a filter is "much" easier than creating a "real world" filter, however. Rather than design one myself, I chose to use the reverse RIAA filter model developed by Norman Koren. Before implementing it in my PAS phono model, I first modeled the reverse RIAA filter, by itself, to verify its accuracy. It showed as being within +/- 0.01db over the audio band, certainly more than good enough!
Fig. 7 LT Spice Model of PAS Phono Circuit with Reverse RIAA Filter
Fig. 8 LT Spice Model of PAS Phono Circuit with Reverse RIAA Filter
The response was modeled again over the range of 20Hz -20KHz and the result shown in Fig. 8 below.
This plot makes it much easier to see small deviations from the ideal response curve. In LT Spice you can drag a curser along the response curve to obtain precise readings at any point. In this image, the curser is positioned at the point of maximum error at 30.1458Hz with a magnitude of +586.072mdB (millidecibels), or +0.586072dB. Other maximum deviations were found at about 200Hz at -0.41dB, and at 20KHz, -0.14dB (needless decimal places deleted).
Given this particular response curve, the RIAA equalization could be stated simply as: +0.58dB / -0.41dB 20Hz - 20KHz. This would be considered outstanding performance for any vintage preamplifier.
Pacific Audio Regenesiscopyright 2014
Simulating the PAS Phono Circuit Ctd.
5

What about the recommended modifications?
Along with the allegations of significant error in the RIAA response, were recommended modifications which, if implemented, claimed to correct the problem. These involve changes in the values of the RIAA feedback components, as well as replacing one of the 0.1uF output coupling capacitors with a jumper. It is claimed that the response will remain within +/-0.25dB, down to 10Hz, once modified. I altered my LT Spice model to reflect these modifications shown in Fig. 9 below.
Fig. 9 LT Spice Model of PAS Phono Circuit - Modified
The LT Spice plot of the modified RIAA circuit is shown in Fig. 10 below. While the response above 200Hz is impressive, it drops off fairly quickly below that, exceeding -2dB at 20Hz. The claimed +/- 0.25dB response would only be maintained above 220Hz.
Fig. 10 LT Spice Plot of Modified PAS Phono Circuit
It is my belief that computer models should always be verified by real world observation which, in the case of amplifiers, means laboratory testing. The test subject was a PAS 2, built from a kit, with its original boards and associated components. The filament power supply had been previously refreshed with new capacitors and SS diodes in place of the selenium rectifier. All phono stage components were measured prior to testing and, as it turned out, there was only one resistor that was just slightly out of tolerance which was replaced. All other components, including the 1% capacitors in the phono stage, were within tolerance and the supply voltages were as expected. Vintage Telefunken 12AX7's, testing good, were installed to make the PAS as original as possible.
To establish a base line reference, the stock phono response was measured, and plotted, at 30 points over a range of 20Hz - 20KHz. No reverse RIAA filter was employed at the input, and the output was taken at the tape out jack. Instrument loading was 10megohms, and thus considered insignificant. The modeled response, at the same points, was also plotted on the same graph for ease of comparison. The measured vs modeled results are shown in Fig. 11.
Modeled vs Measured:
Pacific Audio Regenesiscopyright 2014
Modified Components
6

Modeled vs Measured Ctd:
Fig. 11 Stock PAS Phono Response - Measured vs LT Spice Model
The measured response plot correlates almost exactly to the LT Spice model from 100Hz and higher. Below 100Hz, some divergence becomes apparent. Maximum deviation occurs at about 30Hz with +0.58dB modeled vs +0.72dB measured. The low end deviation was not entirely unexpected, however. The test amp. component values are not identical to the model, plus the preamp runs pretty much "wide open" as far as NFB, at the very bottom end. More on that later.
Overall, however, the correlation is obvious, and there is no evidence of the huge error in equalization that has been claimed.
Next it was time to test the validity of the modifications claiming to improve the RIAA performance such that the response would be within +/- 0.25 dB of ideal over the entire audio range. The modifications consist of:
Replace the 0.1uF capacitor at the output of the second 12AX7 stage with a jumper.
Replace the 4.7M resistor in the FB circuit with 2.0M.
Replace the 100K resistor in the FB circuit with 95.3K
Replace the 2750pF capacitor in the FB circuit with the parallel combination of 2200pF and 470pF.
Replace the 68pF capacitor in the FB circuit with 820pF. Delete the 750pF capacitor on the selector switch.
Disclosure Note: To obtain values within 1%, components on hand were configured in series and/or parallel combinations as required.
-
-
-
-
-
The modifications were implemented using components within 1% of the specified values. The amplifier was tested again with the response plotted over the same 30 points in the 20Hz - 20KHz range. The test results are shown in Fig. 12 below:
Fig. 12 Modified PAS Phono Response - Measured VS LT Spice Model
Measured
Modeled
Pacific Audio Regenesiscopyright 2014
Measured
Modeled
7

Modeled vs Measured Ctd.
The measured result is slightly better than modeled, but overall correlation is very good. The error at 20Hz being -1.94dB modeled vs -1.79dB measured, and at 20KHz, +0.007dB modeled vs +0.13dB measured. Overall, the measured response could be stated as +0.13dB/-1.79dB 20Hz - 20KHz.
As to the validity of the claims made for the modifications, the measured performance above 100Hz is impressive, no question. Below 100Hz, however, the response falls off, reaching -1.79dB at 20Hz. That's twice the maximum error exhibited by the stock circuit, and not really a surprise since the modification attempts to correct a large low frequency error that does not actually exist.
RIAA Equalization Conclusion:
The claim that the PAS phono stage is flawed in design, and thus, deviates significantly from the ideal response by as much as 5dB is, in my opinion, not justified. A properly functioning PAS does not exhibit errors of that magnitude. The claimed design flaw, and recommended modifications to fix it, appear to be supported only by computer generated response plots. Neither the models that generated them, nor any supporting laboratory measurements, have ever been published as far as I am aware. Actual measurements performed by independent reviewers also do not support the claim.
Other PAS Phono Issues:
As mentioned previously, the PAS phono stage employs negative feedback to achieve RIAA equalization. In order for the NFB loop to accurately define the gain at any point, there must also be sufficient "headroom," additional available gain. In the case of the PAS, as frequency becomes lower, the amount of negative feedback is reduced until, at the very low end of the audio band, very little feedback remains as the amplifier gasps to achieve the required gain . There is little headroom left and it is running nearly "wide open". Thus, it stands to reason that equalization accuracy, at very low frequencies, may also be subject to variation with tube gain. The question is, how much? And, keep in mind, that numerous top name brand manufacturers of the day also employed the exact same NFB approach, so this is not only a PAS condition.
To determine just how much variation may be expected, I selected three 12AX7's with measured GM I felt could be representative of tubes with "hot" higher than typical gain, "typical" (near data sheet specs) performance, and "worn out" weak performance. Tube GM was 1440/1425, 1250/1262 and 680/720 respectively, measured in a custom test fixture, not a commercial tube tester, under the conditions of 100V plate voltage, -1V grid voltage (or very nearly so). The RIAA response was measured (not modeled) and the results are displayed in Fig. 13 below.
Other common criticisms of the PAS phono stage include errors in RIAA equalization due to varying tube gain (aging), as well as sensitivity to loading at the tape out jack. We'll look at each of these in detail.
RIAA Variation With Tube Gain:
Pacific Audio Regenesiscopyright 2014
Fig. 13 Measured Response vs Relative Tube Condition
Typical Good TubeHot New Tube Weak Tube
8

Since the phono stage is not buffered at the tape out jack, it is reasonable to assume the response may be affected by the application of a load. Furthermore, since the phono stage employs negative feedback to achieve RIAA equalization, the output impedance will change considerably over the audio band, and thus, so will the affect of loading. Fig. 14 illustrates how the output impedance changes with frequency. This plot was generated by measuring the actual output impedance at the tape out jack at 31 points over the range of 20Hz - 20KHz.The test subject PAS 2 was in stock configuration with Telefunken tubes installed.
! Note: This graph represents the output impedance of the phono stage with the line stage load (volume and balance pots) connected, as Dynaco intended, NOT the response of the phono board all by itself.
The measured output impedance vs. frequency showed the expected trend. At 20Hz, where the NFB is almost non existent, the output impedance is very high, approaching 75K. As the frequency increases, output impedance drops, reaching a low of about 260 ohms at 20KHz. It's interesting to note how the impedance curve also somewhat resembles the RIAA equalization curve. That too, should be expected, given the NFB equalization approach. The implications for significant loading affects, particularly at low frequencies, are clear. Nevertheless, since a tape out jack is provided, it's safe to assume that Dynaco expected some "reasonable" load may be applied. In considering what might constitute a reasonable load, it should be kept in mind the period of time in which the PAS was designed. The low input impedance of modern SS equipment would not have been foreseen.
The results of this test show the response actually becoming more linear as tubes age, until the point is reached where the high end response begins dropping off as well. However, even with the well worn tube, the response was still within 1dB over most of the audio range. So, while it is confirmed that tube gain does affect the equalization at low frequencies, it may not be nearly as extreme as some have claimed. Precise control of the very low end of the band poses some difficulties for all tube designs employing the NFB approach for equalization, not just the PAS. With NFB all but gone at that point, variations in tube gain can come into play to some extent.
Sensitivity to Loading:
RIAA Variation With Tube Gain Ctd:
Disclosure Note:
The tubes employed in this test were not all of the same brand. They were chosen from the tubes I had on hand to best represent a range of results from a hot new tube to an old, well worn tube. The hot new tube example was a new EH, the typical result was represented by a Telefunken, and the weak tube was a vintage Tungsol.
Pacific Audio Regenesiscopyright 2014
Fig. 14 Output Impedance vs Frequency measured at Tape Out Jack
9

It is readily seen how the application of a load affects the response, especially at lower frequencies. The dashed line indicates the response of the phono stage with the line stage disconnected, and no load applied to the tape out jack. The Line Stage Only plot serves as a reference for stock response with nothing connected to the tape out jack. Tape Jack loads in the 500K - 250K range tend to flatten the low end response peak but, going much below that, the response will really begin to suffer.
While the results of this test do confirm that loading could be an issue, it was not likely a significant concern when connecting typically high impedance devices of the day. However, when connecting modern solid state devices, which tend to have a much lower input impedance, loading effects should be considered. It may be necessary to employ an external buffer in such cases. And again, note that this condition applies to many vintage tube phono stages, not just the PAS.
Note:
It is important to bear in mind that "any" changes made to the load the phono stage actually sees can affect the low end response to some degree. That includes changes such as altering the values of the volume or balance potentiometers, bypassing the loudness and blend switches, etc. It is also fairly common for DIY'ers to re-purpose the phono board into another project. If this is done without considering the load impedance it will drive, there will be consequences for the low end response. The phono board was not intended to be a "stand alone" device. To perform as intended, it must drive the intended load. The stock line stage typically presents a load of about 225K. It should be noted that the tolerance of the volume potentiometer is about +/- 20%, so any particular PAS may exhibit slightly higher, or lower, line stage impedance. At the tolerance extremes, the level of the low end response peak could vary by about +/- 0.2dB. The volume potentiometer in the test subject PAS measured 249K.
A common modification involves replacing the 250K volume potentiometer with a modern, higher quality one, at 100K. How will this affect the phono response? Well, assuming the blend switch has not been bypassed (deleting the 47K series resistor), and the balance pot. remains unchanged, then the phono stage would see a load of about 135K. That would be approximately the same as applying a load of 330K at the tape out jacks of the stock circuit. You'd probably be down about half of a dB at 30Hz, and perhaps 1dB at 20Hz. Would you hear that? Probably not, as long as you don't connect anything to the tape out jacks.
Sensitivity to Loading Ctd.
To further explore the effects of loading, the response was measured, beginning with no load at all. Even the line stage load was disconnected. Then, with the line stage reconnected, various resistive loads, from 500K - 100K, were placed at the tape out jack. The results are displayed in Fig. 15 below.
Fig. 15 Measured Response vs Load at Tape Out Jack
Line Stage Only 500K 250K 100K
Line stage disconnected. No tape out load.
Pacific Audio Regenesiscopyright 2014 10
20

More about that Low End Peak
Having addressed the most common criticisms with actual measured performance data, we'll now have a closer look at how the NFB EQ circuit operates and why it exhibits some of the traits it does in the PAS. I'll try to keep this as non-technical as I can to make it understandable to as many as possible.
Fig. 16 shows the PAS phono circuit with the input selector switch set to the phono position and the associated EQ components highlighted. The connection from the plate of the second stage, through the highlighted components, to the cathode of the first stage, defines the negative feedback path. With just a quick look at the capacitor string in the FB path, it is apparent that, as frequency increases, the impedance represented by the capacitors will decrease, resulting in more NFB. Thus, gain will decrease as frequency increases, which is the general trend required for phono equalization. Of course, true RIAA EQ is a little more complicated, and that's where the parallel resistors come in. Working together, the resistors and capacitors in the FB path form a series of poles, or "corner" frequencies at 50Hz, 500Hz and 2122Hz (ideally) to create the proper response curve.
to line stage
Fig. 16 PAS with selector switch in Phono position
Fig. 17 shows the idealized case ( dashed line), and the actual realization (solid line). More recently, additional "theoretical" poles have also been proposed, and sometimes implemented, however, we will only consider the commonly accepted standard in this article.
While there are formulas to calculate the values of the feedback components, they tend to work out best when employing more (theoretically) perfect amplifiers, such as op amps. And even then, some "tweaking" of the final values is often required due to pole interactions. We won't go into any math here, rather a more simple explanation of which components are associated with each corner frequency and what they do.
Fig. 17 RIAA Playback Equalization
100Hz
0dB
+10dB
-10dB
+20dB
-20dB
1KHz 10KHz
50Hz
500Hz
2122Hz
Before choosing the values that set the corner frequencies, the desired 1KHz "reference" gain is determined. In the case of the PAS, about 40dB of gain at 1KHz was chosen, which is quite common. In the schematic shown in Fig. 16, it is the 100K resistor that predominantly determines the reference gain.
The first corner frequency (50Hz) is determined "ideally" by the interaction of the 2750pF capacitor and 4.7M resistor. I say ideally since additional "real world" factors come into play at very low frequencies, especially with tube amplifiers.
The second corner frequency (500Hz) is determined by the 2750pF capacitor and the 100K resistor. The third corner frequency(2122Hz) is determined by the 68pF and 750pF capacitors (in parallel) and the 100K resistor.
In relation to the actual response exhibited by the PAS, the level of that low end peak will be predominantly determined by the value of the 4.7M resistor. Lowering the value would increase the NFB and lower the peak, while raising it would increase the peak up until maximum available gain is achieved. That "dip" between the low end peak and 1KHz reference is predominantly influenced by the value of the 2750pF capacitor. Reducing the value would reduce the NFB, and reduce the level of the dip. The 1KHz level is determined by the 100K resistor. Less resistance reduces the gain, more increases it. The dip in the response above 1KHz is determined primarily by the parallel value of the 68pF and 750pF capacitors. More capacitance sends it in the negative direction, less sends it positive. And so, how did Dynaco arrive at the values that produce the response curve exhibited by the PAS? Ed Laurent is no longer around to ask, but perhaps we can try to apply some reverse engineering logic.
With 100K determining the reference gain, in a perfect, theoretical, world, calculated capacitor values of 3180pF and 750pF would then perfectly establish the 2nd and 3rd poles at 500Hz and 2122Hz. Of course, in the "real world" of NFB tube phono amplifiers, things are far from perfect. The open loop gain is not infinite, the output impedance is not zero, or even consistent over the audio band. There can be pole interactions, and so on. The limited choice of available "off-the-shelf" components is also a
Pacific Audio Regenesiscopyright 2014 11

Pacific Audio Regenesiscopyright 2014
More about that Low End Peak Ctd.
consideration. Some "tweaking" will be required. And so, in the PAS, those values ended up at 2750pF and 818pF (68pF and 750pF), which put the response within 0.3dB from 500Hz to 20KHz. Not too bad at all. Of course, any number of additional series or parallel values could have been added to bring it even closer, but likely not considered worth the extra expense. But now we have to consider that first pole at 50Hz, and trying to calculate the second resistor value is more problematic, for several reasons. First, there is too little NFB "headroom" left down there, with the gain nearly maxed out. The impedance presented by the .1uF coupling capacitors also begins to come into play, as well as the rising output impedance, effects of the line stage load, plus the need to drive some unknown tape out load. Somewhat of a balancing act occurs and, most likely, the 4.7M value was chosen empirically. And so, we see a moderate low end peak in response, which was likely intentional. Speculation, perhaps, but possibly the intent was to allow for some additional load at the tape out jack without significantly dragging down the response, while variations in tube gain, within reason, are still taken in stride.
When you see modifications, involving only value changes to the NFB circuit, which claim to improve the response such that it is within tiny fractions of a dB of the ideal, at the low end of the audio range, be suspicious. For that to be true, there would need to be sufficient gain available for the NFB circuit to properly "do its thing" and the PAS does not have that. However, assuming good tubes, and no additional load at the tape out jacks, that low-end peak would suggest that there is at least a little headroom left to, perhaps, flatten the response a bit more. And there is. With tubes that exhibit performance close to the "spec sheet" data, if you simply replace the 4.7M resistor with 3.9M, leaving everything else as is, the low end response, from 20Hz to 100Hz will come to within about +/- 0.3dB. The remainder of the response, up to 20KHz will remain the same, and is already quite acceptable. If you are one of those who has already implemented the "fix" described earlier, if you replace the 2M resistor with 3.3M, the low end response will become quite linear down to 20Hz, rather than dropping off. But again, in doing these things, keep in mind that replicating exact performance, from one PAS to the next, is not likely, for all the reasons we've discussed. But still, could be considered "improved" to some degree.
While it's easy to criticize, and bemoan what Dynaco "could" have done to make it even better, that's not the intent here. Almost anything can be made "better" by throwing unlimited money and resources at it. But then, fewer could afford it. Good performance at an affordable price was the goal. In the end, the PAS delivered phono equalization performance, described by Hirsch-Houck Laboratories as, "by far the best we've ever measured." It would seem Ed Laurent made some very wise compromises.
PAS Phono Stage Quick Summary
Part II
Does the PAS exhibit large RIAA equalization errors due to flawed design?
No. This allegation is not supported by credible independent test results, or circuit analysis. When in proper working condition, the PAS delivers very respectable EQ performance for a vintage tube preamplifier.
Is the EQ affected by tube gain?
Yes, to some degree, but only at the very low end of the audio band. Variations between tubes that test "good" will likely be within +/- 0.5dB of the response exhibited by a tube that exactly meets spec sheet figures. This is not nearly as extreme as some have claimed.
Is the EQ affected by loading at the Tape Out Jack?
Yes, at the low end of the audio band. This will mostly be a concern when modern SS devices, with lower input impedances, are connected. It is possible an external buffer may be required with loads below about 250K. Tube devices of the day, however, would likely not have presented significant problems.
Part II of this series will cover the line stage and power supply.
12