Embed Size (px)
Citation preview
COPPER—1999 22.1
COPPERBy Daniel E. Edelstein
Domestic survey data and tables were prepared by Melissa F. Batrla and Janet D. Richards, statistical assistants, and theworld production tables were prepared by Regina R. Coleman, Linder Roberts, and Glenn J. Wallace, international datacoordinators.
In 1999, mine production of recoverable copper in the UnitedStates continued its downward slide that began in 1998, fallingby more than 250,000 metric tons (t) to the lowest level since1990. In addition to mine closures announced in 1998 thatcarried forward into 1999, low refined copper prices led toadditional mine cutbacks and closures. Following numerousacquisition offers and counter offers during the third quarter ofthe year, a consolidated copper industry emerged in October. Phelps Dodge Corp. acquired all of the assets of Cyprus AmaxMinerals Company, and Mexico’s Grupo Mexico, S.A. de C.V.acquired the assets of ASARCO Incorporated. The Broken HillProprietary Company Ltd. (BHP) closed its remaining U.S.mines at midyear. Although the United States maintained itsposition as the world’s second largest mine producer of copper,accounting for about 13% of world production, its share ofglobal production continued to decline from its 19% share in1994. Chile, where mine production increased by 19% in 1999,was the largest mine producer, increasing its share to 35% ofworld production. About 50 countries reported production ofcopper, the top 10 of which accounted for 80% of production. The world reserves and reserve base for copper were estimatedto be 340 million metric tons (Mt) and 650 Mt, respectively. The United States had about 13% each of reserves and reservebase.
U.S. copper smelter and refinery production also plummeted,falling by 25% and 15%, respectively, owing to the combinedimpact of mine cutbacks and low prices. By yearend, three ofseven primary smelters had closed. Secondary output declinedowing to capacity curtailments in 1998 and the impact of lowerprices on scrap availability. Primary and secondary refinedproduction declined owing to the resultant downstream shortageof anode for electrolytic refining and a shortage of scrap for firerefining. One primary and one secondary refinery closed duringthe year, while others experienced significant cutbacks. TheU.S. share of world refined production fell to 15%, down from18% in 1998, and it ceded its historical position as the leadingglobal producer of refined copper to Chile (18%). Likewise, theUnited States, with less than 12% of global output, lost itsposition as the leading smelter producer, falling to third placebehind Chile (13%) and Japan (12%).
Thirty-three mines operating in 9 States, down from 38 in1998, reported recoverable quantities of copper in 1999. Thetop 10 and top 15 mines accounted for more than 92% and 99%,respectively, of production. The remaining 18 mines wereeither small leach operations or byproduct producers of copper. The principal mining States, in descending order, Arizona,Utah, New Mexico, Montana, and Nevada, accounted for 99.5%of production. Though capacity of 2.02 Mt at mines that
operated during the year was down by only about 50,000 t fromthat of 1998, capacity utilization fell from about 90% to 79%,the lowest level since 1986.
During the year, 7 primary and 2 secondary smelters, 7electrolytic and 4 fire refineries, and 15 solvent-extractionelectrowinning (SX-EW) facilities operated in the United States. By yearend, however, three of the primary smelters and oneelectrolytic refinery had closed. Capacity utilization at smeltersand refiners fell from 90% and 92%, respectively, in 1998 to74% and 80%, respectively, in 1999. Following 5 years ofsteady growth, mine cutbacks led to a slight decline inelectrowon production. However, its proportional share of mineand refinery production rose to 37% and 27%, respectively. The conversion of old scrap to alloys and refined copper,declined by 85,000 t, or 18%, contributed 381,000 t of copper tothe market, and accounted for 12% of apparent industrialdemand. Lower copper prices in 1999 and closure of asecondary copper smelter during 1998 led to the sharp drop inrecovery.
Copper was consumed as refined copper and as direct meltscrap at about 35 brass mills, 17 wire-rod mills, and 600foundries, chemical plants, and miscellaneous operations. According to data compiled by the Copper DevelopmentAssociation Inc. (CDA) (2000, p. 18), mill and foundry productshipments to the U.S. market, including net imports of millproducts, continued its 5-year upward trend, rising by 250,000 t(6%), to a record high level of 4.23 Mt. According to CDAdata, 1999 shipments were 40% higher than in 1990.
The net import reliance for refined copper, as a percentage ofapparent consumption, rose sharply to 27% (from 14% in 1998)following cutbacks in domestic production and growth indemand. Canada was the largest U.S. trading partner forunwrought copper, accounting for 31% and 30%, respectively,of refined copper imports and total imports of unwroughtcopper, and 55% and 50%, respectively, of refined exports andtotal unwrought copper exports.
Legislation and Government Programs
In October, the U.S. Mint (1999a) announced selection of themanganese bronze alloy it would use to clad the new GoldenDollar, a three-layer coin having a solid copper core, and inDecember, the Mint (1999b) began releasing the coin for testingby vendors and manufacturers. Authorized by the Coin Act of1997, the new coin, though designed to have a golden color anda wide, smooth edge, was to match the electromagneticsignature and size and weight of the Susan B. Anthony Dollar(SBA) and therefore be accepted immediately by vending and
U.S. GEOLOGICAL SURVEY MINERALS YEARBOOK—199922.2
mass transit machines already accepting the SBA coins. OnJanuary 26, 2000, the U.S. Mint (2000b) began releasing itsnew Golden Dollar coin, and as of the end of February, the Minthad shipped 200 million Golden Dollars, four times the annualdemand in recent years for the SBA coin it was replacing. InFebruary, owing to the strong public demand for the new coins,the Mint (2000a) and the Federal Reserve developed a programto accelerate shipments of Golden Dollars and anticipatedplacing a total of 1 billion coins in circulation by yearend. At acoin weight of 8.1 grams and overall composition of 88.5%copper, 6% zinc, 3.5% manganese, and 2% nickel, 1 billioncoins would contain about 7,200 t of copper.
As part of its Common Sense Initiative instituted in October1994, the U.S. Environmental Protection Agency (EPA)proposed a rule change for the metal finishing industry thatwould allow facilities to accumulate sludges from the treatmentof electroplating wastes for up to 180 days without obtaining ahazardous waste storage permit. The rule was intended toencourage recycling of the sludges by making it moreeconomical to accumulate and ship these wastes in preference toland disposal. The proposed regulation would require the wastegenerators to implement practices that reduce the volume ortoxicity of wastes generated, making them more amenable torecycling, and to accumulate no more than 16 t of waste at anyone time. Current regulations only allow facilities that generatemore than 1 metric ton per month (t/mo) of hazardous waste toaccumulate wastes for 90 days without a waste storage permit. According to EPA, the metal finishing industry comprises morethan 3,000 independent “job shops” and 8,000 “captive shops”(U.S. Environmental Protection Agency, 1999b).
In December, the EPA issued a proposed rule that wouldgrant World Resources Company of Phoenix, according to acompany petition, a variance from hazardous wasterequirements for certain intermediary materials reclaimed frommetal-bearing sludges. Currently these metal concentrates(copper, nickel, and tin), produced from electroplating sludgesand sold to primary smelters, are classified as hazardous wastesand are subject to all the shipping, handling, and licensingrequirements of hazardous materials. The EPA noted that ingranting the variance it would be promoting recycling and, forthe most part, accepted the company’s assertion that thematerials are analogous to virgin raw materials used by primarysmelters (U.S. Environmental Protection Agency, 1999a).
On July 30, the Office of Trade Adjustment Assistance,Department of Labor, issued a ruling reversing its June 11decision to deny assistance under section 223 of the TradeAdjustment Act of 1974 to workers at Cobre Mining Companywho lost their jobs when the Continental Copper Mine,Hanover, NM, was closed. The reversal was based on newinformation submitted by the company indicating its intent toclose the mine by mid-1999 and by its parent company, PhelpsDodge, indicating that it had increased its imports of copperconcentrates during the relevant period. The initial finding hadsolely ascribed the closure to an environmental mishap duringMarch 1999 (U.S. Department of Labor, 1999).
The National Electrical Manufacturers Association (NEMA)was petitioning the EPA to delist copper from its annual ToxicRelease Inventory (TRI) because it felt that recycling prevents
most copper from entering the environment, there was growingevidence that copper was not as detrimental to the environmentas previously thought, and public access to the TRI list couldcause undue public concern and stigmatize some of itsmembers. In 1997, the TRI report indicated that 34,500 t ofcopper had been released to the environment. A similar petitionto delist copper in 1996 was rejected (American Metal Market,1999).
Production
While mine production capacity was adjusted downward byabout 35,000 t to reflect the long term expected closure of theContinental Mine in New Mexico in 1999, mine productiondeclined by about 260,000 t in response to lower prices andnumerous mine cutbacks. Capacity utilization fell to 79%,down from 90% in 1998. In addition to production cutbackscarried forward from 1998, BHP closed its Robinson Mine inNevada and its San Manuel Mine in Arizona at midyear, andPhelps Dodge closed its Metcalf concentrator at its MorenciMine in Arizona in August. Though these operations wereretained as still viable capacity in 1999, it is anticipated thatthese cutbacks will be carried forward into 2000 when capacitywill be adjusted downward to reflect anticipated long-termclosure.
Primary smelter production declined by 27% owing to theclosure of three of the seven primary domestic smelters during1999. Asarco’s El Paso Texas smelter was completely shutteredduring the first months of the year and was expected to remainso for a period of at least 3 years (ASARCO Incorporated,1998). BHP never reopened its San Manuel smelter in Arizonafollowing a maintenance shutdown in May and the subsequentclosure of its mines (Broken Hill Proprietary Company Ltd.,1999), and Phelps Dodge closed its Hidalgo New Mexicosmelter during the third quarter of the year owing to reducedconcentrate availability (Phelps Dodge Corp., 1999b). Secondary smelter production declined by about 11% owing tothe impact of low prices on scrap availability and capacitycurtailments during 1998.
Primary and secondary refinery production declined by 12%and 34%, respectively. The aforementioned mine and smelterclosures led to downstream shortages of anode for refining andthe closure of the BHP refinery in Arizona as well as cutbacksat Asarco’s and Phelps Dodge’s Texas refineries. Scrapshortages and reduced margins led to a cutback in fire refinedproduction by Cerro Copper Corp. and the indefinite closure ofPhilip Service Corp.’s Warrenton refinery in March. At thetime, Philip was negotiating with its lenders for debtrestructuring under bankruptcy proceedings (Platt’s MetalsWeek, 1999c). This followed closure of Cerro’s secondarysmelter/electrolytic refinery in 1998.
Industry Restructuring.—On July 15, Cyprus Amax andAsarco announced an agreement that would have combined thetwo companies in a merger-of-equals transaction. The newcompany was to be named Asarco Cyprus Incorporated. Themerger would have created the world’s second largest coppermining company with annual production of 900,000 t and cashoperating costs for copper production of less than $0.50 per
COPPER—1999 22.3
pound (Cyprus Amax Minerals Company, 1999). On August20, the two companies announced that they were rejecting anunsolicited proposal from Phelps Dodge to negotiate acquisitionof both companies in exchange for Phelps Dodge stock(ASARCO Incorporated, 1999e). Following a series of countermoves by Cyprus and Asarco, Phelps Dodge announced that itintended to take its acquisition offer directly to Asarco andCyprus shareholders; that it had filed documents with theSecurities and Exchange Commission outlining its plan tosolicit proxies from Cyprus and Asarco shareholders; and that itwould file suit against the board of directors of Cyprus andAsarco, alleging a breach of fiduciary duty (W.L. Watts, CBSMarket Watch, August 31, 1999, Asarco, Cyprus urge rejectionof hostile bid claim Phelps Dodge merely trying to break upmerger, accessed September 2, 1999, at URL http://cbs.marketwatch.com). Asarco and Cyprus urged their shareholdersto approve their merger of equals and reject Phelps Dodge’spurchase offer as being inequitable on the basis of percentageownership. They also filed a complaint in Federal Court thatsought an injunction and damages against Phelps Dodge,alleging that Phelps Dodge’s unsolicited takeover attemptviolated U.S. antitrust laws (ASARCO Incorporated, 1999d).
On September 24, Mexico’s Grupo Mexico, S.A. de C.V.entered the contest for control of Asarco when it tendered acash offer of $26 per share of Asarco stock (Grupo Mexico,S.A. de C. V., 1999b). Grupo Mexico, through its subsidiaryGrupo Minero Mexico, owns the Cananea and La CaridadMines, smelters, and refineries. Asarco had a long-terminvolvement in the Mexican copper mining sector that datedback to 1901, when Asarco first began mining in Mexico. Asarco still retained an 8% interest in Grupo Minero.
Cyprus Amax abandoned its merger with Asarco and onSeptember 30 announced that it had signed a merger agreementunder which Phelps Dodge would acquire Cyprus Amax for$7.61 in cash plus 0.2203 Phelps Dodge shares for everyCyprus share. Phelps Dodge anticipated cash cost savings of atleast $100 million from the merger (Phelps Dodge Corp. andCyprus Amax Minerals Company, 1999). On October 15, only1 week after finally agreeing to be acquired by Phelps Dodge,Asarco notified Phelps Dodge that it would accept a newlyincreased cash purchase offer from Grupo Mexico of $2.25billion, $29.75 per share, terminating its merger agreement withPhelps Dodge and paying Phelps Dodge a contractualtermination fee of $30 million (ASARCO Incorporated, 1999c).
By October 18, Phelps Dodge had accepted tenders forapproximately 89.6% of the outstanding shares of CyprusAmax, and on December 2, Phelps Dodge announced that it hadacquired all the remaining outstanding shares of Cyprus Amaxand that Cyprus Amax would cease trading on the New YorkStock Exchange (Phelps Dodge Corp., 1999a).
On November 12, Grupo Mexico, announced that it hadexecuted financing agreements with the Chase Manhattan Bankto provide funding for its purchase of all the outstanding sharesof Asarco. By November 12 ,Grupo owned or had receivedtender offers for almost 90% of Asarco’s common stock (GrupoMexico, S.A. de C.V., 1999a). On December 14, Grupoannounced that it had entered into a definite agreement to sellthe specialty chemicals division of Asarco for $503 million to
Cookson Group plc. The proceeds were to be committed toreducing the $817 million debt incurred in the purchase ofAsarco. Grupo Mexico further planned to reduce its acquisitiondebt through the sale of its aggregate division (Grupo Mexico,S.A. de C.V., 1999c).
Company Reviews.—On November 30, 1998, Asarcoannounced its intention to suspend operations at its El Pasosmelter for a period of 3 years, beginning on about February 1,1999. Asarco attributed the shutdown to a shortage ofconcentrates. The company expected that the same marketconditions would allow it to sell surplus concentrates for abetter overall return. The shutdown was expected to reducerefinery production at Amarillo by 63,000 t/mo and combinedwith other cutbacks from 1998, reduce production at Amarilloby 30% (ASARCO Incorporated, 1998). Accordingly,production at Amarillo fell to 319,000 t, down from 402,000 t in1998 and 447,000 t in 1997 (Grupo Mexico, S.A. de C.V.,2000, p. 23). In July, Asarco announced cutbacks at its Missionand Ray Mines in Arizona that would reduce annual productionby 25,000 t and reduce costs by about $0.01 per pound. At Ray,unusually hard ore was reducing mill throughput, and annualproduction of copper in concentrate fell from 111,000 t in 1998to 104,000 t in 1999. SX-EW production of cathode declinedslightly to 40,000 t. An expansion of the electrowinningtankhouse was completed at midyear. At Mission, productionof copper in concentrate fell from 116,000 t in 1998 to 91,000 tin 1999. Production of electrowon copper at the Silver BellMine in Arizona rose by about 8% to 20,700 t (ASARCOIncorporated, 1999b, p. 6; Grupo Mexico, S.A. de C.V., 2000,p. 23).
BHP scheduled a 45-day maintenance and upgrade shutdownof its San Manuel, AZ, smelter, beginning May 1, during whichit anticipated spending $54 million on improvements. On June25, following months of industry speculation about sale orclosure, BHP announced that it would cease operations at itsNorth American properties by the end of August (Broken HillProprietary Company Ltd., 1999). BHP was widely viewed ashaving high mine production costs at both its underground SanManuel Mine and its relatively low-grade Robinson Mine inNevada. Cash costs for San Manuel were estimated at $0.70 perpound (Platt’s Metals Week, 1999a). The San Manuel smelter,with a capacity of 340,000 metric tons per year (t/yr) of copper,had yet to reopen following its April renovation shutdown. Inaddition to the mines, which had a combined annual capacity of150,000 t of copper, and the smelter, BHP operated anelectrolytic refinery and wire-rod mill at San Manuel, and anelectrolytic refinery in White Pine, MI. The White Pinerefinery, which operates on imported anode from Canada,remained operational at yearend, as did BHP’s small Arizonaleach SX-EW operations at San Manuel, Pinto Valley, andMiami. The Pinto Valley sulfide operations had closed in 1998.
Summo Minerals Corp. reported that it expected continueddelays in the startup of construction at the Lisbon Valley Minein San Juan County, UT, because of a shortage of funds. In1997, Summo had secured $45 million in financing for theproject. Delays caused by appeals of the U.S. Bureau of LandManagement (BLM) Final Environmental Impact Statement andits Record of Decision approving development, however,
U.S. GEOLOGICAL SURVEY MINERALS YEARBOOK—199922.4
resulted in the withdrawal of the primary investor. Though finalappeal of the BLM decision was rejected in April 1999, thedrop in copper prices resulted in limited interest from otherinvestment firms (Summo Minerals Corp., 1999b).
In November, Summo’s board of directors approved a Phase2 exploration drilling program to further explore the Centennialdeposit, also in San Juan Co., UT, and approved commissioningof an updated feasibility study for the open pit SX-EW projectthat is expected to produce 18,000 t/yr of electrowon copper. Summo planned to use the updated study to secure financingonce copper prices improved (Summo Minerals Corp., 1999c).
In June, Summo announced that it had transferred all of itsproprietary data, rights, and obligations in the acquisition of theJohnson Camp Mine, Cochise County, AZ, to Nord ResourcesCorporation in exchange for 1.6 million shares of Nord commonstock, and that Nord had then completed the purchase ofJohnson Camp from Arimetco International Inc. Arimetco hadcontinued to operate the Johnson Camp Mine in Arizona andthe Yerington Mine in Nevada under the auspices of theArizona Bankruptcy Court since filing for bankruptcy at the endof 1996. A full feasibility study commissioned by Summo hadcalculated that for $15.3 million, including about $2 million inacquisition costs, annual production at Johnson Camp could beraised to 8,600 t/yr at a cash cost of less than $0.55 per pound,and that reserves were sufficient for 10 years of full production(Summo Minerals Corp., 1999a). Though mining at JohnsonCamp was suspended in May 1997, production continued frominventory in the heap leach.
In Utah, copper mine production at Kennecott Utah CopperCorp.’s Bingham Canyon Mine fell by 6% to 279,000 t, despitean 8% increase in ore milled, owing to the processing of “lowerthan life of mine average copper grades.” Mill-head ore grades,which fell from 0.62% copper in 1998 to 0.55% copper in 1999,were expected to recover in mid-2000. Gold grades did notdrop as significantly and gold production of 11,415 kilogramswas essentially unchanged. Copper refinery production rose11% to a record high 265,000 t, despite a 23-day shutdown ofthe associated smelter in January to rebuild the flash converterfollowing failure of the side wall (Rio Tinto, 2000, p. 18).
On October 21, 1998, Phelps Dodge announced that it wouldinstitute a series of cutbacks that would eventually curtailproduction by 91,000 t/yr of copper. At its Chino Mine in NewMexico, a production scaleback by 32,000 t/yr was phased inbetween October and the end of the first quarter of 1999. At itsrecently acquired Continental Mine, adjacent to Chino,underground mining was suspended immediately, and in March1999, the remaining surface operations were suspendedresulting in a total annual loss of production of 32,000 t.Production was suspended immediately at its 18,000-t/yr Ojosdel Salvador Mine in Chile. On June 30, Phelps Dodgeannounced a plan to further reduce costs by closing the smallerof the two concentrators at its Morenci Mine in Arizona, andtemporarily closing its Hidalgo, NM, smelter. The combinedimpact of the closures would be to reduce production at its ElPaso refinery by 50%, 195,000 t (Phelps Dodge Corp., 2000, p.22-24). In September, Phelps Dodge announced its intent toconvert all production at its Morenci Mine to leaching by early2001, investing $220 million to expand its SX-EW facilities,
expand crushing and conveying systems, and install mobilestackers to disperse crushed ore. Phelps Dodge expected torealize a cash savings of $0.09 per pound ($0.07 per pound fullcost) and production was expected to be maintained at about360,000 t, the rate following closure of the Metcalf concentrator(Phelps Dodge Corp., 1999c).
With acquisition of the assets of Cyprus Amax during thefourth quarter, coupled with its decision to convert Morenci toan all-leach operation, Phelps Dodge announced the writedownof its shuttered Hidalgo smelter and intent to reconfigure it intoa sulfuric acid plant. Production from Phelps Dodge’s domesticoperations, including minority share but exclusive of CyprusAmax operations, fell from 715,000 t in 1998 to 633,000 t in1999. At Morenci, electrowon production increased by about8,000 t, while recoverable copper from concentrate fell by47,000 t. At Chino, concentrate production of 67,400 t ofcopper and electrowon production of 50,600 t were down by10,200 t and 15,100 t, respectively (Phelps Dodge Corp., 2000,p. 65).
Phelps Dodge continued its domestic exploration activities,expending about $10 million, 25% of its exploration budget, onits domestic properties. At the Tyrone Mine in New Mexico,additional mine-for-leach material was delineated in the Niagaraarea where 500 Mt of leachable material grading 0.29% copperhave been delineated. Additional reserves were delineated inthe Western Copper Area at Morenci, and in the Dos Pobresand San Juan deposits in the Safford district, leach reserveswere expanded by about 6% to 1.83 Mt of contained copper(Phelps Dodge Corp., 2000, p. 68).
In December 1998, Nicolet Minerals Company, in an effort toaddress public concerns, announced significant improvementsto its design for its proposed underground mine near Crandon,WI, that would reduce the potential for acid and heavy metalrunoff, reduce the drawdown of local ground water, andminimize water discharge from the site. In 1999, Nicoletcompleted a revised environmental impact statement andsubmitted it to the Wisconsin Department of Natural Resourcesfor review. Nicolet also submitted documentation to satisfyWisconsin’s moratorium law that required documentation priorto issuance of permits of similar mines which had operated for10 years without violations or significant pollution from heavymetals or acid mine drainage. It also required similardocumentation from a mine that had been closed for 10 years. At full capacity, it is anticipated that the Crandon Mine willprocess about 2 million metric tons per year of ore and producebetween 200,000 t and 300,000 t of zinc concentrate and 20,000t of a copper-lead concentrate (Nicolet Minerals Company,1998; 2000).
PolyMet Mining Corp. has reported high recoveries using apressure-leach oxidation process to recover metals from a bulkconcentrate at its NorthMet project adjacent to the Mesabi ironrange in northeastern Minnesota. The company also reportedcompleting about one-third of an in-fill drilling program fordelineating reserves. According to estimates developed in 1991,the deposit contains 808 Mt of open pit minable resourcesgrading 0.116 grams per ton (g/t) platinum, 0.437 g/t palladium,0.432% copper, 0.109% nickel, 0.061 g/t gold, and 1.5 g/tsilver, as well as minor recoverable amounts of cobalt. Polymet
COPPER—1999 22.5
hoped to complete a prefeasibility study during 2000 (SkillingsMining Review, 1999).
Trade
Net imports of refined copper rose sharply for the fourthconsecutive year to 812,000 t, compared with 597,000 t in 1998. General imports of refined copper of 915,000 t were 78,000 tgreater than imports for consumption and are more thanaccounted for by a 102,000 t rise in London Metal ExchangeLtd. (LME) inventories held in New Orleans warehouses. Priorto the beginning of the accumulation of LME inventories inNew Haven and New Orleans warehouses in 1998, generalimports and imports for consumption were essentially equal. Refined copper exports of only 25,000 t, down from 86,000 t in1998 and 217,000 t in 1995, reflects both the decline in refinedcopper production and a continued rise in copper stocks held inCalifornia LME warehouses. Beginning in 1997, with theAsian economic crises that reduced copper demand in thosecountries, the traditional flow of refined copper from theWestern United States to Asian markets was interrupted andLME warehouses became the destination for significantquantities of U.S. production. Though the United Statesremained a net importer of copper concentrates in 1999,essentially no concentrate imports were reported during thesecond half of the year. This corresponded to the rationalizationof domestic smelting capacity.
Imports of wire rod, the semifabricate precursor to wiremanufacturing, rose sharply during the latter half of 1999following closure of two U.S. wire-rod mills. According toU.S. Census Bureau data, adjusted by the U.S. GeologicalSurvey for imports from Mexico, wire rod imports rose from108,000 t in 1998 to 188,000 t in 1999. Canada and Mexicoaccounted for 179,000 t. According to U.S. Census Bureau datacompiled by the Copper and Brass Fabricators Council Inc.(2000, p. 1-9), U.S. net imports of all copper and copper-alloysemifabricated products, excluding wire-rod mill products, roseto 139,000 t, up from 86,000 t in 1998 and 100,000 t in 1997. Canada and Mexico accounted for 74% of semifabricatedcopper exports and 30% of imports.
While global trade in copper scrap declined in 1999, U.S.exports of copper scrap of 314,000 t (estimated copper contentof 250,000 t) were essentially unchanged. The United Statesregained its position as the largest international source forcopper scrap, having relinquished that distinction during 1998to Russia, whose exports fell sharply in 1999 to about 200,000 t. Exports from Germany also declined sharply, falling by 55,000 tto 272,000 t (International Copper Study Group, 2000a, p. 40-43). China was the largest recipient of scrap, accounting forabout 45% of global scrap imports. It was also the largestrecipient of U.S. scrap, accounting for 27% of scrap exports. U.S. imports of copper scrap declined by 56,000 t to 211,000 t. Canada and Mexico were the leading sources for U.S. importsof copper and copper alloy scrap and accounted for 73% ofimports in 1999.
Prices and Stocks
In response to a growing oversupply of copper and risinginventories, copper prices during the first half of the yearcontinued their generally downward trend that began at midyear1997. The average U.S. producer price fell to $0.66 per poundin March, the lowest level since 1987, and in constant dollarterms, the lowest level since the Great Depression. Despite acontinued rise in domestic and world refined copper inventories,copper prices staged a rally at the end of April, the U.S.producer price, as reported by Platt’s Metals Week, rising toalmost $0.74 per pound by May 1. The rally was relativelyshort lived, and by the end of May the producer price hadretreated to $0.66 cents per pound. Industry offered severalexplanations for the rally, including speculative buying bycommodity funds in anticipation of company cutbacks. The 45-day maintenance and upgrade shutdown of BHP’s San Manuelsmelter, beginning May 1, fueled industry speculation that thecompany would simply close the smelter and mines withoutmaking its announced investment (Platt’s Metals Week, 1999a). According to data compiled by the International Copper StudyGroup (ICSG) (2000a, p. 6), world inventories of refinedcopper peaked in May at more than 1.5 Mt, and stocks held inCOMEX and LME warehouses reached new record highs ofalmost 900,000 t. This compared with yearend 1998 inventoriesof 1.36 Mt and 680,000 t, respectively.
Copper prices began a sharp rise at the end of June. By thesecond week in July, the producer price had risen by more than20% to $0.81. The price premium of COMEX over LMEwidened with rising prices from about $0.01 per pound to $0.02cents per pound, indicating the selective tightness in the U.S.market. The price rise was sparked by announcements ofproduction cutbacks by BHP and Phelps Dodge followedclosely by the announced shutdown of Falconbridge Ltd.’s KiddCreek smelter in Canada on July 8, when unionized workersbegan a strike at that plant. North American production hadalready been reduced by previous U.S. mine cutbacks and alabor dispute that had closed the Highland Valley Mine inBritish Columbia and threatened to keep it closed throughyearend (Platt’s Metals Week, 1999b).
Copper inventories held in COMEX warehouses fell by 27%,33,000 t during the third quarter, as inventories in San Manuel,AZ, were drawn down to feed BHP’s wire-rod mill followingclosure of its smelter and refinery. Domestic commodityexchange inventories stabilized at about 500,000 t during thefourth quarter of the year. COMEX inventories at yearend of83,000 t were at essentially the same level as yearend 1998,while U.S. LME inventories of 412,000 t were up from 340,000t at yearend 1998. According to ICSG data (InternationalCopper Study Group, 2000a, p. 7), yearend global inventories of1.45 Mt were up by more than 90,000 t (6.8%) from yearend1998, and, at the prevailing rate of consumption, representedmore than a 5-week supply of copper. Combined yearend LMEand COMEX stocks of 873,000 t were up by almost 200,000 t
U.S. GEOLOGICAL SURVEY MINERALS YEARBOOK—199922.6
from yearend 1998. Copper prices fluctuated significantly, butgenerally trended upward through the end of the year, theaverage U.S. monthly producer and COMEX prices inDecember rising to $0.854 and $0.814, respectively.
Consumption
Reported consumption of refined copper by domesticmanufacturers continued its post-recession upward trend, risingby 3.4%, to almost 3.0 Mt. In addition to refined copper,domestic manufacturers directly consumed (melted or processedinto chemicals) 1.3 Mt of copper-base scrap containing about 1Mt of recoverable copper. An additional 80,000 t of copper wasrecovered in the consumption of aluminum-, nickel-, and zinc-base scrap. While the total quantity of copper recovered fromthe direct consumption of scrap rose about 3% in 1999,secondary refined copper production fell by 120,000 t, or 34%.
Despite closure of two wire-rod mills during the year,consumption of refined copper at wire-rod mills increased byabout 2.8% and accounted for about 75% of domesticconsumption of refined copper. For the second consecutiveyear, consumption growth at wire-rod mills was moderated byincreased imports of wire rod, principally from Canada andMexico, that rose by 80,000 t to 188,000 t in 1999. In October,following closure of its smelter and refinery, BHP ceasedproduction at its 180,000-t/yr rod mill in San Manuel, AZ. In August, Superior Essex, a subsidiary of Superior TeleCom Inc.,announced that it was rationalizing electrical wiremanufacturing facilities and was closing plants at severallocations, including its 65,000-t/yr wire-rod mill in Pauline, KS,by yearend. It was expected that some of the lost capacitywould be recovered from increased production at its other wire-rod mills (Superior Essex, 1999). Wire mill capacity, includingthose closed by yearend 1999, rose by about 80,000 t in 1999 to2.38 Mt, as several mills took steps to increase capacityincrementally, and the new Encore Wire Corp. mill in Texasexperienced its first full year of production (Encore Wire Corp.,About our company, accessed September 25, 1999, at URLhttp://www.encorewire/index.html).
At brass mills, which were the second largest consumers ofrefined copper, consumption of refined copper rose by about10% owing to low copper prices that reduced the cost of usingrefined copper and reduced the availability of scrap forprocessing. Brass mills still remained the largest consumers ofscrap, accounting for about 60% of the total copper recoverablefrom scrap. Copper recovery from scrap at brass mills (811,000t) was essentially unchanged in 1999.
According to data compiled by the Copper DevelopmentAssociation Inc. (2000, p. 18), the supply of copper and copper-alloy products to the U.S. market by fabricators (wire mills,brass mills, foundries, and powder producers), including netimports, rose by about 2% to 3.92 Mt, up from the revised valueof 3.84 Mt in 1998, and contained an estimated 3.5 Mt ofcopper. About 71% of these shipments was as pure (unalloyed)copper products. Wire mill products accounted for about 49%of total shipments to the domestic market; brass mill products,46%; and foundry and powder products, 5%. In buildingconstruction, the largest end use sector, shipments rose by 5.3%
and accounted for about 41% of the market. Buildingconstruction included products used for building wire, plumbingand heating, air conditioning and commercial refrigeration,builders hardware, and architectural applications. Other usesectors included electric and electronic products, 27% ofshipments; transportation equipment, 12%; industrialmachinery, 10%; and consumer and general products, 10%.
World Review
Though more modest than in the preceding year, the globaloversupply of copper that developed at midyear 1997, continuedinto 1999. According to data compiled by the ICSG, reportedworld inventories of refined copper rose by about 90,000 t to atotal of 1,450,000 t. At the prevailing rate of consumption,yearend world inventories represented a 5.3 week supply ofrefined copper, essentially unchanged from yearend 1998, butnearly double that for 1996. Inventories held in LMEwarehouses rose by almost 200,000 t, overshadowing declinesin producer, consumer, merchant, and other exchange stocks. The oversupply continued to reflect the failure of consumptionto keep pace with large increases in global mine and refineryproduction outside the United States. Although worldconsumption of refined copper rose by 700,000 t, or 5.4%, itstill failed to completely close the large gap that had existedbetween world refined production and consumption that haddeveloped over the preceding years. Consumption in Asia grewby about 11%, or 550,000 t, and accounted for 38% of globalconsumption and most of the global demand growth. Consumption in Europe, 30% of global consumption, wasessentially flat. North American demand rose by 5.4% andaccounted for about 26% of global demand (InternationalCopper Study Group, 2000a, p. 7, 18). In 1999, world minecapacity rose by 700,000 t, or 5%, to 13.95 Mt, extending therapid growth trend that began in 1995. Australia and Chileaccounted for most of the capacity expansion, their capacitieshaving grown by 210,000 t and 630,000 t, respectively. Capacity also increased significantly in Argentina (55,000 t) andKazakhstan (65,000 t). World smelter capacity rose by almost300,000 t, despite the shutdown of three smelters in the UnitedStates. In Australia, smelter expansions at Mount Isa andOlympic Dam boosted capacity by about 125,000 t. In Japan,Nippon Mining and Metals Co. Ltd. completed a 1,000 texpansion, and in the Republic of Korea the L.G. Nikko Co.’sOnsan II smelter was fully commissioned (International CopperStudy Group, 2000b). World smelter production however, roseonly nominally owing to the large cutback in U.S. production. According to CRU International Ltd. (2000, p. 43-47), thesupply and demand for copper concentrates for smelting wasessentially balanced in 1999 and contract treatment (smelting)and refining charges assessed by smelters fell to an average ofabout $0.17 per pound of recoverable copper, down from $0.25the previous year when a concentrate shortfall had intensifiedcompetition for concentrates. World refinery capacity rose byabout 600,000 t owing to a 325,000 t expansion ofelectrowinning capacity, principally in Chile, and refineryexpansions tied to the smelter expansions in Australia and Chile(International Copper Study Group, 2000b, p. 53-72).
COPPER—1999 22.7
Argentina.—The Bajo el Alumbrera Mine, owned by M.I.M.Holdings Ltd. (50%), North Ltd. (25%), and Rio Algom Ltd.(25%), and which began production in October 1997, reachedfull capacity in 1999 and produced 192,000 t of copper inconcentrate, up from 154,000 t in 1998. Following additionaldrilling and a review of economic and mine planning factors,Alumbrera reserves were reduced by 27%, to 465 Mt of ore. The mine has an anticipated life of 14 years. Plans for a millexpansion to compensate for falling ore grades were scuttled(Rio Algom Ltd., 2000, p. 20).
Australia.—At the Mount Isa Mines Ltd.’s copper-lead-zincsilver operations, a major upgrade to the ISASMELT coppersmelter was completed in mid-1999, enabling the company toproduce a record 222,000 t of copper anode during fiscal year1999-2000, 405 t higher than in 1998-1999. The $243 millionupgrade was to boost capacity to 250,000 t/yr of anode,sufficient to process concentrate from Mount Isa and the nearbyErnest Henry Mine. An additional $96 million was spent toconstruct an “acid plant gas handling facility” to clean the wastegas before it is diverted to the fertilizer sulfuric acid plant. Development work on the Underground Enterprise Mine,located at depth beneath the existing Mount Isa Mine, continuedin 1999 and commercial production began on July 1, 2000. Oregrades of 4% copper will offset the cost of mining at depths ofbetween 1,200 meters (m) and 1,800 m below the surface. TheErnest Henry Mine, 160 km NE of Mount Isa, begancommercial production in May 1998 and at capacity willproduce about 95,000 t of copper in concentrate from reservesof 103 Mt grading 1.25% copper, contained in a plungingbreccia system that is amenable to open pit extraction. In theyear ending June 30, 2000, Ernest Henry produced 48,000 t ofcopper in concentrate (Mount Isa Mines Ltd., MIM at a glance,accessed September 11, 2000 at URL http://www.MIM.com.au;Mount Isa Mines, Ltd., 2000, p. 12-14).
Expansion of Western Mining Corp.’s Olympic Dam Projectwas completed in January, 3 months ahead of schedule, withstartup of feed to the new Outokumpu smelter. Refinedproduction at Olympic Dam rose to 138,000 t, up from 82,000 tin 1998, and was expected to reach design capacity of 200,000 tin 2000. The $1.94 million expansion was expected to reducefully allocated cash costs from $1.01 per pound of copper in1999 to less than $0.55 per pound in 2000. A fire in the solventextraction plant in late December was expected to have minimalimpact on achieving design capacity in 2000 (Western MiningCorp., 2000, p. 14).
Canada.—Production and capacity declined in 1999 owing tothe temporary closure of the Highland Valley Mine (BritishColumbia), the Myra Falls Mine (Vancouver Island), and thedepletion of reserves and closure of the Gaspe Mine (Quebec)late in the year. On May 15, Highland Valley Copper Companysuspended operations in response to mounting losses from lowcopper prices. The mine resumed operations in mid-Octoberfollowing negotiation of a 5-year labor agreement that linkedworker compensation to the price of copper. A similar risk-sharing power supply agreement was also negotiated (RioAlgom Ltd., 2000, p. 20). In Ontario, Inco Limited reported a5,000 t drop in production to 116,000 t, owing to extension ofits annual vacation shutdown, closure of its Levack McCreedy
West Mine in July (3 months ahead of schedule), and the StobieMine in August (Inco Limited, 1999).
In October, Northgate Exploration Ltd., reached an agreementto purchase the Kemess copper-gold mine in British Columbiafrom Royal Oak Mines Inc., which had been placed inreceivership in April. The mine began production in October1998 and at full capacity is expected to produce 27,000 t/yr ofcopper. In April, production resumed at Boliden Ltd.’s MyraFalls zinc/copper mine on Vancouver Island following a 3-month shutdown for rehabilitation and development work. InManitoba, Hudson Bay Mining and Smelting Company Ltd.began production in the second quarter of 1999 at its KonutoLake copper/zinc mine, west of Flin Flon, and was projected toproduce 10,000 t/yr of copper at capacity (Coulas, 2000).
Chile.—Mine production and capacity continued to escalate,rising by about 700,000 t and 600,000 t, respectively(International Copper Study Group, 2000b, p. 9). Production byState-owned Corporación Nacional del Cobre de Chile(CODELCO), the world’s largest copper producer, rose from1.50 Mt to 1.62 Mt, including its share of El Abra Mine. At theAndina Mine, an 80,000 t expansion, completed in November1998, boosted production from 164,000 t in 1998 to 249,000 tin 1999. At CODELCO’s newest division, Radomiro Tomic,which experienced its first full year of operation, the processingof 36 Mt of ore grading 0.69% copper yielded 190,000 t ofelectrowon copper, up from 162,000 t in 1998. Production at itslargest division, Chuquicamata, declined by 20,000 t to 630,000t, while production at Salvador and el Teniente rose nominallyto 92,000 t and 346,000 t, respectively. At the El Abra Mine,49% owned by CODELCO and 51% by Phelps Dodge, SX-EWproduction rose by 20,000 t to 220,000 t (Corporación Nacionaldel Cobre de Chile, 2000, p. 55).
At the Escondida Mine, copper in concentrate productiondeclined by 24,000 t to 827,000 t despite completion of a $281million mill expansion in late 1998 and a record mill throughputas mill head grades slipped from 2.46% copper in 1998 to2.05% copper in 1999. Startup of a $473 million processingfacility to treat oxide ore that had been stockpiled from the mainpit in November 1998 resulted in electrowon cathodeproduction rising from 29,000 t in 1998 to 132,000 t in 1999. The Coloso leach plant was closed permanently in May 1999(Rio Tinto, 2000, p. 20). At the Candelaria Mine, production ofcopper in concentrate rose by 13,000 t to 250,000 t, despitelower mill throughput as mill-head grade rose from 1.07% to1.21% copper (Phelps Dodge Corp., 2000, p. 64-65).
Construction of the $1.8 billion Collahuasi Mine(Falconbridge Ltd., 44%; Minorco S.A., 44%; Japaneseconsortium, 12%) and accompanying infrastructure wascompleted and commercial production begun in January 1999. Production in 1999 of 435,000 t of copper (385,000 t inconcentrate and 50,000 t SX-EW) at a cash operating cost of$0.38 per pound exceeded company expectations (FalconbridgeLtd., 2000).
Rio Algom announced that it had increased reserve estimatesat its Spence deposit to 400 Mt averaging 1% copper and havinga potential annual production output of 225,000 t of copper inconcentrate. A new mine model using a hybrid approach oftraditional sulfide concentrator and heap leach was developed
U.S. GEOLOGICAL SURVEY MINERALS YEARBOOK—199922.8
that allowed for processing a larger portion of the deposit withincreased annual output. Rio Algom expected to complete a fullfeasibility study in 2000 and hoped to begin construction in2002 (Rio Algom Ltd., 2000, p. 14-15).
Indonesia.—Following completion of its fourth concentratorexpansion early in 1998, P.T. Freeport Indonesia Co.’sGrasberg Mine in Irian Jaya achieved record mill throughput of220,000 metric tons per day (t/d) of ore in 1999, up from196,400 t/d in 1998. However, owing to a drop in mill-headgrade from 1.30% copper to 1.12% copper, production fell by43,000 t to 767,000 t, and site production costs rose by morethan $0.04 per pound to $0.365 per pound. Despite lower mill-head grades, gold recovery increased. Higher byproduct creditsand lower treatment costs resulted in net operating costs andtotal production costs falling from $0.11 per pound and $0.28 per pound, respectively, in 1998, to $0.09 per pound and $0.27per pound, respectively, in 1999. Freeport successfullyconcluded its “first-stage completion” testing of its new smelterand reported operating at 94% of its design capacity of 200,000t/yr of copper during the fourth quarter (Freeport-McMoRanCopper & Gold Inc., 2000, p. 22-25).
Mexico.—Grupo Mexico acquired the assets of U.S. copperproducer Asarco in December using a mixture of financialinstruments that included $546 million in equity in Grupo, $817million in new loan agreements, and assumption of $1.2 millionof Asarco debt. Grupo subsequently reduced its debt obligationby $512 million through the sale of Asarco’s specialty chemicaldivision.
At Grupo’s Mexicana de Cobre Division, a 2,000 t drop incopper in concentrate production (175,000 t of copper) at LaCaridad Mine was offset by a 2,000 t increase in SX-EWproduction (22,000 t). Smelter production rose by 45,000 t to341,000 t as a result of smelter upgrades including installationof an Asarco shaft furnace. The electrolytic refinery,commissioned in 1997, produced 275,000 t of refined copper,up from 227,000 t in 1998, and the wire-rod mill, which startedin 1998, produced 99,000 t of wire rod, an almost 100%increase from 1998. La Caridad refined copper and wire-rodwere a major source of U.S. imports. At the Mexicana deCananea Complex, the smelter, which had operated since thebeginning of the century, was permanently closed, andconcentrates shipped to La Caridad for smelting. Concentrateproduction declined from 357,000 t in 1998 to 300,000 t in1999, while SX-EW production was essentially unchanged at28,700 t. Construction of a third SX-EW plant with a 22,000-t/yr capacity was begun (Grupo Mexico, S.A. de C.V., 2000, p.16-22).
Peru.—Production from Southern Peru Copper Corp. minesrose by 10% to 338,000 t as the expanded mill, which started uplate in 1997, was expected to boost production at Cuajone from143,000 t in 1998 to 172,000 t in 1999. At Toquepala, the SX-EW expansion was completed and production rose to 49,500 tfrom 47,000 t in 1998. Modernization of the Ilo smelter, whichwill boost capacity by 10%, was proceeding and was expectedto be completed in stages by 2003. The $87 million project willinclude construction of a new acid plant, installation of a newsmelting furnace, modernization of converters, and expansion ofthe refinery. Refined production at Ilo rose slightly in 1999 to
251,000 t (ASARCO Incorporated, 1999a, p. 6-9a; GrupoMexico, S.A. de C.V., 2000, p. 26).
A mostly Canadian consortium consisting of Rio Algom(33.75%), Noranda Inc. (33.7%), Teck Corp. (22.5%), andMitsubishi Corporation (10%), was proceeding with thedevelopment of the $2.3 billion Antimina Project. Antimina isone of the world’s largest undeveloped copper-zinc oredeposits, with estimated in-pit proven and probable reserves of494 Mt averaging 1.7% copper, 1.0% zinc, 0.03% molybdenum,and 12 g/t of silver. By yearend, construction was welladvanced with the first production scheduled for the thirdquarter of 2001, well in advance of initial estimates (Rio AlgomLtd., 2000, p. 13).
Cambior Inc.’s La Granja project in northern Peru is one ofthe largest copper deposits in the world with reserves placed at2.3 billion metric tons grading 5.9% copper (13.6 Mt ofcontained copper), including 540 Mt grading 0.65% copper thatcould be leached. A feasibility study filed with Peruvianauthorities was based on an open pit generating from 250,000 to300,000 t/yr of copper at a development cost of $1.3 billion. In1999, development work focused on a hydrometallurgical testprogram for leaching the high-grade secondary mineralization(Cambior Inc., 2000, p. 16).
Zambia.—Early in 2000, Zambia Consolidated Copper Mines(ZCCM) announced that it had completed the sale of its state-run copper business after 3 years of delay. The privatizationprocess was limited in 1998 when Phelps Dodge and Norandawithdrew from the Kafue consortium, a group that had beennegotiating for a 94% interest in the Nkana and NchangaDivisions. The finalized sale placed a significant portion ofZCCM’s remaining copper production in the hands of AngloAmerican plc. Konkola Copper Mines plc. (65% owned byAnglo American, 20% by ZCCM, and 15% by other owners)would operate the Nchanga Division and the Konkola andKonkola deep mining project. It also held an option to purchase the Nkana smelter. Anglo projected output from theseoperations to reach 127,000 t of copper by 2004. MopaniCopper Mines Plc. (51% Glencore International AG ofSwitzerland and 49% First Quantum Minerals Ltd. of Canada) obtained a 90% stake in the Mufalira Mine, smelter, refinery,and the Nkana Mine, concentrator, and cobalt plant (Soloman,2000).
Outlook
U.S. mine capacity and production are expected to decline byabout 100,000 t and 150,000 t, respectively, in 2000 as the fullimpact of 1999 mine closures and cutbacks are felt. Productionand capacity are expected to decline by an additional 30,000 tand 250,000 t in 2001 as mines are removed from activecapacity following long-term closure. The Morenci Mine inArizona is expected to close its remaining concentrator andconvert to an all leach operation in 2001. Following minecutbacks and the closure of three primary smelters in 1999,primary smelter and refined production are expected to plummetin 2000, with primary refined production falling by 280,000 t,15%.
Secondary refined production is also expected to fall with the
COPPER—1999 22.9
closure of one of the two remaining secondary smelters. In May2000, Southwire Company, an integrated producer of copperwire, closed its secondary smelter and associated refinery inCarollton, GA, having failed to secure a buyer. As justificationfor the closure, the company cited the high cost of compliancewith environmental regulations in the Atlanta area and its strongbuying position as leverage for meeting its future refined copperneeds in a global market (Southwire Company, 2000).
Domestic consumption of refined copper during the first 6months of 2000 was unchanged from that of the same period in1999. A 30,000-t decline in consumption at wire-rod mills wasessentially offset by an increase in brass mill consumption. Thedecline in rod mill consumption reflects a decline in domesticrod mill capacity and an increase in wire rod imports. According to U.S. Census Bureau data, adjusted by the USGS,U.S. imports of wire rod for the first 6 months of 2000 were128,000 t, up from 83,000 t for the first 6 months of 1999 and108,000 t for all of 1998. In response to a growing shortage ofNorth American wire rod, as well as expectations of a continuedstrong North American market, Alcatel, a French-ownedcommunications company, announced plans to construct a200,000-t/yr wire-rod mill in the Southeastern United States(Platt’s Metals Week, 2000).
According to data compiled by the ICSG (InternationalCopper Study Group, 2000a), global mine production remainedrelatively stagnant over the first 7 months of 2000, averaging1.08 million metric tons per month (Mt/mo), yet was up byabout 1% over the comparative period in 1999. This reflects asharp departure from the 1997-99 period when world coppermine production growth averaged almost 4.7% per year. Similarly, though exhibiting greater monthly fluctuations, worldrefinery production has been relatively stagnant, averaging 1.22Mt/mo during the first 7 months of 2000, an increase of 2.5%over the equivalent period in 1999. This compares with a 3-yearaverage annual growth rate of 4.5%.
World consumption, though also exhibiting monthlyfluctuations, trended sharply upward during the first 7 monthsof 2000 and was up by 9% over the comparative 1999 period. In the 1997-99 period, world consumption growth averagedonly 3.8%. As a result of the disparity in refined productionand consumption, the calculated cumulative production surplus(refined production minus consumption) over the 1997-99period grew to 1.4 Mt, and reported world inventories rose by780,000 t. This trend was reversed during the first 7 months of2000, with a calculated production deficit of 390,000 t and areported stock decline of 280,000 t.
References Cited
American Metal Market, 1999, Group wants copper cut from toxics report: American Metal Market, v. 107, no. 171, September 3, p. 7.
ASARCO Incorporated, 1998, Asarco to take fourth quarter charge, announcessuspension of operations at El Paso smelter: New York, Asarco news,November 30, 2 p.
———1999a, Asarco 1998 annual report: New York, ASARCO Incorporated, 44 p.
———1999b, Asarco announces reduction in copper mine production: NewYork, ASARCO Incorporated press release, July 6, 2 p.
———1999c, Asarco notifies Phelps Dodge of intention to accept new GrupoMexico $29.75 per share offer: New York, ASARCO Incorporated pressrelease, October 15, 1 p.
———1999d, Asarco sues Phelps Dodge seeking clarification of antitrustissues: New York, ASARCO Incorporated press release, September 20, 2 p.
———1999e, Cyprus and Asarco set shareholders meeting: New York,ASARCO Incorporated press release, August 20, 2 p.
Broken Hill Proprietary Company Ltd., 1999, BHP—1999 profit result: Melbourne, Australia, BHP press release, June 25, 1 p.
Cambior Inc., 2000, Annual report 1999: Cambior Inc., 52 p.Copper and Brass Fabricators Council Inc., 2000, Import/export report:
Washington DC, Copper and Brass Fabricators Council Inc., February, 159p.
Copper Development Association Inc., 2000, Annual data 1999—Coppersupply and consumption: New York, Copper Development Association Inc.,20 p.
Corporación Nacional del Cobre de Chile, 2000, 1999 annual report: Corporación Nacional del Cobre de Chile, 101 p.
Coulas, Maureen, 2000, Copper: Ottawa, Canada, Preprint 1999 CanadianMinerals Yearbook, 7 p.
CRU International, 2000, Copper quarterly industry and market outlook: London, CRU International, April, 66 p.
Cyprus Amax Minerals Company, 1999, Cyprus Amax Minerals Company andASARCO Incorporated announce merger of equals: Denver, Cyprus AmaxNews release, July 15, 3 p.
Falconbridge Ltd., 2000, Falconbridge reports 1999 earnings of $153.1 million: Toronto, Canada, Falconbridge Ltd. press release, February 2, 6 p.
Freeport-McMoRan Copper & Gold Inc., 2000, 1999 annual report: Freeport-McMoRan Copper & Gold Inc., 56 p.
Grupo Mexico, S.A. de C.V., 1999a, Grupo Mexico executes financingagreements for Asarco merger: Mexico City, Grupo Mexico, S.A. de C.V.press release, November 12, 1 p.
———1999b, Grupo Mexico offers to acquire ASARCO Incorporated: MexicoCity, Grupo Mexico, S.A. de C.V. press release, September 24, 2 p.
———1999c, Grupo Mexico sells Asarco’s specialty chemicals division for$503 million: Mexico City, Grupo Mexico, S.A. de C.V. press release,December 14, 1 p.
———2000, 1999 annual report: Mexico City, Grupo Mexico, S.A. de C.V., 54p.
Inco Limited, 1999, Inco Limited moves forward with mine closings, extendedsummer shutdown: Toronto, Inco Limited press release, July 5, 1 p.
International Copper Study Group, 2000a, Copper Bulletin: Lisbon,International Copper Study Group, v. 7, no. 9, 48 p.
———2000b, Directory of copper mines and plants: Lisbon, InternationalCopper Study Group, April, 84 p.
Mount Isa Mines, Ltd., 2000, Annual report to shareholders: Mount Isa Mines,Ltd., 72 p.
Nicolet Minerals Company, 1998, Nicolet Minerals Company announces majorproject improvements to Crandon Project: Crandon, WI, Nicolet MineralsCompany news release, December 8, 4 p.
———2000, Nicolet Minerals Company completes major regulatory permitsubmissions: Crandon, WI, Nicolet Minerals Company news release,January 5, 1 p.
Phelps Dodge Corp., 1999a, Phelps Dodge completes acquisition of CyprusAmax Minerals Company: Phoenix, Phelps Dodge Corp. press release,December 2, 1 p.
———1999b, Phelps Dodge curtails copper production and restructures wireand cable business: Phoenix, Phelps Dodge financial news, June 30, 2 p.
———1999c, Phelps Dodge Morenci to convert all copper production toleaching—Will see unit cost reduction of 10 percent: Phoenix, Phelps Dodgenews release, September 19, 2 p.
———2000, Company annual report 1999: Phelps Dodge Corp., 72 p.Phelps Dodge Corp. and Cyprus Amax Minerals Company, 1999, Phelps Dodge
to acquire Cyprus Amax: Phoenix and Denver, Phelps Dodge Corp. andCyprus Amax Minerals press release, September 30, 2 p.
Platt’s Metals Week, 1999a, BHP preps San Manuel smelter for upgrade: Platt’s Metals Week, v. 70, no. 15, April 12, p. 1, 9.
———1999b, Highland Valley looks to 2001: Platt’s Metals Week, v. 70, no.28, July 12, p. 4.
———1999c, Philip closer to a deal: Platt’s Metals Week, v. 70, no. 11, March14, p. 14.
———2000, Alcatel plans new copper rod plant: Platt’s Metals Week, v. 71,no. 3, August 7, p. 11.
Rio Algom Ltd., 2000, Annual report 1999: Rio Algom Ltd., 92 p.Rio Tinto, 2000, Annual report and accounts 1999: Rio Tinto, 144 p.
U.S. GEOLOGICAL SURVEY MINERALS YEARBOOK—199922.10
Skillings Mining Review, 1999, Polymet advances toward pre-feasibility stage: Skillings Mining Review, v. 88, no. 46, November 13, p. 4-8.
Soloman, Paul, 2000, Zambia finalizes sale of state copper mine group: Financial Times [London], April 4, p. 12.
Southwire Company, 2000, Southwire to close copper refinery and sellaluminum smelter: Carollton, GA, Southwire Company news release, Aprill4, 2 p.
Summo Minerals Corp., 1999a, Assignment of interest in Johnson Camp Mineacquisition: Denver, Summo Minerals Corp. news release, June 9, 1 p.
———1999b, Lisbon Valley Copper Project—IBLA rejects appellants requestfor reconsideration: Denver, Summo Minerals Corp. news release, April 14,1 p.
———1999c, Summo Minerals Corp. announces continued exploration drillingfor Lisbon Valley project, updated—Summo also announced that it had year2000 feasibility/financial study commissioned: Denver, CO, SummoMinerals Corp. news release, November 30, 1 p.
Superior Essex, 1999, Superior Essex consolidates plant operations: FortWayne, IN, Superior Essex press release, August 11, 2 p.
U.S. Department of Labor, 1999, Cobre Mining Company—Hanover, NM;Notice of revised determination and reconsideration: Federal Register, v. 64,no. 146, July 30, p. 41467.
U.S. Environmental Protection Agency, 1999a, Exclusion from the definition ofsolid waste—Hazardous waste management system, identification and listingof hazardous waste: Federal Register, v. 64, no. 236, December 9, p. 68968-68973.
———1999b, 180-day accumulation time for waste water treatment sludgesfrom the metal finishing industry, proposed rule: Federal Register, v. 64, no.20, February 1, p. 4818-4833.
U.S. Mint, 1999a, Mint announces alloy for Golden Dollar coin: Washington,DC, U.S. Mint press release, October 5, 2 p.
———1999b, U.S. Mint releases sample of new dollar coin: Washington, DC,U.S. Mint press release, December 2, 1 p.
———2000a, U.S. Mint and Federal Reserve announce program for directshipment of Golden Dollars to small financial institutions: Washington, DC,U.S. Mint press release, February 24, 2 p.
———2000b, U.S. Mint says public is embracing new “Golden Dollar” coin: Washington, DC, U.S. Mint press release, February 16, 2 p.
Western Mining Corp., 2000, Annual report: Western Mining Corp., 47 p.
GENERAL SOURCES OF INFORMATION
U.S. Geological Survey Publications
Copper. Ch. in Mineral Commodity Summaries, annual.1
Copper. Ch. in United States Mineral Resources, ProfessionalPaper 820, 1973.
Copper. Mineral Industry Surveys, monthly.1
Metal Prices in the United States through 1998.The Nature and Use of Copper Reserve and Resource Data,
Professional Paper 907-F, 1981.
Other
American Bureau of Metal Statistics (ABMS) Non-FerrousMetal Data.
The Availability of Copper in Market Economy Countries, U.S.Bureau of Mines Information Circular 9310, 1992.
Copper. Ch. in Mineral Facts and Problems, U.S. Bureau ofMines Bulletin 675, 1985.
Annual Data 2000—Copper Supply and Consumption: CopperDevelopment Assoc. Inc.
International Copper Study Group, monthly Copper Bulletin.World Bureau of Metal Statistics (WBMS, London), monthly
World Metals Statistics.
1Prior to January 1996, published by the U.S. Bureau of Mines.
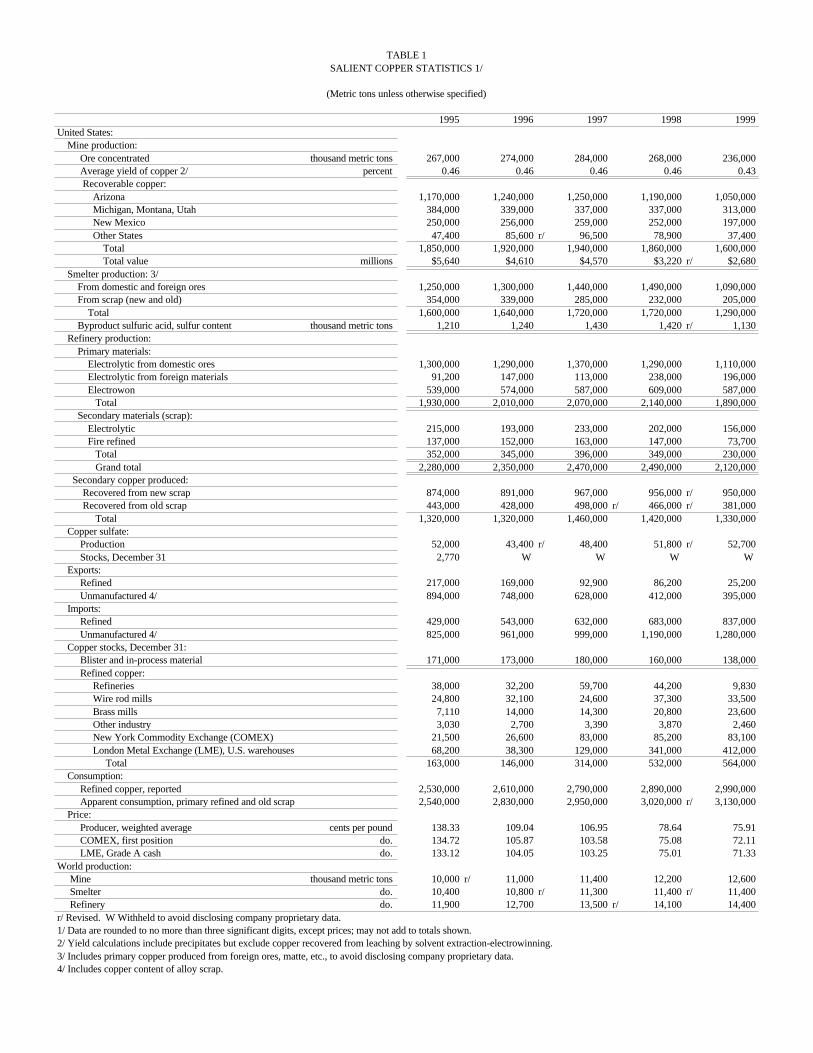
TABLE 1SALIENT COPPER STATISTICS 1/
(Metric tons unless otherwise specified)
1995 1996 1997 1998 1999 United States: Mine production: Ore concentrated thousand metric tons 267,000 274,000 284,000 268,000 236,000 Average yield of copper 2/ percent 0.46 0.46 0.46 0.46 0.43 Recoverable copper: Arizona 1,170,000 1,240,000 1,250,000 1,190,000 1,050,000 Michigan, Montana, Utah 384,000 339,000 337,000 337,000 313,000 New Mexico 250,000 256,000 259,000 252,000 197,000 Other States 47,400 85,600 r/ 96,500 78,900 37,400 Total 1,850,000 1,920,000 1,940,000 1,860,000 1,600,000 Total value millions $5,640 $4,610 $4,570 $3,220 r/ $2,680 Smelter production: 3/ From domestic and foreign ores 1,250,000 1,300,000 1,440,000 1,490,000 1,090,000 From scrap (new and old) 354,000 339,000 285,000 232,000 205,000 Total 1,600,000 1,640,000 1,720,000 1,720,000 1,290,000 Byproduct sulfuric acid, sulfur content thousand metric tons 1,210 1,240 1,430 1,420 r/ 1,130 Refinery production: Primary materials: Electrolytic from domestic ores 1,300,000 1,290,000 1,370,000 1,290,000 1,110,000 Electrolytic from foreign materials 91,200 147,000 113,000 238,000 196,000 Electrowon 539,000 574,000 587,000 609,000 587,000 Total 1,930,000 2,010,000 2,070,000 2,140,000 1,890,000 Secondary materials (scrap): Electrolytic 215,000 193,000 233,000 202,000 156,000 Fire refined 137,000 152,000 163,000 147,000 73,700 Total 352,000 345,000 396,000 349,000 230,000 Grand total 2,280,000 2,350,000 2,470,000 2,490,000 2,120,000 Secondary copper produced: Recovered from new scrap 874,000 891,000 967,000 956,000 r/ 950,000 Recovered from old scrap 443,000 428,000 498,000 r/ 466,000 r/ 381,000 Total 1,320,000 1,320,000 1,460,000 1,420,000 1,330,000 Copper sulfate: Production 52,000 43,400 r/ 48,400 51,800 r/ 52,700 Stocks, December 31 2,770 W W W W Exports: Refined 217,000 169,000 92,900 86,200 25,200 Unmanufactured 4/ 894,000 748,000 628,000 412,000 395,000 Imports: Refined 429,000 543,000 632,000 683,000 837,000 Unmanufactured 4/ 825,000 961,000 999,000 1,190,000 1,280,000 Copper stocks, December 31: Blister and in-process material 171,000 173,000 180,000 160,000 138,000 Refined copper: Refineries 38,000 32,200 59,700 44,200 9,830 Wire rod mills 24,800 32,100 24,600 37,300 33,500 Brass mills 7,110 14,000 14,300 20,800 23,600 Other industry 3,030 2,700 3,390 3,870 2,460 New York Commodity Exchange (COMEX) 21,500 26,600 83,000 85,200 83,100 London Metal Exchange (LME), U.S. warehouses 68,200 38,300 129,000 341,000 412,000 Total 163,000 146,000 314,000 532,000 564,000 Consumption: Refined copper, reported 2,530,000 2,610,000 2,790,000 2,890,000 2,990,000 Apparent consumption, primary refined and old scrap 2,540,000 2,830,000 2,950,000 3,020,000 r/ 3,130,000 Price: Producer, weighted average cents per pound 138.33 109.04 106.95 78.64 75.91 COMEX, first position do. 134.72 105.87 103.58 75.08 72.11 LME, Grade A cash do. 133.12 104.05 103.25 75.01 71.33World production: Mine thousand metric tons 10,000 r/ 11,000 11,400 12,200 12,600 Smelter do. 10,400 10,800 r/ 11,300 11,400 r/ 11,400 Refinery do. 11,900 12,700 13,500 r/ 14,100 14,400r/ Revised. W Withheld to avoid disclosing company proprietary data. 1/ Data are rounded to no more than three significant digits, except prices; may not add to totals shown.2/ Yield calculations include precipitates but exclude copper recovered from leaching by solvent extraction-electrowinning.3/ Includes primary copper produced from foreign ores, matte, etc., to avoid disclosing company proprietary data.4/ Includes copper content of alloy scrap.
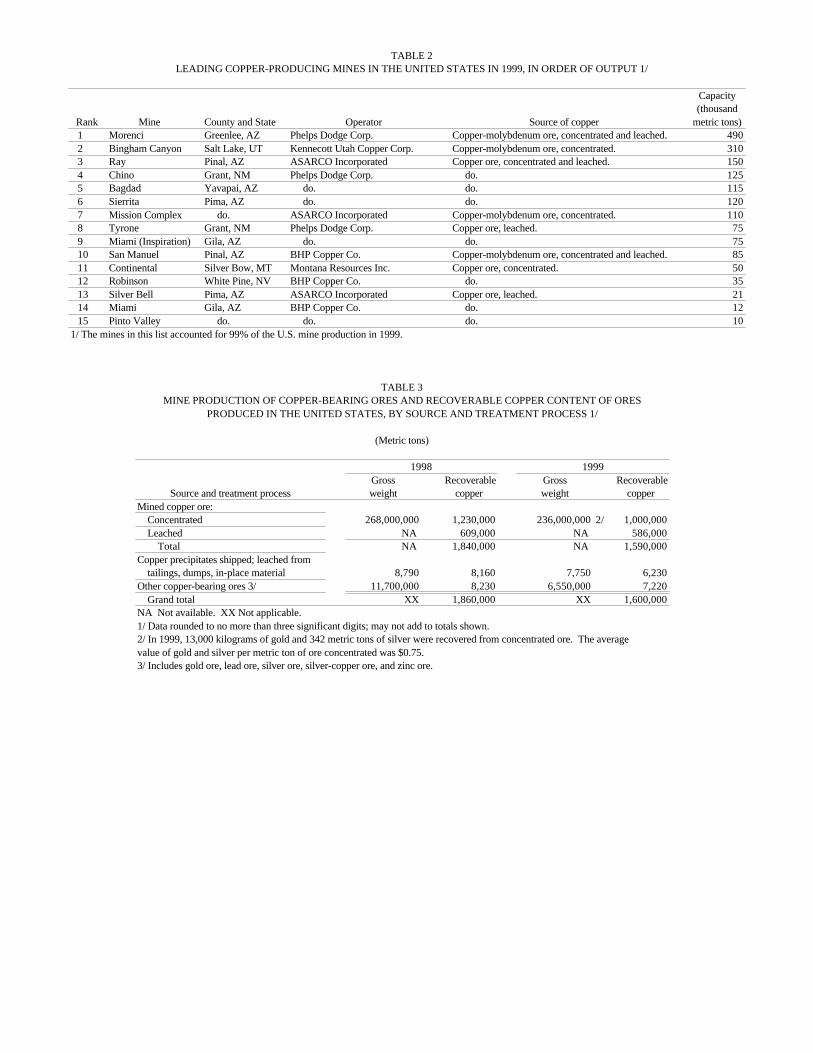
TABLE 2LEADING COPPER-PRODUCING MINES IN THE UNITED STATES IN 1999, IN ORDER OF OUTPUT 1/
Capacity(thousand
Rank Mine County and State Operator Source of copper metric tons)1 Morenci Greenlee, AZ Phelps Dodge Corp. Copper-molybdenum ore, concentrated and leached. 4902 Bingham Canyon Salt Lake, UT Kennecott Utah Copper Corp. Copper-molybdenum ore, concentrated. 3103 Ray Pinal, AZ ASARCO Incorporated Copper ore, concentrated and leached. 1504 Chino Grant, NM Phelps Dodge Corp. do. 1255 Bagdad Yavapai, AZ do. do. 1156 Sierrita Pima, AZ do. do. 1207 Mission Complex do. ASARCO Incorporated Copper-molybdenum ore, concentrated. 1108 Tyrone Grant, NM Phelps Dodge Corp. Copper ore, leached. 759 Miami (Inspiration) Gila, AZ do. do. 7510 San Manuel Pinal, AZ BHP Copper Co. Copper-molybdenum ore, concentrated and leached. 8511 Continental Silver Bow, MT Montana Resources Inc. Copper ore, concentrated. 5012 Robinson White Pine, NV BHP Copper Co. do. 3513 Silver Bell Pima, AZ ASARCO Incorporated Copper ore, leached. 2114 Miami Gila, AZ BHP Copper Co. do. 1215 Pinto Valley do. do. do. 10
1/ The mines in this list accounted for 99% of the U.S. mine production in 1999.
TABLE 3MINE PRODUCTION OF COPPER-BEARING ORES AND RECOVERABLE COPPER CONTENT OF ORES
PRODUCED IN THE UNITED STATES, BY SOURCE AND TREATMENT PROCESS 1/
(Metric tons)
1998 1999Gross Recoverable Gross Recoverable
Source and treatment process weight copper weight copperMined copper ore: Concentrated 268,000,000 1,230,000 236,000,000 2/ 1,000,000 Leached NA 609,000 NA 586,000 Total NA 1,840,000 NA 1,590,000Copper precipitates shipped; leached from tailings, dumps, in-place material 8,790 8,160 7,750 6,230Other copper-bearing ores 3/ 11,700,000 8,230 6,550,000 7,220 Grand total XX 1,860,000 XX 1,600,000NA Not available. XX Not applicable. 1/ Data rounded to no more than three significant digits; may not add to totals shown.2/ In 1999, 13,000 kilograms of gold and 342 metric tons of silver were recovered from concentrated ore. The average value of gold and silver per metric ton of ore concentrated was $0.75.3/ Includes gold ore, lead ore, silver ore, silver-copper ore, and zinc ore.
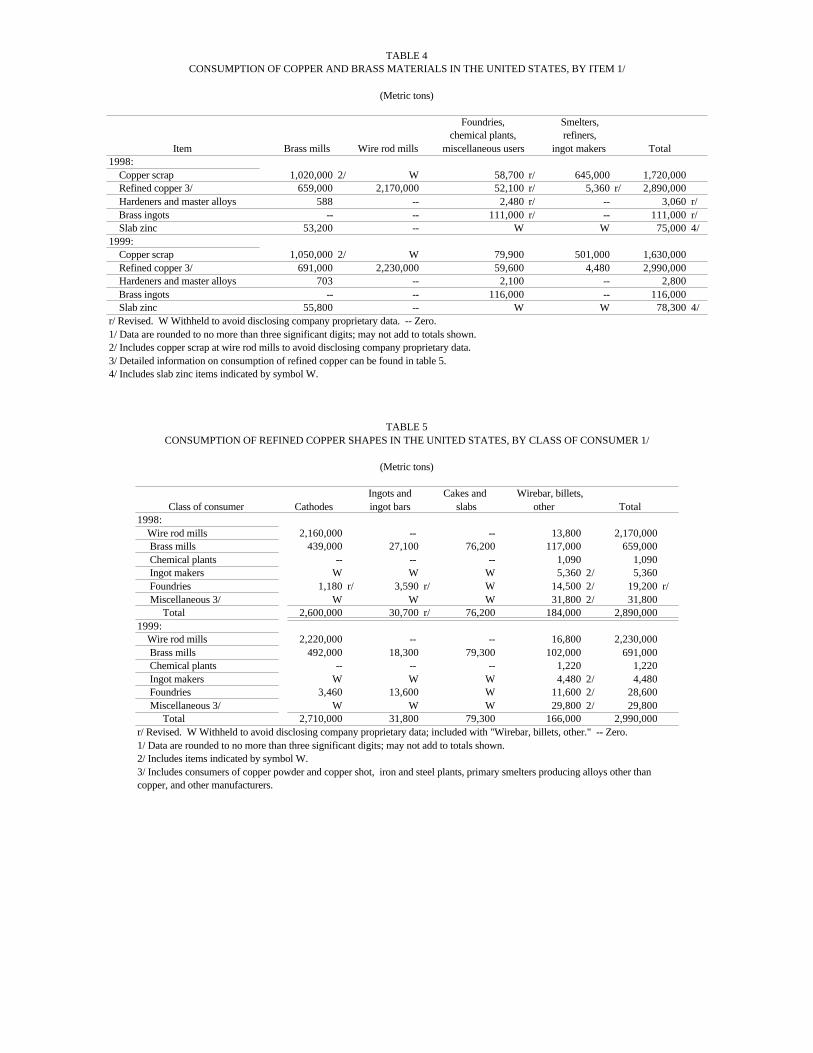
TABLE 4CONSUMPTION OF COPPER AND BRASS MATERIALS IN THE UNITED STATES, BY ITEM 1/
(Metric tons)
Foundries, Smelters,chemical plants, refiners,
Item Brass mills Wire rod mills miscellaneous users ingot makers Total1998: Copper scrap 1,020,000 2/ W 58,700 r/ 645,000 1,720,000 Refined copper 3/ 659,000 2,170,000 52,100 r/ 5,360 r/ 2,890,000 Hardeners and master alloys 588 -- 2,480 r/ -- 3,060 r/ Brass ingots -- -- 111,000 r/ -- 111,000 r/ Slab zinc 53,200 -- W W 75,000 4/1999: Copper scrap 1,050,000 2/ W 79,900 501,000 1,630,000 Refined copper 3/ 691,000 2,230,000 59,600 4,480 2,990,000 Hardeners and master alloys 703 -- 2,100 -- 2,800 Brass ingots -- -- 116,000 -- 116,000 Slab zinc 55,800 -- W W 78,300 4/r/ Revised. W Withheld to avoid disclosing company proprietary data. -- Zero.1/ Data are rounded to no more than three significant digits; may not add to totals shown.2/ Includes copper scrap at wire rod mills to avoid disclosing company proprietary data.3/ Detailed information on consumption of refined copper can be found in table 5.4/ Includes slab zinc items indicated by symbol W.
TABLE 5CONSUMPTION OF REFINED COPPER SHAPES IN THE UNITED STATES, BY CLASS OF CONSUMER 1/
(Metric tons)
Ingots and Cakes and Wirebar, billets,Class of consumer Cathodes ingot bars slabs other Total
1998: Wire rod mills 2,160,000 -- -- 13,800 2,170,000 Brass mills 439,000 27,100 76,200 117,000 659,000 Chemical plants -- -- -- 1,090 1,090 Ingot makers W W W 5,360 2/ 5,360 Foundries 1,180 r/ 3,590 r/ W 14,500 2/ 19,200 r/ Miscellaneous 3/ W W W 31,800 2/ 31,800 Total 2,600,000 30,700 r/ 76,200 184,000 2,890,0001999: Wire rod mills 2,220,000 -- -- 16,800 2,230,000 Brass mills 492,000 18,300 79,300 102,000 691,000 Chemical plants -- -- -- 1,220 1,220 Ingot makers W W W 4,480 2/ 4,480 Foundries 3,460 13,600 W 11,600 2/ 28,600 Miscellaneous 3/ W W W 29,800 2/ 29,800 Total 2,710,000 31,800 79,300 166,000 2,990,000r/ Revised. W Withheld to avoid disclosing company proprietary data; included with "Wirebar, billets, other." -- Zero.1/ Data are rounded to no more than three significant digits; may not add to totals shown.2/ Includes items indicated by symbol W.3/ Includes consumers of copper powder and copper shot, iron and steel plants, primary smelters producing alloys other thancopper, and other manufacturers.
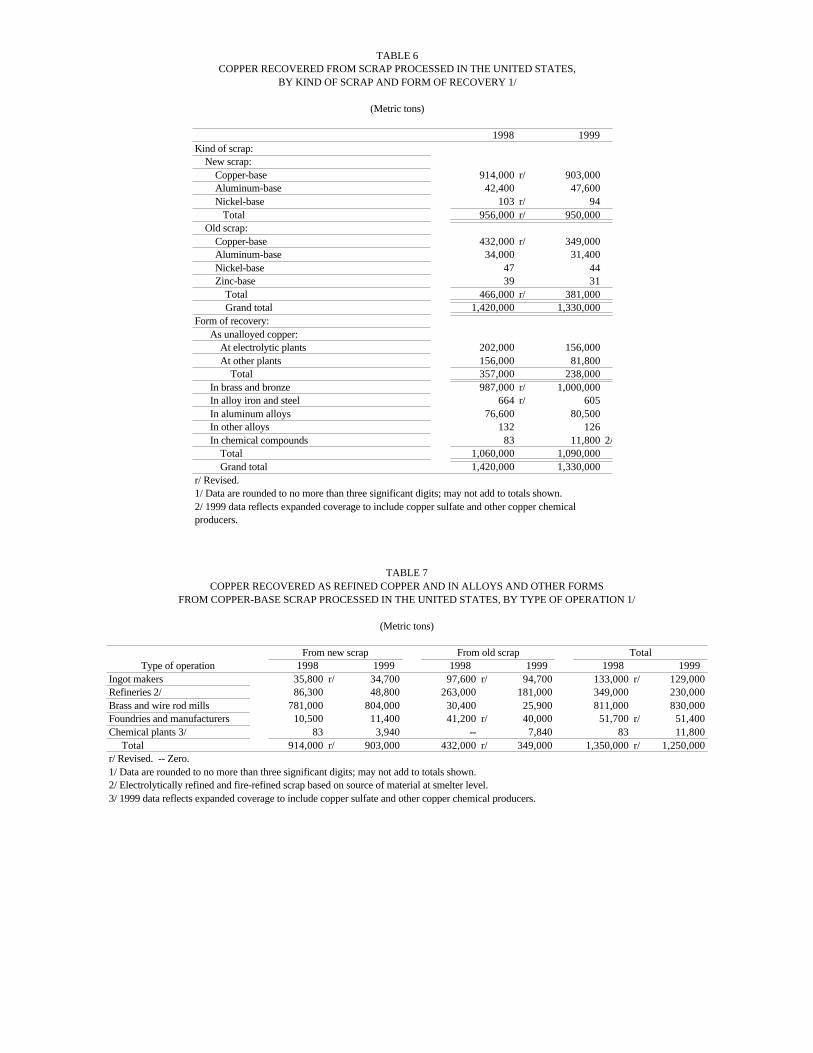
TABLE 6COPPER RECOVERED FROM SCRAP PROCESSED IN THE UNITED STATES,
BY KIND OF SCRAP AND FORM OF RECOVERY 1/
(Metric tons)
1998 1999 Kind of scrap: New scrap: Copper-base 914,000 r/ 903,000 Aluminum-base 42,400 47,600 Nickel-base 103 r/ 94 Total 956,000 r/ 950,000 Old scrap: Copper-base 432,000 r/ 349,000 Aluminum-base 34,000 31,400 Nickel-base 47 44 Zinc-base 39 31 Total 466,000 r/ 381,000 Grand total 1,420,000 1,330,000Form of recovery: As unalloyed copper: At electrolytic plants 202,000 156,000 At other plants 156,000 81,800 Total 357,000 238,000 In brass and bronze 987,000 r/ 1,000,000 In alloy iron and steel 664 r/ 605 In aluminum alloys 76,600 80,500 In other alloys 132 126 In chemical compounds 83 11,800 2/ Total 1,060,000 1,090,000 Grand total 1,420,000 1,330,000r/ Revised. 1/ Data are rounded to no more than three significant digits; may not add to totals shown. 2/ 1999 data reflects expanded coverage to include copper sulfate and other copper chemical producers.
TABLE 7COPPER RECOVERED AS REFINED COPPER AND IN ALLOYS AND OTHER FORMS
FROM COPPER-BASE SCRAP PROCESSED IN THE UNITED STATES, BY TYPE OF OPERATION 1/
(Metric tons)
From new scrap From old scrap TotalType of operation 1998 1999 1998 1999 1998 1999
Ingot makers 35,800 r/ 34,700 97,600 r/ 94,700 133,000 r/ 129,000Refineries 2/ 86,300 48,800 263,000 181,000 349,000 230,000Brass and wire rod mills 781,000 804,000 30,400 25,900 811,000 830,000Foundries and manufacturers 10,500 11,400 41,200 r/ 40,000 51,700 r/ 51,400Chemical plants 3/ 83 3,940 -- 7,840 83 11,800 Total 914,000 r/ 903,000 432,000 r/ 349,000 1,350,000 r/ 1,250,000r/ Revised. -- Zero.1/ Data are rounded to no more than three significant digits; may not add to totals shown.2/ Electrolytically refined and fire-refined scrap based on source of material at smelter level.3/ 1999 data reflects expanded coverage to include copper sulfate and other copper chemical producers.
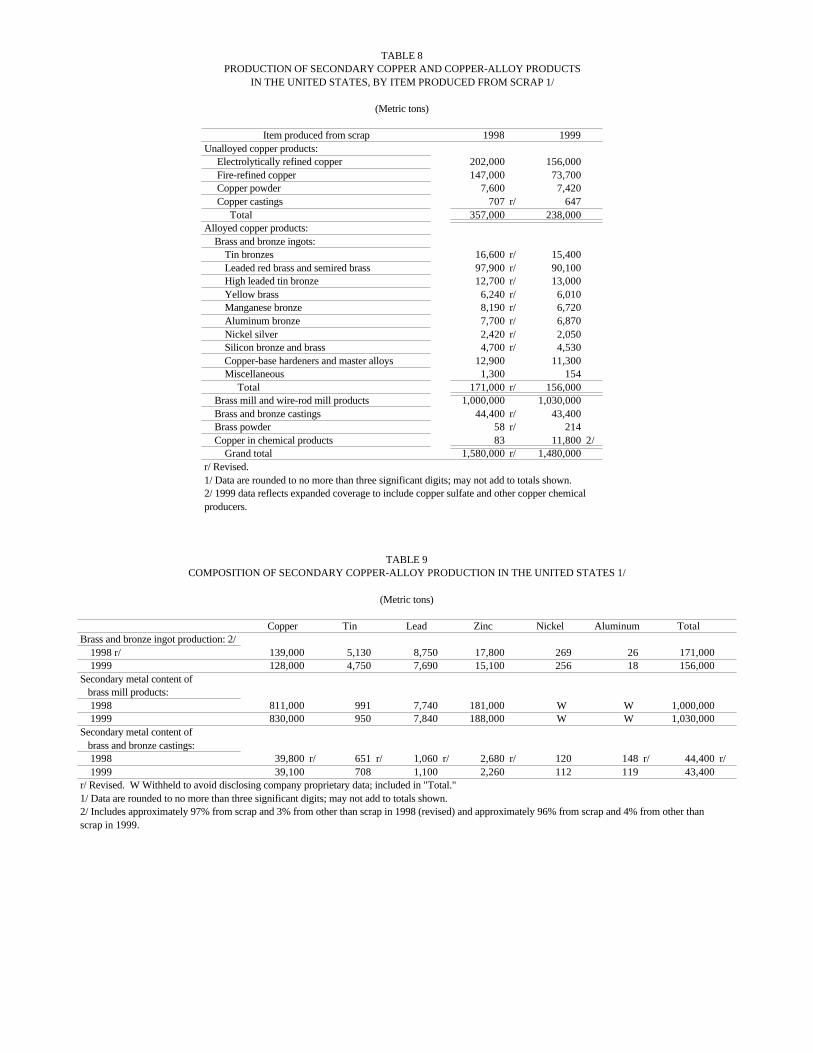
TABLE 8PRODUCTION OF SECONDARY COPPER AND COPPER-ALLOY PRODUCTS
IN THE UNITED STATES, BY ITEM PRODUCED FROM SCRAP 1/
(Metric tons)
Item produced from scrap 1998 1999 Unalloyed copper products: Electrolytically refined copper 202,000 156,000 Fire-refined copper 147,000 73,700 Copper powder 7,600 7,420 Copper castings 707 r/ 647 Total 357,000 238,000Alloyed copper products: Brass and bronze ingots: Tin bronzes 16,600 r/ 15,400 Leaded red brass and semired brass 97,900 r/ 90,100 High leaded tin bronze 12,700 r/ 13,000 Yellow brass 6,240 r/ 6,010 Manganese bronze 8,190 r/ 6,720 Aluminum bronze 7,700 r/ 6,870 Nickel silver 2,420 r/ 2,050 Silicon bronze and brass 4,700 r/ 4,530 Copper-base hardeners and master alloys 12,900 11,300 Miscellaneous 1,300 154 Total 171,000 r/ 156,000 Brass mill and wire-rod mill products 1,000,000 1,030,000 Brass and bronze castings 44,400 r/ 43,400 Brass powder 58 r/ 214 Copper in chemical products 83 11,800 2/ Grand total 1,580,000 r/ 1,480,000r/ Revised.1/ Data are rounded to no more than three significant digits; may not add to totals shown. 2/ 1999 data reflects expanded coverage to include copper sulfate and other copper chemicalproducers.
TABLE 9COMPOSITION OF SECONDARY COPPER-ALLOY PRODUCTION IN THE UNITED STATES 1/
(Metric tons)
Copper Tin Lead Zinc Nickel Aluminum TotalBrass and bronze ingot production: 2/ 1998 r/ 139,000 5,130 8,750 17,800 269 26 171,000 1999 128,000 4,750 7,690 15,100 256 18 156,000Secondary metal content of brass mill products: 1998 811,000 991 7,740 181,000 W W 1,000,000 1999 830,000 950 7,840 188,000 W W 1,030,000Secondary metal content of brass and bronze castings: 1998 39,800 r/ 651 r/ 1,060 r/ 2,680 r/ 120 148 r/ 44,400 r/ 1999 39,100 708 1,100 2,260 112 119 43,400r/ Revised. W Withheld to avoid disclosing company proprietary data; included in "Total."1/ Data are rounded to no more than three significant digits; may not add to totals shown.2/ Includes approximately 97% from scrap and 3% from other than scrap in 1998 (revised) and approximately 96% from scrap and 4% from other than scrap in 1999.
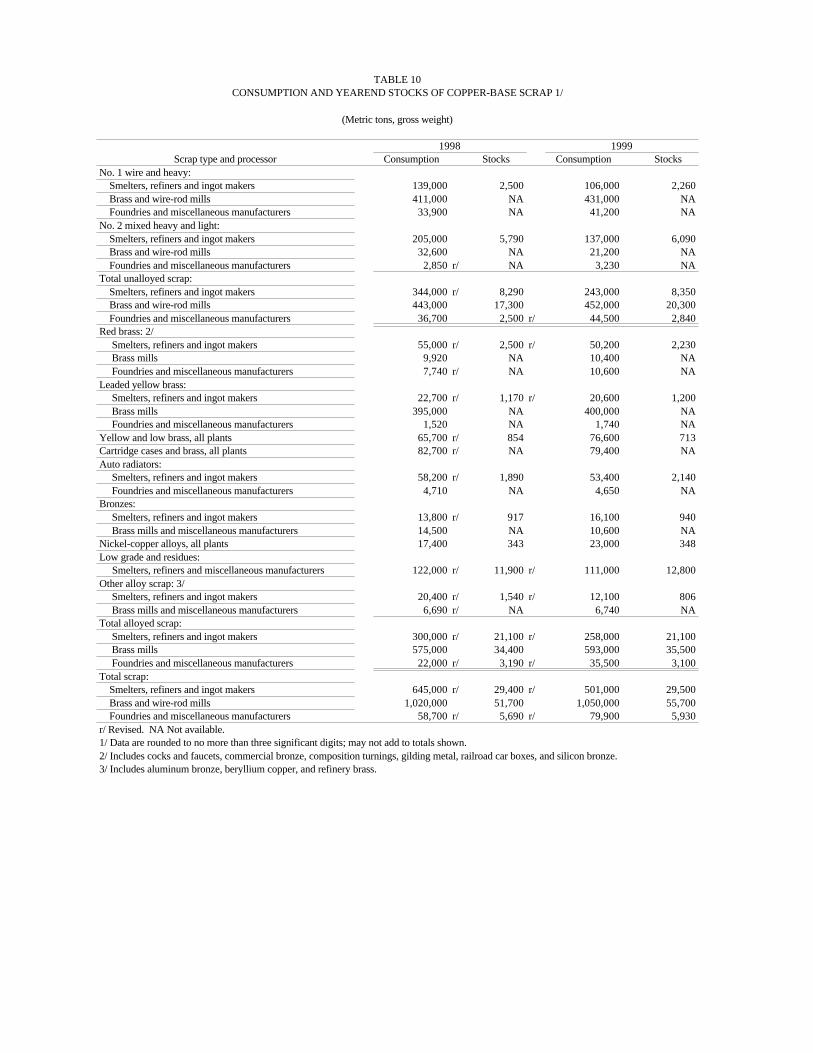
TABLE 10CONSUMPTION AND YEAREND STOCKS OF COPPER-BASE SCRAP 1/
(Metric tons, gross weight)
1998 1999Scrap type and processor Consumption Stocks Consumption Stocks
No. 1 wire and heavy: Smelters, refiners and ingot makers 139,000 2,500 106,000 2,260 Brass and wire-rod mills 411,000 NA 431,000 NA Foundries and miscellaneous manufacturers 33,900 NA 41,200 NA No. 2 mixed heavy and light: Smelters, refiners and ingot makers 205,000 5,790 137,000 6,090 Brass and wire-rod mills 32,600 NA 21,200 NA Foundries and miscellaneous manufacturers 2,850 r/ NA 3,230 NA Total unalloyed scrap: Smelters, refiners and ingot makers 344,000 r/ 8,290 243,000 8,350 Brass and wire-rod mills 443,000 17,300 452,000 20,300 Foundries and miscellaneous manufacturers 36,700 2,500 r/ 44,500 2,840Red brass: 2/ Smelters, refiners and ingot makers 55,000 r/ 2,500 r/ 50,200 2,230 Brass mills 9,920 NA 10,400 NA Foundries and miscellaneous manufacturers 7,740 r/ NA 10,600 NA Leaded yellow brass: Smelters, refiners and ingot makers 22,700 r/ 1,170 r/ 20,600 1,200 Brass mills 395,000 NA 400,000 NA Foundries and miscellaneous manufacturers 1,520 NA 1,740 NA Yellow and low brass, all plants 65,700 r/ 854 76,600 713Cartridge cases and brass, all plants 82,700 r/ NA 79,400 NA Auto radiators: Smelters, refiners and ingot makers 58,200 r/ 1,890 53,400 2,140 Foundries and miscellaneous manufacturers 4,710 NA 4,650 NA Bronzes: Smelters, refiners and ingot makers 13,800 r/ 917 16,100 940 Brass mills and miscellaneous manufacturers 14,500 NA 10,600 NA Nickel-copper alloys, all plants 17,400 343 23,000 348Low grade and residues: Smelters, refiners and miscellaneous manufacturers 122,000 r/ 11,900 r/ 111,000 12,800Other alloy scrap: 3/ Smelters, refiners and ingot makers 20,400 r/ 1,540 r/ 12,100 806 Brass mills and miscellaneous manufacturers 6,690 r/ NA 6,740 NA Total alloyed scrap: Smelters, refiners and ingot makers 300,000 r/ 21,100 r/ 258,000 21,100 Brass mills 575,000 34,400 593,000 35,500 Foundries and miscellaneous manufacturers 22,000 r/ 3,190 r/ 35,500 3,100Total scrap: Smelters, refiners and ingot makers 645,000 r/ 29,400 r/ 501,000 29,500 Brass and wire-rod mills 1,020,000 51,700 1,050,000 55,700 Foundries and miscellaneous manufacturers 58,700 r/ 5,690 r/ 79,900 5,930r/ Revised. NA Not available.1/ Data are rounded to no more than three significant digits; may not add to totals shown.2/ Includes cocks and faucets, commercial bronze, composition turnings, gilding metal, railroad car boxes, and silicon bronze.3/ Includes aluminum bronze, beryllium copper, and refinery brass.
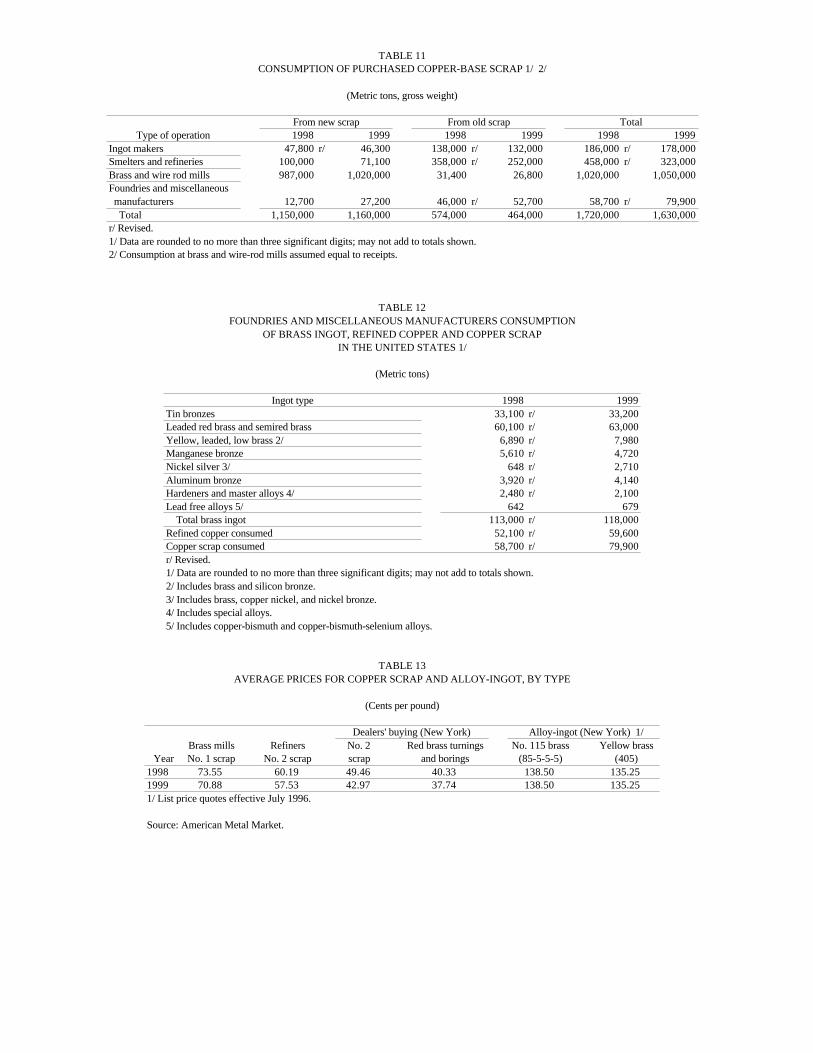
TABLE 11CONSUMPTION OF PURCHASED COPPER-BASE SCRAP 1/ 2/
(Metric tons, gross weight)
From new scrap From old scrap TotalType of operation 1998 1999 1998 1999 1998 1999
Ingot makers 47,800 r/ 46,300 138,000 r/ 132,000 186,000 r/ 178,000Smelters and refineries 100,000 71,100 358,000 r/ 252,000 458,000 r/ 323,000Brass and wire rod mills 987,000 1,020,000 31,400 26,800 1,020,000 1,050,000Foundries and miscellaneous manufacturers 12,700 27,200 46,000 r/ 52,700 58,700 r/ 79,900 Total 1,150,000 1,160,000 574,000 464,000 1,720,000 1,630,000r/ Revised.1/ Data are rounded to no more than three significant digits; may not add to totals shown.2/ Consumption at brass and wire-rod mills assumed equal to receipts.
TABLE 12FOUNDRIES AND MISCELLANEOUS MANUFACTURERS CONSUMPTION
OF BRASS INGOT, REFINED COPPER AND COPPER SCRAPIN THE UNITED STATES 1/
(Metric tons)
Ingot type 1998 1999 Tin bronzes 33,100 r/ 33,200Leaded red brass and semired brass 60,100 r/ 63,000Yellow, leaded, low brass 2/ 6,890 r/ 7,980Manganese bronze 5,610 r/ 4,720Nickel silver 3/ 648 r/ 2,710Aluminum bronze 3,920 r/ 4,140Hardeners and master alloys 4/ 2,480 r/ 2,100Lead free alloys 5/ 642 679 Total brass ingot 113,000 r/ 118,000Refined copper consumed 52,100 r/ 59,600Copper scrap consumed 58,700 r/ 79,900r/ Revised.1/ Data are rounded to no more than three significant digits; may not add to totals shown.2/ Includes brass and silicon bronze.3/ Includes brass, copper nickel, and nickel bronze.4/ Includes special alloys.5/ Includes copper-bismuth and copper-bismuth-selenium alloys.
TABLE 13AVERAGE PRICES FOR COPPER SCRAP AND ALLOY-INGOT, BY TYPE
(Cents per pound)
Dealers' buying (New York) Alloy-ingot (New York) 1/Brass mills Refiners No. 2 Red brass turnings No. 115 brass Yellow brass
Year No. 1 scrap No. 2 scrap scrap and borings (85-5-5-5) (405)1998 73.55 60.19 49.46 40.33 138.50 135.251999 70.88 57.53 42.97 37.74 138.50 135.251/ List price quotes effective July 1996.
Source: American Metal Market.
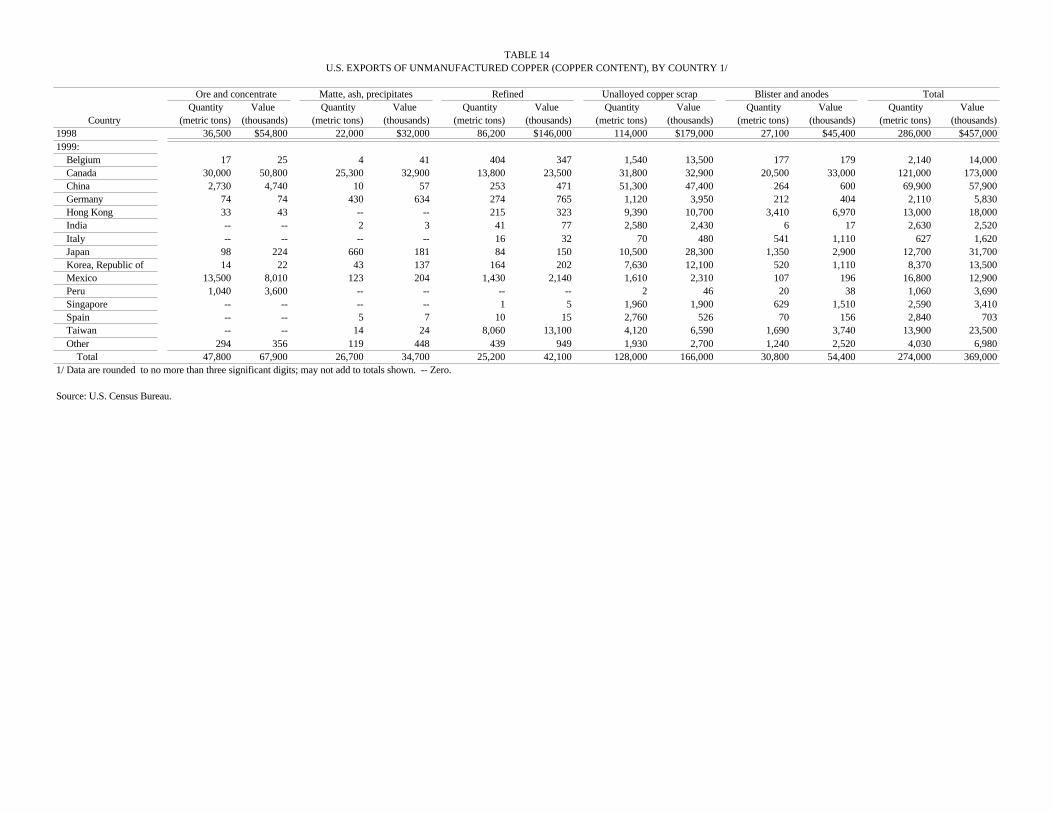
TABLE 14U.S. EXPORTS OF UNMANUFACTURED COPPER (COPPER CONTENT), BY COUNTRY 1/
Ore and concentrate Matte, ash, precipitates Refined Unalloyed copper scrap Blister and anodes TotalQuantity Value Quantity Value Quantity Value Quantity Value Quantity Value Quantity Value
Country (metric tons) (thousands) (metric tons) (thousands) (metric tons) (thousands) (metric tons) (thousands) (metric tons) (thousands) (metric tons) (thousands) 1998 36,500 $54,800 22,000 $32,000 86,200 $146,000 114,000 $179,000 27,100 $45,400 286,000 $457,0001999: Belgium 17 25 4 41 404 347 1,540 13,500 177 179 2,140 14,000 Canada 30,000 50,800 25,300 32,900 13,800 23,500 31,800 32,900 20,500 33,000 121,000 173,000 China 2,730 4,740 10 57 253 471 51,300 47,400 264 600 69,900 57,900 Germany 74 74 430 634 274 765 1,120 3,950 212 404 2,110 5,830 Hong Kong 33 43 -- -- 215 323 9,390 10,700 3,410 6,970 13,000 18,000 India -- -- 2 3 41 77 2,580 2,430 6 17 2,630 2,520 Italy -- -- -- -- 16 32 70 480 541 1,110 627 1,620 Japan 98 224 660 181 84 150 10,500 28,300 1,350 2,900 12,700 31,700 Korea, Republic of 14 22 43 137 164 202 7,630 12,100 520 1,110 8,370 13,500 Mexico 13,500 8,010 123 204 1,430 2,140 1,610 2,310 107 196 16,800 12,900 Peru 1,040 3,600 -- -- -- -- 2 46 20 38 1,060 3,690 Singapore -- -- -- -- 1 5 1,960 1,900 629 1,510 2,590 3,410 Spain -- -- 5 7 10 15 2,760 526 70 156 2,840 703 Taiwan -- -- 14 24 8,060 13,100 4,120 6,590 1,690 3,740 13,900 23,500 Other 294 356 119 448 439 949 1,930 2,700 1,240 2,520 4,030 6,980 Total 47,800 67,900 26,700 34,700 25,200 42,100 128,000 166,000 30,800 54,400 274,000 369,0001/ Data are rounded to no more than three significant digits; may not add to totals shown. -- Zero.
Source: U.S. Census Bureau.

TABLE 15U.S EXPORTS OF COPPER SEMIMANUFACTURES, BY COUNTRY 1/
Pipes and tubing Plates, sheets, foil, bars Bare wire, including wire rod 2/ Wire and cable, stranded Copper sulfateQuantity Value Quantity Value Quantity Value Quantity Value Quantity Value
Country (metric tons) (thousands) (metric tons) (thousands) (metric tons) (thousands) (metric tons) (thousands) (metric tons) (thousands) 1998 27,400 $86,900 38,300 $157,000 49,700 $128,000 18,600 $108,000 1,340 r/ $1,280 r/1999: Australia 83 418 17 76 2 27 76 618 32 51 Bahamas, The 8 25 4 10 84 269 344 2,360 -- -- Belgium 102 622 456 2,300 -- -- 176 1,620 -- -- Brazil 137 677 35 213 37 920 403 3,380 -- -- Canada 9,660 27,500 20,300 71,700 14,100 33,100 4,430 10,100 546 477 China 321 1,780 735 2,520 8 176 185 633 119 95 Costa Rica 8 33 3,100 8,250 246 427 50 267 -- -- Denmark -- -- 8 37 24 226 17 196 -- -- Dominican Republic 8 31 7 26 1,570 3,010 65 269 -- -- Egypt 273 953 (3/) 4 59 269 65 272 8 7 El Salvador -- -- 307 1,190 549 1,030 314 1,920 -- -- Germany 48 187 4,590 17,100 16 424 291 4,290 -- -- Guatemala 8 49 21 157 17 55 76 385 80 65 Honduras 14 57 -- -- 6 16 50 215 66 54 Hong Kong 124 145 866 5,210 181 1,240 105 1,200 -- -- Indonesia -- -- (3/) 3 1 8 4 56 -- -- Italy 510 1,640 1,960 6,500 34 94 17 495 -- -- Japan 52 200 2,580 11,400 57 361 194 3,620 -- -- Korea, Republic of 126 605 1,300 6,060 92 686 158 1,370 22 18 Mexico 12,200 32,400 2,900 11,100 26,000 64,400 14,400 36,900 50 56 Netherlands 525 3,170 38 351 5 102 16 285 -- -- Saudi Arabia 212 721 31 125 216 566 321 1,310 -- -- Singapore 15 76 112 774 35 270 542 2,170 84 77 Sweden 1 3 6 164 64 429 6 308 -- -- Taiwan 27 171 1,660 7,150 171 914 13 290 -- -- Thailand 230 1,050 70 227 2 46 387 2,030 -- -- Trinidad and Tobago -- -- 2 6 1,280 2,340 107 288 -- -- United Kingdom 282 1,350 385 1,650 81 573 202 3,000 -- -- Venezuela 141 535 31 99 55 134 383 2,470 -- -- Other 1,010 4,460 635 4,970 1,260 5,940 1,600 12,200 73 75 Total 26,100 78,900 42,200 159,000 46,300 118,000 25,000 94,500 1,080 973r/ Revised. -- Zero.1/ Data are rounded to no more than three significant digits; may not add to totals shown.2/ Total exports of wire rod in 1998 were 31,000 tons valued at $64,700,000 and in 1999 were 28,400 tons valued at $58,800,000.3/ Less than 1/2 unit.
Source: U.S. Census Bureau.
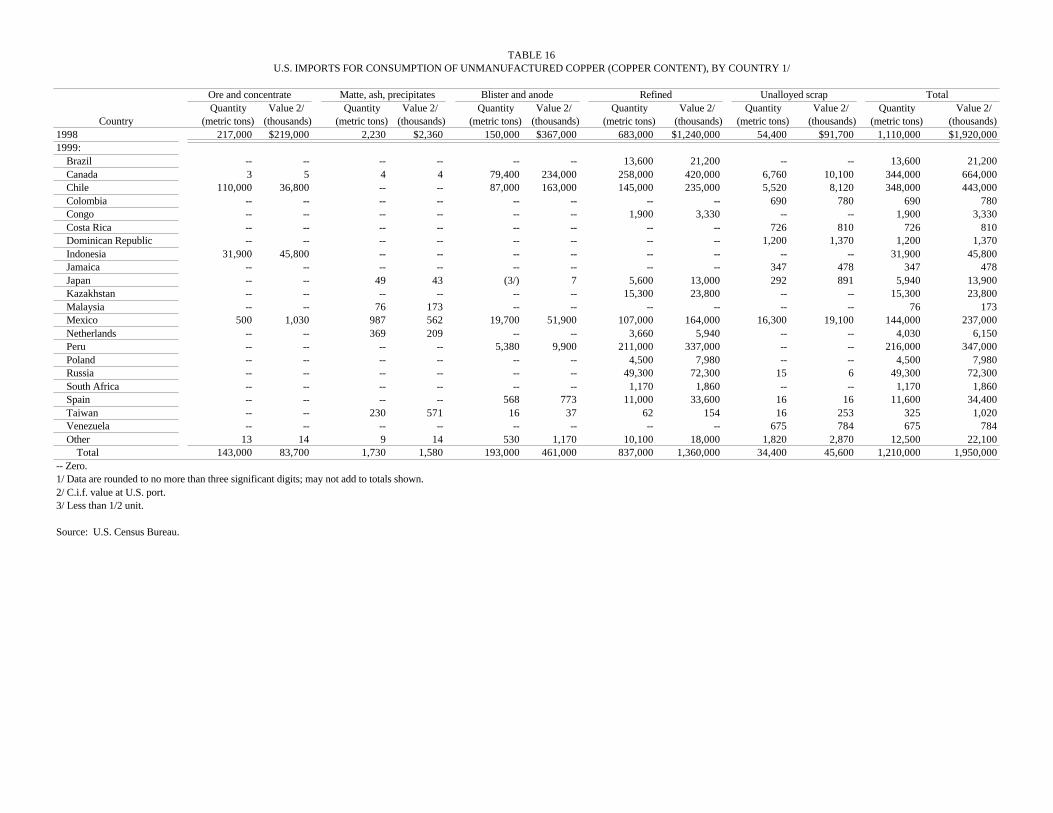
TABLE 16U.S. IMPORTS FOR CONSUMPTION OF UNMANUFACTURED COPPER (COPPER CONTENT), BY COUNTRY 1/
Ore and concentrate Matte, ash, precipitates Blister and anode Refined Unalloyed scrap TotalQuantity Value 2/ Quantity Value 2/ Quantity Value 2/ Quantity Value 2/ Quantity Value 2/ Quantity Value 2/
Country (metric tons) (thousands) (metric tons) (thousands) (metric tons) (thousands) (metric tons) (thousands) (metric tons) (thousands) (metric tons) (thousands) 1998 217,000 $219,000 2,230 $2,360 150,000 $367,000 683,000 $1,240,000 54,400 $91,700 1,110,000 $1,920,0001999: Brazil -- -- -- -- -- -- 13,600 21,200 -- -- 13,600 21,200 Canada 3 5 4 4 79,400 234,000 258,000 420,000 6,760 10,100 344,000 664,000 Chile 110,000 36,800 -- -- 87,000 163,000 145,000 235,000 5,520 8,120 348,000 443,000 Colombia -- -- -- -- -- -- -- -- 690 780 690 780 Congo -- -- -- -- -- -- 1,900 3,330 -- -- 1,900 3,330 Costa Rica -- -- -- -- -- -- -- -- 726 810 726 810 Dominican Republic -- -- -- -- -- -- -- -- 1,200 1,370 1,200 1,370 Indonesia 31,900 45,800 -- -- -- -- -- -- -- -- 31,900 45,800 Jamaica -- -- -- -- -- -- -- -- 347 478 347 478 Japan -- -- 49 43 (3/) 7 5,600 13,000 292 891 5,940 13,900 Kazakhstan -- -- -- -- -- -- 15,300 23,800 -- -- 15,300 23,800 Malaysia -- -- 76 173 -- -- -- -- -- -- 76 173 Mexico 500 1,030 987 562 19,700 51,900 107,000 164,000 16,300 19,100 144,000 237,000 Netherlands -- -- 369 209 -- -- 3,660 5,940 -- -- 4,030 6,150 Peru -- -- -- -- 5,380 9,900 211,000 337,000 -- -- 216,000 347,000 Poland -- -- -- -- -- -- 4,500 7,980 -- -- 4,500 7,980 Russia -- -- -- -- -- -- 49,300 72,300 15 6 49,300 72,300 South Africa -- -- -- -- -- -- 1,170 1,860 -- -- 1,170 1,860 Spain -- -- -- -- 568 773 11,000 33,600 16 16 11,600 34,400 Taiwan -- -- 230 571 16 37 62 154 16 253 325 1,020 Venezuela -- -- -- -- -- -- -- -- 675 784 675 784 Other 13 14 9 14 530 1,170 10,100 18,000 1,820 2,870 12,500 22,100 Total 143,000 83,700 1,730 1,580 193,000 461,000 837,000 1,360,000 34,400 45,600 1,210,000 1,950,000-- Zero.1/ Data are rounded to no more than three significant digits; may not add to totals shown.2/ C.i.f. value at U.S. port.3/ Less than 1/2 unit.
Source: U.S. Census Bureau.
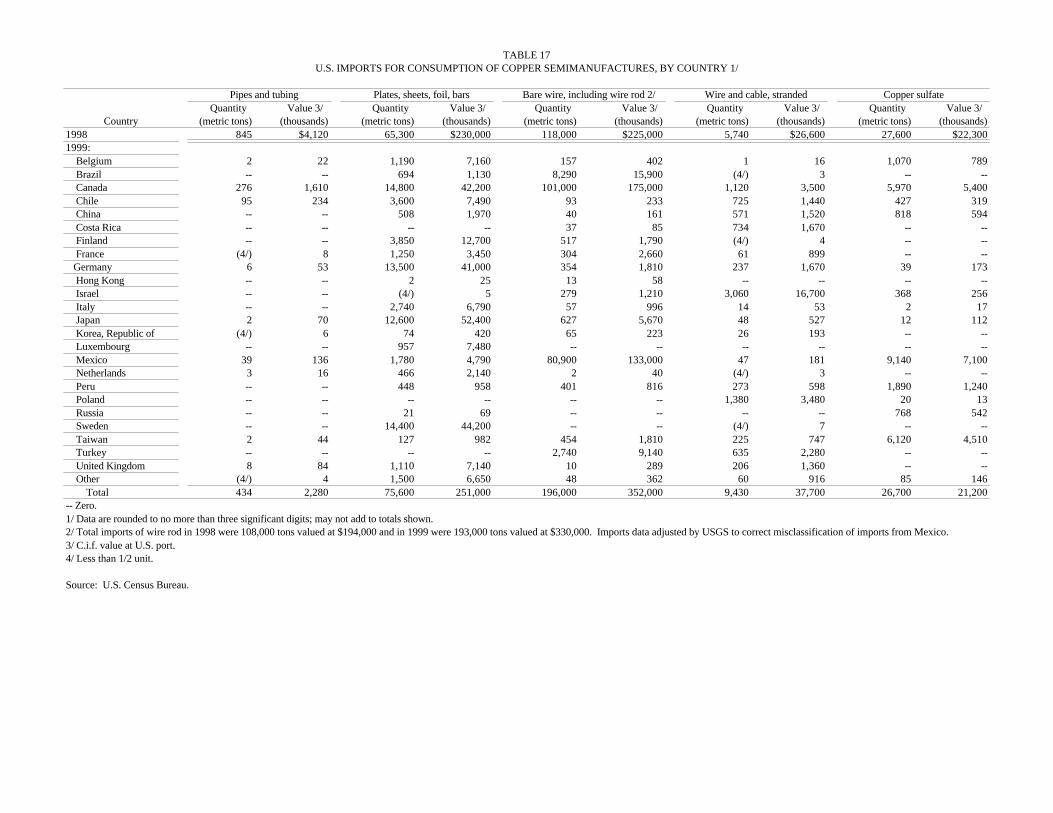
TABLE 17U.S. IMPORTS FOR CONSUMPTION OF COPPER SEMIMANUFACTURES, BY COUNTRY 1/
Pipes and tubing Plates, sheets, foil, bars Bare wire, including wire rod 2/ Wire and cable, stranded Copper sulfateQuantity Value 3/ Quantity Value 3/ Quantity Value 3/ Quantity Value 3/ Quantity Value 3/
Country (metric tons) (thousands) (metric tons) (thousands) (metric tons) (thousands) (metric tons) (thousands) (metric tons) (thousands) 1998 845 $4,120 65,300 $230,000 118,000 $225,000 5,740 $26,600 27,600 $22,3001999: Belgium 2 22 1,190 7,160 157 402 1 16 1,070 789 Brazil -- -- 694 1,130 8,290 15,900 (4/) 3 -- -- Canada 276 1,610 14,800 42,200 101,000 175,000 1,120 3,500 5,970 5,400 Chile 95 234 3,600 7,490 93 233 725 1,440 427 319 China -- -- 508 1,970 40 161 571 1,520 818 594 Costa Rica -- -- -- -- 37 85 734 1,670 -- -- Finland -- -- 3,850 12,700 517 1,790 (4/) 4 -- -- France (4/) 8 1,250 3,450 304 2,660 61 899 -- -- Germany 6 53 13,500 41,000 354 1,810 237 1,670 39 173 Hong Kong -- -- 2 25 13 58 -- -- -- -- Israel -- -- (4/) 5 279 1,210 3,060 16,700 368 256 Italy -- -- 2,740 6,790 57 996 14 53 2 17 Japan 2 70 12,600 52,400 627 5,670 48 527 12 112 Korea, Republic of (4/) 6 74 420 65 223 26 193 -- -- Luxembourg -- -- 957 7,480 -- -- -- -- -- -- Mexico 39 136 1,780 4,790 80,900 133,000 47 181 9,140 7,100 Netherlands 3 16 466 2,140 2 40 (4/) 3 -- -- Peru -- -- 448 958 401 816 273 598 1,890 1,240 Poland -- -- -- -- -- -- 1,380 3,480 20 13 Russia -- -- 21 69 -- -- -- -- 768 542 Sweden -- -- 14,400 44,200 -- -- (4/) 7 -- -- Taiwan 2 44 127 982 454 1,810 225 747 6,120 4,510 Turkey -- -- -- -- 2,740 9,140 635 2,280 -- -- United Kingdom 8 84 1,110 7,140 10 289 206 1,360 -- -- Other (4/) 4 1,500 6,650 48 362 60 916 85 146 Total 434 2,280 75,600 251,000 196,000 352,000 9,430 37,700 26,700 21,200-- Zero.1/ Data are rounded to no more than three significant digits; may not add to totals shown.2/ Total imports of wire rod in 1998 were 108,000 tons valued at $194,000 and in 1999 were 193,000 tons valued at $330,000. Imports data adjusted by USGS to correct misclassification of imports from Mexico.3/ C.i.f. value at U.S. port.4/ Less than 1/2 unit.
Source: U.S. Census Bureau.
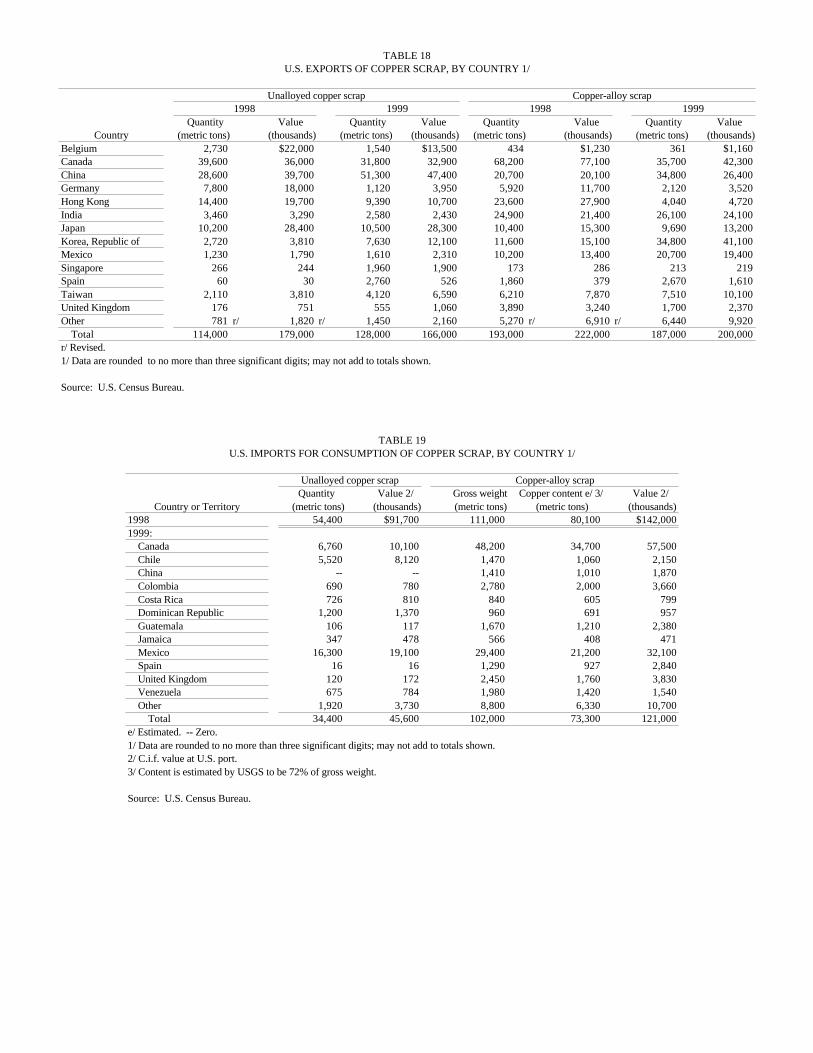
TABLE 18U.S. EXPORTS OF COPPER SCRAP, BY COUNTRY 1/
Unalloyed copper scrap Copper-alloy scrap
1998 1999 1998 1999 Quantity Value Quantity Value Quantity Value Quantity Value
Country (metric tons) (thousands) (metric tons) (thousands) (metric tons) (thousands) (metric tons) (thousands)Belgium 2,730 $22,000 1,540 $13,500 434 $1,230 361 $1,160Canada 39,600 36,000 31,800 32,900 68,200 77,100 35,700 42,300China 28,600 39,700 51,300 47,400 20,700 20,100 34,800 26,400Germany 7,800 18,000 1,120 3,950 5,920 11,700 2,120 3,520Hong Kong 14,400 19,700 9,390 10,700 23,600 27,900 4,040 4,720India 3,460 3,290 2,580 2,430 24,900 21,400 26,100 24,100Japan 10,200 28,400 10,500 28,300 10,400 15,300 9,690 13,200Korea, Republic of 2,720 3,810 7,630 12,100 11,600 15,100 34,800 41,100Mexico 1,230 1,790 1,610 2,310 10,200 13,400 20,700 19,400Singapore 266 244 1,960 1,900 173 286 213 219Spain 60 30 2,760 526 1,860 379 2,670 1,610Taiwan 2,110 3,810 4,120 6,590 6,210 7,870 7,510 10,100United Kingdom 176 751 555 1,060 3,890 3,240 1,700 2,370Other 781 r/ 1,820 r/ 1,450 2,160 5,270 r/ 6,910 r/ 6,440 9,920 Total 114,000 179,000 128,000 166,000 193,000 222,000 187,000 200,000r/ Revised.1/ Data are rounded to no more than three significant digits; may not add to totals shown.
Source: U.S. Census Bureau.
TABLE 19U.S. IMPORTS FOR CONSUMPTION OF COPPER SCRAP, BY COUNTRY 1/
Unalloyed copper scrap Copper-alloy scrap Quantity Value 2/ Gross weight Copper content e/ 3/ Value 2/
Country or Territory (metric tons) (thousands) (metric tons) (metric tons) (thousands) 1998 54,400 $91,700 111,000 80,100 $142,0001999: Canada 6,760 10,100 48,200 34,700 57,500 Chile 5,520 8,120 1,470 1,060 2,150 China -- -- 1,410 1,010 1,870 Colombia 690 780 2,780 2,000 3,660 Costa Rica 726 810 840 605 799 Dominican Republic 1,200 1,370 960 691 957 Guatemala 106 117 1,670 1,210 2,380 Jamaica 347 478 566 408 471 Mexico 16,300 19,100 29,400 21,200 32,100 Spain 16 16 1,290 927 2,840 United Kingdom 120 172 2,450 1,760 3,830 Venezuela 675 784 1,980 1,420 1,540 Other 1,920 3,730 8,800 6,330 10,700 Total 34,400 45,600 102,000 73,300 121,000e/ Estimated. -- Zero.1/ Data are rounded to no more than three significant digits; may not add to totals shown.2/ C.i.f. value at U.S. port.3/ Content is estimated by USGS to be 72% of gross weight.
Source: U.S. Census Bureau.
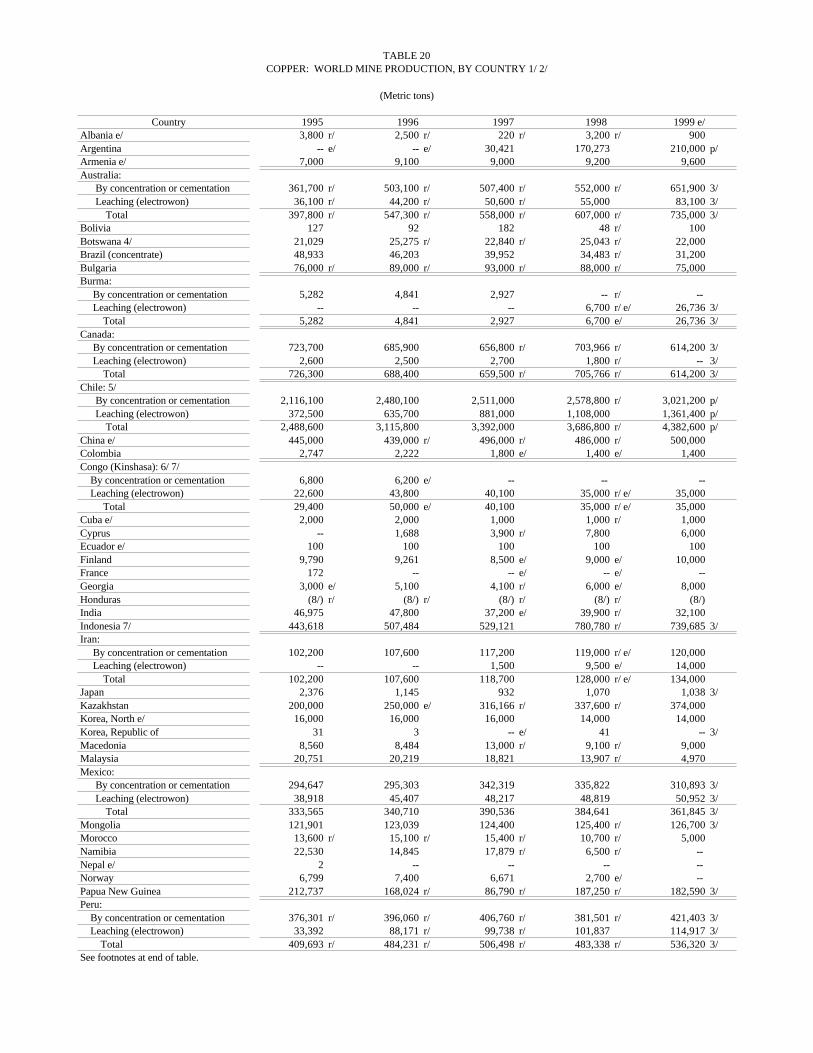
TABLE 20COPPER: WORLD MINE PRODUCTION, BY COUNTRY 1/ 2/
(Metric tons)
Country 1995 1996 1997 1998 1999 e/Albania e/ 3,800 r/ 2,500 r/ 220 r/ 3,200 r/ 900Argentina -- e/ -- e/ 30,421 170,273 210,000 p/Armenia e/ 7,000 9,100 9,000 9,200 9,600Australia: By concentration or cementation 361,700 r/ 503,100 r/ 507,400 r/ 552,000 r/ 651,900 3/ Leaching (electrowon) 36,100 r/ 44,200 r/ 50,600 r/ 55,000 83,100 3/ Total 397,800 r/ 547,300 r/ 558,000 r/ 607,000 r/ 735,000 3/Bolivia 127 92 182 48 r/ 100 Botswana 4/ 21,029 25,275 r/ 22,840 r/ 25,043 r/ 22,000 Brazil (concentrate) 48,933 46,203 39,952 34,483 r/ 31,200 Bulgaria 76,000 r/ 89,000 r/ 93,000 r/ 88,000 r/ 75,000 Burma: By concentration or cementation 5,282 4,841 2,927 -- r/ -- Leaching (electrowon) -- -- -- 6,700 r/ e/ 26,736 3/ Total 5,282 4,841 2,927 6,700 e/ 26,736 3/Canada: By concentration or cementation 723,700 685,900 656,800 r/ 703,966 r/ 614,200 3/ Leaching (electrowon) 2,600 2,500 2,700 1,800 r/ -- 3/ Total 726,300 688,400 659,500 r/ 705,766 r/ 614,200 3/Chile: 5/ By concentration or cementation 2,116,100 2,480,100 2,511,000 2,578,800 r/ 3,021,200 p/ Leaching (electrowon) 372,500 635,700 881,000 1,108,000 1,361,400 p/ Total 2,488,600 3,115,800 3,392,000 3,686,800 r/ 4,382,600 p/China e/ 445,000 439,000 r/ 496,000 r/ 486,000 r/ 500,000 Colombia 2,747 2,222 1,800 e/ 1,400 e/ 1,400 Congo (Kinshasa): 6/ 7/ By concentration or cementation 6,800 6,200 e/ -- -- -- Leaching (electrowon) 22,600 43,800 40,100 35,000 r/ e/ 35,000 Total 29,400 50,000 e/ 40,100 35,000 r/ e/ 35,000 Cuba e/ 2,000 2,000 1,000 1,000 r/ 1,000 Cyprus -- 1,688 3,900 r/ 7,800 6,000 Ecuador e/ 100 100 100 100 100 Finland 9,790 9,261 8,500 e/ 9,000 e/ 10,000France 172 -- -- e/ -- e/ --Georgia 3,000 e/ 5,100 4,100 r/ 6,000 e/ 8,000Honduras (8/) r/ (8/) r/ (8/) r/ (8/) r/ (8/) India 46,975 47,800 37,200 e/ 39,900 r/ 32,100 Indonesia 7/ 443,618 507,484 529,121 780,780 r/ 739,685 3/Iran: By concentration or cementation 102,200 107,600 117,200 119,000 r/ e/ 120,000 Leaching (electrowon) -- -- 1,500 9,500 e/ 14,000 Total 102,200 107,600 118,700 128,000 r/ e/ 134,000Japan 2,376 1,145 932 1,070 1,038 3/Kazakhstan 200,000 250,000 e/ 316,166 r/ 337,600 r/ 374,000 Korea, North e/ 16,000 16,000 16,000 14,000 14,000 Korea, Republic of 31 3 -- e/ 41 -- 3/Macedonia 8,560 8,484 13,000 r/ 9,100 r/ 9,000Malaysia 20,751 20,219 18,821 13,907 r/ 4,970 Mexico: By concentration or cementation 294,647 295,303 342,319 335,822 310,893 3/ Leaching (electrowon) 38,918 45,407 48,217 48,819 50,952 3/ Total 333,565 340,710 390,536 384,641 361,845 3/Mongolia 121,901 123,039 124,400 125,400 r/ 126,700 3/Morocco 13,600 r/ 15,100 r/ 15,400 r/ 10,700 r/ 5,000Namibia 22,530 14,845 17,879 r/ 6,500 r/ --Nepal e/ 2 -- -- -- --Norway 6,799 7,400 6,671 2,700 e/ --Papua New Guinea 212,737 168,024 r/ 86,790 r/ 187,250 r/ 182,590 3/Peru: By concentration or cementation 376,301 r/ 396,060 r/ 406,760 r/ 381,501 r/ 421,403 3/ Leaching (electrowon) 33,392 88,171 r/ 99,738 r/ 101,837 114,917 3/ Total 409,693 r/ 484,231 r/ 506,498 r/ 483,338 r/ 536,320 3/See footnotes at end of table.
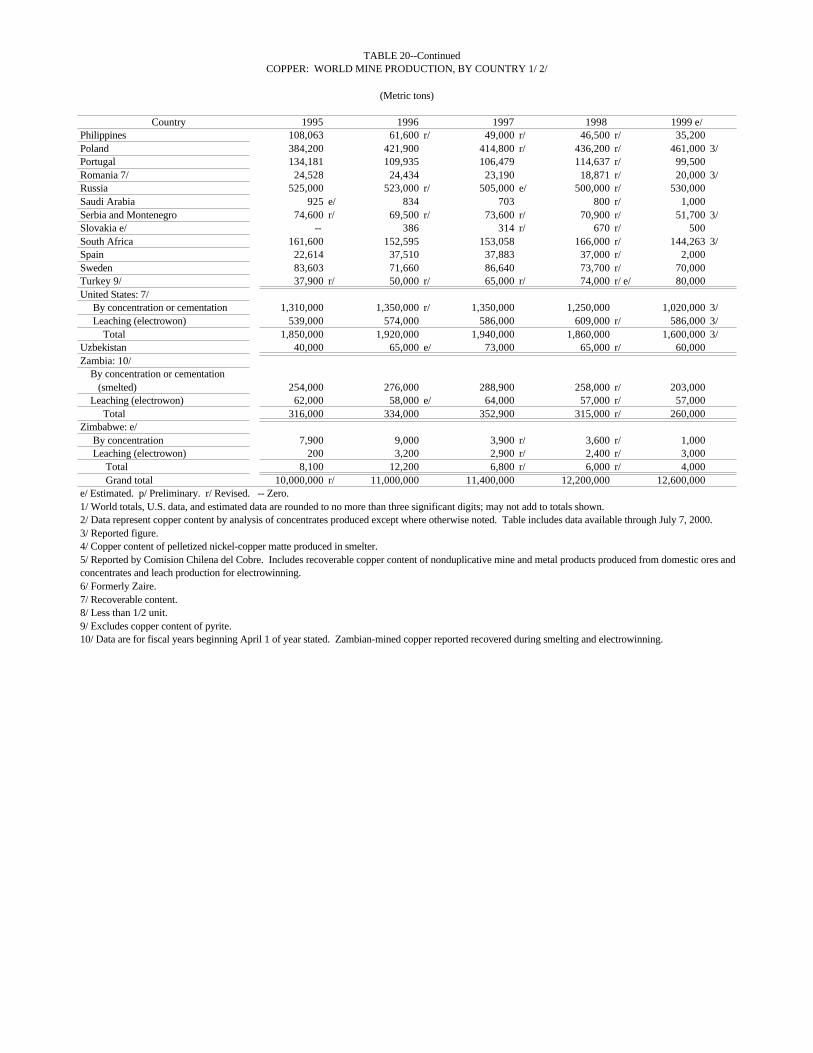
TABLE 20--ContinuedCOPPER: WORLD MINE PRODUCTION, BY COUNTRY 1/ 2/
(Metric tons)
Country 1995 1996 1997 1998 1999 e/ Philippines 108,063 61,600 r/ 49,000 r/ 46,500 r/ 35,200 Poland 384,200 421,900 414,800 r/ 436,200 r/ 461,000 3/Portugal 134,181 109,935 106,479 114,637 r/ 99,500 Romania 7/ 24,528 24,434 23,190 18,871 r/ 20,000 3/Russia 525,000 523,000 r/ 505,000 e/ 500,000 r/ 530,000Saudi Arabia 925 e/ 834 703 800 r/ 1,000 Serbia and Montenegro 74,600 r/ 69,500 r/ 73,600 r/ 70,900 r/ 51,700 3/Slovakia e/ -- 386 314 r/ 670 r/ 500South Africa 161,600 152,595 153,058 166,000 r/ 144,263 3/Spain 22,614 37,510 37,883 37,000 r/ 2,000Sweden 83,603 71,660 86,640 73,700 r/ 70,000 Turkey 9/ 37,900 r/ 50,000 r/ 65,000 r/ 74,000 r/ e/ 80,000 United States: 7/ By concentration or cementation 1,310,000 1,350,000 r/ 1,350,000 1,250,000 1,020,000 3/ Leaching (electrowon) 539,000 574,000 586,000 609,000 r/ 586,000 3/ Total 1,850,000 1,920,000 1,940,000 1,860,000 1,600,000 3/Uzbekistan 40,000 65,000 e/ 73,000 65,000 r/ 60,000Zambia: 10/ By concentration or cementation (smelted) 254,000 276,000 288,900 258,000 r/ 203,000 Leaching (electrowon) 62,000 58,000 e/ 64,000 57,000 r/ 57,000 Total 316,000 334,000 352,900 315,000 r/ 260,000Zimbabwe: e/ By concentration 7,900 9,000 3,900 r/ 3,600 r/ 1,000 Leaching (electrowon) 200 3,200 2,900 r/ 2,400 r/ 3,000 Total 8,100 12,200 6,800 r/ 6,000 r/ 4,000 Grand total 10,000,000 r/ 11,000,000 11,400,000 12,200,000 12,600,000e/ Estimated. p/ Preliminary. r/ Revised. -- Zero. 1/ World totals, U.S. data, and estimated data are rounded to no more than three significant digits; may not add to totals shown.2/ Data represent copper content by analysis of concentrates produced except where otherwise noted. Table includes data available through July 7, 2000.3/ Reported figure.4/ Copper content of pelletized nickel-copper matte produced in smelter.5/ Reported by Comision Chilena del Cobre. Includes recoverable copper content of nonduplicative mine and metal products produced from domestic ores andconcentrates and leach production for electrowinning. 6/ Formerly Zaire.7/ Recoverable content.8/ Less than 1/2 unit.9/ Excludes copper content of pyrite.10/ Data are for fiscal years beginning April 1 of year stated. Zambian-mined copper reported recovered during smelting and electrowinning.
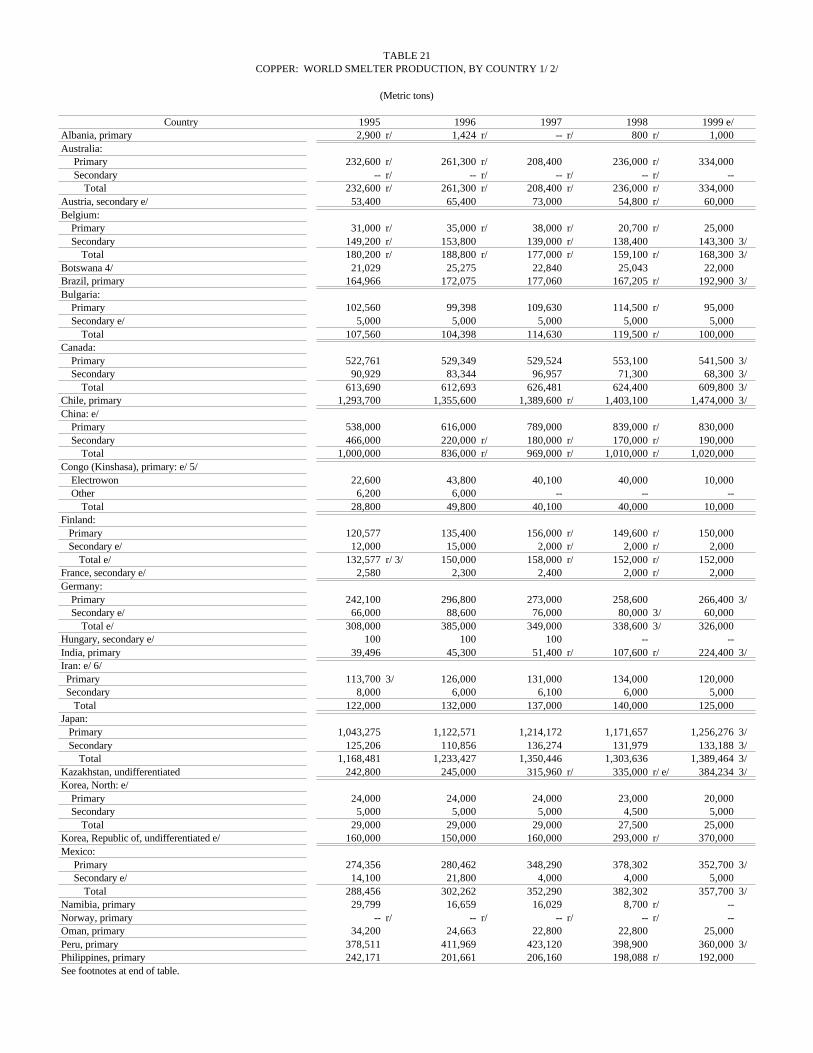
TABLE 21COPPER: WORLD SMELTER PRODUCTION, BY COUNTRY 1/ 2/
(Metric tons)
Country 1995 1996 1997 1998 1999 e/Albania, primary 2,900 r/ 1,424 r/ -- r/ 800 r/ 1,000Australia: Primary 232,600 r/ 261,300 r/ 208,400 236,000 r/ 334,000 Secondary -- r/ -- r/ -- r/ -- r/ -- Total 232,600 r/ 261,300 r/ 208,400 r/ 236,000 r/ 334,000Austria, secondary e/ 53,400 65,400 73,000 54,800 r/ 60,000Belgium: Primary 31,000 r/ 35,000 r/ 38,000 r/ 20,700 r/ 25,000 Secondary 149,200 r/ 153,800 139,000 r/ 138,400 143,300 3/ Total 180,200 r/ 188,800 r/ 177,000 r/ 159,100 r/ 168,300 3/Botswana 4/ 21,029 25,275 22,840 25,043 22,000Brazil, primary 164,966 172,075 177,060 167,205 r/ 192,900 3/Bulgaria: Primary 102,560 99,398 109,630 114,500 r/ 95,000 Secondary e/ 5,000 5,000 5,000 5,000 5,000 Total 107,560 104,398 114,630 119,500 r/ 100,000Canada: Primary 522,761 529,349 529,524 553,100 541,500 3/ Secondary 90,929 83,344 96,957 71,300 68,300 3/ Total 613,690 612,693 626,481 624,400 609,800 3/Chile, primary 1,293,700 1,355,600 1,389,600 r/ 1,403,100 1,474,000 3/China: e/ Primary 538,000 616,000 789,000 839,000 r/ 830,000 Secondary 466,000 220,000 r/ 180,000 r/ 170,000 r/ 190,000 Total 1,000,000 836,000 r/ 969,000 r/ 1,010,000 r/ 1,020,000Congo (Kinshasa), primary: e/ 5/ Electrowon 22,600 43,800 40,100 40,000 10,000 Other 6,200 6,000 -- -- -- Total 28,800 49,800 40,100 40,000 10,000Finland: Primary 120,577 135,400 156,000 r/ 149,600 r/ 150,000 Secondary e/ 12,000 15,000 2,000 r/ 2,000 r/ 2,000 Total e/ 132,577 r/ 3/ 150,000 158,000 r/ 152,000 r/ 152,000France, secondary e/ 2,580 2,300 2,400 2,000 r/ 2,000Germany: Primary 242,100 296,800 273,000 258,600 266,400 3/ Secondary e/ 66,000 88,600 76,000 80,000 3/ 60,000 Total e/ 308,000 385,000 349,000 338,600 3/ 326,000Hungary, secondary e/ 100 100 100 -- --India, primary 39,496 45,300 51,400 r/ 107,600 r/ 224,400 3/Iran: e/ 6/ Primary 113,700 3/ 126,000 131,000 134,000 120,000 Secondary 8,000 6,000 6,100 6,000 5,000 Total 122,000 132,000 137,000 140,000 125,000Japan: Primary 1,043,275 1,122,571 1,214,172 1,171,657 1,256,276 3/ Secondary 125,206 110,856 136,274 131,979 133,188 3/ Total 1,168,481 1,233,427 1,350,446 1,303,636 1,389,464 3/Kazakhstan, undifferentiated 242,800 245,000 315,960 r/ 335,000 r/ e/ 384,234 3/Korea, North: e/ Primary 24,000 24,000 24,000 23,000 20,000 Secondary 5,000 5,000 5,000 4,500 5,000 Total 29,000 29,000 29,000 27,500 25,000Korea, Republic of, undifferentiated e/ 160,000 150,000 160,000 293,000 r/ 370,000Mexico: Primary 274,356 280,462 348,290 378,302 352,700 3/ Secondary e/ 14,100 21,800 4,000 4,000 5,000 Total 288,456 302,262 352,290 382,302 357,700 3/Namibia, primary 29,799 16,659 16,029 8,700 r/ --Norway, primary -- r/ -- r/ -- r/ -- r/ --Oman, primary 34,200 24,663 22,800 22,800 25,000Peru, primary 378,511 411,969 423,120 398,900 360,000 3/Philippines, primary 242,171 201,661 206,160 198,088 r/ 192,000See footnotes at end of table.
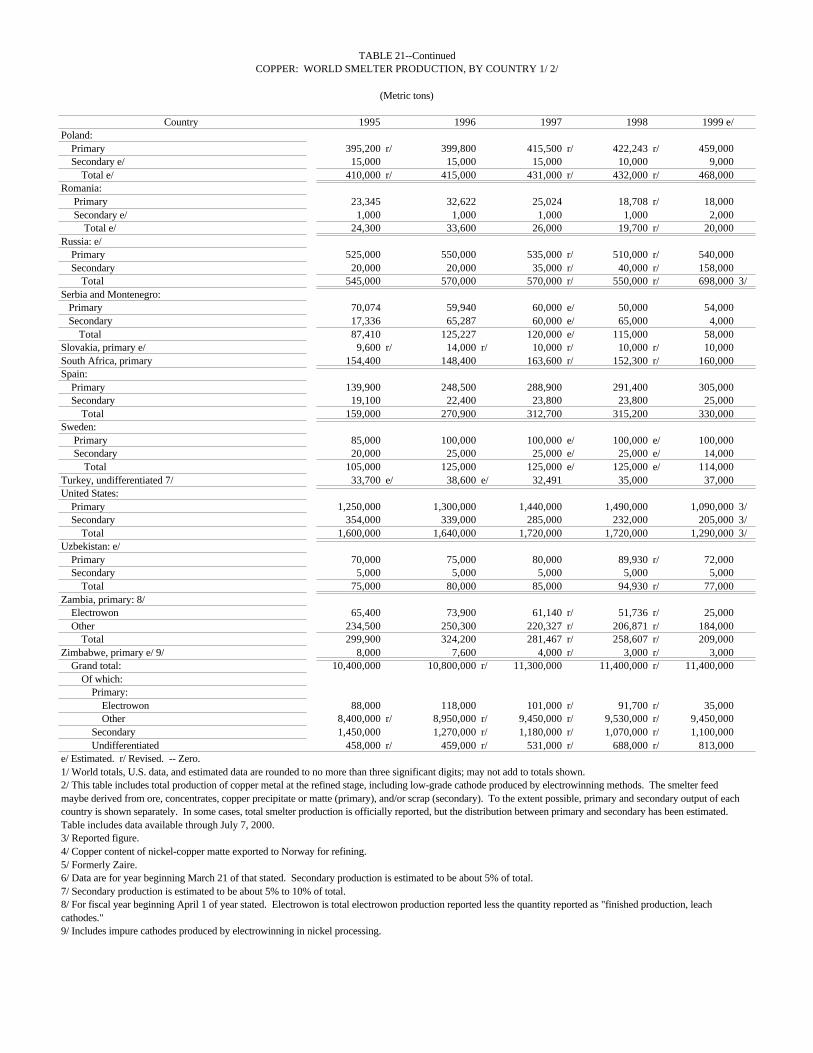
TABLE 21--ContinuedCOPPER: WORLD SMELTER PRODUCTION, BY COUNTRY 1/ 2/
(Metric tons)
Country 1995 1996 1997 1998 1999 e/Poland: Primary 395,200 r/ 399,800 415,500 r/ 422,243 r/ 459,000 Secondary e/ 15,000 15,000 15,000 10,000 9,000 Total e/ 410,000 r/ 415,000 431,000 r/ 432,000 r/ 468,000Romania: Primary 23,345 32,622 25,024 18,708 r/ 18,000 Secondary e/ 1,000 1,000 1,000 1,000 2,000 Total e/ 24,300 33,600 26,000 19,700 r/ 20,000Russia: e/ Primary 525,000 550,000 535,000 r/ 510,000 r/ 540,000 Secondary 20,000 20,000 35,000 r/ 40,000 r/ 158,000 Total 545,000 570,000 570,000 r/ 550,000 r/ 698,000 3/Serbia and Montenegro: Primary 70,074 59,940 60,000 e/ 50,000 54,000 Secondary 17,336 65,287 60,000 e/ 65,000 4,000 Total 87,410 125,227 120,000 e/ 115,000 58,000Slovakia, primary e/ 9,600 r/ 14,000 r/ 10,000 r/ 10,000 r/ 10,000South Africa, primary 154,400 148,400 163,600 r/ 152,300 r/ 160,000Spain: Primary 139,900 248,500 288,900 291,400 305,000 Secondary 19,100 22,400 23,800 23,800 25,000 Total 159,000 270,900 312,700 315,200 330,000Sweden: Primary 85,000 100,000 100,000 e/ 100,000 e/ 100,000 Secondary 20,000 25,000 25,000 e/ 25,000 e/ 14,000 Total 105,000 125,000 125,000 e/ 125,000 e/ 114,000Turkey, undifferentiated 7/ 33,700 e/ 38,600 e/ 32,491 35,000 37,000United States: Primary 1,250,000 1,300,000 1,440,000 1,490,000 1,090,000 3/ Secondary 354,000 339,000 285,000 232,000 205,000 3/ Total 1,600,000 1,640,000 1,720,000 1,720,000 1,290,000 3/Uzbekistan: e/ Primary 70,000 75,000 80,000 89,930 r/ 72,000 Secondary 5,000 5,000 5,000 5,000 5,000 Total 75,000 80,000 85,000 94,930 r/ 77,000Zambia, primary: 8/ Electrowon 65,400 73,900 61,140 r/ 51,736 r/ 25,000 Other 234,500 250,300 220,327 r/ 206,871 r/ 184,000 Total 299,900 324,200 281,467 r/ 258,607 r/ 209,000Zimbabwe, primary e/ 9/ 8,000 7,600 4,000 r/ 3,000 r/ 3,000 Grand total: 10,400,000 10,800,000 r/ 11,300,000 11,400,000 r/ 11,400,000 Of which: Primary: Electrowon 88,000 118,000 101,000 r/ 91,700 r/ 35,000 Other 8,400,000 r/ 8,950,000 r/ 9,450,000 r/ 9,530,000 r/ 9,450,000 Secondary 1,450,000 1,270,000 r/ 1,180,000 r/ 1,070,000 r/ 1,100,000 Undifferentiated 458,000 r/ 459,000 r/ 531,000 r/ 688,000 r/ 813,000e/ Estimated. r/ Revised. -- Zero.1/ World totals, U.S. data, and estimated data are rounded to no more than three significant digits; may not add to totals shown.2/ This table includes total production of copper metal at the refined stage, including low-grade cathode produced by electrowinning methods. The smelter feedmaybe derived from ore, concentrates, copper precipitate or matte (primary), and/or scrap (secondary). To the extent possible, primary and secondary output of eachcountry is shown separately. In some cases, total smelter production is officially reported, but the distribution between primary and secondary has been estimated.Table includes data available through July 7, 2000.3/ Reported figure.4/ Copper content of nickel-copper matte exported to Norway for refining.5/ Formerly Zaire.6/ Data are for year beginning March 21 of that stated. Secondary production is estimated to be about 5% of total.7/ Secondary production is estimated to be about 5% to 10% of total.8/ For fiscal year beginning April 1 of year stated. Electrowon is total electrowon production reported less the quantity reported as "finished production, leachcathodes."9/ Includes impure cathodes produced by electrowinning in nickel processing.
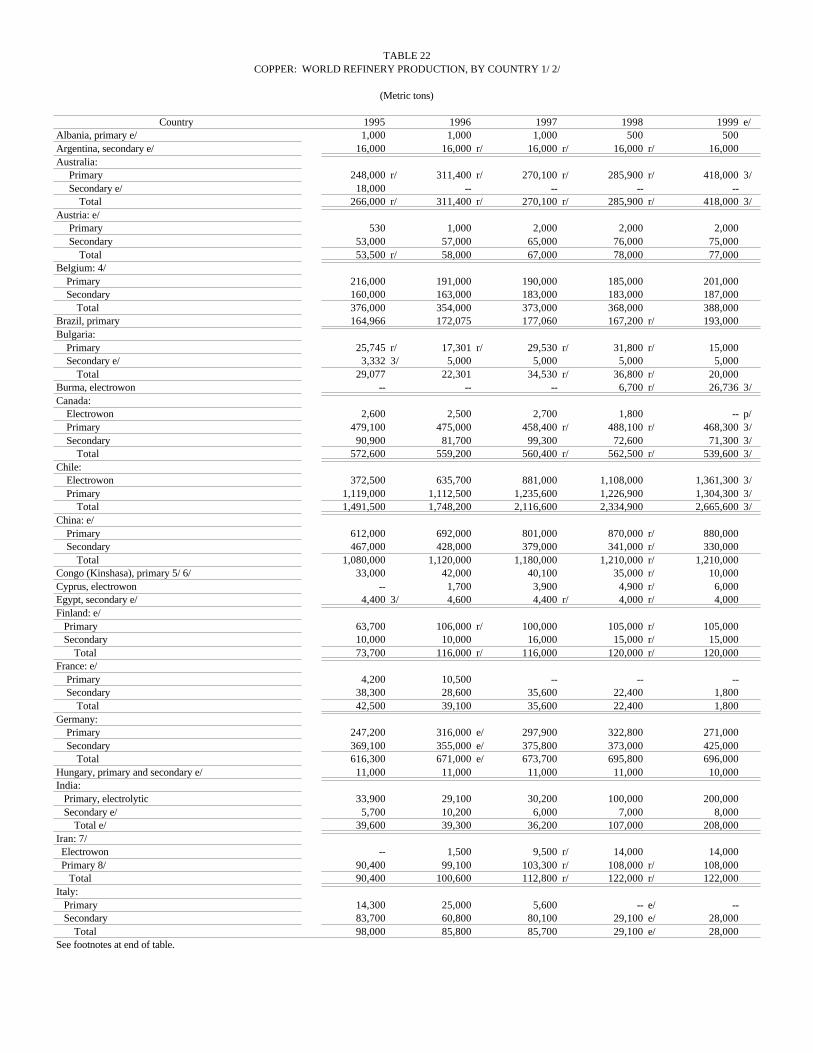
TABLE 22COPPER: WORLD REFINERY PRODUCTION, BY COUNTRY 1/ 2/
(Metric tons)
Country 1995 1996 1997 1998 1999 e/Albania, primary e/ 1,000 1,000 1,000 500 500Argentina, secondary e/ 16,000 16,000 r/ 16,000 r/ 16,000 r/ 16,000Australia: Primary 248,000 r/ 311,400 r/ 270,100 r/ 285,900 r/ 418,000 3/ Secondary e/ 18,000 -- -- -- -- Total 266,000 r/ 311,400 r/ 270,100 r/ 285,900 r/ 418,000 3/Austria: e/ Primary 530 1,000 2,000 2,000 2,000 Secondary 53,000 57,000 65,000 76,000 75,000 Total 53,500 r/ 58,000 67,000 78,000 77,000Belgium: 4/ Primary 216,000 191,000 190,000 185,000 201,000 Secondary 160,000 163,000 183,000 183,000 187,000 Total 376,000 354,000 373,000 368,000 388,000Brazil, primary 164,966 172,075 177,060 167,200 r/ 193,000Bulgaria: Primary 25,745 r/ 17,301 r/ 29,530 r/ 31,800 r/ 15,000 Secondary e/ 3,332 3/ 5,000 5,000 5,000 5,000 Total 29,077 22,301 34,530 r/ 36,800 r/ 20,000Burma, electrowon -- -- -- 6,700 r/ 26,736 3/Canada: Electrowon 2,600 2,500 2,700 1,800 -- p/ Primary 479,100 475,000 458,400 r/ 488,100 r/ 468,300 3/ Secondary 90,900 81,700 99,300 72,600 71,300 3/ Total 572,600 559,200 560,400 r/ 562,500 r/ 539,600 3/Chile: Electrowon 372,500 635,700 881,000 1,108,000 1,361,300 3/ Primary 1,119,000 1,112,500 1,235,600 1,226,900 1,304,300 3/ Total 1,491,500 1,748,200 2,116,600 2,334,900 2,665,600 3/China: e/ Primary 612,000 692,000 801,000 870,000 r/ 880,000 Secondary 467,000 428,000 379,000 341,000 r/ 330,000 Total 1,080,000 1,120,000 1,180,000 1,210,000 r/ 1,210,000Congo (Kinshasa), primary 5/ 6/ 33,000 42,000 40,100 35,000 r/ 10,000Cyprus, electrowon -- 1,700 3,900 4,900 r/ 6,000Egypt, secondary e/ 4,400 3/ 4,600 4,400 r/ 4,000 r/ 4,000Finland: e/ Primary 63,700 106,000 r/ 100,000 105,000 r/ 105,000 Secondary 10,000 10,000 16,000 15,000 r/ 15,000 Total 73,700 116,000 r/ 116,000 120,000 r/ 120,000France: e/ Primary 4,200 10,500 -- -- -- Secondary 38,300 28,600 35,600 22,400 1,800 Total 42,500 39,100 35,600 22,400 1,800Germany: Primary 247,200 316,000 e/ 297,900 322,800 271,000 Secondary 369,100 355,000 e/ 375,800 373,000 425,000 Total 616,300 671,000 e/ 673,700 695,800 696,000Hungary, primary and secondary e/ 11,000 11,000 11,000 11,000 10,000India: Primary, electrolytic 33,900 29,100 30,200 100,000 200,000 Secondary e/ 5,700 10,200 6,000 7,000 8,000 Total e/ 39,600 39,300 36,200 107,000 208,000Iran: 7/ Electrowon -- 1,500 9,500 r/ 14,000 14,000 Primary 8/ 90,400 99,100 103,300 r/ 108,000 r/ 108,000 Total 90,400 100,600 112,800 r/ 122,000 r/ 122,000Italy: Primary 14,300 25,000 5,600 -- e/ -- Secondary 83,700 60,800 80,100 29,100 e/ 28,000 Total 98,000 85,800 85,700 29,100 e/ 28,000See footnotes at end of table.
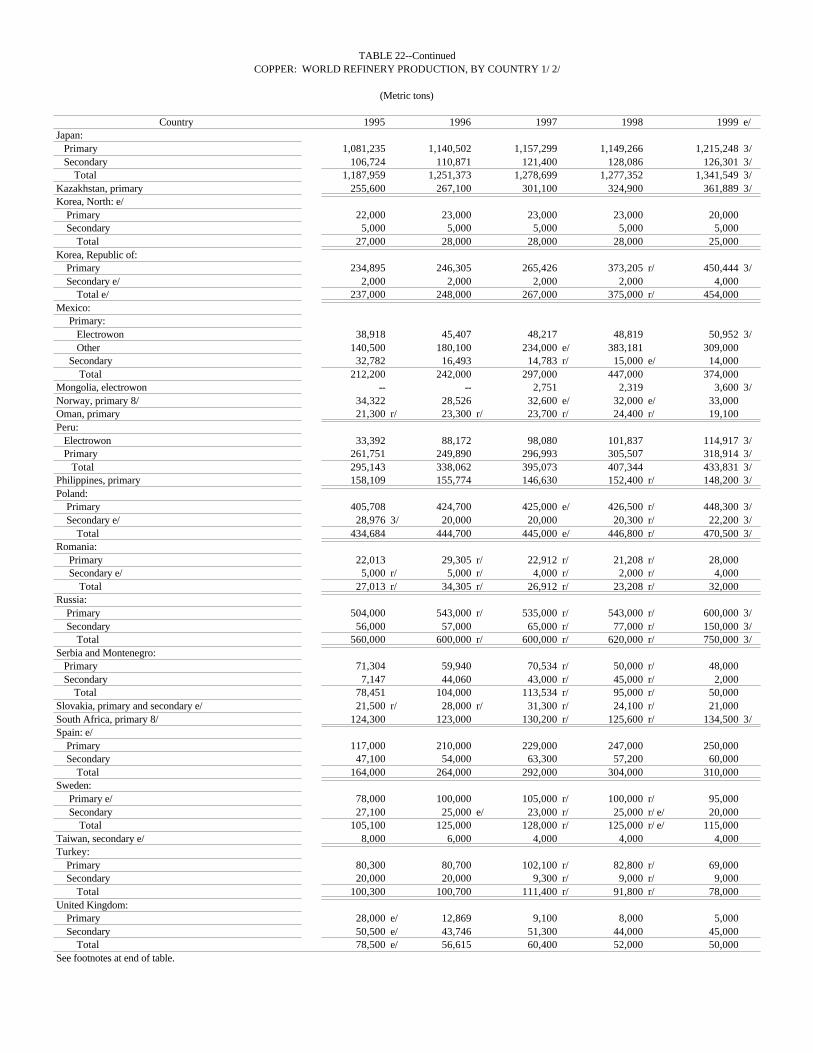
TABLE 22--ContinuedCOPPER: WORLD REFINERY PRODUCTION, BY COUNTRY 1/ 2/
(Metric tons)
Country 1995 1996 1997 1998 1999 e/Japan: Primary 1,081,235 1,140,502 1,157,299 1,149,266 1,215,248 3/ Secondary 106,724 110,871 121,400 128,086 126,301 3/ Total 1,187,959 1,251,373 1,278,699 1,277,352 1,341,549 3/Kazakhstan, primary 255,600 267,100 301,100 324,900 361,889 3/Korea, North: e/ Primary 22,000 23,000 23,000 23,000 20,000 Secondary 5,000 5,000 5,000 5,000 5,000 Total 27,000 28,000 28,000 28,000 25,000Korea, Republic of: Primary 234,895 246,305 265,426 373,205 r/ 450,444 3/ Secondary e/ 2,000 2,000 2,000 2,000 4,000 Total e/ 237,000 248,000 267,000 375,000 r/ 454,000Mexico: Primary: Electrowon 38,918 45,407 48,217 48,819 50,952 3/ Other 140,500 180,100 234,000 e/ 383,181 309,000 Secondary 32,782 16,493 14,783 r/ 15,000 e/ 14,000 Total 212,200 242,000 297,000 447,000 374,000Mongolia, electrowon -- -- 2,751 2,319 3,600 3/Norway, primary 8/ 34,322 28,526 32,600 e/ 32,000 e/ 33,000Oman, primary 21,300 r/ 23,300 r/ 23,700 r/ 24,400 r/ 19,100Peru: Electrowon 33,392 88,172 98,080 101,837 114,917 3/ Primary 261,751 249,890 296,993 305,507 318,914 3/ Total 295,143 338,062 395,073 407,344 433,831 3/Philippines, primary 158,109 155,774 146,630 152,400 r/ 148,200 3/Poland: Primary 405,708 424,700 425,000 e/ 426,500 r/ 448,300 3/ Secondary e/ 28,976 3/ 20,000 20,000 20,300 r/ 22,200 3/ Total 434,684 444,700 445,000 e/ 446,800 r/ 470,500 3/Romania: Primary 22,013 29,305 r/ 22,912 r/ 21,208 r/ 28,000 Secondary e/ 5,000 r/ 5,000 r/ 4,000 r/ 2,000 r/ 4,000 Total 27,013 r/ 34,305 r/ 26,912 r/ 23,208 r/ 32,000Russia: Primary 504,000 543,000 r/ 535,000 r/ 543,000 r/ 600,000 3/ Secondary 56,000 57,000 65,000 r/ 77,000 r/ 150,000 3/ Total 560,000 600,000 r/ 600,000 r/ 620,000 r/ 750,000 3/Serbia and Montenegro: Primary 71,304 59,940 70,534 r/ 50,000 r/ 48,000 Secondary 7,147 44,060 43,000 r/ 45,000 r/ 2,000 Total 78,451 104,000 113,534 r/ 95,000 r/ 50,000Slovakia, primary and secondary e/ 21,500 r/ 28,000 r/ 31,300 r/ 24,100 r/ 21,000South Africa, primary 8/ 124,300 123,000 130,200 r/ 125,600 r/ 134,500 3/Spain: e/ Primary 117,000 210,000 229,000 247,000 250,000 Secondary 47,100 54,000 63,300 57,200 60,000 Total 164,000 264,000 292,000 304,000 310,000Sweden: Primary e/ 78,000 100,000 105,000 r/ 100,000 r/ 95,000 Secondary 27,100 25,000 e/ 23,000 r/ 25,000 r/ e/ 20,000 Total 105,100 125,000 128,000 r/ 125,000 r/ e/ 115,000Taiwan, secondary e/ 8,000 6,000 4,000 4,000 4,000Turkey: Primary 80,300 80,700 102,100 r/ 82,800 r/ 69,000 Secondary 20,000 20,000 9,300 r/ 9,000 r/ 9,000 Total 100,300 100,700 111,400 r/ 91,800 r/ 78,000United Kingdom: Primary 28,000 e/ 12,869 9,100 8,000 5,000 Secondary 50,500 e/ 43,746 51,300 44,000 45,000 Total 78,500 e/ 56,615 60,400 52,000 50,000See footnotes at end of table.
TABLE 22--ContinuedCOPPER: WORLD REFINERY PRODUCTION, BY COUNTRY 1/ 2/
(Metric tons)
Country 1995 1996 1997 1998 1999 e/United States: Primary: Electrowon 539,000 574,000 586,000 609,000 r/ 586,000 3/ Other 1,390,000 1,430,000 1,480,000 r/ 1,530,000 1,300,000 3/ Secondary 352,000 345,000 396,000 r/ 349,000 r/ 243,000 3/ Total 2,280,000 2,350,000 2,470,000 r/ 2,490,000 r/ 2,130,000 3/Uzbekistan: e/ Primary 90,000 95,000 105,000 89,930 r/ 3/ 72,000 Secondary 5,000 5,000 5,000 5,000 5,000 Total 95,000 100,000 110,000 94,900 r/ 77,000Zambia, primary: 9/ Electrowon 62,000 58,000 63,736 r/ 80,709 r/ 57,000 Other 266,000 276,000 268,553 r/ 248,820 r/ 176,000 Total 328,000 334,000 332,289 r/ 329,529 r/ 233,000Zimbabwe: e/ Electrowon 200 3/ 3,200 2,900 r/ 2,400 r/ 3,000 Primary 6,875 3/ 10,900 4,990 r/ 2,940 r/ 10,000 Secondary 6,000 6,000 -- r/ -- r/ -- Total 13,100 20,100 7,890 r/ 5,340 r/ 13,000 Total, primary 9,790,000 r/ 10,700,000 r/ 11,400,000 r/ 12,200,000 r/ 12,500,000 Total, secondary 2,080,000 r/ 1,980,000 r/ 2,090,000 r/ 1,930,000 r/ 1,880,000 Total, primary and secondary, undifferentiated 32,500 r/ 39,000 r/ 42,300 r/ 35,100 r/ 31,000 Grand total 11,900,000 12,700,000 13,500,000 r/ 14,100,000 14,400,000e/ Estimated. p/ Preliminary. r/ Revised. -- Zero.1/ World totals, U.S. data, and estimated data are rounded to no more than three significant digits; may not add to totals shown.2/ This table includes total production of refined copper, whether produced by pyrometallurgical or electrolytic refining methods and whether derived from primaryunrefined copper or from scrap. Copper cathode derived from electrowinning processing is also included. Table includes data available through July 7, 2000.3/ Reported figure.4/ Includes leach cathode from Congo (Kinshasa), which is processed.5/ Formerly Zaire.6/ Excludes leach cathode exported for processing in Belgium.7/ Data are for Iranian years beginning March 21 of that stated.8/ May include secondary.9/ Data are for fiscal year beginning April 1 of that stated. Electrowon covers only presumably high-grade electrowon cathodes reported as "finished productionleach cathodes." Other, in addition to electrowon cathodes, includes a smaller amount of "finished product shapes" presumably cast from electro-refined cathodes,or any blister-anodes and low-anodes and low-grade electrowon cathodes that were furnace- or fire-refined.