Embed Size (px)
Citation preview
by Cruz C. Torres
Professor Emeritus Dept. of RPTS Texas A&M University May 25, 2011
Texas – A Majority/Minority State: Social and Economic Implications
2011 Texas SDC/BIDC Annual Meeting, Austin, TX

Demographic Trends Affecting the Future
Change in Rates and Sources of Population Growth– migration
Increase in the Non-Anglo Population– fertility
Aging of the Population– death
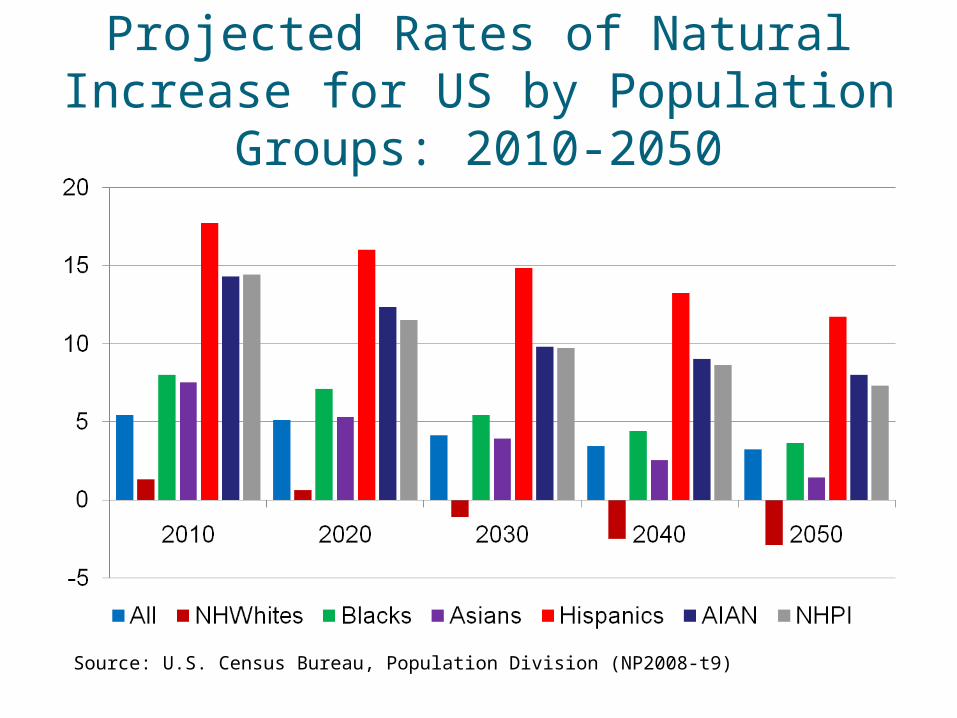
Projected Rates of Natural Increase for US by Population Groups: 2010-2050
Source: U.S. Census Bureau, Population Division (NP2008-t9)

Projected Rates for Components of US International Migration by Ethnicity: 2010-2050

Texas Population Change

Texas Population Change by Race/Ethnicity: 2000-2010
Race/Ethnicity
2000Census
Population
2010Census
Population
NumericalChange
2000-2010
PercentChange
2000/2010
Percent of Population 2000 2010
NH White 11,074,716 11,397,345 322,629 2.9 53.1 45.3
NH Black 2,421,653 2,886,825 465,172 19.2 11.6 11.5
Hispanic 6,669,666 9,460,921 2,791,255 41.8 32.0 37.6
NH Asian 685,785 1,400,470 714,685 104.2 3.3 5.6
Total 20,851,820 25,145,561 4,293,741 20.6 100.0 100.0
Source: U.S. Census Bureau 2000 and 2010 Census Counts

Population Change by Components of Change in the State, 1990-2000 and 2000-2009
State of Texas
1990-2000
Numerical Change 3,865,485
Natural Increase 49.7
Domestic Migration 30.2
International Migration 20.1
2000-2009
Numerical Change 3,930,484
Natural Increase 54.04
Domestic Migration 21.6
International Migration 23.8

Percent Anglo Population
Less Than 50% Anglo Population
50% or Greater Anglo PopulationSource: 2006 Population Projections, Texas State Data Center,Institute for Demographic and Socioeconomic Research,The University of Texas at San Antonio
2000
2040 2040(2000-2004 Scenario)(0.5 Scenario)
2040(1.0 Scenario)
Texas Counties with 50 Percent or More of Their Total Population That is Angloin 2000 and Projected for 2040 Under Alternative Projection Scenarios

Projected Proportion of Population by Race/Ethnicity in Texas, 2000-2040*
*Using U.S. Census count for 2000 and Texas State Data Center 1.0 population projection scenario for 2010-2040.
53.1
45.1
37.3
30.3
23.9
11.6 11.1 10.39.2
8.0
32.0
39.3
46.5
53.2
59.2
3.34.5
5.97.3
8.9
2000 2010 2020 2030 20400.0
10.0
20.0
30.0
40.0
50.0
60.0
70.0Percent
Anglo Black Hispanic Other

Projected Percent of Net Change Attributable to Each Race/Ethnicity Group in Texas for 2000-2040*
* Using U.S. Census count for 2000 and Texas State Data Center 1.0 population projection scenario for 2040.
Anglo3.9%
Black5.3%
Hispanic78.2%
Other12.6%

Ethnic Diversity of the Population, Householders, and Labor Force in Texas, 2000 and 2040*
* Projections are shown for the 1.0 scenario
53.1%
11.6%32.0%
3.3%
61.4%
11.4% 24.2%
3.0%
58.4%
10.7% 27.5%
3.4%
24.2%7.9%
59.1%
8.8%
29.0%9.0%
52.8%
9.2%
25.2%7.9%
58.7%
8.2%
Anglo Black Hispanic Other
2000 Population
2040 Population
2000 Householders
2040 Householders
2000 Civilian Labor Force
2040 Civilian Labor Force

Major Changes in Population:
Age Composition
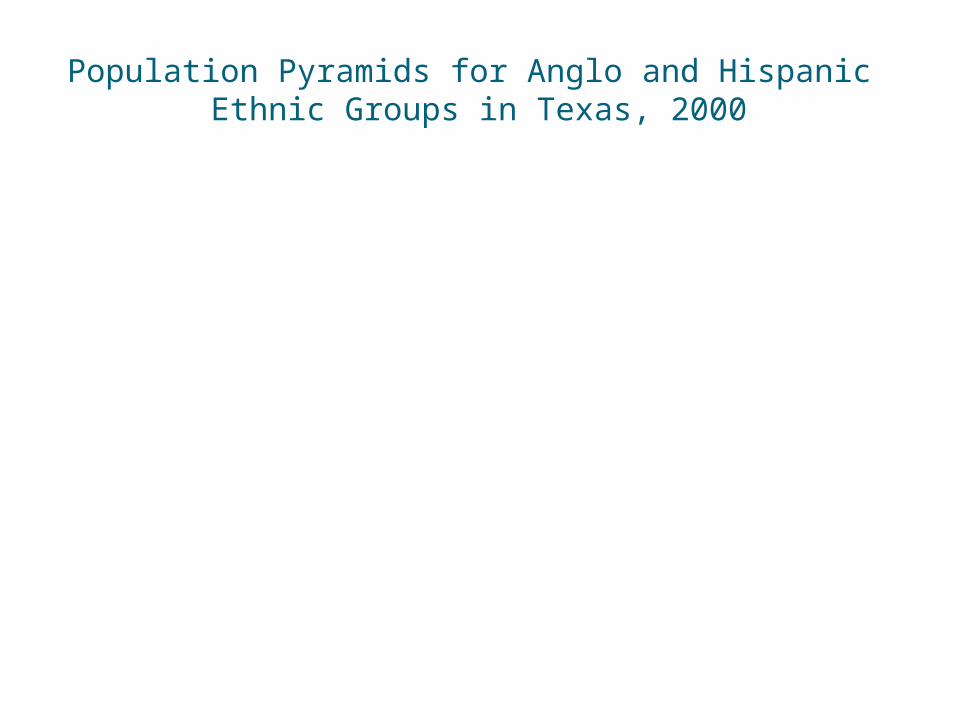
Population Pyramids for Anglo and Hispanic Ethnic Groups in Texas, 2000
0
100,
000
200,
000
300,
000
400,
000
500,
000 0
100,
000
200,
000
300,
000
400,
000
500,
000
100 + years95 to 99 years90 to 94 years85 to 89 years80 to 84 years75 to 79 years70 to 74 years65 to 69 years60 to 64 years55 to 59 years50 to 54 years45 to 49 years40 to 44 years35 to 39 years30 to 34 years25 to 29 years20 to 24 years15 to 19 years10 to 14 years
5 to 9 years< 5 years
0
100,
000
200,
000
300,
000
400,
000
500,
000 0
100,
000
200,
000
300,
000
400,
000
500,
000
Male Female Male Female
Anglo HispanicAge

Percent of Texas Population by Age Groupand Ethnicity, 2000
39.541.6
45.0 45.043.1 44.4
47.8
53.0
57.260.2
63.566.4 67.1
72.6
44.041.3
38.0 38.440.5
38.635.3
30.526.7
24.222.4
20.6 20.316.7
< 5
year
s
5 to
9 y
ears
10 to
14
year
s
15 to
19
year
s
20 to
24
year
s
25 to
29
year
s
30 to
34
year
s
35 to
39
year
s
40 to
44
year
s
45 to
49
year
s
50 to
54
year
s
55 to
59
year
s
60 to
64
year
s
65 +
yea
rs0.0
20.0
40.0
60.0
80.0Percent
Anglo Hispanic

Population, Population Change, and Proportion of the Population Less than 18 Years of Age by Race/Ethnicity for Texas, 2000 and 2010
Change Percent of Population
Race/Ethnicity* 2000 2010 Numeric Percent 2000 2010NH Whites (Anglo) 2,507,147 2,322,661 -184,486 -7.36 42.59 33.83Hispanic (All Races) 2,386,765 3,317,777 931,012 39.01 40.54 48.32NH Black 732,807 810,543 77,736 10.61 12.45 11.81NH Asian 139,226 231,458 92,232 66.25 2.37 3.37
NH "Other" Races 28,962 36,513 7,551 33.05 0.49 0.53NH Two or More Races 91,852 146,872 55,020 59.90 1.56 2.14State of Texas 5,886,759 6,865,824 979,065 16.63 100.00 100.00
Source: U.S. Census 2010, P.L. 94-171 * “Other Race” is comprised of Native American and Alaska Native, Native Hawaiian and Pacific Islander, and “Some Other Race” as per the Census 2000 and Census 2010. Hispanic includes persons of all races. All other race/ethnicity categories shown here are non-Hispanic (e.g., non-Hispanic White, non-Hispanic Black, etc.)

Percent of Texas Population by Age Groupand Ethnicity, 2040*
* Projections are shown for the 1.0 scenario
17.719.3 19.9 20.3 19.8 19.3 19.4 20.5 20.6 21.9
25.3 26.5 27.2
39.8
69.967.8 66.5 65.5 66.0 66.8 66.4
64.362.6
60.6
56.7 55.252.3
37.1
< 5
year
s
5 to
9 y
ears
10 to
14
year
s
15 to
19
year
s
20 to
24
year
s
25 to
29
year
s
30 to
34
year
s
35 to
39
year
s
40 to
44
year
s
45 to
49
year
s
50 to
54
year
s
55 to
59
year
s
60 to
64
year
s
65 +
yea
rs0.0
10.0
20.0
30.0
40.0
50.0
60.0
70.0
80.0Percent
Anglo Hispanic
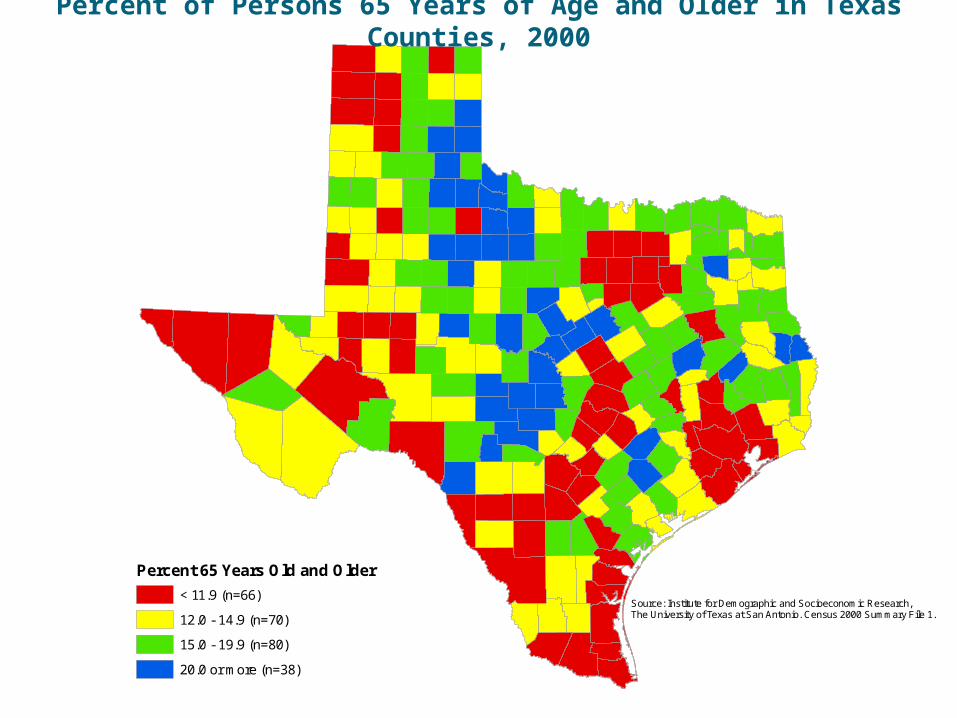
Percent 65 Years Old and Older
< 11.9 (n=66)
12.0 - 14.9 (n=70)
15.0 - 19.9 (n=80)
20.0 or more (n=38)
Source: Institute for Demographic and Socioeconomic Research,The University of Texas at San Antonio. Census 2000 Summary File 1.
Percent of Persons 65 Years of Age and Older in Texas Counties, 2000

Percent 65 Years Old and Older
< 11.9 (n=2)
12.0 - 14.9 (n=19)
15.0 - 19.9 (n=79)
20.0 or more (n=154)
Source: Institute for Demographic and Socioeconomic Research,The University of Texas at San Antonio. Texas Population Estimatesand Projections Program, 2006 Projections.
Percent of Persons 65 Years of Age and Older in Texas Counties, 2040*
* Assuming rates of migration equal to 2000-2004
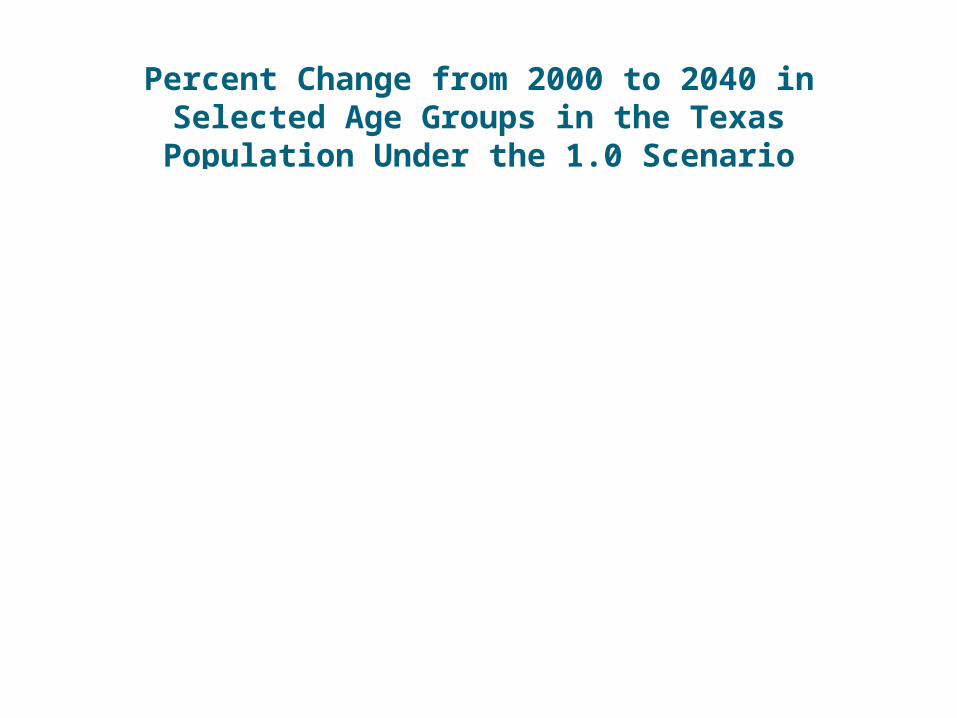
Percent Change from 2000 to 2040 in Selected Age Groups in the Texas Population Under the 1.0
Scenario
88.3
112.0
295.5
<18 years 18 to 24 years 65+ years0.0
50.0
100.0
150.0
200.0
250.0
300.0
350.0Percent Change

Education

Educational Attainment for the Texas Population Age 25 and Older
by Race/Ethnicity, 2009
RaceEthnicity
Population Age 25 and
Older
Less than high
school
High school
diploma
Some college or associates
degreeBachelor or more
Non-Hispanic White 8,026,049 8.3 25.3 32.5 33.9Black 1,705,709 15.0 30.4 36.5 18.1Hispanic* 4,876,517 42.5 25.2 21.4 10.9Asian 580,159 14.2 15.4 17.2 53.2Total 15,361,557 20.1 25.4 28.9 25.5________
Source: U.S. Census, American Community Survey, 2009.
*Includes Hispanic persons of all races.

Percent of Persons 25 Years of Age or Older by Level of Educational Attainment and Race/Ethnicity in 2000 and Projected to 2040* Assuming 1990-2000 Trends in Educational Attainment Rates
*Projections are shown for the 1.0 scenario
12.7
25.7
31.6
30.0
24.0
29.9
30.6
15.5
50.7
22.0
18.4
8.9
21.0
16.1
20.6
42.3
2.2
16.6
33.4
47.8
4.3
25.6
40.5
29.6
32.1
25.8
24.1
18.0
13.4
7.6
11.0
68.0
< High School
High School
Some Coll/Assoc
Bachelor's +
< High School
High School
Some Coll/Assoc.
Bachelor's +
< High School
High School
Some Coll/Assoc
Bachelor's +
< High School
High School
Some Coll/Assoc
Bachelor's +
0.0 10.0 20.0 30.0 40.0 50.0 60.0 70.0 80.0
Percent
2000 2040
Black
Hispanic
Other
Anglo

Ethnic Diversity of the Population Enrolled in Elementary and Secondary Schools in Texas, 2000 and 2040

Ethnic Diversity of the Population Enrolled in Colleges and Universities in Texas, 2000 and 2040

Future Demands for Specific Programs
Source: The New Texas Challenge: Population Change and the Future of Texas
186.8%
119.9%
48.5%
183%
188.1%
64.7%
101.9%
69.9%
Bilingual/ESL
Economically Disadvantaged
Gifted and Talented
Immigrants
Limited English Proficiency (LEP)
Special Education
Title 1
Career and Technology Education
0% 50% 100% 150% 200%
2000-2040 Percent Change
76.2% Elementary and Secondary Enrollment Growth

Socioeconomic Conditions

Median Household Income in 1999 in Texas by Age of Householder
$0
$10
$20
$30
$40
$50
$60
<25 25-34 35-44 45-54 55-64 65-74 75+
Age of Householder
Thousands

Total and Percent of the Texas Population in Poverty and Median Household Income by Race/Ethnicity, 1999 and 2009
1999 2009
Populationin Poverty %
Median Household
Income* Population in Poverty %
Median Household
Income
Anglo 826,459 7.8 $60,839
1,010,170 9.0 $59,836
Hispanic
1,658,434 25.4 $38,536
2,364,407 26.4 $35,628
Black 525,082 23.4 $37,803
630,479 23.1 $35,438
Asian
65,048 11.9 $64,576
105,186 12.1 $63,692
Other 42,586 13.9 NA 40,000 11.9 NA
Total
3,117,609 15.4 $51,506
4,150,242 17.2 $50,043
*In 2009 DollarsSource: U.S. Census Bureau, Census 2000 and American Community Survey, 2009

Average Household Income in Texas, 2000-2040*
(in 2000 Dollars)
* Projections are shown for the 1.0 scenario
$54,441
$52,639
$50,903
$49,326
$47,883
2000 2010 2020 2030 2040$30,000
$40,000
$50,000
$60,000

Texas Latino Labor Force
U.S. Latino wages better than Texas Latino wages– 71% of NH white wages
Texas Latino wages– 64% of NH white wages
If current labor force trends continue by 2040 HH income will be $6,000 less than in 2000

Projected Percent of Households in Poverty by Family Type in Texas, 2000 and 2040
* Projections are shown for the 1.0 scenario
11.4
7.5
15.0
26.7
18.9
14.415.4
11.8
17.0
30.0
18.9
16.6
Family Households
Married Couple
Male Householder
Female Householder
Nonfamily Households
Total Households
0.0
5.0
10.0
15.0
20.0
25.0
30.0
35.0
Percent in Poverty
2000 2040

State Tax Revenues in Texas Proportioned by Race/Ethnicity in 2000 and Projections to 2040* Assuming 2000 Decile Tax Rates

Ethnic Diversity of Household Income and Consumer Expenditures in Texas, 2000 and 2040*
* Projections are shown for the 1.0 scenario
71.2%
8.2%17.3%
3.3%
66.4%
8.7%21.9%
3.0%
38.2%
7.4%
42.8%
11.6%
31.9%7.1%
51.7%
9.3%
Anglo Black Hispanic Other
2000 AggregateHousehold Income
2040 AggregateHousehold Income
2000 Consumer Expenditures
2040 Consumer Expenditures

Group Disparities
Texas’ ethnic group wages lower than Texas NH white wages
Texas native born Hispanics’ wages higher than immigrant wages in Texas

What does all this mean ?
Pain
or
Gain

Generation Gap: Two Pronged Issue
The Old– Non-Hispanic white populations
diminishing
The Young– Hispanic populations rapidly expanding

Consequences of Aging Population
Greater proportion of population in retirement– Fixed income; dwindling resources– Increase in single head of households– Older more established households- less
consumer needs Greater demand for services
– Baby Boomer Syndrome

Consequences of Aging Population
Increase in health care needs– Age = chronicity
Increase need for service providers– Smaller family units – less available help– Greater geographic mobility less proximity to
family care providers– Greater proportion of elders will be childless

Consequences of Increase in Minority Populations
Labor Workforce– Younger workforce– Less experience
Less educated workforce– Lower skilled occupations = Lower wages– Reduced occupation related benefits
Especially health care benefits– Reduced consumerism – Increased government costs

Minority Populations Consequences
Higher fertility rates– 95% of child growth in past decade=Hispanic– 50.2% of public school children in Texas /Hispanic– Larger size households– Greater demand for single family housing– Greater demands on services
health education

Summary Market Consequences
Reduced tax revenues– Increased proportion of taxpayers in retirement
Only 38% of revenues will from non-Hispanic whites– Increased proportion of taxpayers non-Anglo
Younger less experienced Lower levels of formal education
– Increased proportion of taxpayers in Service occupations = lower wages
– Less disposable income for needs

Implications of Low English Proficiency & Education Attainment
High levels of underemployment– Part-time– Seasonal
High levels of unemployment Low-skilled occupations Low-wage occupations
– Low/no benefits– Low/no security
High sensitivity to economic downturns– Last hired – first fired

Advantages of Population Shifts
Greater demand for services The gray/aging population
English-speaking service providersHousing
The brown/younger populationBilingual service providersEducationAffordable housingYounger households – more needs

High Fertility Good for Economy
More people– More demand for goods & services
Pumps up Social Security– Young workers support aging population

Investing in the future
Hispanics can stimulate business– US Latino buying power $870 billion in 2008
Pump-up weak housing markets– 61% of US Latino net worth invested in
homeownership Replenish an aging labor force Revitalize dying communities
– Look at what it has done for the Catholic Church
The 64 Million $ Question
Is Texas willing to educate this population the way it educated the populations in the past?

Latino Family Portrait