Embed Size (px)
Citation preview

31


·-··-·-\
COVER Ver~e Valley of centra! Arizona, June 2010. Photograph by Brandon T. Forbes.
Human Effects on the Hydrologic System of the Verde Valley, Central Arizona, 1910-2005 and 2005-2110, Using a Regional Groundwater Flow Model
By Bradley D. Garner, D.R. Pool, Fred D. Tillman, and Brandon T. Forbes
Prepared in cooperation with the Verde River Basin Partnership and the Town of Clarkdale
Scientific Investigations Report 2013-5029
U.S. Department of the Interior U.S. Geological Survey

U.S. Department of the Interior KEN SALAZAR, Secretary
U.S. Geological Survey Suzette M. Kimball, Acting Director
U.S. Geological Survey, Reston, Virginia: 2013
For product and ordering information: World Wide Web: http:/ /www.usgs.gov/pubprod Telephone: 1-888-ASK-USGS
For more information on the USGS-the Federal source for science about the Earth, its natural and living resources. natural hazards, and the environment: World Wide Web: http://www.usgs.gov Telephone: 1-888-ASK-USGS
Any use of trade. firm, or product names is for descriptive purposes only and does not imply endorsement by the U.S. Government
Although this report is in the public domain, permission must be secured from the individual copyright owners to reproduce any copyrighted material contained within this report.
Suggested citation: Garner. B.D., Pool, D.R., llllman, F.D., and Forbes, B.T .. 2013, Human effects on the hydrologic system of the Verde Valley, central Arizona. 1910-2005 and 2005-2110, using a regional groundwater flow model: U.S. Geological Survey Scientific Investigations Report 2013-5029, 47 p.
\

iii
Contents
Abstract ........................................................................................................................................................... ! Introduction ..................................................................................................................................................... !
Purpose and Scope .............................................................................................................................. 3
Description of the Study Area ............................................................................................................ 3
Physiography ................................................................................................................................ 3 Climate ........................................................................................................................................... 4
Hydrogeology ............................................................................................................................... .4 Human Development of Water Resources .............................................................................. 5
Previous Water-Budget Studies ......................................................................................................... 5
Methods and Approach ................................................................................................................................ 6
The Northern Arizona Regional Groundwater Flow Model ........................................................... 6 Creation of Forward-Looking Model Runs ........................................................................................ 8
Running the Groundwater-Flow Model ............................................................................................. 8 Extraction of Water Budgets ............................................................................................................. ! 0
Calculation of Relative Changes in Water Budgets ...................................................................... 10 Human Effects on the Hydrologic System of the Verde Valley, 1910-2005 and 2005-2110 ............. 10
Groundwater System .......................................................................................................................... 13 Natural Recharge !Inflow, Natural Stress) ............................................................................ 13
Incidental and Artificial Recharge !Inflow, Human Stress) ................................................ 13 Net Underflow !Inflow, Human Stress) .................................................................................. 13
Withdrawal of Groundwater by Pumping !Outflow, Human Stress) .................................. 13
Riparian Evapotranspiration !Outflow, Response) ............................................................... 16 Change in Groundwater Storage ............................................................................................ 16
Net Discharge of Groundwater as Base Flow !Outflow, Response) ................................. 17
Surface-Water System ...................................................................................................................... 18 Base Flow Entering the Verde Valley !Inflow, Response) ................................................... 18
Net Discharge of Groundwater as Base Flow !Inflow, Response) .................................... 19 Ditch Diversions and Crop Irrigation !Outflow, Human Stress) .......................................... 20 Base Flow Exiting the Verde Valley !Outflow, Response) ................................................... 22
Water-Budget Components not Simulated ..................................................................................... 23
Discussion ..................................................................................................................................................... 24 Streamflow Capture ........................................................................................................................... 24
Causes of Changes in Verde Valley Base Flow .............................................................................. 25 Restatement of Central Questions ................................................................................................... 28
Summary ........................................................................................................................................................ 28
References Cited ......................................................................................................................................... .29
Glossary ......................................................................................................................................................... 31

\
iv
Appendix 1. Results of Water Budgets for Model Runs, 1910-2005 and 2005-2110 ......................... 32 Appendix 2. Evapotranspiration by Riparian Vegetation, 2000-2010, Estimated Using Remote
Sensing ............................................................................................................................................ .42
Methods ............................................................................................................................................... .42 Estimates of Monthly ET Across Entire Verde Valley ........................................................... 42
Subselect Areas Where ET is Likely from Groundwater ..................................................... 42
Adjustment for Possible Contributions of Direct Precipitation .......................................... 43
Calculation of Summary Statistics ......................................................................................... .43 Results ................................................................................................................................................. .43
Appendix 3.1rrigation-Water Consumptive Use, 2010, Estimated Using a Crop Inventorying Approach ......................................................................................................................................... 44
Appendix 4. One-Hundred-Year Capture Maps for the Verde Valley .................................................. 45
Figures
1. Map showing the location of the Verde River watershed and Verde Valley ............................. 2 2. Physiographic map of Arizona .......................................................................................................... 4
3. Schematic drawing of generalized hydrogeologic cr0ss sections from the Verde River to San Francisco Mountain, central Arizona ............................................... 5
4. Map of the spatial extent of the Northern Arizona Regional Groundwater Flow Model and study area of this report ................................................................................. 6
5. Conceptual diagram showing a 3-layer grid representing a groundwater-flow model's spatial discretization ..................................................................................................... 7
6. Plots showing natural and human stresses in the Verde Valley through time .......................... 7
7. Plots showing rates of natural and human stresses, 2005-2110 ................................................. 9
8. Diagrams showing water budget for Verde Valley, central Arizona, 2005 ............................... 11 9. Map showing underflow and base flow into and out of the Verde Valley ............................... 15
10. Map showing relative changes in groundwater-table altitude attributable to unchanged human stresses ................................................................................................. 17
11. Plots of base flow simulated by the Northern Arizona Regional Groundwater Flow Model in the Verde River at Clarkdale ........................................................................... 18
12. Plots showing changes in base flow and net groundwater discharge attributable to human stresses, 2005-2110 .................................................................................................. 20
13. Plots showing net groundwater discharge for 1910-2005 ......................................................... 21
14. Conceptual diagram of an idealized perennial stream with an active irrigation system of ditch diversions and irrigation ............................................................................... .21
15. Plots of base flow simulated by the Northern Arizona Regional Groundwater Flow Model in the Verde River near Camp Verde ................................................................. 23
16. Conceptual plot showing the sources of water to a pumped well through time .................... 24
17. Photograph of surface-water diversion dam typical of Verde Valley ditch diversion sys-tems ............................................................................................................................................... 27
18. Time-series plot showing discharge at Verde River near Camp Verde .................................... 27
3.1. Consumptive use of irrigation water in the Verde Valley ............................................................ 44

v
4.1. Map showing computed reduction in flow of streams and springs and reduction in riparian evapotranspiration as a fraction of pumping rate, model layer 1 .................. .46
4.2 Map showing computed reduction in flow of streams and springs and reduction in riparian evapotranspiration as a fraction of pumping rate, model layer 2 .................. .46
4.3 Map showing computed reduction in flow of streams and springs and reduction in riparian evapotranspiration as a fraction of pumping rate, model layer 3 ................... 47
Tables
1. Description of five instances of running the Northern Arizona Regional Groundwater Flow Model for this study .................................................................................... 8
2. Groundwater and surface-water budgets (2005) and relative changes of water-budget values attributable to human stresses (191 0-2005) .............................................................. 12
3. Relative change of groundwater and surface-water budgets between 2005 and 2110 attributable to human stresses ................................................................................................. 14
4. Summary of annual, winter, and summer base-flow values at USGS streamflow-gaging stations from this and related studies ..................................................................................... 19
5. Inventory of USGS streamflow-gaging stations within the Verde River groundwater basin ..................................................................................................................... 25
1.1. Results of groundwater-flow model simulation, 1910-2005 ....................................................... 32
1.2. Relative changes in water-budget components attributable to human stresses, 1910-2005, based on a groundwater-flow model .................................................................. 34
1.3. Relative changes in water-budget components attributable to human stresses, 2005-2110, based on a condition of decreased human stresses ...................................... 36
1.4. Relative changes in water-budget components attributable to human stresses, 2005-2110, based on a condition of unchanged human stresses ...................................... 38
1.5. Relative changes in water-budget components attributable to human stresses, 2005-2110, based on a condition of increased human stresses ......................................... 40
2.1. Riparian evapotranspration estimated by using remotely sensed satellite data, 2000-2010 .................................................................................................................................... .43
Sidebars
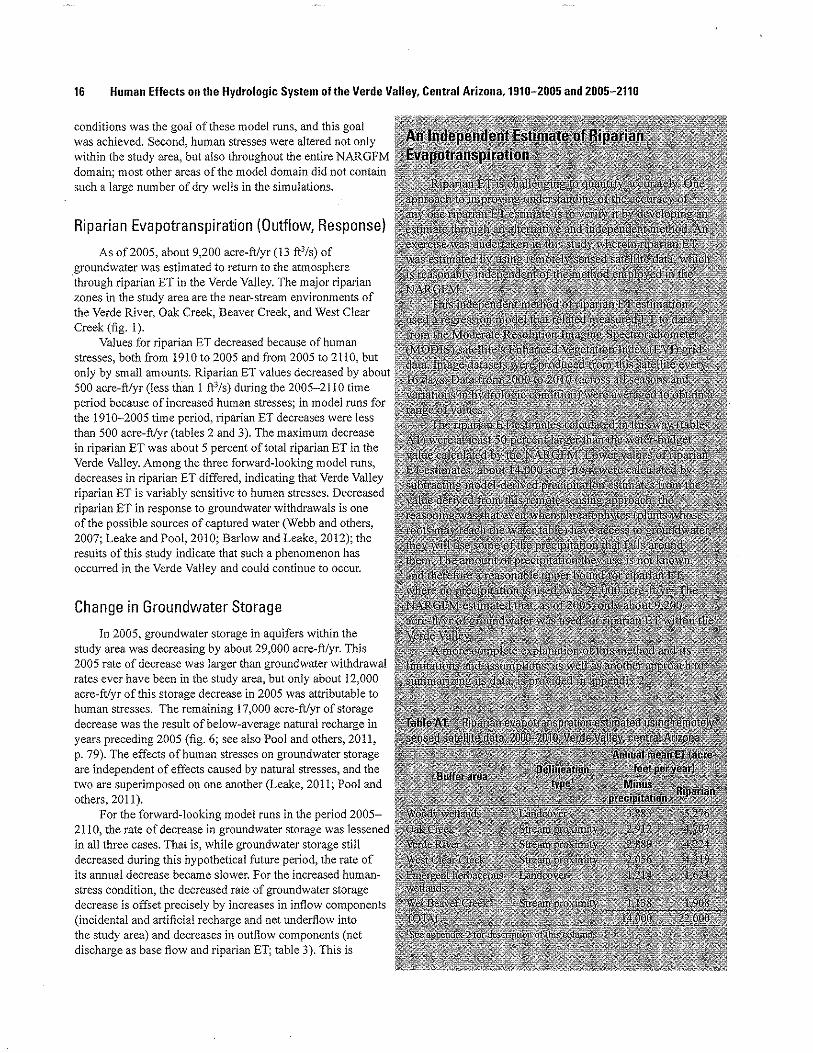
A. An Independent Estimate of Riparian Evapotranspiration ........................................................... 16
Table A 1. Riparian evapotranspration estimated using remotely sensed satellite data, 2000-2010 ...................................................................................................... 16
B. An Independent Estimate of Crop Irrigation Consumptive Use ................................................... 22
Table 81. Irrigated acreage and estimates of consumptive water use for the summer 2010 growing season ............................................................................................. 22
C. Capture Maps-Another Approach to Understanding Streamflow Capture ............................ 26
Figure C1. Map showing computed reduction in flow of streams and springs and reduction in riparian evapotranspiration ..................................................... ., ................... 26

vi
Conversion Factors Multiply By To obtain
inch (in.) 2.54 centimeter (em)
inch (in.) 25.4 millimeter (nun)
foot (ft) 0.3048 meter (m)
mile(mi) 1.609 kilometer (km)
Area
acre 4,047 square meter (m2)
acre 0.4047 hectare (ha)
acre 0.4047 square hectometer (lun2)
acre 0.004047 square kilometer (km2)
square mile (mP) 259.0 hectare (ha)
square mile (mil) 2.590 square kilometer (km2)
Volume
acre~foot (acre-ft) 1,233 cubic meter (m3)
acre~foot (acre-ft) 0.001233 cubic hectometer (hm3)
Flow rate
acre-foot per year ( acre-:ftJyr) 1,233 cubic meter per year (m3/yr)
acre-foot per year (acre-ftfyr) 0.001233 cubic hectometer per year (hm3/yr)
acre-foot per year (acre-ft/yr) 0.001380 cubic foot per second (ft3/s)
cubic foot per second (ft3/s) 0.02832 cubic meter per second (m3/s)
inch per hour (in/h) 0.0254 meter per hour (mlh)
Temperature in degrees Celsius (OC) may be converted to degrees Fahrenheit (°F) as follows: °F=(l .8 °C)+32 Temperature in degrees Fahrenheit ("F) may be converted to degrees Celsius eq as follows: "<>("F-32)/l .8 Vertical coordinate information is referenced to the North American Vertical Dattun of 1988 (NA VD 88). Horizontal coordinate infonnation is referenced to the North American Datum of 1983 (NAD 83). Altitude, as used in this report, refers to distance above the vertical datum.

Human Effects on the Hydrologic System of the Verde Valley, Central Arizona, 1910-2005 and 2005-2110, Using a Regional Groundwater Flow Model
By Bradley D. Garner, D.R. Pool, Fred D. Tillman, and Brandon T. Forbes
Abstract
Water budgets were developed for the Verde Valley of central Arizona in order to evaluate the degree to which human stresses have affected the hydrologic system and might affect it in the future. The Verde Valley is a p011ion of central Arizona wherein concerns have been raised about water availability, particularly perennial base fiov·.r of the Verde River. The Northern Arizona Regional Groundwater Flow Model (NARGFM) was used to generate the water budgets and was run in sevefal configurations for the 1910-2005 and 2005-2110 time periods. The resultant water budgets were subtracted from one another in order to quantify the relative changes that were attributable solely to human stresses; human stresses included groundwater withdrawals and incidental and artificial recharge but did not include, for example, human effects on the global climate. Three hypothetical and varied conditions of human stresses were developed and applied to the model for the 2005-2110 period. On the basis of this analysis, human stresses during 1910'-2005 were found to have already affected the hydrologic system of the Verde Valley, and human stresses will continue to affect the hydrologic system during 2005-2!1 0. Riparian evapotranspiration decreased and underflow into the Verde Valley increased because of human stresses, and net groundwater discharge to the Verde River in the Verde Valley decreased for the 1910-2005 model runs. The model also showed that base flow at the upstream end of the study area, as of 2005, was about 4,900 acre-feet per year less than it would have been in the absence of human stresses. At the downstream end of the Verde Valley, base flow had been reduced by about I 0,000 acre-feet per year by the year 2005 because of human stresses. For the 2005-21!0 period, the model showed that base flow at the downstream end of the Verde Valley may decrease by an additional 5,400 to 8,600 acre-feet per year because of past, ongoing, and hypothetical future human stresses. The process known as capture (or streamflow depletion caused by the pumping of groundwater) was the reason for these human-stress-induced changes in waterbudget components.
Introduction
The Verde Valley of central Arizona has experienced population growth that has led to increased water demands. These water demands are met through surface-water diversions and groundwater withdrawals from local and regional aquifers .. Because the human population is expected to continue to grow in the region (Arizona Department of Administration, 2012\ concerns have been raised about past, present, and future human-induced stresses on the hydrologic system. The tetm "Verde Valley'' is informal-more geomorphic than hydrologic in its connotation-therefore, for this report the Verde Valley is defined as the 1,500-mi' area of the Verde Valley subbasin located between two streamflowgaging stations operated by the U.S. Geological Survey (USGS; fig. I). The upstream gage is the Verde River near Clarkdale, Arizona (station identifier 09504000; hereafter, the Clarkdale gage) and the downstream gage is the Verde River near Camp Verde, Arizona (station identifier 09506000; hereafter, the Camp Verde gage).
The USGS, in cooperation with the Verde River Basin Partnership and the Town of Clarkdale, Arizona, undertook a study of the Verde Valley tl10t calculated a water budget for the year 2005 and explored the effects of past and possible future human stresses on the hydrologic system of the Verde Valley and northern Arizona. This report, which is a presentation of those findings, may aid resource managers and policymakers concerned about water availability in the Verde River watershed.
Human alterations to a hydrologic system can be described, in the most general -sense, as stresses. Stresses to hydrologic systems produce responses, either directly or indirectly. Withdrawing water from a surface-water stream produces a direct response: a decrease in the downstream rate of streamflow and a decrease in surface-water stage. Pumping of groundwater, by contrast, produces both direct and indirect responses. A direct response is the lowering of the groundwater altitude in and around the pumped well. An indirect response is the decrease in discharge or increase in recharge to the groundwater system that eventually must occur in order to offset the amount of groundwater withdrawn (also

2 Human Effects on the Hydrologic System of the Verde Valley, Central Arizona, 1910-2005 and 2005-2110
EXPLANATION
Boundary of study area
Boundary of Arizona Department of Water Resources groundwater subbasin
AM~ ·A' Approximate line of section in fig. 3
09504000 USGS streamflow-gaging station A and station identifier I see table 5)
0
0
10 20 MILES
10 20 KILOMETERS
A ;
Base modified from U.S. Geological Survey digital data, 1:100,000,1982 Universal Transverse Mercator projection, Zone 12
Figure 1. Map showing the location of the Verde River watershed and Verde Valley, central Arizona.

known as capture or streamflow depletion; see Theis, 1940; Leake and Pool, 20 I 0; Leake, 20 I I; Barlow and Leake, 20 12).
A water budget can aid understanding of stresses, direct responses, and indirect responses to a hydrologic system by expressing the general availability of water in a given area through accounting. Because water budgets use the same accounting principles as those used in financial accounting, they can be understo-od by people with a variety of scientific and nonscientific backgrounds. For the purposes of this study, stresses were divided into natural stresses and human stresses to the hydrologic system. Natural stresses consisted of natural recharge to the groundwater system. Human stresses included groundwater withdrawals by pumping, incidental and artificial recharge, and consumptive use of surface water through irrigation; each of these processes can produce responses (changes) in water-budget components.
Among the many water-budget components in the Verde Valley, there is particular interest in base flow of the Verde River and how it responds to human stresses. Base flow is that portion of a stream's flow not attributable to surface runoff. Verde River base flow is sustained by groundwater discharging from local and regional aquifers (Owen-Joyce and Bell, 1983; Owen-Joyce, 1984; Dingman, 2002; Blasch and others, 2006; Leake and Pool, 201 0; Garner and Bills, 2012): Given that stresses imposed on aquifers supplying base flow to the Verde River eventually can manifest as changes in Verde River base flow, the central questions addressed in this report are:
1. How have human stresses on the hydrologic system affected Verde River base flow?
2. How have human stresses outside the Verde Valley affected base flow within the Verde Valley?
3. How might future human stresses to the hydrologic system affect Verde River base flow?
Purpose and Scope
The purpose of this report is to describe the results of an investigation of how human stresses have affected and might yet affect the hydrologic system of the Verde Valley, Arizona. Specifically, this report quantifies the relative effects of human stresses on various components of the Verde Valley water budget, both over the 95-year period from 1910 to 2005, and into the future (2005-211 0). Particular emphasis is placed on water~budget components related to base flow in the Verde River. Water budgets in this report are derived entirely from the Northern Arizona Regional Groundwater Flow Model (NARGFM); limitations of and assumptions implicit to the NARGFM (see Pool and others, 2011) apply also to this report. Not all components of the hydrologic cycle were simulated by the NARGFM; unsimulated components are discussed briefly.
Summaries of field and remote-sensing investigations of certain water-budget components are presented in appendixes
Introduction 3
2-4. The results of these investigations serve as independent means for assessing the reasonableness of water-budget values derived from the NARGFM.
The U.S. Geological Survey and Verde River Basin Partnership (2009) developed a hydrology science plan for canying out scientific studies in the Verde River Basin as called for in Federal Public Law 109-110, Title II (U.S. Congress, 2005). This report fulfills Section 204(b) of Title II and parts of work elements 1, 2, and 3 of that hydrology science plan.
Description of the Study Area
The study area is the Verde Valley of central Arizona (fig. 1). As described in the ''Introduction" section, for the purposes ofthis report the Verde Valley is defined precisely with respect to two USGS streamflow-gaging stations on the Verde River (the upstream Clarkdale gage and downstream Camp Verde gage). The Verde River is a perennial stream that ftO\:vs generally from northwest to southeast through the Verde Valley. Three perennial tributaries in the Verde Valley-Oak Creek, Beaver Creek, and West Clear Creek (fig. 1)-also contribute perennial 'flow to the Verde River (Gamer and Bills, 20 I2). The study area is entirely within the Arizona Department of Water Resources (ADWR) "Verde Valley subbasin of the Verde River groundwater basin" (Blasch and others, 2006), with the lightly populated portion of that subbasin upstream of the Clarkdale gage excluded from the study area 1•
Physiography
The Verde Valley is in the Transition Zone of Arizona, a province containing features of both the Colorado Plateau and Basin and Range physiographic provinces (Fenneman~ 1931). Most of the study area lies within a north-northwest trending basin associated with Tertiary Basin and Range tectonism (fig. 2). Normal faulting associated with this tectonism lowered the basin floor relative to surrounding terrain~ downfaulting pre-Basin-and-Range rocks, which subsequently were buried by hundreds of feet of alluvial and lacustrine sediments derived from erosion of the surrounding higher elevation terrain.
Part of the study area along the Oak Creek drainage system extends into the Colorado Plateau physiographic province. The Colorado Plateau is a relatively flat and tectonically stable region (Barrs, I983) consisting of thick sequences of relatively fiat-lying Paleozoic and Mesozoic rocks that in places are capped by Cenozoic sedimentary or volcanic deposits. Depths to water are considerably greater on the plateau than in the Transition Zone~ and there is no major perermia1 streamflow on the surface of the plateau within the study area.
1 The ArcHydro watershed~delineation software was used to determine the boundary of this area excluded from the study area.

4 Human Effects on the Hydrologic System ofthe Verde Valley, Central Arizona, 1910-2005 and 2005-2110
Climate
The study area climate is semiarid to arid, except for small areas of high elevation that are humid (Blasch and others, 2006). Precipitation typically is greater at higher elevations than lower elevations; winter snow is common above 5,000 ft. The central, lower elevation part of the study area-including municipalities such as Cottonwood and Camp Verde-receives less precipitation than higher elevation areas; it experiences mild winters and hot summers with daytime summer temperatures commonly exceeding 100 °F.
Precipitation occurs primarily during the summer North American monsoon and in winter frontal storms (Adams and Comrie, !997; Blasch and others, 2006). The summer monsoon is characterized by generally short (less than a few hours), intense (greater than I inch per hour), and localized thunderstorms. Winter storms characteristically are longer (!2-48 hours), less intense (less than 0.25 inch per hour), more regional in extent, and contribute more recharge to the study area than summer monsoon stortns (Blasch and others, 2006).
Hydrogeology
Groundwater in the study area generally originates as precipitation in higher elevation areas that percolates downward through the earth to the water table, flows through aquifers, and discharges in three possible ways: as discharge to streams that supports base flow, through near-stream riparian evapotranspiration (ET), or by pumping from wells. The largest amounts of recharge to the groundwater system occur along the Mogollon Rim (Blasch and others, 2006; Pool and others, 2011 ). Additional recharge can occur from streams where water levels in the streams are above the groundwater table and sediments are sufficiently penneable.
Groundwater flows through four aquifers within the study area (fig. 3). The deepest aquifer is the Redwall aquifer (sometimes called the R aquifer; Cooley and others, 1969), which is primarily a limestone aquifer resting on Proterozoic crystalline bedrock. The Redwall aquifer underlies almost all of the study area. The Coconino aquifer (or C aquifer; Cooley and others, 1969) is stratigraphically above the Red wall aquifer and its major water-bearing unit is the Coconino Sandstone. Other geologic formations within the Coconino aquifer include the Kaibab Formation, Toroweap Formation, Schnebly Hill Formation, and the upper and middle Supai Fortnations (Pool
Redwall aquifers. The Verde Formation has variable lithology because it consists of the weathering products of diverse parent rocks, its depositional environment varied between fluvial and lacustrine (Twenter and Metzger, 1963, p. 76), and intermittent volcanic activity during deposition produced interbedded volcanic and sedimentary rocks (Owen-Joyce and Bell, 1983). In general, in the Verde Formation coarse-grained facies produce useable amounts of water for wells, and fine~ grained facies yield little water. Finally, narrow stringers of Quaternary alluvium are located along major stream channels in the Verde Valley and may contain localized aquifers that can produce economically important quantities of water (Twenter and Metzger, 1963). These alluvial deposits can be pathways for discharge of groundwater from underlying aquifers, and they also can be locations of recharge from streams and ditch diversions (Garner and Bills, 2012).
Groundwater also flows into and out of the study area in the subsurface, as study-area boundaries do not necessarily coincide with groundwater divides associated with each aquifer. This subsurface flow is described as underflow, and its magnitude and direction can be affected by human stresses, similar to other water-budget components.
0 50 100 KilOMETERS and others, 2011). The geologic formations associated with the Coconino aquifer are not saturated everywhere within the study area. Within the Verde Valley, the Verde Fortnation is stratigraphically above the Coconino and
Figure 2. Physiographic map of Arizona. Modified from Fenneman (1931 ); original drawing by Dr. Guy-Harold Smith (1895--1976), cartographer and emeritus professor of geography, Ohio State University.

Human Development of Water Resources
The Verde Valley has grown in population in recent decades (U.S. Census Bureau, 2011). In 2000, about 63,000 people lived in the Verde Valley. By 2010, about 71,000 lived in the Verde Valley, a 13-percent increase in 10 years. The Verde Valley is considered to be a rural part of Arizona, and it is not within any of the State water-resource management areas known as Active Management Areas (which were identified and designated by the State as historically having heavy reliance on mined groundwater; Arizona Department of Water Resources, 2012).
Residents of the Verde Valley use a combination of groundwater and surface water to meet their water demands (Blasch and others, 2006). Groundwater generally has been the source of water for domestic and municipal water uses since 1940 (Tadayon, 2005; also see the "Northern Arizona Regional Groundwater Flow Model" section). Residents in outlying areas commonly rely on private wells or community water suppliers as their source of domestic water. Municipalities such as Camp Verde, Clarkdale, Cottonwood, and Sedona (fig. I) use public-supply wells for their municipal water-supply needs.
Surface water from perennial streams is used mostly to irrigate cultivated fields. More than 67 diversions in the Verde Valley deliver surface water to agricultural fields and residential customers (Garner and Bills, 2012). The largest diversions are gravity-fed ditches along the Verde River~ some of which divett nearly all available base flow away from the
Introduction 5
river for half of the year or longer. Ditch diversions have altered the hydrology of the Verde Valley considerably, and many of these have been diverting water for more than 120 years. Ditch diversions present a substantial complication for the understanding of hydrologic processes in the Verde Valley (Garner and Bills, 2012). For the purposes of this study, the many and varied hydrologic processes comprised in the operation of ditch diversions are lumped together~ with only' the net effect of diversions on surface-water :flow being considered. This is necessary because the hydrology of these ditch diversions, to date, has not been studied comprehensively.
Previous Water-Budget Studies
Twenter and Metzger (1963) provided a broad overview of Verde Valley hydrology, including measurements of streamflow and base flow of the Verde River and tributary streams~ some documentation of the effects that diversions and ET have on streamflow, and a partial water budget. Some of their numerical methods were not documented in detail, making comparisons with their values difficult. Owen-Joyce and Bell (1983) described water resources in an area generally coincident with the Verde Valley subbasin; they included a water budget for the area and calculations of seasonal base flow at the Clarkdale gage and Camp Verde gage. Owen-Joyce (1984) described the hydrology of the stream-aquifer system near Camp Verde, included a water budget for the alluvial
EXPLANATION
Quaternary stream alluvium Holocene to late Pliocene basaltic rocks Tertiary Verde Formation Triassic Moenkopi Formation Permian sedimentary rocks
Permian and Pennsylvanian sedimentary rocks
I~Ni~ Missis~ippian: Devonian, and ' - "~ Cambnan sedimentary rocks
Precambrian rocks
Generalized regional water table
~ Generalized direction of groundwater flow ..:::.,_. . . . . --:=::;;- FAULT-Arrows 1nd1cate d1rect10n of movement
A A' Letters indicating line of section on fig. 1
Approximate boundary between model layers 1 and 2 (depth varies across study area)
Figure 3. Schematic drawing of generalized hydrogeologic cross sections from the Verde River to San Francisco Mountain, central Arizona. Modified from Blasch and others (2006). Correspondence between geological layers and modeled layers in the Northern Arizona Regional Groundwater Flow Model is indicated.
6 Human Effects on the Hydrologic System of the Verde Valley, Central Arizona, 1910-2005 and 2005-2110
aquifer hydraulically connected to the river, and estimated base flow for the Camp Verde gage.
Arizona Department of Water Resources (2000, 2009) compiled extensive water-resource data for the upper and middle Verde River subbasins, including tables of groundwater withdrawals that constitute partial water~ budget information. Hart and others (2002) published base flow and spring-discharge rates for the Coconino aquifer, which also constitute partial water-budget information for the Verde River watershed. Blasch and others (2006) presented annual average water budgets for the entire Verde Valley subbasin, an area larger than the study area of this repmt (fig. 1).
Leake and Pool (20 I 0) examined how groundwater withdrawals and incidental recharge can affect connected surface-water features in the Verde Valley. The methods of Leake and Pool (2010) were used in appendix 4 of this repott to develop 'figures that encompass a longer time period and an additional aquifer. Pool and others (20 II) presented predevelopment and 2005 water budgets for an area nearly coincident with the Verde Valley as defined in this report. The regional groundwater~ flow model documented by Pool and others (2011) is the central analysis tool used in this report.
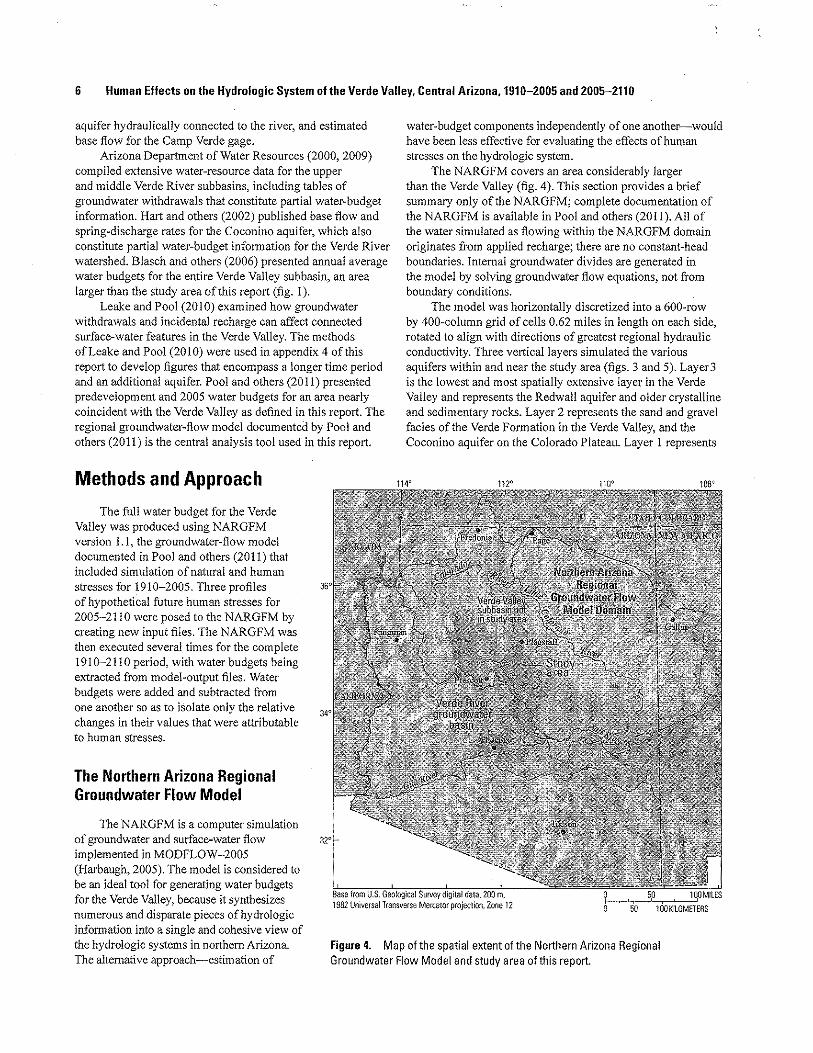
Methods and Approach
The full water budget for the Verde Valley was produced using NARGFM version 1.1, the groundwater~flow model documented in Pool and others (2011) that included simulation of natural and human stresses for 1910-2005. Three profiles of hypothetical future human stresses for 2005-2110 were posed to the NARGFM by creating new input files. The NARGFM was then executed several times for the complete 1910-2110 period, with water budgets being extracted from model-output files. Water budgets were added and subtracted from one another so as to isolate only the relative changes in their values that were attributable to human stresses.
The Northern Arizona Regional Groundwater Flow Model
water-budget components independently of one another-would have been Jess effective for evaluating the effects of human stresses on the hydrologic system.
The NARGFM covers an area considerably larger than the Verde Valley (fig. 4). This section provides a brief summary only of the NARGFM; complete documentation of the NARGFM is available in Pool and others (2011 ). All of the water simulated as flowing within the NARGFM domain originates from applied recharge; there are no constant-head boundaries. Internal groundwater divides are generated in the model by solving groundwater flow equations, not from boundary conditions.
The model was horizontally discretized into a 600-row by 400-column grid of cells 0.62 miles in length on each side, rotated to align with directions of greatest regional hydraulic conductivity. Three vertical layers simulated the various aquifers within and near the study area (figs. 3 and 5). Layer3 is the lowest and most spatially extensive layer in the Verde Valley and represents the Redwall aquifer and older crystalline and sedimentary rocks. Layer 2 represents the sand and gravel facies of the Verde Formation in the Verde Valley, and the Coconino aquifer on the Colorado Plateau. Layer 1 represents
The NARGFM is a computer simulation of groundwater and surface-water flow implemented in MODFLOW-2005 (Harbaugh, 2005). The model is considered to be an ideal tool for generating water budgets for the Verde Valley, because it synthesizes numerous and disparate pieces of hydrologic information into a single and cohesive view of the hydrologic systems in northern Arizona. The alternative approach-estimation of
Figure 4. Map of the spatial extent of the Northern Arizona Regional Groundwater Flow Model and study area of this report.
the unconfined fluviolacustrine facies ofthe Verde Formation and shallow Quatemary stream alluvium.
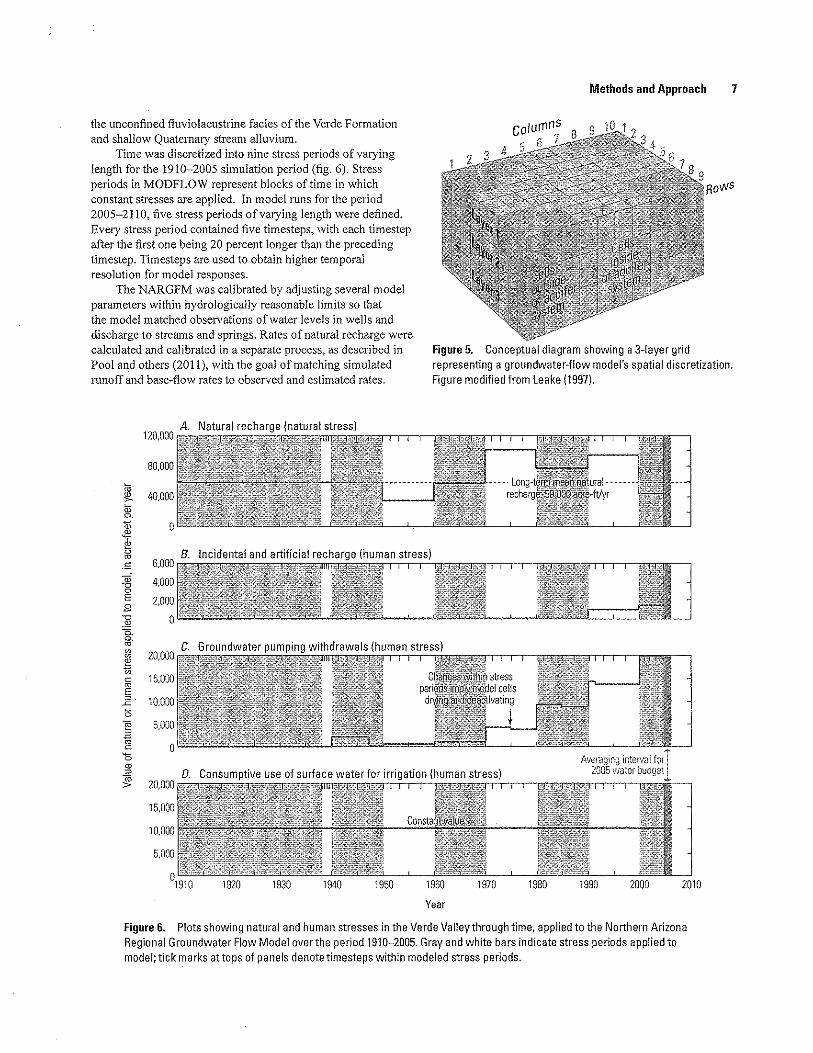
Time was discretized into nine stress periods of vmying length for the 1910-2005 simulation period (fig. 6). Stress periods in MODFLOW represent blocks oftime in which constant stresses are applied. In model runs for the period 2005-2110, five stress periods of varying length were defined. Every stress period contained five timesteps. with each timestep after the first one being 20 percent longer than the preceding timestep. Timesteps are used to obtain higher temporal resolution for model responses.
The NARGFM was calibrated by adjusting several model parameters within hydrologically reasonable limits so that the model matched observations of water levels in wells and discharge to streams and springs. Rates of natural recharge were calculated and calibrated in a separate process, as described in Pool and others (2011), with the goal of matching simulated runoff and base-flow rates to observed and estimated rates.
120,000 A. Natural recharge (natural stress)
80,000
l 40,000
0
Methods and Approach 7
Figure 5. Conceptual diagram showing a 3-layer grid representing a groundwater~f!ow model's spatia! discretization. Figure modified from Leake (1997).
6,000 8. Incidental and artificial recharge (human stress)
4,000
2,000
0
Year
Figure 6. Plots showing natural and human stresses in the Verde Valley through time, applied to the Northern Arizona Regional Groundwater Flow Model over the period 1910-2005. Gray and white bars indicate stress periods applied to model; tick marks attops of panels denote timesteps within modeled stress periods.
8 Human Effects on the Hydrologic System of the Verde Valley, Central Arizona,1910-2005 and 2005-2110
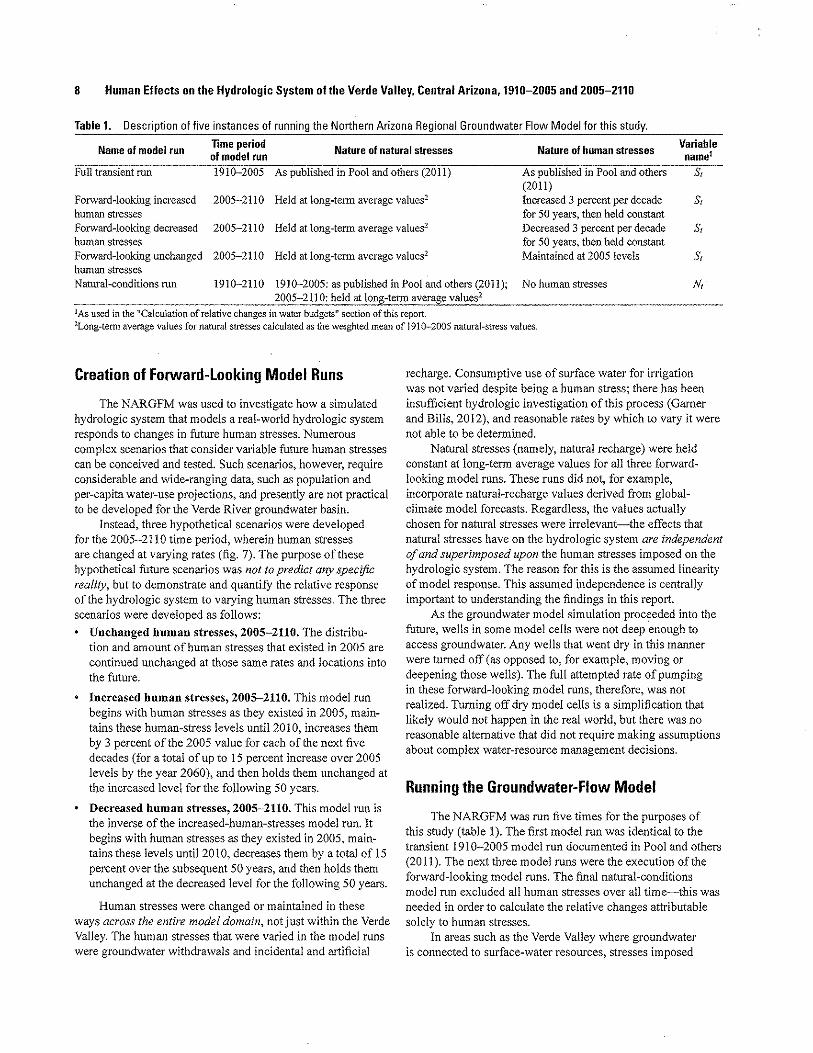
Table 1. Description of five instances of running the Northern Arizona Regional Groundwater Flow Model for this study.
Name of model run lime period
Nature of natural stresses Nature of human stresses Variable
of model run name1
Full transient run 1910-2005 As published in Pool and others (2011) As published in Pool and others s, (20II)
Forward-looking increased 2005-2110 Held at long-term average values2 Increased 3 percent per decade s, human stresses for 50 years, then held constant Forward-looking decreased 2005-2IIO Held at long-term average values2 Decreased 3 percent per decade s, human stresses for 50 years, then held constant Forward-looking unchanged 2005-2110 Held at long-term average values2 Maintained at 2005 levels s, human stresses Natural-conditions run 1910-2110 No human stresses N,
1As used in the "Calculation of relative changes in water budgets" section of this report. 2Long-tenn average values for natural stresses calculated as the weighted mean of 1910--2005 natural-stress values.
Creation of Forward-Looking Model Runs
The NARGFM was used to investigate how a simulated hydrologic system that models a real-world hydrologic system responds to changes in future human stresses. Numerous complex scenarios that consider variable future human stresses can be conceived and tested. Such scenarios~ however, require considerable and wide-ranging data} such as population and per-capita water-use projections, and presently are not practical to be developed for the Verde River groundwater basin.
Instead, three hypothetical scenarios were developed for the 2005-2110 time period, wherein human stresses are changed at varying rates (fig. 7). The purpose of these hypothetical future scenarios was not to predict any specific reality, but to demonstrate and quantifY the relative response of the hydrologic system to varying human stresses. The three scenarios were developed as follows:
Unchanged human stresses, 2005-2110. The distribution and amount of human stresses that existed in 2005 are continued unchanged at those same rates and locations into the future.
Increased human stresses, 2005--2110. This model run begins with human stresses as they existed in 2005, maintains these human-stress levels until 2010, increases them by 3 percent of the 2005 value for each of the next five decades (for a total of up to 15 percent increase over 2005 levels by the year 2060), and then holds them unchanged at the increased level for the following 50 years.
Decreased human stresses, 2005--2110. This model run is the inverse of the increased-human-stresses model run. It begins with human stresses as they existed in 2005, main~ tains these levels until2010, decreases them by a total of 15 percent over the subsequent 50 years, and then holds them unchanged at the decreased level for the following 50 years.
Human stresses were changed or maintained in these ways across the entire model domain, not just within the Verde Valley. The human stresses that were varied in the model runs were groundwater withdrawals and incidental and artificial
recharge. Consumptive use of surface water for irrigation was not varied despite being a human stress; there has been insufficient hydrologic investigation of this process (Garner and Bills, 2012), and reasonable rates by which to vary it were not able to be determined.
Natural stresses (namely, natural recharge) were held constant at long-tenn average values for all three forwardlooking model runs. These runs did not, for example, incorporate natural-recharge values derived from globalclimate model forecasts. Regardless, the values actually chosen for natural stresses were irrelevant-the effects that natural stresses have on the hydrologic system are independent of and superimposed upon the human stresses imposed on the hydrologic system. The reason for this is the assumed linearity of model response. This assumed independence is centrally important to understanding the findings in this report.
As the groundwater model simulation proceeded into the future, wells in some model cells were not deep enough to access groundwater. Any wells that went dry in this manner were turned off(as opposed to, for example, moving or deepening those wells). The full attempted rate of pumping in these forward-looking model runs, therefore, was not realized. Turning off dry model cells is a simplification that likely would not happen in the real world, but there was no reasonable alternative that did not require making assumptions about complex water-resource management decisions.
Running the Groundwater-Flow Model
The NARGFM was run five times for the purposes of this study (table 1). The first model run was identical to the transient 1910-2005 model run documented in Pool and others (2011). The next three model runs were the execution of the forward-looking model runs. The final natural-conditions model run excluded all human stresses over all time-this was needed in order to calculate the relative changes attributable solely to human stresses.
In areas such as the Verde Valley where groundwater is connected to surface-water resources, stresses imposed

120,000
80,000
40,000
0
25,000
20,000
15,000
10,000
5,000
0
15,000
10,000
5,000
0
A. Natural recharge (natural stress)
C. Groundwater pumping withdrawals (human stress)
D. Consumptive use of surface water for irrigation (human stress)
2010 2020 2030 2040 2050 2060
Year
2070
Methods and Approach 9
2080 2090 2100 2110
Figure 7. Plots showing rates of natural and human stresses, 2005-2110, applied to the Northern Arizona Regional Groundwater Flow Model under three scenarios for Verde Valley, Arizona. Shown are both the attempted rates of stresses and the realized rates that could be supported by the model simulation; the two differ because some model cells went dry. Gray and white bars indicate stress periods applied to model; tick marks at tops of panels denote timesteps within modeled stress periods,

10 Human Effects on the Hydrologic System ofthe Verde Valley, Central Arizona, 1910-2005 and 2005-2110
outside of the study area can cause responses in water-budget components within the study area. For this reason) an area much larger than the Verde Valley was simulated by the NARGFM (fig. 4).
Extraction of Water Budgets
Water budgets were extracted from the NARGFM by running ZONEBUDGET, a computer code that processes MODFLOW output files to generate water budgets for groupings of model cells known as zones (Harbaugh, 1990). One zone was defined to coincide with the study area. Adjacent zones were delineated so that surface-water and groundwater fluxes into and out of the study area could be quantified individually.
Value·s in water budgets are fluxes-volumes per unit_of time-and in this report are presented in acre-feet per year (acre-ft!yr) and cubic feet per second (ft3/s). Values greater than 10,000 acre-ft are rounded to the nearest 1,000 acre-ft, all others to the nearest 100 acre-ft. Values in ft3/s are rounded to the nearest whole number, and correspond to the amount of water that would have to flow at a constant rate for a year to equal the equivalent acre-ft/yr value. Because of rounding, water budgets may appear not to perfectly balance.
Water budgets in this report are presented in several ways. Visual diagrams use boxes and arrows to represent reservoirs and conveyances, respectively. Each arrow corresponds to a value in a water budget. Tables list waterbudget components on rows, grouped by inflows, outflows, and changes in storage. Maps are used to show the spatial distribution of some water-budget components. Finally, equations are defined in order to explain how water budgets are subtracted from one another when investigating changes attributable to human stresses.
Calculation of Relative Changes in Water Budgets
As published, the NARGFM simulates both natural and human stresses and the responses of the hydrologic system to those stresses. To investigate human stresses by themselves, a simple set of equations was employed to subtract the effects that natural stresses have on waterbudget components, leaving as a residual only the relative changes in water-budget components attributable to human stresses. This approach requires an assumption of linearity in the simulated systems, which is a common technique of groundwater-flow investigation (Leake and Reeves, 2008;
·Barlow and Leake, 2012). This method for calculating relative changes attributable to human stresses can be described by the following equations:
A,= S,- (N,-N0), (1)
(2)
where A, is a water budget that has been adjusted to show only the
effects of human stresses; S
1 is a water budget for a full model run at time t;
Ntis a natural-conditions water budget at timet (derived from a model run containing no human stresses, see the "Running the Groundwater-Flow Model" section);
N0 is a natural-conditions water budget for a baseline year, either 1910 or 2005, depending on the period of analysis;
A0 is an adjusted water budget for a baseline year, either 1910 or 2005 depending on the period of analysis; and
AA1
is the relative change in water-budget values, relative to either 1910 or 2005, that can be attributed to human stresses.
Substituting equation (1) into equation (2):
M, = (S, -N, + N0)- (S0 -N0 + N0),
(3)
where S0 is a full water budget for a baseline year, either 1910 or
2005. In this report, any discussion of relative changes in water
budgets attributable to human stresses refers to the tenn AAr Full numeric results may be found in appendix 1, with values for S, in table Ll and values forM, in tables 1.2 through 1.5.
Human Effects on the Hydrologic System of the Verde Valley, 1910-2005 and 2005-2110
Human stresses between 1910 and 2005 were found to have affected the hydrologic system of the Verde Valley, and human stresses likely will continue to affect the hydrologic system between 2005 and 2110. Effects on water-budget components mostly were associated with capture (Barlow and Leake, 2012), which is discussed in the "Discussion" section.
In the ensuing sections, the hydrologic system is evaluated with resped to its water-budget components in as many as three ways:
L The magnitude of the component as of2005 conditions (fig. 8; table 2);
2. The relative change from 1910-2005 attributable to human stresses (table 2); and
3. The relative changes from 2005-2110 attributable to human stresses, under three varying human-stress conditions (table 3).
Because the NARGFM was not designed to simulate all of the water-budget components discussed in this report, some water-budget components may appear as if they are not affected by human stresses, even though conceptually they could be (for example, natural recharge).

Human Effects on the Hydrologic System of the Verde Valley, 1910-2005 and 2005-2110 11
VERDE VALLEY WATER BUDGET. 2005 between Clarkdale and Camp Verde streamflow-gaging stations
Base flow at Clarkdale
A. In acre-feet per year
underflow in
EXPLANATION Conceptual reservoir and name of reservoir
Quantified conveyance and water flux, line width is proportional to flux
Unquantified conveyance
Base flow at: Clarkdale Camp Verde
B. In cubic feet per second
27
Net underflow in
7
11VP1fcli~S:0H
__]]___.
EXPLANATION Conceptual reservoir and name of reservoir
Quantified conveyance and water flux; line width is proportional to flux
Unquantified conveyance
Figure 8. Diagrams showing water budget for Verde Valley, central Arizona, 2005. A. Fluxes given in acre-feet per year. B, Fluxes given in cubic feet per second. ET, evapotranspiration; intras., infrastructure;>, unquantified but larger than indicated amount

12 Human Effects on the Hydrologic System ofthe Verde Valley, Central Arizona, 1910-2005 and 2005-2110
Table 2. Groundwater and surface-water budgets (2005) and relative changes of water-budget values attributable to human stresses (1910-2005). Verde Valley, central Arizona.
Relative change in water~ Water-budget values, 2005 budget values because of
(acre-feet per year) human stresses, 1910-20051
(acre-feet
Water-budget component Category of component Inflow Outflow Inflow Outflow
Groundwater system
Natural recharge from precipitation Stress, natural 44,000 20
Incidental and artificial recharge Stress, human 1,600 3+1,600
Net underflow Response 4,900 4-200
Withdrawal of groundwater by pumping Stress, human 19,000 3+19,000
Net discharge of groundwater as base flow Response 51,000 -5,400
Riparian evapotranspiration Response 9,200 -200
Total: 550,000 579,000 5+1,400 5+14,000
Change in groundwater storage Response 5-29,000 5-12,000
Surface-water
Base flow entering study area (at Clarkdale Response 740,000 -4,900
Net discharge of groundwater as base fl.ow8 Response 51,000 -5,400
Crop use of diverted surface water Stress, human 10,000 'O Base flow
Relative change in water-Water-budget values, 2005 budget values because of
(cubic feet per second) human stresses, 1910-2005 (cubic feet per second)
Water-budget component Category of component Inflow Outflow Inflow Outflow
Groundwater
Natural recharge from precipitation Stress, natural 61 0
Incidental and artificial recharge Stress, human 2 +2
Net underflow Response 7 -0.3
Withdrawal of groundwater by pumping Stress, human 27 +27
Net discharge of groundwater as base flow Response 70 -7
Riparian evapotranspiration Response 13 -0.3
Total: 70 110 +2 +19
Change in groundwater storage Response -40 -17
Surface-water
Base flow entering study area (at Clarkdale gage) Response 55 -7
Net discharge of groundwater as base flow Response 70 -7
Crop use of diverted surface water Stress, human 14 0
Base flow exiting study area (at Camp Verde gage) Response Ill -14 1That is, water-budget values are this much higher(+) or lower (-) because of human stresses that occurred between 1910 and 2005. 2Expected to be zero, as human activites -were assumed to not affect natural precipitation-derived recharge. 3This human stress began after 1910, so the amount of relative change in the water budget is the same as the value itself. 4Human activities caused underflow in from the Colorado Plateau to decrease by 300 acre-ftfyr and underflow in from the upper Verde Valley subbasin to increase by 100 acre-ft/yr.
5Values do not sum exactly because of rounding. 6The Clarkdale gage is Verde River near Clarkdale, USGS streamflow-gaging station 09504000. The Camp Verde gage is Verde River near Camp Verde, USGS streamflow-gaging station 09506000.
7Differs from other published long-term estimates ofbaseflow (see table 4) 8Equa! to corresponding row in groundwater system section of this table. 9Use of surface water for crop irrigation predates 1910 and is simulated as a constant value. Hence, this value.

Human Effects on the Hydrologic System of the Verde Valley, 1910-2005 and 2005-2110 13
Water~budget components are presented in two groupings: the groundwater systems and the surface-water systems. These two perspectives affect the sense of direction for "inflow" and "outflow." The frame of reference for any water budget is arbitrary. In areas with a high degree of stream-aquifer interaction (such as the Verde Valley), a water budget can be expressed with respect to either the groundwater or surface-water system.
Groundwater System
From the perspective of the groundwater system, water enters aquifers through the processes of precipitation-derived natural recharge, underflow, incidental and artificial recharge, and infiltration of stream base flow. Water flows out of the aquifers through the processes of underflow, net discharge to streams as base flow, riparian ET, and withdrawals by pumping.
Natural Recharge (Inflow, Natural Stress)
Natural recharge to groundwater aquifers in the Verde Valley was about 44,000 aere-ftlyr (6! ft3/s) in 2005. This value is an average for 2000-2005 conditions and is about 25 percent less than the long-term average of 59,000 acre-ft/yr (fig. 6), reflecting the dry conditions prevalent during the 2000-2005 time period. Other natural-recharge estimates have been published (for example, Arizona Department of Water Resources, 2000; Blasch and others, 2006; Pool and others, 2011; Tillman and others, 2011), but generally not for the study area as defined precisely for the present report. As such, those other published values are not directly comparable to the values in this repOit.
Human stresses, for the purposes of this study, cannot affect this natural recharge water-budget component This is because the NARGFM does not vary natural recharge because of human activities. Speaking generally, however, global climate models indicate that human activities that affect global climate will increase aridity in the southwestern United States (Williams and others, 201 0; deBuys, 2011 ). Increased aridity would likely decrease natural recharge.
Incidental and Artificial Recharge (Inflow, Human Stress)
Under 2005 conditions, incidental and artificial recharge in the Verde Valley together were about 1,600 acre-ft!yr (2ft3/s). This might be an underestimate, however, because not all processes that lead to incidental recharge have been studied and quantified. Surface~ water ditch diversions and associated irrigation activities in the Verde Valley, for example, likely allow additional surface water to become recharge (Garner and Bills, 20!2), but this effect was not simulated in the NARGFM.
Between 1910 and 2005, incidental and artificial recharge increased in the study area from 0 to 1,600 acre-ft/yr, and they were simulated as zero before !990 (fig. 6). All of this increase
was attributable to human activities, as incidental and artificial recharge inherently are human-driven processes.
Forward-looking model runs for 2005-2110 simulated small changes in the human stresses of incidental and artificial recharge-between a decrease of 300 acre-ft/yr and an increase of300 acre-ftlyr (fig. 7). These decreases and increases are small in comparison to the overall Verde Valley water budget. Values for these components were scaled up and down in direct proportion with groundwater withdrawal rates.
Net Underflow (Inflow, Human Stress)
A total of about 4,900 acre-ftlyr (7 ft3/s) of groundwater entered the study area from adjoining areas during 2005 (fig. 9). This is a net value, not a gross value; small-scale backand-forth movement of water along study-area boundaries can produce much larger gross values that are not helpful for understanding the overall Verde Valley water budget. Studyarea boundaries could have been delineated so as to minimize underflow, but they were not. Groundwater divides move during the transient simulation of the NARGFM, making it unlikely to find one boundary delineation that ahl\'ays maintains zero underflow.
Almost no change in net underflow between 1910 and 2005 was attributable to human stresses-a decrease of only about 200 acre-ft/yr was estimated to have occurred during that period. In the three forward-looking model runs for 2005-2110, however, net underflow into the study area increased in each case. Even in the case of decreased human stresses-wherein groundwater withdrawals in the Verde Valley decreased by 5,600 acre-ft/yr over 105 years-net underflow still increased by 1,000 acre-ftlyr (1 ft3/s). This can be explained by aquifer-gradient changes imparted by pre-2005 pumping (a human stress) propagating outward from wells. Hydraulic gradient changes take time to travel through the aquifer.lfthese changes reach the study-area boundary only after 2005, then rates of underflow at the boundaries would change in response to these human stresses only during the forward-looking model runs. Unchanged and increased human-stress model runs showed additional increases of net underflow (up to 1,300 acre-ftlyr by year 2110). These results suggest that groundwater withdrawals in the Verde Valleyboth those that have occurred to date and those that may yet occur-will induce additional groundwater inflow from adjacent areas.
Withdrawal of Groundwater by Pumping (Outflow, Human Stress)
As of2005, groundwater withdrawals in the Verde Valley amounted to about 19,000 acre-ftlyr (27 ft3/s) and supported municipal, domestic, and industrial water uses. Groundwater withdrawals have increased over time within the study area (fig. 6), as well as across the entire NARGFM domain of northern Arizona (Pool and others, 2011).

14 Human Effects on the Hydrologic System ofthe Verde Valley, Central Arizona, 1910-2005 and 2005-2110
Table 3. Relative change of groundwater and surface-water budgets between 2005 and 2110 attributable to human stresses, Verde central Arizona.
Water-budget Human stresses, relative changes 2005--21101
Water-budget component
Natural recharge from precipitation2
Incidental and artificial recharge
Net underflow
Withdrawal of groundwater by pumping
Net discharge of groWidwater as base flow
Riparian evapotranspiration
Total:
Change in groundwater storage
Base flow entering study area (at Clarkdale gage 7)
Net discharge of groundwater as base fiow9
Crop use of diverted surface water
values, 2005 (acre-feet per year)
Category of Inflow Outflow component
Groundwater system
Stress, natural 44,000
Stress, human 1,600
. Response 4,900
Stress, human 19,000
Response 51,000
Response 9,200 650,000 679,000
Response 6-29,000
Surface-water
Response 840,000
Response 51,000
Stress, human 10,000
(acre-feet per year)
Decreased Unchanged Increased
Inflow Outflow Inflow Outflow Inflow Outflow
'O 'O 'O
-300 0 +300
+1,000 +1,200 +1,300
-5,600 4-2,900 5+200
-2,700 -3,900 -4,800
-300 -400 -500 6+800 6-8,600 6+1,100 6-7,100 6+1,600 6-5,000
6+9,300 6+8,200 6+6,600
-2,700 -3,300 -3,800
-2,700 -3,900 -4,800 wo 100 100
Water-budget Human stresses, relative changes 2005-2110 values, 2005 (cubic feet per second) (cubic feet
Decreased Unchanged per second)
Water-budget component Category of Inflow Outflow Inflow Outflow Inflow Outflow component
Groundwater
Incidental and artificial recharge Stress, human 2 -0.4 0
Net underflow Response 7 +I +2
Withdrawal of groundwater by pumping Stress, human 27 -8 -4
Net discharge of groundwater as base flow Response 70 -4 -5
Riparian evapotranspiration Response 13 -0.4 -0.5
Total: 70 110 +I -11 +2 -10
Change in groundwater storage Response -40 +13 +11
Surface-water
Base flow entering study area (at Clarl<dale gage) Response 55 -4 -5
Net discharge of groundwater as base flow Response 70 -4 -5
Crop use of diverted surface water Stress, human 14 0 0
Base flow exiting study area (at Camp Verde gage) Response lll -7 -10 1That is, water-budget values are this much higher(+) or lower(-) because ofhtunan stresses that occurred between 2005 and 2100. 2Simluated as an unvarying rate equal to the long-tenn (191 0-2005) average natural-recharge rate. 3Expected to be zero, as hl.J!nan activites were asswned to not affect natural precipitation-derived recharge. 4Although withdrawals were simulated as unchanged 2005-2110, some cells with wells in them went dry and were lUlable to continue pumping. 5Because of drying cells, this value was not increased as much as was specified to the model. 6Values do not sum exactly, because of rounding.
Increased
Inflow Outflow
+0.4
+2
+0.2
-7
-0.6
+5 -7
+9
-5
-7
0
-12
7The Clarkdale gage is Verde River near Clarkdale, USGS streamflow-gaging station 09504000. The Camp Verde gage is Verde River near Camp Verde, USGS streamflowgaging station 09506000.
&oiffers from other published long-term estimates ofbaseflow (see table 4). 9Equal to corresponding row in groundwater system section of this table. 10Use of surface water for crop irrigation is simulated as a coru.'tant value. Hence, th~s value.

Human Effects on the Hydrologic System of the Verde Valley, 19111-2005 and 2005--2110 15
The three forward-looking model runs attempted to decrease, hold steady, and increase groundwater withdrawals between 2005 and 2110. Model runs, however, were unable to achieve their full attempted changes in groundwater withdrawal rate-some of the simulated wells in the NARGFM went dry. Compared with 2005 groundwater withdrawal rates, by the year 2110 the model runs attempted to (a) decrease withdrawals by about 3,000 acre-ftlyr, (b) maintain withdrawals at 2005 rates, and (c) increase withdrawals by about 3,000 acre-ft/yr. Instead,
by the year 2110 the model runs respectively (a) decreased withdrawals by 5,600 acre-ft/yr, (b) decreased withdrawals by 2,900 acre-ft/yr, and (c) increased withdrawals by 200 acre-ftlyr (fig. 7).
Model cells that went dry were considered acceptable for two reasons. First, the model runs produced three variable withdrawal conditions, which in tum meant they produced three variable conditions of human stresses on the groundwater system. Creation of variable human-stress
VERDE VAllEY WATER BUDGET, 2005 between Clarkdale and Camp Verde streamflow-gaging stations
Upper Portion of \lerde \Ia !Iey Subbasin
Net undertlow in: 800 acre-ft/yr
(I ft3Jsl
Verde River base flow in: 40,000 acre·ft/yr
(55 ft3Js)
No underflow along this boundarv between Verde Val!ev' subbasin
and Agmi rria basin
Boundar1 be!Vveen Verde Valley subbasin ancl
Colorado Plateau
Colorado Plateau
Net underflow in: 2,400 acre-ft/yr
(3 ft3Js) Verde River base flow out
80.00[) 8CHdt/yr (111 h'/si
10 MILES f-',-L,-.L,-~
10 KILOMETERS
Figure 9. Map showing underflow and base flow into and out ofthe Verde Valley, central Arizona, 2005.
16 Human Effects on the Hydrologic System ofthe Verde Valley, Central Arizona, 1910-2005 and 2005-2110
conditions was the goal of these model runs, and this goal was achieved. Second, human stresses were altered not only within the study area, but also throughout the entire NARGFM domain; most other areas of the model domain did not contain such a large number of dry wells in the simulations.
Riparian Evapotranspiration (Outflow, Response)
As of2005, about 9,200 acre-ft/yr (13 ft3/s) of groundwater was estimated to return to the atmosphere through riparian ET in the Verde Valley. The major riparian zones in the study area are the near~ stream environments of the Verde River, Oak Creek, Beaver Creek, and West Clear Creek (fig. 1).
Values for riparian ET decreased because of human stresses, both from 1910 to 2005 and from 2005 to 2110, but only by small amounts. Riparian ET values decreased by about 500 acre-ft/yr (less than I ft3/s) during the 2005-2110 time period because of increased human stresses; in model runs for the 1910-2005 time period, riparian ET decreases were less than 500 acre-ftlyr (tables 2 and 3). The maximum decrease in riparian ET was about 5 percent of total riparian ET in the Verde Valley. Among the three forward-looking model runs, decreases in riparian ET differed, indicating that Verde Valley riparian ET is variably sensitive to human stresses. Decreased riparian ET in response to groundwater withdrawals is one of the possible sources of captured water (Webb and others, 2007; Leake and Pool, 2010; Barlow and Leake, 2012); the results of this study indicate that such a phenomenon has occurred in the Verde Valley and could continue to occur.
Change in Groundwater Storage
In 2005, groundwater storage in aquifers within the study area was decreasing by about 29,000 acre-ft/yr. This 2005 rate of decrease was larger than groundwater withdrawal rates ever have been in the study area, but only about 12,000 acre~ft/yr of this storage decrease in 2005 was attributable to human stresses. The remaining 17,000 acre-:ft/yr of storage decrease was the result of below-average natural recharge in years preceding 2005 (fig. 6; see also Pool and others, 2011, p. 79). The effects of human stresses on groundwater storage are independent of effects caused by natural stresses, and the two are superimposed on one another (Leake, 2011; Pool and others, 2011).
For the forward-looking model runs in the period 2005-2110, the rate of decrease in groundwater storage was lessened in all three cases. That is, while groundwater storage still decreased during this hypothetical future period, the rate of its annual decrease became slower. For the increased human~ stress condition, the decreased rate of groundwater storage decrease is offset precisely by increases in inflow components (incidental and artificial recharge and net underflow into the study area) and decreases in outflow components (net discharge as base flow and riparian ET; table 3). This is

Human Effects on the Hydrologic System of the Verde Valley, 1910-2005 and 2005-2110 17
consistent with the concept of capture: as a well withdraws water over time, the source of that water increasingly shifts away from depletion of groundwater storage and toward the capture of natural discharge (Theis, 1940).
Another approach to evaluating changes in groundwater storage is to map changes in groundwater~table altitude. Lowered water-table altitudes can result in having to deepen, augment, or even relocate wells. As simulated under the condition of unchanged human stress for the 2005-2110 time period, water-table altitudes in the Verde Valley decreased because of human stresses (fig. 10). The largest decreases were more than I 00 ft, near the city of Cottonwood. Modeled
EXPlANATION Groundwater·level decrease, in feet
!ilill Mor.e than 1 DO 50 to 100 10 to 50 Oto 10
GroundiNaiE>r-llevell ir1Crease, in feet Oto 10 10to50 50 to 100
10 MILES
5 10 KILOMETERS
water~table altitudes also decreased in areas adjacent to but outside of the Verde Valley. Maps for the decreased-humanstress and increased~hurnan~stress conditions demonstrated a spatial pattern very similar to that for the unchanged-humanstress condition and are, therefore, not presented in this report.
Net Discharge of Groundwater as Base Flow (Outflow, Response)
The net discharge of groundwater as base flow is the water-budget component that represents the connection between the groundwater and surface-water systems. As
Figure 10. Map showing relative changes in groundwater-table altitude attributable to unchanged human stresses, simulated by the Northern Arizona Regional Groundwater Flow Model, Verde Valley, central Arizona, 2005-2110. Values used to produce this map are from the uppermost layer ofthe model.

18 Human Effects on the Hydrologic System ofthe Verde Valley, Central Arizona, 1910-2005 and 2005-2110
such, it is listed in both the groundwater and surface-water groupings of this discussion, and is numerically identical in both. To avoid repetition, it is discussed only in the "Net Discharge of Groundwater as Base Flow" subsection of the "Surface-Water System" section.
Surface-Water System
From the perspective of the water flowing in and through streams and irrigated areas, water enters and exits through the processes of net groundwater discharge to the stream network, ET from fields irrigated with surface water, and base flow entering and exiting the study area by way of the Verde River.
Base Flow Entering the Verde Valley (Inflow, Response)
In 2005, the Verde River conveyed about 40,000 acre-ftlyr (55 ft3/s) of base flow past the Clarkdale gage, at the upstream end of the study area (fig. II). There are no other perennial streams that flow into the study area.
The NARGFM-simulated value for base flow entering the Verde Valley is less than previously published values of base flow at the Clarkdale gage (table 4) for several possible reasons. Measurement or calculation of base flow in other studies used methods that differed from the present study (for example, hydrograph separation). Differing time ranges for averaging were used among various studies, and some studies (for example, Blasch and others, 2006) used only selected seasons for base-flow calculations. In any case, any apparent
underestimation of the absolute magnitude of base flow at the Clarkdale or Camp Verde gage does not affect the ability of the present study to evaluate the relative changes in base flow attributable to human stresses.
Base flow entering the study area at the Clarkdale gage in 2005 was estimated to have decreased by about 4,900 acre-ft/yr (7 ft3/s) because of human stresses during the 1910-2005 time period (fig. II). Although the human stresses that caused this decrease likely are mostly located in areas of the Verde River groundwater basin upgradient from the Clarkdale gage, some could have been located in other groundwater basins. This possibility could include basins downgradient from the Clarkdale gage, because the process of capture occurs irrespective of directions of groundwater flow (Leake and Pool, 2010; Leake, 2011; Barlow and Leake, 2012). Any capture from downgradient basins is probably minimal in the case of the Clarkdale gage, because the major downgradient pumping centers are many miles from this gage and likely capture their water from more proximal sources.
The three forwardwlooking model runs each indicate additional decreases in base flow at the Clarkdale gage between 2005 and 2IIO (fig. 12). These decreases range from 2,700 to 3,800 acre-ft/yr (4 to 5 f't'is), depending on the degree of change in human stresses across the NARGFM domain. The model run with decreased human stresses produced the smallest decrease in base flow, while the model run with increased human stresses produced the largest decrease in base flow. On the basis of the methods of this report, therefore, human stresses will continue to capture stream base flow at the Clarkdale gage during the 2005-2110 time period.
Verde River near Clarkdale, USGS streamflow-gaging station 09504000
Figure11. Plots of base flow simulated by the Northern Arizona Regional Groundwater Flow Model in the Verde River at Clarkdale, USGS streamflow-gaging station 09504000, during 1910-2005 model run. A, Absolute magnitude of base flow. 8, Relative change in base flow attributable to human stresses. Gray and white bars indicate stress periods applied to model; tick marks at tops of panels denote timesteps within modeled stress periods.
Year

Human Effects on the Hydrologic System of the Verde Valley, 1910-2005 and 2005-2110 19
Table 4. Summary of annual, winter, and summer base-flow values at USGS streamflow-gaging stations from this and related studies, Verde Watershed, central Arizona.
Blasch and others (2006), tab7le'-:6:---,::'5::::7,'::2.;:.00:----=-:-::-c:-::-------:'7:::-9---:;::-::-------.;:.19:.:6:=;5---:2:-;0-:;-04:----:HY-::':'S::E;::P:-;-3 __ _
Blasch and others (2006), table 8 257,200 260,400 79 83.5 1966-2003 HYSEP3
Owen-Joyce and Bell (1983) 49,000- 68-83 1966-1978 visual inspection'
1988-2004 Blasch and others (2006), table 8 154,900; 214; 199 1934-1945; HYSEP3
Owen-Joyce and Bell (J 983) 48,000- 31,000- 66 200 200 43 96 1935 1945, visual 145,000 70,000 1976-1979
Twenter and Metzger (1963) 163,000 225 not specified6 not specified6
Owen-Joyce (1984) 118,000 66,000 163 791 ll/1980, 6/!981 synoptic baseftow 1Station is outside of study area, but is a widely used location for reporting ofbaseflow. The groundwateH'Iow model in this report can calculate this using the same methods as other stations.
2Unclear whether these are annual or ·winter values; they are placed in columns that seem most likely. From Blasch and others (2006), p. 24: "Most of the base-flow separations use winter base-flow data because these are the least affected by diversions and ET."
3HYSEP software (Sioto and Crouse, 1996) using the fixed-interval method for hydrograph separation. 4Method employed was visual hydrograph separation, followed by summary statistic computations on monthly and aruma! base-flow components. 5De!ineation of the location of this stream-gaging station differed slightly from that of the present report, which resulted in the exclusion of some groundwater discharge. 6Methods for calculating the reported value were not described. Reported value is assumed to be winter base flow because it is similar to other winter base-flow values. 7Value is the mean of92.8 and 89.41P/s measured on June 8 and June 11, 1981, respectively.
Net Discharge of Groundwater as Base Flow (Inflow, Response)
ln 2005, there was a net discharge of about 51,000 acre-ft/yr (70 ft3/s) of groundwater to streams in the Verde Valley. This is a single value that represents an annual and spatial total. Net groundwater discharge in the Verde Valley differs between summer and winter (Garner and Bills, 2012) and occurs not only in the mainstem Verde River but also within perennial reaches of tributary streams. Although the NARGFM can report gross values of groundwater discharge and infiltration of base flow on a 0.62~mi spatial scale, the model is best suited to reporting a net value (discharge minus
infiltration) at the scale of a groundwater basin (Pool and others, 20 !1, p. 89).
From 1910 to 2005, human stresses led to a decrease in net discharge of base flow in the study area (fig. 13). As of 2005, net base-flow discharge was about 5,400 acre-ftJyr (7 ft3/s) less than it would have been if there never had been any human stresses. By 2110, relative to 2005, conditions of the forward-looking model runs estimated an additional decrease in net base flow discharge between 2,700 and 4,800 acre-ft/yr (4 to 7 ft3/s). The decreased-human-stress model run caused the smallest amount of base-flow decrease, while the increased-human-stress model run caused the largest amount of base-flow decrease.
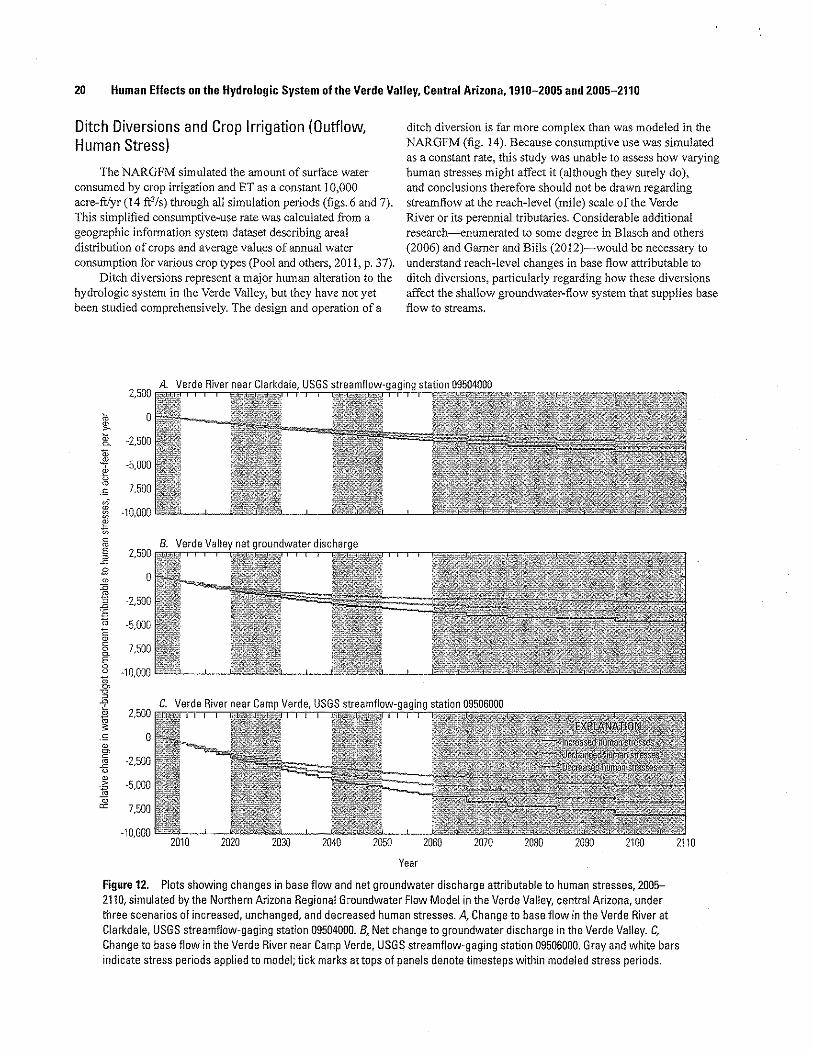
20 Human Effects on the Hydrologic System of the Verde Valley, Central Arizona, 1910-2005 and 2005-2110
Ditch Diversions and Crop Irrigation (Outflow, Human Stress)
The NARGFM simulated the amount of surface water consumed by crop irrigation and ETas a constant 10,000 acre-ftlyr (14 ft'is) through all simulation periods (figs. 6 and 7). This simplified consumptive~use rate was calculated from a geographic infonnation system dataset describing areal distribution of crops and average values of annual water consumption for various crop types (Pool and others, 2011, p. 37).
Ditch diversions represent a major human alteration to the hydrologic system in the Verde Valley, but they have not yet been studied comprehensively. The design and operation of a
2,500
:0 ~
0 > :;; ·2.500 ~
" ru ·5,000 ..,. "' u ro
7.500 .s "' ru ·10,000 ~ ~
~ c ro E 2,500 ~ ~
B 0 m :0
"' ·2,500 ~ ~ .:§ ro ·5.000 E ~ c 7,500 0 ~
E 8 ·10,000
" ~ ~ ~ ~ ~
2,500 ~
1U 3 .S 0 ~ ~ c ·2,500 ro ~ u m ~ ·5,000 -~
'" "' 7.500
·10.000
ditch diversion is far more complex than was modeled in the NARGFM (fig. 14). Because consumptive use was simulated as a constant rate, this study was unable to assess how varying human stresses might affect it (although they surely do), and conclusions therefore should not be drawn regarding streamflow at the reach-level (mile) scale of the Verde River or its perennial tributaries. Considerable additional research-enumerated to some degree in Blasch and others (2006) and Garner and Bills (2012)-would be necessary to understand reach-level changes in base flow attributable to ditch diversions, particularly regarding how these diversions affect the shallow groundwater-flow system that supplies base flow to streams.
Year
Figure 12. Plots showing changes in base flow and net groundwater discharge attributable to human stresses, 2005-2110, simulated by the Northern Arizona Regional Groundwater Flow Model in the Verde Valley, central Arizona, under three scenarios of increased, unchanged, and decreased human stresses. A. Change to base flow in the Verde River at Clarkdale, USGS streamflow-gaging station 09504000. 8, Net change to groundwater discharge in the Verde Valley. C, Change to base flow in the Verde River near Camp Verde, USGS streamflow-gaging station 09506000. Gray and white bars indicate stress periods applied to model; tick marks at tops of panels denote timesteps within modeled stress periods.

Human Effects on the Hydrologic System of the Verde Valley, 1910-2005 and 2005-2110 21
Verde Valley net groundwater discharge
m ~ ra c ro Q) 55,000 -= ~ ~~03 § :.0 = ~$~ 50,000 $~'7 -3-a~ E§m 45,000 C/5 2 .s ~
40,000
'" 5,000
c
~ §; ,_ 0 c ~ ro
ffi~ g;_ u ~
$~-~ (0>-0) -5,000 :5-Sro Em"'
·v.; ~ 2.: .5 c: i5
-10,000 gj2.s c~ ro = u
'15,000191 0 1920 1930 1940 1950 1960
Figure 13. Plots showing net groundwater discharge for 1910-2005, as simulated by the Northern Arizona Regional Groundwater Flow Model, Verde Valley, central Arizona. A, Absolute magnitude of net groundwater discharge, in acre-feet per year. 8, Relative change in net groundwater discharge attributable to human stresses, given in acre-feet per year. Gray and white bars indicate stress periods applied to model; tick marks at tops of panels denote timesteps within modeled stress periods.
EXPlANATION ==» Surface-water flow. general ,,,,,,;,, '
Evapotranspiration (ETl
t Infiltration and recharge
/ Groundwater flow, general direction
Figure 14. Conceptual diagram of an idealized perennial stream with an active irrigation system of ditch diversions and irrigation. Modified from Garner and Bills (2012).
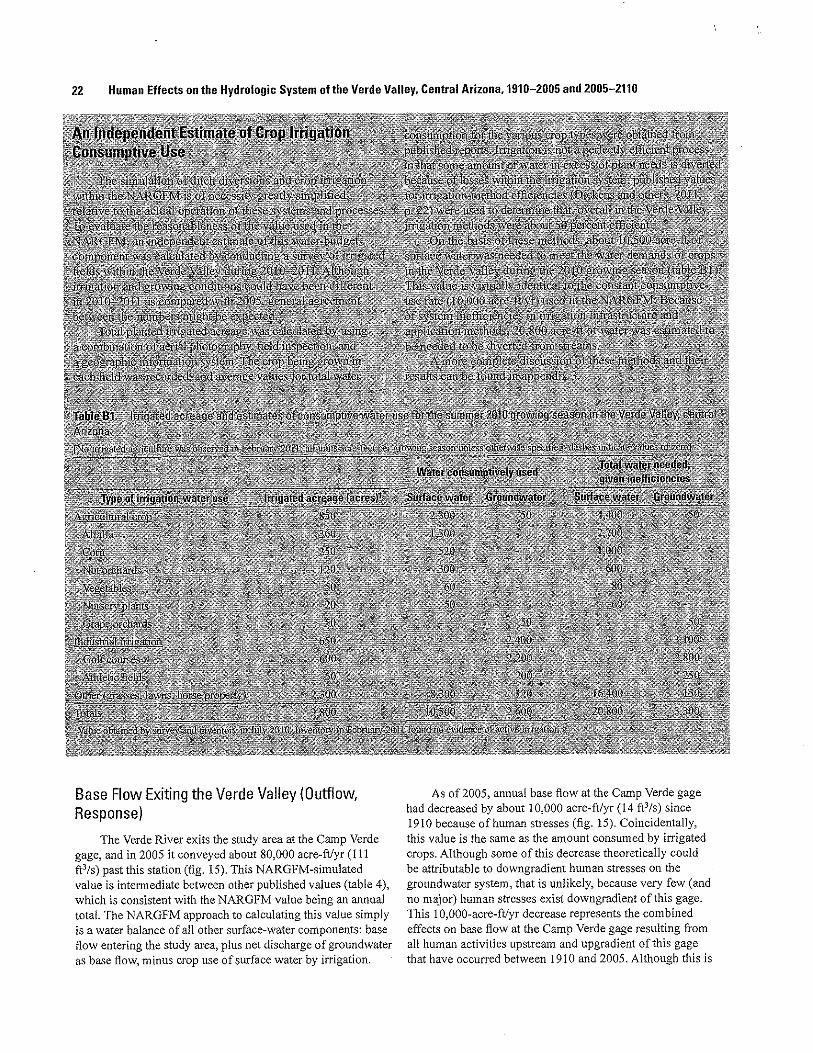
22 Human Effects on the Hydrologic System of the Verde Valley, Central Arizona, 1910-2005 and 2005-2110
Base Flow Exiting the Verde Valley (Outflow, Response)
The Verde River exits the study area at the Camp Verde gage, and in 2005 it conveyed about 80,000 acre-ftlyr (Ill ft3/s) past this station (fig. 15). This NARGFM-simulated value is intermediate between other published values (table 4), which is consistent with the NARGFM value being an annual totaL The NARGFM approach to calculating this value simply is a water balance of all other surface-water components: base flow entering the study area, plus net discharge of groundwater as base ft. ow, minus crop use of surface water by irrigation.
As of 2005, annual base flow at the Camp Verde gage had decreased by about 10,000 acre-ftlyr (14 ft3/s) since 1910 because of human stresses (fig. 15). Coincidentally, this value is the same as the amount consumed by irrigated crops. Although some of this decrease theoretically could be attributable to downgradient human stresses on the groundwater system, that is unlikely, because very few (and no major) human stresses exist downgradient of this gage. This 10,000-acre-ft/yr decrease represents the combined effects on base flow at the Camp Verde gage resulting from all human activities upstream and upgradient of this gage that have occurred between 1910 and 2005. Although this is

Human Effects on the Hydrologic System of the Verde Valley, 1910-2005 and 2005-2110 23
a back-calculated value based on a complex, regional-scale computer simulation, it supports the interpretation that human stresses up to 2005 have affected annual base-flow discharge rates in the Verde River.
The three forward-looking model runs indicated that base flow at the Camp Verde gage could continue to decrease between 2005 and 2110 because of human stresses (fig. 12). These decreases ranged from 5,400 to 8,600 acre-ftlyr (7 to 12 ft3/s) relative to 2005 rates, depending on how each forvvardlooking model run represented human stresses. While these model runs did not attempt to predict any specific future reality with respect to human stresses, they do support the interpretation that base flow in the Verde River at the Camp Verde gage wiii continue to be affected by human stresses.
Water-Budget Components not Simulated
The NARGFM did not simulate all possible hydrologic processes. On figme 8~ gray atTows with no numbers indicate water-budget components considered to be potentially significant in terms of water volume but that were not simulated.
Quantitative precipitation estimates were used as part of the NARGFM development, but these estimates are used as tools for model development rather than as true inputs or
outputs. Also~ the vast majority of precipitation returns to the atmosphere through ET and does not enter the groundwater and surface-water hydrologic systems discussed in this report.
Runoff is precipitation that neither becomes recharge to an aquifer nor returns to the atmosphere through ET (it also is known as event flow or storm flow). The NARGFM did not simulate runoff, therefore, runoff estimates are excluded from this report. Blasch and others (2006) estimated annual runoff of 64,900 acre-ft/yr (90 ft3/s) at the Clarkdale gage, and 156,600 acre-ft!yr (216 ft3/s) at the Camp Verde gage. These values were calculated by hydrograph separation using a long record, which means that they are not necessarily directly comparable to water-budget values in this report.
Although the NARGFM simulated incidental and attificial recharge, the model did not simulate the human infrastructure that removes~ treats~ conveys~ holds~ and returns such water to the environment. The model instead calculated incidental recharge simply as a percentage of withdrawn groundwater, which was returned to the model in the same grid cell from which it was withdrawn. Similarly, and as discussed in the "Ditch Diversions and Crop Irrigation" section~ the NARGFM did not simulate the numerous potential pathways for incidental recharge within the process of diverting surface water and applying it to fields for irrigation.
Verde River near Camp Verde, USGS streamflow-gaging station 09506000
" 0
90.000
"'~ ~~ 155)
85,000
§.::7 c ~ 80,000 c ro ro"T ~I'! ~g -"' c 75,000 ~·-
E v;
70,000
0
·5.000
-10,000
-15,0001910 1920 1930 1940 1950 1960
Year
1970 1980 1990 2000 2010
Figure 15, Plots of base flow simulated by the Northern Arizona Regional Groundwater Flow Model in the Verde River near Camp Verde, USGS streamflow-gaging station 09506000, during the 1910-2005 model run. A, Absolute magnitude of base flow. 8, Relative change in base flow attributable to human stresses. Gray and white bars indicate stress periods applied to model; tick marks at tops of panels denote timesteps within modeled stress periods.

24 Human Effects on the Hydrologic System ofthe Verde Valley, Central Arizona, 1910-2005 and 2005-2110
Not all sources ofET in the Verde Valley were simulated. Riparian ET was simulated, and to some degree the ET associated with irrigation of fields and crops was taken into account, but other instances of ET, such as in upland areas or along ditch diversions, were not simulated.
Discussion
Streamflow Capture
Withdrawing groundwater from a well intrinsically alters the hydrologic system: "all water discharged by wells is balanced by a loss of water somewhere" (Theis, 1940, p. 280). Water withdrawn from a well is derived from one or more of these sources: (1) decrease in groundwater storage; (2) reduction in natural discharge; and (3) increase in natural recharge. The sum of components 2 and 3 is known as capture (Barlow and Leake, 2012). The relative fraction that each of these three sources supplies to a pumped well varies through time (fig. 16), and varies solely on the basis of the hydraulic properties of the aquifer(s) and the distance between the pumping location and the connected surface-water features (Leake and Pool, 2010).
When a well first withdraws groundwater, 100 percent of the water is derived from a decrease in groundwater storage. As pumping continues, the source of water to the well transitions from a storage-dominated supply to a capture-dominated supply. Eventually, a new equilibrium may be reached where 100 percent of the withdrawn water is supplied by capture. This is the caSe only as long as there is sufficient water available for capture. If total pumping exceeds total capturable water, then a new equilibrium is not possible and aquifers will continue to be depleted of their storage as time proceeds.
The analyses in this report indicate that human stresses to the groundwater system have affected base flow in the Verde River through the process of streamflow capture. As of2005,
Storage-dominated
<D ~
100 "' 0> c Figure 16. Conceptual ·a.
E plot showing the sources => 75 "-of water to a pumped well Q;
~
through time. Modified from ro ;;:: Leake and Pool (2010). "0 50 c
=> e 0> -0 25 <D 0>
~ <D
" 0 <D "-
annual base 'flow at the Clarkdale gage was estimated to have decreased 4,900 acre-ftlyr (7 ft3/s) because of human stresses between 1910 and 2005. Although some of this decrease at the Clarkdale gage could be attributable to human stresses in downgradient areas such as the Verde Valley-capture of streamflow by pumping wells occurs irrespective of hydraulic gradients (Leake, 2011; Barlow and Leake, 2012)-most was considered attributable to groundwater withdrawals upstream and upgradient of the Clarkdale gage. At the Camp Verde gage, data in this report indicated a decrease of 10,000 acre-ft/yr (14 ft3/s) between 1910 and 2005 attributable to human stresses.
Ideally, the base-flow decreases simulated by the NARGFM would be independently and easily verifiable with streamflow records. Unfortunately, periods of record at streamflow-gaging stations throughout the Verde River groundwater basin generally are not long enough to see such effects (table 5). Another complication is that runoff is superimposed on base flow in a hydrograph, and hydrograph separation to disentangle the two (for example, Slota and Cruse, 1996) is an interpretive method subject to uncertainty arising from decisions made by the data analyst. Also, any changes in base flow resulting fi·om variable natural stresses (notably, natural recharge) are superimposed upon the streamflow record. These complicating factors are precisely why computer simulations of hydrologic systems can be helpful: they provide a means for investigating the effects of these factors independently of each other.
Base flow at the Clarkdale and Camp Verde gages may continue to decrease into the future (2005-211 0). Results in this report indicate that this would be the case even if groundwater-withdrawal rates were decreased over time, because streamflow capture continues for some time even after pumping stops (Barlow and Leake, 2012).
Winter and others (1998) suggested that surface water and groundwater are "a single resource.'~ The findings of the present study-that groundwater withdrawals have decreased base flow in the Verde River-indicate that a single~ resource (or conjunctive-use) view is appropriate for the Verde River groundwater basin.
Pumping time

Discussion 25
Table 5. Inventory of USGS streamflow-gaging stations within the Verde River groundwater basin, central Arizona.
Station identifier1 Station name Time period of gage operation
Streamqages uostream of Verde Valley
09502800 Williamson Valley Wash near Paulden I 1965-85 I I 200 !-present
09502900 Del Rio Springs near Chino Valley 1996-present
09502960 Granite Creek at Prescott 1994-present
09503000 Granite Creek near Prescott 1932-47 I 1994-present
09503300 Granite Creek below Watson Lake near Prescott 11999-present
09503700 Verde River near Paulden I 1963-present
Streamaaaes within Verde Vallev
09504000 Verde River near Clarkdale2·3 I 1965-present
09504420 Oak Creek near Sedona I 1981-present
09504500 Oak Creek near Cornville I 1940-present
09505200 Wet Beaver Creek near Rimrock I 1961-present
09505350 Dry Beaver Creek near Rimrock I 1960-present
09505400 BCaver Creek near Lake Montezuma I 4
09505800 West Clear Creek near Camp Verde I 1964-present
09506000 Verde River near Camp Verde5 11934-451 I 1988-present 1Excludes stream gages no longer m operatiOn as of 2011. For a comprehensive hst, see Blasch and others (2006, appendJx 4). 2Also has streamflow data for 1915-1921. 3Referred to as the Carkdale gage in the present report. 42004-present. $Referred to as the Camp Verde gage in this report.
Causes of Changes in Verde Valley Base Flow
Base flow "is the portion of stream flow that is derived from persistent, slowly varying sources" (Dingman, 2002, p. 373). Base flow sometimes is assumed to be constant, which is not true in the general sense, nor do the results of this study show it to be true in the Verde Valley. Several factors, both natural- and human-driven, affect base flow in the Verde Valley:
Diverting water from a stream into a ditch (fig. 17) reduces flow downstream of the diversion.
Ditch diversions likely affect base flow in more complex ways as well (Garner and Bills, 2012). Ditch diversions cause base flow and runoff to be distributed across a broader area of the alluvial valley floor than might have occurred under predevelopment conditions. Such water has many complex pathways through which it may flow after being redistributed, including subsurface pathways (fig. 14 ).
Short-term changes in base flow can be caused by groundwater gradient changes imparted by individual storm events (Sophocleous, 2002).
Changes in riparian-vegetation distribution can alter base flow over both short and long time scales. Natural forces can alter such yegetation, but in the Verde Valley human activity also has altered near-stream riparian ecology (for example, increased riparian vegetation directly downstream of long-term ditch diversion points).
Groundwater withdrawals in and around the Verde Valley eventually will be offset by capture (decreased base flow and riparian ET). The question is not if this will happen, but when. Results in this report indicate that capture of base flow occurred during 1910-2005 and will continue during 2005-2110. If groundwater withdrawals exceed total capturable water, additional capture may occur from adjacent basins.
incidental and attificial recharge can increase base flow in connected surface-water features (Leake and Pool, 201 0).
Base flow changes in response to cyclic variations in natural recharge (Pool, 2005) over decades or longer. Although the aquifers that supply base flow to perennial streams in the Verde River watershed are large, they are not so large as to entirely dampen varying natural-recharge stresses over long time periods (Pool and others, 20 II).
Climate change may cause long-tenn changes in base flow. Climate forecasts project increased aridity in the southwest (Williams and others, 2010; deBuys, 2011), which implies decreased natural recharge and therefore decreased base flow.
With so many factors able to cause changes in it, Verde River base flow varies on seasonal, weekly, daily, and hourly time scales (fig. 18). Nonetheless, despite its inconstancy, Verde Valley base flow is considered quantifiable, provided that studies select an appropriate time scale and provide sufficient context and qualification.

26 Human Effects on the Hydrologic System ofthe Verde Valley, Central Arizona, 1910-2005 and 2005-2110
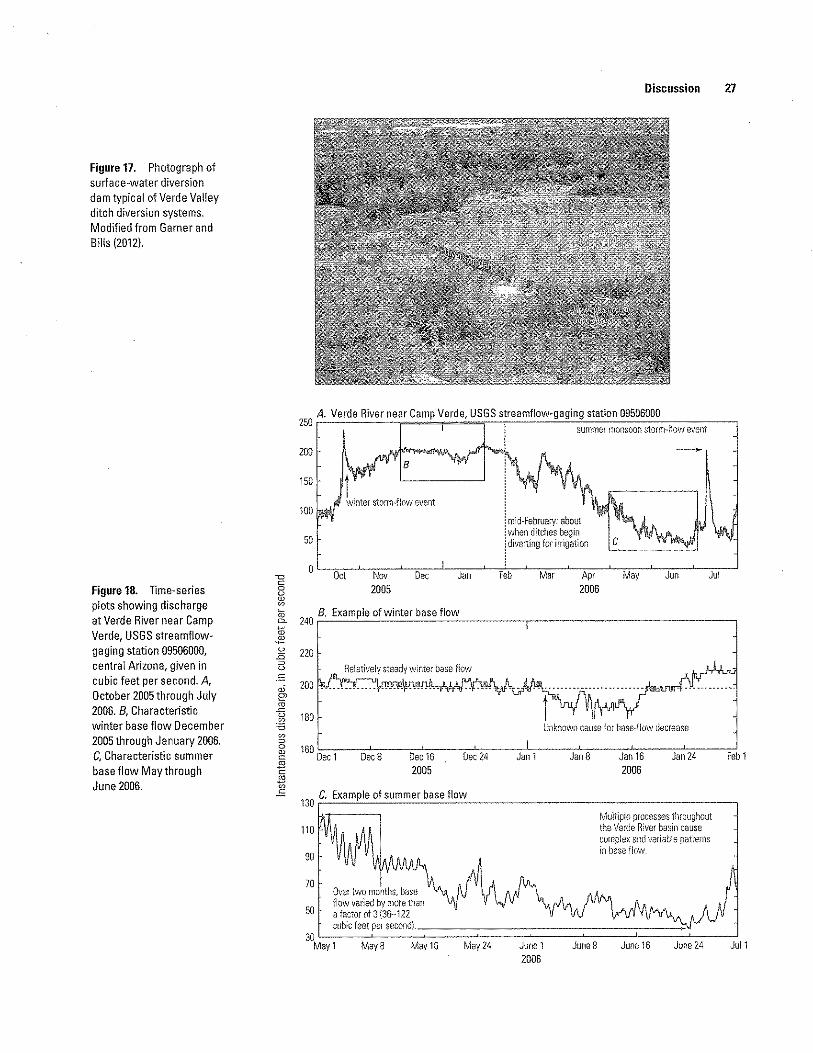
Figure 17. Photograph of surface-water diversion dam typical of Verde Valley ditch diversion systems. Modified from Garner and Bills (2012).
figUre 18. Time-series plots showing discharge at Verde River near Camp Verde, USGS streamflowgaging station 09506000, central Arizona, given in cubic feet per second. A, October 2005 through July 2006. 8, Characteristic winter base flow December 2005 through January 2006. C, Characteristic summer base flow May through June 2006.
200
150
50
! mid-February: about ! when ditches begin jdiven:ing for irrigation
Discussion 27
oL-,O~c~t-L-,N"o~v-J-,Dce~c~--"Ja~n--L-"~~b~~,M~a~r~~A~p~r_J-,I~~a~y~L-cJu~n--~-J~ul,-~ 2005 2006
~ 240
B. Example of winter base flow
1;5
""" 1S 220 ~
~ ::: ... Relativelystea.dy~~~~- ......
B Unknown cause for b<lse-flow decrease
Oec8 Dec 16 2005
Dec 24
130 C. Example of summer base flow
70
50
Over two months, base flow varied by rnore than a factor of 3 (3&··122
Jan 1 Jan 8 Jan 16 2006
Jan 24
fVlultiple processes throughout the Verde River basin cause complex and variable patterns in base fiow.
Feb I
30 L_:ct~rb~ic~fe:e~t~pe:r:sc:;co:n:d:).~======~==============================~~--_] May 1 May 8 May 16 May 24 June 1 June 8 June 16 June 24 Jul1
2006

28 Human Effects on the Hydrologic System ofthe Verde Valley, Central Arizona, 1910-2005 and 2005-2110
Restatement of Central Questions
This study addressed three central questions (see the "Introduction~' section). This section restates those questions and summarizes the findings of this study with respect to each topic.
How have human stresses on the hydrologic system affected Verde River basej/ow?-As of2005, human stresses that occurred between 1910 and 2005 were estimated to have decreased base flow in the Verde River (fig. 15). At the downstream Camp Verde gage, base flow as of 2005 was about 10,000 acre-ft/yr (14 ft3/s) less than it would have been in the absence of any human stresses (see fig. 15B).
How have human stresses outside the Verde Valley affected base flow within the Verde Valley?-As of2005, base flow at the Clarkdale gage (at the upstream end of the Verde Valley) was estimated to have decreased by about 4,900 acre-ft/yr (7 ft3/s) because of human stresses that occurred between 1910 and 2005 (fig. JIB). The most probable human stresses that caused this decrease were considered to be those occurring in upgradient areas of the Verde River groundwater basin, although conceptually some human stresses in other groundwater basins (even those downgradient of the Clarkdale gage) could have accounted for some of this decrease.
How might future human stresses to the hydrologic system affect Verde River basej/ow?-On the basis of three hypothetical forward-looking model runs, base flow at the Clarkdale gage could decrease by an additional 2,700 to 3,800 acre-ft/yr (4 to 5 ft3/s) between 2005 and 2110 (fig. 12; table 3). Over the same time period, base flow at the Camp Verde gage could decrease by an additional 5,400 to 8,600 acre-ft/yr (7 to 12 ft3/s). These human-stress induced decreases are in addition to decreases that were estimated already to have occurred at the gages as of2005.
Summary
This report describes the results of an investigation into the degree to which human stresses have affected and might in the future affect the hydrologic system of the Verde Valley, using water budgets as the central analytical tool. For the purposes of this report, the Verde Valley is the 1,500-mi' area of the Verde Valley subbasin located between USGS streamflow-gaging stations Verde River near Clarkdale, Arizona (the Clarkdale gage) and Verde River near Camp Verde (the Camp Verde gage). Residents in the Verde Valley use a combination of groundwater and surface water to meet their water demands.
The Northern Arizona Regional Groundwater Flow Model (NARGFM) was used in this study, including the 1910-2005 human and natural stresses provided with the model. Three profiles of hypothetical future human stresses for the period 2005-2110 were executed by the NARGFMincreased, decreased, and unchanged human stresses. The NARGFM was run as needed for the full191 0-2110 period,
including a special version of the model that included no human stresses whatsoever. The resulting water budgets were then extracted from model-output files. Finally, water budgets were added and subtracted to isolate only the relative changes in their values that were attributable to human stresses.
The model demonstrates that human stresses between 1910 and 2005 have affected the hydrologic system of the Verde Valley, and likely will continue to affect the hydrologic system between 2005 and 2110 through groundwater withdrawals by pumping and through incidental and artificial recharge.
Natural recharge as of2005 was about 44,000 acre-ft/yr (61 ft3/s) in the Verde Valley. Incidental and artificial recharge together were about 1,600 acre-ftlyr (2 ft3/s), although this could be an underestimate. A net of about 4,900 acre-ftlyr (7 ft3/s) of groundwater entered the study area from adjoining areas (underflow) as of2005. Simulations indicated that net underflow changed very little between 19!0 and 2005, but underflow could increase between 2005 and 2110. Groundwater withdrawals in 2005 were about 19,000 acre-ftlyr (27 ft3/s). Riparian evapotranspiration (ET) was about 9,200 acre-ft/yr (13 ft3/s) in 2005; riparian ET was shown to be capable of being decreased by human stresses by as much as 500 acre-ft/yr between 2005 and 2110, which is consistent with the concept of capture. Groundwater storage in aquifers within the Verde Valley was decreasing at about 29,000 acre-ftlyr as of 2005, although only 12,000 acre-ftlyr of this was attributable to human stresses. As time proceeded in the simulated 2005-2110 period, the rate of groundwater-storage decrease slowed down, which is consistent with the concept that the source of water to a well changes over time-from depletion of groundwater storage toward the capture of natural discharge.
At the upstream Clarkdale gage, base flow was about 40,000 acre-ftlyr (55 ft3/s) in 2005, which is less than other published values of base flow at this gage. Base flow at the Clarkdale gage, as of2005, was estimated to have decreased by about 4,900 acre-ft/yr (7 ft3/s) as a result of human stresses between 1910 and 2005. During the 2005-2110 period, the model showed that base flow at the Clarkdale gage may decrease an additional 2,700 to 3,800 acre-ft/yr (4 to 5 ft3/s) because of human stresses. Net groundwater discharge (equivalent to net surface-water inflow from groundwater) throughout the Verde Valley was about 51,000 acre-ftlyr (70 ft3/s), and as of2005 had decreased by about 5,400 acre-ft/yr (7 ft3/s) because of human stresses. At the downstream Camp Verde gage, base flow was about 80,000 acre-ftlyr (Ill ft3/s) as of2005, and had decreased by about 10,000 acre-ft!yr (14 ft3/s) between 1910 and 2005 because of human stresses. This I 0,000 acre-ftlyr decrease represents the combined effects on base flow at the Camp Verde gage of all human activities upstream and upgradient of this gage that occurred between 1910 and 2005. Model simulations indicated that base flow at the Camp Verde gage could continue to decrease during the 2005-2110 period by 5,400 to 8,600 acre-ft/yr (7 to 12 ft3/s) because of human stresses.
Withdrawing groundwater from a well intrinsically alters the hydrologic system: "All water discharged by wells

is balanced by a loss of water somewhere" (Theis, 1940, p. 280). Water withdrawn from a well is derived from one or more of these sources: (1) decrease in groundwater storage; (2) reduction in natural discharge; and (3) increase in natural recharge. The sum of components 2 and 3 is known as capture. The results presented in this report indicate that human stresses to the groundwater system have affected base flow in the Verde River through the process of streamflow capture and can continue to do so into the future.
Base flow in the Verde Valley is not constant over time, as sometimes is (incorrectly) assumed. Many factors contribute to the variability of base ftow at varying time scales. Ditch diversions that are prevalent in the Verde Valley reduce base flow directly by diverting water and change it in more complex ways by redistributing water across the floodplain. Groundwater withdrawals capture streamflow and decrease base flow. Variations in natural recharge driven by climate and climate change also can change base flow.
In summary~ human stresses were found to have decreased base flow in the Verde River between 1910 and 2005, and under hypothetical forward~ looking scenarios, human stresses were capable of causing continued and additional decreases in base flow. These findings are consistent with (a) the concept of capture, (b) previous studies that have found surface-water and groundwater systems in the Verde River groundwater basin to be connected, and (c) the characterization of groundwater and surface water as a single resource.
References Cited
Adams, D.K., and Comrie,A.C., 1997, The North American monsoon: Bulletin of the American Meteorological Society, v. 87, no. 10, 16 p.
Arizona Department of Administration, 2012, 2012-2050 State and county population projections-Medium series (baseline projections): Phoenix, Ariz., Office of Employment and Population Statistics~ available at http://www. workforce.az.gov/population~projections.aspx.
Arizona Department of Water Resources, 2000, Phase 1-Nmth-central Arizona regional water study: Phoenix, Ariz., Department of Water Resources Administrative Repott, 6 p., appendices A-E.
Arizona Department of Water Resources, 2009, Arizona water atlas: available at http://www.azwater.gov/AzDWRJStatewidePlanning/WaterAtlas/Centra!Highlands/default.htm .
Arizona Department of Water Resources~ 2012, Active management areas and irrigation non-expansion areas: available at http://www.azwater.gov I AzDWR/WaterManagementl AMAs/.
Arizona State Land Department, 1993, Streams-Ephemeral and perennial: Arizona Land Resources Information System, available at http://www.land.state.az.us/alris/ layers.html.
References Cited 29
Barlow, P.M., and Leake, S.A., 2012, Streamflow depletion by wells-Understanding and managing the effects of groundwater pumping on streamflow: U.S. Geological Survey Circular 1376, 84 p., available at http://pubs.usgs.gov/ circ/13 7 6/.
Barrs, D.L., 1983, The Colorado Plateau: Albuquerque, New Mexico, University of New Mexico Press~ 279 p.
Blasch, K. W., Hoffmann, J.P., Graser, L.F., Bryson, J.R., and Flint, A.L., 2006, Hydrogeology of the upper and middle Verde River watersheds, central Arizona: U.S. Geological Survey Scientific Investigations Report 2005-5198, 101 p., 3 pis., available at http:i/pubs.usgs.gov/sir/2005/5198/.
Brouwer, C., and Heibloem, M., 1986, Irrigation water management; irrigation water needs: Natural Resources Management and Environment Departmet?t, Food and Agriculture Organization of the United Nations, Training manual no. 3, available at http://www.fao.org/docrep/ s2022e/s2022e00.HTM.
Cooley, M.E., Harshbarger, J.W., Akers, J.P.~ and Hardt~ W.F., 1969, Regional hydrogeology of the Navajo and Hopi Indian Reservations, Arizona, New Mexico, and Utah, with a section on Vegetation by O.N. Hicks: U.S. Geological Survey Professional Paper 521-A, 61 p., 9 pis.
deBuys, William, 2011, A great aridness-Climate change and the future of the American Southwest: New York, Oxford University Press, 369 p.
Dennison, P.E., Nagler, P.L., Hultine, J.R., Glenn, E.P., Ehleringer, J.R., 2009, Remote monitoring of tamarisk defoliation and evapotranspiration following saltcedar leaf beetle attack: Remote Sensing of Environment, v. 113~ p. 1462-1472.
Dickens, J.M., Forbes, B.T., Cobean, D.S., and Tadayon, S., 2011, Documentation of methods and inventory of irrigation data collected for the 2000 and 2005 U.S. Geological Survey-Estimated use of water in the United States, comparison of USGS-compiled irrigation data to other sources, and recommendations for future compilations: U.S. Geological Survey Scientific Investigations Report 2011-5166, 60 p., available at http://pubs.usgs.gov/ sir/20 ll/5166/.
Dingman, S.L., 2002, Physical hydrology (2d ed.): Upper Saddle River, New Jersey, Prentice-Hall, 646 p.
Fenneman, N.M., 1931, Physiography of the western United States: New York, McGraw-Hill, 534 p.
Garner, B.D., and Bills, D.J., 2012, Spatial and seasonal variability of base flow in the Verde Valley~ central Arizona, 2007 and 2011: U.S. Geological Survey Scientific Investigations Report 2012-5192, 33 p, available at http:// pubs.usgs.gov/sir/20 12/5192/.
30 Human Effects on the Hydrologic System ofthe Verde Valley, Central Arizona, 1910-2005 and 2005-2110
Harbaugh, A.W., 1990, A computer program for calculat-ing subregional water budgets using results from the U.S. Geological Survey modular three-dimensional ground-water flow model: U.S. Geological Survey Open-File Report 90-392, 46 p.
Harbaugh, A.W, 2005, MODFLOW-2005: The U.S. Geological Survey modular ground-water model-The groundwater flow process: U.S. Geological Survey Techniques and Methods Report 6-A16, variously paged.
Hart, R.l, Ward, LL, Bills, DJ., and Flyrm, M.E., 2002, Generalized hydrogeology and groundwater budget for the Coconino aquifer, Little Colorado River Basin and parts of the Verde and Salt River BasinS, Arizona and New Mexico: U.S. Geological Survey Water-Resources Investigations Report 02-4026, 47 p.
Healy, R.W., Winter, T.C., LaBaugh, J.W, and Franke, O.L., 2007, Water budgets-Foundations for effective waterresources and environmental management: U.S. Geological Survey Circular 1308, 90 p.
Hillel, D., 1998, Environmental soil physics: New York, Academic Press, 771 p.
Homer, C., Huang, C., Yang, L., Wylie, B., and Coan, M., 2004, Development of a 2001 nationallandcover database for the United States: Photogrammetric Engineering and Remote Sensing, v. 70, no. 7, p. 829-840, available at http:// www.mrlc.gov/pdf/July _PERS.pdf.
Howell, T.A., 2003, Irrigation efficiency, in Stewart, B.A., and Howell, T.A., eds., Encyclopedia of water science: New York, Marce1-Dekker, Inc., p. 467-472.
Leake, S.A., 1997, Modeling groundwater flow with MODFLOW and related programs: U.S. Geological Survey Fact Sheet 121-97,4 p.
Leake, S.A., 2011, Capture-Rates and directions of groundwater flow don't matter: Ground ·water, v. 49, no. 4, p. 456-458.
Leake, S.A., and Pool, D.R., 2010, Simulated effects of groundwater pumping and artificial recharge on surfacewater resources and riparian vegetation in the Verde Valley subbasin, Central Arizona: U.S. Geological Survey Scientific Investigations Report 2010-5147, 18 p., available at http://pubs.usgs.gov/sir/20 10/5147/ .
Leake, S.A., and Reeves, H.W., 2008, Use of models to map potential capture of surface water by groundwater withdrawals: Proceedings ofMODFLOW and More 2008, International Groundwater Modeling Center, Golden, Colo., p. 204-208.
Leake, S.A., Reeves, H.W., and Dickinson, J.E., 2010,A new capture fraction method to map how pumpage affects surface water flow: Ground Water, v. 48, no. 5, p. 690-700.
Mauseth, J.D., 1991, Botany-An introduction to plant biology: Chicago, Saunders College Publishing, 800 p.
Nagler, P.L., and Glenn, E.P., 2009, Water use by ripar-ian plants on the Lower Colorado River, in Me lis, T.S., Hamill, J.F., Coggins, L.G., Jr., Grams, P.E., Kennedy, T.A., Kubly, D.M., and Ralston, B.E., eds., Proceedings of the Colorado River Basin Science and Resource Management Symposium, Scottsdale, Arizona, November 18-20, 2008: U.S. Geological Survey Scientific Investigations Report 2010-5135, p. 139-149, available at http://pubs.usgs.gov/ sir/20 I 0/5135/ .
Nagler, P.L., Morino, K., Murray, R.S., Osterberg, J., and Glenn, E.P., 2009, Scaling riparian and agricultural evapotranspiration in river irrigation districts based on potential evapotranspiration, ground measurements of actual evapotranspiration, and the Enhanced Vegetation Index from MODIS, part I, description of method: Remote Sensing, v. 1, p. 1273-1291.
Nagler, P.L, Scott, R.L., Westenburg, Craig, Cleverly, J.R., Glenn, E.P., and Huete, A.R., 2005, Evapotranspiration on western U.S. rivers estimated using the Enhanced Vegetation Index from MODIS and data from eddy covariance and Bowen ratio :flux towers: Remote Sensing ofEnvironment, v. 97, p. 337-351.
National Oceanic and Atmospheric Administration, 2010, Annual Climatological Summary: National Climate Data Center, available at http://www.ncdc.noaa.gov/cdo-web/.
Oak Ridge National Laboratory, 2008, MODIS land product subsets, Collection 5: Oak Ridge, Tenn., available at http:// daac.ornLgov/MODIS/modis.html.
Owen-Joyce, S.J., 1984, Hydrology of a stream-aquifer system in the Camp Verde area, Yavapai County, Arizona: Arizona Department of Water Resources Bulletin 3, 60 p.
Owen-Joyce, S.J., and Bell, C.K., 1983, Appraisal of water resources in the upper Verde River area, Yavapai and Coconino Counties, Arizona: Arizona Department of Water Resources Bulletin 2, 219 p.
Pool, D.R., 2005, Variations in climate and ephemeral channel recharge in southeastern Arizona, United States: Water Resources Research, v. 41, no. Wll403, p. 1-24.
Pool, D.R., Blasch, K.W., Callegary, J.B., Leake, S.A., and Graser, L.F., 2011, Regional groundwater-flow model of the Redwall-Muav, Coconino, and alluvial basin aquifer systems of northern and central Arizona: U.S. Geological Survey Scientific Investigations Report 2010-5180, 101 p.
PRJSM Climate Group, 2012, Daily temperatures and precipitation for Verde Valley, 2000-2010: Corvallis, Oregon State University, PRISM Climate Group, available at http://www. prism.oregonstate.edu/.
Sloto, R.A., and Crouse, M.Y., 1996, HYSEP-A computer program for streamflow hydrograph separation and analysis: U.S. Geological Survey Water-Resources Investigations Report 96-4040, 46 p.

Sophocleous, M., 2002, Interactions between groundwater and surface water-The state of the science: Hydrogeology Journal, v. I 0, p. 52-07.
Tadayon, S., 2005, Water withdrawals for iiTigation, municipal, mining, thennoelecttic-power, and drainage uses in Arizona outside of active management areas, 1991-2000: U.S. Geological Survey Scientific Investigations Report 2004-5293, 38 p.
Theis, C.V., 1940, The source of water derived from wells: Civil Engineering, v. 10, p. 277-280.
Tillman, F.D, Cordova, J.T., Leake, S.A., Thomas, B.E., and Callegary, .T.B., 2011, Water availability and use pilot-Methods development for a regional assessment of groundwater availability, southwest alluvial basins, Arizona: U.S. Geological Survey Scientific Investigations Report 2011-5071, 120 p.
Twenter, F.R., and Metzger, D.G., 1963, Geology and groundwater in Verde Valley_;_ The Mogollon Rim region, Arizona: U.S. Geological Survey Bulletin 1177, 132 p., I pl.
U.S. Bureau of Reclamation, 1992, Plan of study and methods manual for Colorado River system consumptive uses and losses report 1985-1990: U.S. Bureau of Reclamation, appendix A, 23 p.
U.S. Census Bureau, 201I, American FactFinder-Block-level PI data: U.S. Depm1ment of Commerce, available at http:// factfinder2.census.gov/faces/nav/js:Upages/index.xhtml.
U.S. Congress, Senate Committee on Energy and Natural Resources, 2005, Northern Arizona Land Exchange and Verde River Basin Partnership Act of2005; act: U.S. Congress, I 09th, II p., available at http://www.gpo.gov/fdsys/ pkg/PLAW-109publll0/pdf/PLAW-J09publl I O.pdf.
U.S. Geological Survey and Verde River Basin Partnership, 2009, Hydrology science plan to support Title II of the Northern Arizona Land Exchange and Verde River Basin Partnership Act of2005: Cottonwood, Ariz., Verde River Basin Partnership, 29 p., available at http://www. naturesongs.com/vrbp/hydrologyscienceplan0909.pdf.
Webb, R.H., Leake, S.A., and Turner, R.M., 2007, The ribbon of green-Change in riparian vegetation in the Southwestern United States: Tucson, University of Arizona Press, 470 p.
Williams, A.P., Allen, C,D., Millar, C.I., Swetnam, T.W., Michaelsen, Joel, Still, C.J., and Leavitt, S.W., 2010, Forest responses to increasing aridity and warmth in southwestem North America: Proceedings of the National Acad-emy of Sciences of the United States of America, v. 107, no. 50, p. 21289-21294, available at http://www.pnas.org/ content! I 07/50/21289.ful!.pdf+html .
Winter, T.C., Harvey, J.W., Franke, O.L., and Alley, W.M., 1998, Ground water and surface water-A single resource: U.S. Geological Survey Circular 1139,79 p., available at http://pubs.usgs.gov/circ/circll39/.
Zlatos, C.M., 2008, Using geochemical tracers to determine aquifer connectivity, 'flow paths, and base-flow sources, middle Verde River watershed, central Arizona: University of Arizona, M.S. thesis, 119 p.
Glossary 31
Glossary
Artificial recharge-Water used by humans that deliberately is infiltrated into the subsurface to become recharge. Means by which this is accomplished include infiltration basins and discharge to a stream. Similar to incidental recharge, except that artificial recharge is deliberate and actively managed.
Base flow net groundwater discharge-The total amount of groundwater discharge to a stream that occurs where the water-table altitude is higher than the altitude of the streamwater surface. Conversely, if a water table is below the elevation of water in a stream and streambed sediments are sufficiently petmeable, stream water enters the subsurface and may become recharge.
Consumptive use--The use of applied irrigation water by plants.
Groundwater storage-Water located within the intergranular pore spaces, fractures, and (possibly) larger void spaces within an aquifer.
Hummz infrastructure-The dams, canals, pipes, tanks, and treatment systems used to withdraw, treat, convey, store, and deliver water to customers, as well as the canals and pipes that convey used water and wastewater away from customers. At various points within human infrastructure, there exists potential for incidental recharge.
Human stresses-Stresses applied to the hydrologic system that exist solely because of the presence of humans. For this report, these were defined as groundwater withdrawals by pumping, incidental recharge, artificial recharge, and consumptive use of surface water through irrigation. The lattennost of these, however, was not varied under any modeled conditions, as it is not well quantified.
Incidental recharge-Water used by humans that infiltrates the subsurface and becomes recharge in an unmanaged way. Common examples include discharge from septic-system drain fields, water that leaks from pressurized water-supply pipes, and water applied to irrigated lands that infiltrates past the root zone.
Natural recharge-Precipitation that falls on the land surface, infiltrates the unsaturated zone, percolates downward, and reaches the water table.
Natural stresses-Stresses applied to the hydrologic system because of natural forces. For this study, the term natural stresses was defined to be natural recharge derived from precipitation.
Riparian evapotranspiration-A processes whereby groundwater either is incorporated into plant tissues or returned to the atmosphere through surface evaporation or transpiration through plant stomata (Hillel, 1998; Mauseth, 1991).
Underflow-Groundwater that flows entirely in the subsurface across boundaries that are not coincident with groundwater divides.

32 Human Effects on the Hydrologic System ofthe Verde Valley, Central Arizona, 1910-2005 and 2005-2110
Appendix 1. Results of Water Budgets for Model Runs, 1910-2005 and 2005-2110 Table 1.1. Results of groundwater-flow model simulation, 1910-2005, Verde Valley, central Arizona. [GW, groundwater; SW, surface water; all values in acre~feet per year; values are described by variable S
1 in equation (1) in main body of text]
Simluated date
Groundwater inflow Underflow from
Groundwater outflow
1/111910 10/6/1913 4112/1918 9/12/1923 3/14/1930
11111938 4/9/1938 8/4/1938
12/24/1938 6/ll/1939
111/1940 5/5/1941
12/15/1942 11/21/1944 3/20/1947
12/31/1949 5/6/1951
12/15/1952 ll/22/1954 3/19/1957
12/3111959 5/5/1961
12/15/1962 ll/2111964 3/20/1967
12/3111969 5/6/1971
12/15/1972 11/22/1974 3/19/1977
12/31/1979 5/5/1981
12/15/1982 11/21/1984 3/20/1987
12/3111989 5/6/1991
12/15/1992 11/22/1994 3/1911997
11112000 10/21/2000 10/10/2001 12/8/2002 4/30/2004
111/2006
Incidental recharge
0 0 0
0 0 0 0 0 0 0 0 0 0
0 0 0 0 0 0 0 0 0
0
0 0 0
46 46 46 0 0
39 39 39 39 39
1014 1014 1014 1014 1014 1573 1573 1573 1573 1573
Baseflow infiltration
21929 21929 21933 21930 21929 21932 21928 21932 21933 21928 21927 21930 21936 21936 21940 21943 21985 22025 22072 22135 22186 22197 22207 22210 22213 22211 22199 22190 22177 22163 22128 22394 22504 22602 22667 22749 23051 23161 23241 23325 23402 23810 24003 24202 24389 24589
Natural recharge
58550 58550 58550 58550 58550 58550 58550 58550 58550 58550 58550 58550 58550 58550 58550 58535 35121 35121 35121 35121 35121 58535 58535 58535 58535 58535
100678 100678 100678 100678 100678 76094 76094 76094 76094 76094 93656 93656 93656 93656 93656 43902 43902 43902 43902 43902
Upper Verde Valley subbasin
860 860 860 860 860 860 860 860 860 860 860 860 860 860 860 860 952 996
1038 1080 1122 1048 1023 1002 981 961 788 698 616 535 457 525 539 548 559 571 504 475 449 424 399 569 632 687 743 801
Colorado Plateau
1702 1702 1702 1702 1702 1702 1702 1702 1702 1702 1702 1702 1702 1702 1702 1702 1602 1509 1427 1354 1288 1350 1404 1448 1480 1504 1678 1843 1996 2136 2271 2224 2188 2164 2150 2146 2213
2277 2336 2392 2445 2287 2124 1972 1831 1703
Verde Canyon 1746 1746 1746 1746 1746 1746 1746 1746 1746 1746 1746 1746 1746 1746 1746 1746 1687 1608 1518 1427 1337 1335 1354 1380 1410 1441 1551 1712 1917 2157 2438 2471 2488 2505 2524 2550 2646 2773 2885 3005 3130 2979 2824 2698 2553 2417
Withdrawals
2
2
2
2
2
2
2
2
2
2
2
2040 2040 2040 2040 227 596 596 596 596 596
1106 1106 1106 1106 1106 4274 4274 4274 3818 3818 9108 9108 9108 8696 8696
14231 13529 13529 13529 13529 19625 19625 19625 19625 19290
Discharge as base flow
75002 75005 75008 75005 75005 75008 75002 75008 75010 75008 75005 74987 74978 74963 74960 74948 74261 73882 73518 73142 72754 73183 73316 73405 73488 73559 74637 75283 75929 76648 77415 76693 76642 76657 76737 76832 77187 77448 77732 78076 78473 77380 76864 76408 75937 75472
Evapo~
transpiration 9400 9400 9400 9400 9400 9400 9400 9400 9400 9400 9400 9399 9399 9398 9397 9396 9394 9391 9388 9384 9379 9375 9372 9369 9367 9365 9361 9359 9359 9359 9359 9351 9344 9338 9331 9325 9314 9303 9294 9285 9276 9266 9257 9246 9234 9221

Appendix 1. Results of Water Budgets for Model Runs, 1911J.--2005 and 2005-2110 33
Table 1.1. Results of groundwater-flow model simulation, 1910-2005, Verde Valley, central Arizona.-Continued
Net --:::----:---::---::-'=--=--:-:--:---:-- SW oulllow,
Ground· Streamflow Base flow (gage) at Simluated date
irrigation water produced in --------consumptive storage Verde Valley Paulden Clarkdale use
111/1910
10/6/1913
4/12/1918
9112/1923
change
0
0
0 0
3/14/1930 0
11111938 0
4/9/1938 0
8/4/1938 -1
12/24/1938 -1
6/11/1939 -1
1/111940 -2
5/511941 -2018
12/1511942 -2004
11/21/1944 -1992
3/20/1947 -1979
12/3111949 -168
5/6/1951 -23243
12/15/1952 -22934
11/22/1954 -22642
3119/1957 -22324
12/3111959 -21969
5/511961 504
12/15/1962 425
11/2111964 382
3/2011967 343
12/3111969 305
5/611971 38318
12/1511972 37889
11/2211974 37484
311911977 37447
12/3111979 36986
5/5/1981 8232
12/15/1982 8402
11/2111984 8467
3/20/1987 8905
12/31/1989 8918
5/611991 21955
12115/1992 22666
11/22/1994 22601
3119/1997 22501
111/2000 22351 10/2112000 -31541
10110/2001 -31056
12/8/2002 -30605
4/30/2004 -30172
11112006 -29361
53072
53076
53074
53074
53075
53076
53074
53075
53078
53079
53077
53056
53042
53027
53020
53005
52276
51858
51446
51006
50568
50987
51109
51196
51275
51349
52438
53093
53751
54485
55287
54298
54139
54055
54070
54083
54136
54287
54491
54751
55071
53570
52861
52206
51549
50884
21694 43191
21679 43176
21674 43172
21673 43171
21671
21670
21660
21648
21634
21616
21592
21460
21262
21072
20890
20722
20282
19926
19585
19250
18915
18700
18413
18138
17881
17635
18183
18500
18701
18817
18858
18718
18682
18634
18563
18475
18534
18505
18467
18427
18380
17967
17759
17598
17447
17299
43170
43168
43157
43146
43132
43114
43091
42966
42767
42579
42388
42228
41179
40440
39797
39194
38617
38906
38895
38807
38686
38542
40204
41253
42041
42677
43191
42613
42387
42259
42150
42074
42603
42887
43108
43305
43487
42169
41376
40744
40198
39705
10200
10200
10200
10200
10200
10200
10200
10200
10200
10200
10200
10200
10200
10200
10200
10200
10200
10200
10200
10200
10200
10200
10200
10200
10200
10200
10200
10200
10200
10200
10200
10200
10200
10200
10200
10200
10200
10200
10200
10200
10200
10200
10200
10200
10200
10200
Groundwater Incidental Net base withdrawals recharge
flow, Camp _ _::a:::bo::ve:cg"'a"':ge"-'a::l_ _.ca=b:::ov::ec;<g::;ag":eO:at,__ Verde gage Camp Camp
Clarkdale Clarkdale Verde Verde
86064
86052
86047
86046
0 2 2018 2018
186 188 2018 2018
186 188 2018 2018
186 188 2018 2018
86045 186
86044 186
86031 3368
86021 3368
86010 3368
85993 3368
85968 3368
85822 14722
85610 14722
85406 14722.
85208 14722
85034 14722
83255 28437
82097 28437
81043 28437
80000 28437
78985 28437
79693 31247
79804 31247
79802 31247
79761 31247
79691 31247
82443 31462
84146 31462
85593 31462
86962 31442
88278 31442
86712 26938
86326 26938
86115 26938
86020 26938
85958 26938
86539 25677
86975 25677
87399 25677
87856 25677
88358 25677
85539 29172
84037 29172
82750 29172
81547 29172
80389 29172
188
188
3370
3370
3370
3370
3370
16762
16762
16762
16762
14949
29033
29033
29033
29033
29033
32353
32353
32353
32353
32353
35736
35736
35736
35260
35260
36047
36047
36047
35634
35634
39908
39205
39205
39205
39205
48797
48797
48798
48798
48463
2018
2018
2720
2720
2720
2720
2720
7514
7514
7514
7514
7514
12297
12297
12297
12297
12297
13263
13263
13263
13263
13263
12717
12717
12717
12717
12717
9902
9902
9902
9902
9902
9916
9916
9916
9916
9916
11154
11154
11154
11154
11154
2018
2018
2720
2720
2720
2720
2720
7514
7514
7514
7514
7514
12297
12297
12297
12297
12297
13263
13263
13263
13263
13263
12762
12762
12762
127!7
12717
9941
9941
9941
9941
9941
10930
10930
10930
10930
10930
12727
12727
12727
12727
12727

34 Human Effects on the Hydrologic System of the Verde Valley, Central Arizona, 1910-2005 and 2005-2110
Table 1.2. Relative changes in water-budget components attributable to human stresses, 191D-2005, based on a groundwater-flow model, Verde Valley, central Arizona. [GW, grolUldwater; SW, surface water; all values in acre~feet per year; values are described by variable M
1 in equation (3) in main body of text]
Simluated date
1/111910
10/611913
4/12/1918
9/12/1923
3/14/1930
11111938
4/911938
8/411938
12/2411938
611111939
11111940
5/511941
12/15/1942
1112111944
3/20/1947
12/31/1949
5/6/1951
12/15/!952
11/22/1954
311911957
12/3111959
5/5/1961
12/15/1962
11/21/1964
3/20/1967
12/31/1969
5/6/1971
12/15/1972
11/22/1974
3/19/1977
12/31/1979
5/5/1981
12/15/1982
11/2111984
3/20/1987
12/31/1989
5/6/1991
12/15/1992
11/2211994
3119/1997
111/2000
10/21/2000
10/10/2001
12/8/2002
4/30/2004
1/1/2006
Incidental recharge
0
0
0
0
0
0
0 0 0 0
0 0
0 0
0
0
0
0
0
0
0
0
0
0
0
0
46
46
46
0
0
39
39
39
39
39
1014
1014
1014
1014
1014
1573
1573
1573
1573
1573
Baseflow infiltration
0
4
5
2 2
5
5
3
I
0
7
8 12
16
15
30
34
59
71
94
121
140
!55
172
249
307
368
424
466
731
848
949
1006
1086
1424
1558
!669
1785
1896
2247
2417
2578
2725
2885
Groundwater inflow
Natural recharge
0 0 0 0 0
0 0 0 0 0
0 0
0 0 0
-15
-9 -9
-9 -9
-9 -15
-15
-15
-15
-15
-27
-27
-27
-27
-27
-21
-21
-21
-21
-21
-24
-24
-24
-24
-24
-9 -9 -9 -9 -9
Upper Verde Valley sub-basin
0
0
0 0
0
0
0
0 0
0
0
0
0
0
0
0
1
0
2 2 2 3 4
5 7
8 11
15
20
23
26
31
37
46
50
54
59
66 73
81
82
86
88
91
Colorado Plateau
0 0 0
0 0
0 0
0
0
0
0 0 0 0
0
0
0 -1
-1
-1
-3
-9 -16
-24
-33
-42
-56
-73
-89
-107
-124
-121
-116
-110
-105
-102
-118
-137
-155
-173
-190
-204
-221
-238
-256
-272
Verde Canyon
0 0 0
0
0
0 0 0
0 0
0 0 0
0
0
0
0
0
0
0 0
0
0
0
0
0
0
I
0
-1
-3
-4
-7 -9
-20
-27
-18
-12
-12
-12
-10
Groundwater outflow
Withdrawals
0 0 0
0 0
0
0
0
0
0
0 2038
2038
2038
2038
225
594
594
594
594
594
1104
1104
1104
1104
1104
4272
4272
4272
3816
3816
9106
9!06
9106
8694
8694
14229
13527
13527
13527
13527
19623
19623
19623
19623
19288
Discharge as base flow
0
6 6
3
6 9 3 9
9
9 6
-15
-24
-39
-41
-50
-71 -92
-98
-110
-116
-142
-166
-172
-187
-201
-370
-424
-468
-512
-560
-945
-1028
-1093
-1146
-1262
-1528
-1667
-1795
-1913
-2032
-2109
-2200
-2295
-2384
-2470
Evapotranspiration
0 0
0
0
0
0
0
0
0
0
0
-1 -1
-2
-2
-3
-4
-6
-7 -8
-10
-14
-17
-19
-21
-24
-30
-34
-39
-44
-49
-59
-68
-76
-84
-92
-107
-119
-!3! -144
-158
-167
-176
-186
-197
-209
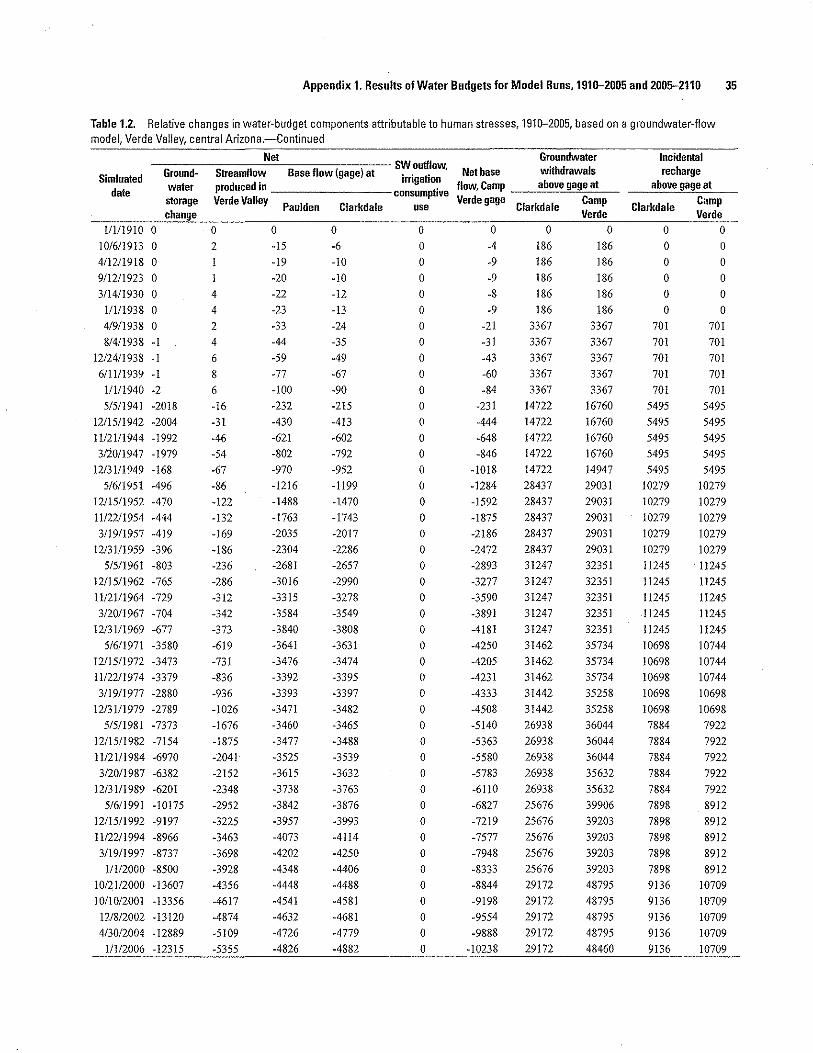
Appendix 1. Results of Water Budgets for Model Runs, 1910--2005 and 2005-2110 35
Table 1.2. Relative changes in water-budget components attributable to human stresses, 1910--2005, based on a groundwater-flow model, Verde Valley, central Arizona.-Continued
Net ---::--;--::::--;;-=-;;-,--~-;-:-- SW outflow,
Ground- Streaodlow Base flow (gage) at Simluated irrigation date water produced in --------consumptive
storage Verde Valley Paulden Clarkdale use change
1/111910 0
10/611913 0
4/12/1918 0
911211923 0
311411930 0
11111938 0
4/9/1938 0
8/4/1938 -1
12/2411938 -1
611111939 -1
11111940 -2 5/511941 -2018
12/15/1942 -2004
ll/2111944 -1992
31201194 7 -1979
12/3111949 -168
5/6/1951 -496
12/1511952 -470
ll/22/1954 -444
311911957 -419
12/3111959 -396
5/511961 -803
12/1511962 -765
ll/2111964 -729
3/20/1967 -704
12/3111969 -677
5/611971 -3580
12/15/1972 -3473
11122/1974 -3379
3119/1977 -2880
12/3111979 -2789
5/511981 -7373
12/15/1982 -7154
IJ/2111984 -6970
3/20/1987 -6382
12/3111989 -620 I
5/611991 -10175
12115/1992 -9197
ll/2211994 -8966
311911997 -8737
11112000 -8500
10/21/2000 -13607
10110/2001 -13356
12/8/2002 -13120
4/30/2004 -12889
11112006 -12315
0 0 2
4
4 2 4 6
8 6
-16
-31
-46 -54
-67
-86
-122
-132
-169
-186
-236
-286
-312
-342
-373
-619
-731
-836
-936
-1026
-1676
-1875
-2041
-2152
-2348
-2952
-3225
-3463
-3698
-3928
-4356
-4617
-4874
-5109
-5355
-15
-19
-20
-22
-23
-33
-44
-59
-77
-100
-232
-430
-621
-802
-970
-1216
-1488
-1763
-2035
-2304
-2681
-3016
-3315
-3584
-3840
-3641
-3476
-3392
-3393
-3471
-3460
-3477
-3525
-3615
-3738
-3842
-3957
-4073
-4202
-4348
-4448
-4541
-4632
-4726
-4826
0 -6
-10
-10
-12
-13
-24
-35
-49
-67
-90
-215
-413
-602
-792
-952
-1199 -1470
-1743
-2017
-2286
-2657
-2990
-3278
-3549
-3808
-3631
-3474
-3395
-3397
-3482
-3465
-3488
-3539
-3632
-3763
-3876
-3993
-4114
-4250
-4406
-4488
-4581
-4681
-4779
-4882
0 0
0 0 0
0 0
0 0 0
0
0
0 0 0 0
0 0 0 0 0
0 0 0
0 0 0
0 0 0
0 0 0
0 0 0 0 0 0 0
0
0 0 0 0 0
Groundwater Incidental Net base withdrawals recharge
flow, Camp _ _cab"'o-'-ve"'g"'a":ge:-'a"-1 _ __a:.:b.;covc:.e-"'ga"'g'::-e a=t __ Verde gage Clarkdale Camp Clarkdale Camp
0
-4
-9 -9 -8
-9 -21
-31
-43
-60
-84
-231
-444 -648
-846
-1018
-1284
-1592
-1875
-2186
-2472
-2893
-3277
-3590
-3891
-4181
-4250
-4205
-4231
-4333
-4508
-5140
-5363
-5580
-5783
-6110
-6827
-7219
-7577
-7948
-8333
-8844
-9198
-9554
-9888
-10238
Verde Verde 0 0 0 0
186
186
186
186
186
3367
3367
3367
3367
3367
14722
14722
14722
14722
14722
28437
28437
28437
28437
28437
31247
31247
31247
31247
31247
31462
31462
31462
31442
31442
26938
26938
26938
26938
26938
25676
25676
25676
25676
25676
29172
29172
29172
29172
29172
186
186
186
186
186
3367
3367
3367
3367
3367
16760
16760
16760
16760
14947
29031
29031
29031
29031
29031
32351
32351
32351
32351
32351
35734
35734
35734
35258
35258
36044
36044
36044
35632
35632
39906
39203
39203
39203
39203
48795
48795
48795
48795
48460
0 0 0 0
0 0
0 0
0 0
701 701
701 701
701 701
701 701
701 701
5495 5495
5495 5495
5495 5495
5495 5495
5495 5495
10279 10279
10279 10279
10279 10279
10279 10279
10279 10279 IJ245 . 11245
IJ245 IJ245
IJ245 11245
11245 IJ245
11245 11245
10698 10744
10698 10744
10698 10744
10698 10698
10698 10698
7884 7922
7884 7922
7884 7922
7884 7922
7884 7922
7898 8912
7898 8912
7898 8912
7898 8912
7898 8912
9136 10709
9136 10709
9136 10709
9136 10709
9136 10709
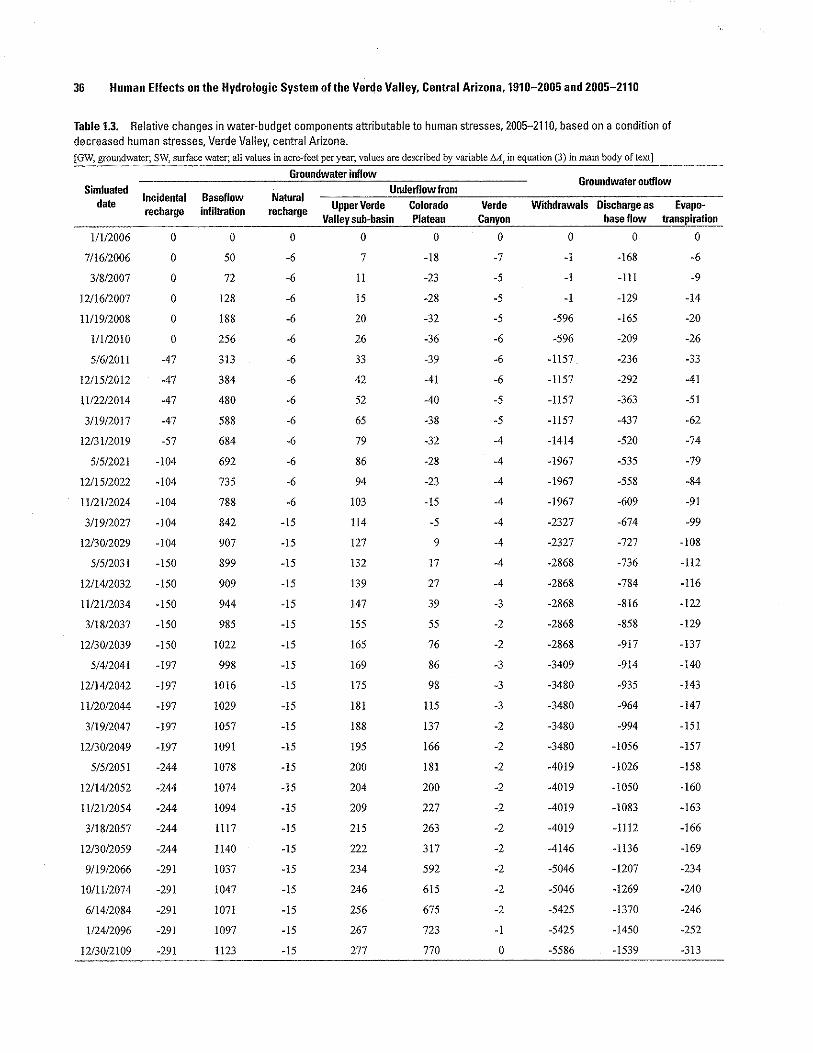
36 Human Effects on the Hydrologic System of the Verde Valley, Central Arizona, 1910-2005 and 2005-2110
Table 1.3. Relative changes in water-budget components attributable to human stresses, 2005-2110, based on a condition of decreased human stresses, Verde Valley, central Arizona. [GW, groundwater; SW, surface water; all values in acre~ feet per year; values are described by variable M
1 in equation (3) in main body of text]
Groundwater inflow Underflow from
Groundwater outflow Simluated
date Incidental recharge
Baseflow infiltration
Natural recharge Upper Verde
Valley subMbasin Colorado Plateau
Verde Canyon
Withdrawals Discharge as base flow
Evapotranspiration
1/1/2006
7/16/2006
3/8/2007
12116/2007
11119/2008
1/112010
5/6/2011
12/15/2012
!1122/2014
3/19/2017
12/3112019
5/5/2021
12/15/2022
11/2112024
3/19/2027
12/30/2029
5/5/203 I
12/14/2032
11/21/2034
3/18/2037
12/30/2039
5/4/2041
12/14/2042
11120/2044
3119/2047
12/30/2049
5/5/2051
12/14/2052
1112112054
3/18/2057
12/30/2059
9119/2066
10/II/2074
6/14/2084
1124/2096
12/30/2109
0
0
0
0
0
0
-47
-47
-47
-47
-57
-104
-104
-104
-104
-104
-150
-150
-150
-150
-150
-197
-197
-197
-197
-197
-244
-244
-244
-244
-244
-291
-291
-291
-291
-291
0
50
72
128
188
256
313
384
480
588
684
692
735
788
842
907
899
909
944
985
1022
998
1016
1029
1057
1091
1078
1074
1094
III7
1140
1037
1047
1071
1097
1123
0
-6
-6
-6
-6
-6
-6
-6
-6
-6
-6
-6
-6
-6
-15
-15
-15
-15
-15
-15
-15
-15
-15
-15
-15
-15
-15
-15
-15
-15
-15
-15
-15
-15
-15
-15
0
7
11
15
20
26
33
42
52
65
79
86
94
103
114
127
132
139
147
!55
165
169
175
181
188
195
200
204
209
215
222
234
246
256
267
277
0
-18
-23
-28
-32
-36
-39
-41
-40
-38
-32
-28
-23
-15
-5
9
17
27
39
55
76
86
98
115
137
166
181
200
227
263
317
592
615
675
723
770
0
-7
-5
-5
-5
-6
-6
-6
-5
-5
-4
-4
-4
-4
-4
-4
-4
-4
-3
-2
-2
-3
-3
-3
-2
-2
-2
-2
-2
-2
-2
-2
-2
-2
-1
0
0
. I
. I
-1
-596
-596
-1157
-1157
-1157
-1157
-1414
-1967
-1967
-1967
-2327
-2327
-2868
-2868
-2868
-2868
-2868
-3409
-3480
-3480
-3480
-3480
-4019
-4019
-4019
-4019
-4146
-5046
-5046
-5425
-5425
-5586
0
-168
-111
-129
-165
-209
-236
-292
-363
-437
-520
-535
-558
-609
-674
-727
-736
-784
-816
-858
-917
-914
-935
-964
-994
-1056
-1026
-1050
-1083
-1112
-1136
-1207
-1269
-1370
-1450
-1539
0
-6
-9
-14
-20
-26
-33
-41
-51
-62
-74
-79
-84
-91
-99
-108
-112
-116
-122
-129
M137
-140
-143
-147
-15 I
-157
-158
-160
-163
-166
-169
-234
-240
-246
-252
-313

Appendix 1. Results of Water Budgets lor Model Runs, 1910--2005 and 2005-2110 37
Table1.3. Relative changes in water-budget components attributable to human stresses, 2005-2110, based on a condition of decreased human stresses, Verde Valley, central Arizona.-Continued
Net --::--;--;::---;;-_:::::_-;.-~:---;--:-:-- SW outflow,
Ground- Streandlow Base flow (gage) at Simluated irrigation date water produced in -------~consumptive
11112006
711612006
3/8/2007
12/16/2007
ll/1912008
11112010
51612011
12/1512012
ll/22/2014
311912017
12/31/2019
5/5/2021
12/15/2022
ll/2112024
3/19/2027
I2130/2029
5/5/2031
12/14/2032
11/21/2034
3118/2037
12/30/2039
51412041
I2114/2042
1112012044
3/19/2047
12/30/2049
515/2051
I2114/2052
11121/2054
3/18/2057
12/30/2059
9/19/2066
1011l/2074
6114/2084
112412096
12130/2109
storage Verde Valley change
0
216
194
276
971
1097
1703
1845
2012
2202
2663
3225
3322
3440
3933
4096
4606
4678
4772
4888
5024
5509
5639
5715
5808
5931
6418
6474
6557
6646
6900
8005
8171
8723
8908
9293
0
-218
-183
-257
-352
-465
-548
-675
-843
-1026
-1204
-1227
-1294
-1397
-1516
-1634
-1635
-1693
-1760
-1843
-1939
-1912
-1950
-1993
-2051
-2147
-2105
-2125
-2177
-2229
-2276
-2244
-2316
-2441
-2547
-2661
Paulden Clarkdale
0
-29
-61
-104
-153
-213
-274
-348
-433
-536
-656
-708
-767
-831
-902
-984
-1018
-1058
-1106
-II61
-1233
-1264
-1299
-1340
-1391
-1459
-1485
-1519
-1556
-1598
-1650
-1767
-1905
-2086
-2253
-2432
0
-43
-67
-98
-159
-225
-297
-378
-478
-592
-728
-781
-840
-926
-1005
-1097
-ll36
-!179
-1238
-1303
-1384
-1419
-1457
-1506
-1560
-1644
-1670
-1715
-1753
-1795
-1852
-1989
-2139
-2358
-2523
-2716
use
0
0
0
0
0
0
0
0
0
0
0
0
0
0
0
0
0
0
0
0
0
0
0
0
0
0
0
0
0
0
0
0
0
0
0
0
Groundwater Net base whhdrawals
llow, Camp _ _..:.ac:.bo:cvc:.e"'ga"'g'::e-"at'--Verde gage Clarkdale Camp
0
-261
-250
-356
-5Il
-689
-845
-1053
-1321
-1617
-1931
-2008
-2133
-2322
-2521
-2731
-2771
-2872
-2998
-3145
-3322
-3331
-3407
-3500
-36Il
-3792
-3774
~3839
-3930
-4024
-4129
-4233
-4455
-4799
-5070
-5378
0
-17
-17
-17
-17
-17
-892
-892
-892
-892
-892
-1766
-1766
-1768
-1768
-1768
-2642
-2642
-2642
-2646
-2657
-3531
-3531
-3531
-3531
-3534
-4408
-4408
-4598
-4600
-4600
-5488
-5488
-5495
-5496
-5612
Verde
0
-18
-18
-18
-613
-613
-2049
-2049
-2049
-2049
-2306
-3734
-3734
-3735
-4094
-4094
-5510
-5510
-5510
-5514
-5525
-6940
-7010
-7010
-7010
-7014
-8427
-8427
-8616
-8619
-8746
-10534
-10534
-10920
-10920
-lll98
Incidental recharge
above gage at
Clarkdale Camp Verde
0
-39
-39
-39
-39
-39
-372
-372
-372
-372
-372
-706
-706
-706
-706
-706
-1039
-1039
-1039
-1039
-1085
-1417
-1417
-1417
-1417
-1417
-1749
-1749
-1749
-1749
-1749
-2139
-2139
-2191
-2191
-2378
0
-39
-39
-39
-419
-419
-419
-419
-429
-809
-809
-809
-809
-809
-Il90
-1190
-1190
-1190
-1236
-1615
-1615
-1615
-1615
-1615
-1994
-1994
-1994
-1994
-1994
-2430
-2430
-2482
-2482
-2669

38 Human Effects on the Hydrologic System of the Verde Valley, Central Arizona, 1910-2005 and 2005-2110
Table 1.4. Relative changes in water-budget components attributable to human stresses, 2005-2110, based on a condition of unchanged human stresses, Verde Valley, central Arizona. [GW, groundwater; SW, surface water; all values in acre-feet per year; values are described by variable AA
1 in equation (3) in main body of text]
Groundwater inflow Underilow from
Groundwater outflow Simluated
date Incidental recharge
Baseflow infiltration
Natural recharge Upper Verde
Valley sub~ basin Colorado Plateau
Verde Canyon
Withdrawals Discharge as base flow
Evapo· transpiration
11112006
7/16/2006
3/8/2007
12/16/2007
1!119/2008
11112010
5/6/2011
12/15/2012
11/22/2014
3/19/2017
12/3112019
5/5/2021
12/15/2022
1112112024
3/19/2027
12/30/2029
5/5/2031
12/14/2032
11/21/2034
3118/2037
12/30/2039
5/4/2041
12/14/2042
11120/2044
3/19/2047
12/30/2049
5/5/2051
12/14/2052
11/21/2054
3/18/2057
12/30/2059
9119/2066
10/1!12074
6/14/2084
1/24/2096
12/30/2109
0
0
0
0
0
0
0
0
0
0
-10
-!0
-10
-10
-10
·10
-10
-!0
-10
-10
-10
-10
-10
-10
-10
-!0
-10
-!0
-10
-10
-10
-10
·10
-10
-10
-10
0
50
72
128
188
256
349
434
540
655
758
803
864
925
993
!064
1101
1129
1178
1231
1279
1295
1340
1379
1389
1367
1382
1390
1412
1442
1457
1535
1595
1646
1693
1777
0
-6
-6
-6
-6
-6
-6
·6
-6
-6
-6
-6
-6
-6
-15
-15
-15
-15
-15
-15
-15
-15
-15
·15
-15
-15
·15
-15
-15
-15
-15
-15
-15
-15
-15
-15
0
7
11
15
20
26
33
42
52
65
80
87
95
105
116
129
135
143
151
161
171
176
182
190
198
207
212
217
223
230
237
252
269
286
304
322
0
-18
-23
-28
-32
-36
-39
-42
-42
-40
-35
-31
-25
-17
-7
9
17
29
44
65
92
!06
126
153
190
248
281
328
401
526
589
624
685
734
785
837
0
-7
-5
-5
-5
-6
-5
-6
-5
-5
-4
-4
·4
-4
-4
·4
·4
-3
·3
-3
·2
·3
-3
-3
-2
-2
·2
-3
-2
·2
-3
-3
-3
-3
·2
-I
0
-1
·1
-1
-596
-596
-596
-596
-596
-596
-861
-861
-861
-861
-1244
-1244
-1244
·1244
-1244
-1244
-1324
-1324
-1324
-1324
-1685
-1769
-1919
-1919
-2300
-2300
-2300
-2381
-2731
-2886
-2886
-2895
0
-168
·lll
-129
-165
-209
-256
-319
-399
-473
-561
-597
-633
-689
-754
-828
-852
-908
-973
-1012
-1080
-1106
-1139
-1180
·1234
-1281
-1287
·1317
-1352
-1397
-1447
-1577
-1663
-1814
-1947
-2098
0
-6
-9
-14
-20
-26
-34
-43
-53
-65
-78
-84
-91
-99
-!08
-118
-123
-129
-136
-144
-154
-158
-162
-167
-173
-238
-241
-244
-248
-252
-256
-264
-270
-332
-341
-353

Appendix 1. Results of Water Budgets for Model Runs, 1910-2005 and 2005-2110 39
Table 1.4. Relative changes in water-budget components attributable to human stresses, 2005-2110, based on a condition of unchanged human stresses, Verde Valley, central Arizona.-Continued
Simluated date
1/l/2006
7/16/2006
3/8/2007
12/16/2007
11119/2008
111/2010
5/6/2011
12/15/2012
ll/22/2014
3/19/2017
12/3112019
5/5/2021
12/15/2022
11121/2024
3/19/2027
12/30/2029
5/5/2031
12114/2032
ll/2!12034
3/18/2037
12/30/2039
5/4/2041
12/14/2042
11120/2044
3/19/2047
12/30/2049
5/5/2051
12/14/2052
11/21/2054
3/18/2057
12/30/2059
9/19/2066
10/11/2074
6114/2084
1/24/2096
12/30/2109
Net -::---:--::---::--='-'--=-----::--:----:-- SW outflow,
Ground- Streandlow Base flow (gage) at irrigation water produced in --------consumptive storage Verde Valley Paulden Clarkdale use
0
216
194
276
971
1097
1238
1401
1583
1797
2280
2385
2508
2648
3190
3371
3451
3554
3673
3823
4069
4127
4231
4352
4799
5093
5301
5412
5930
6140
6296
6596
7197
7645
7915
8218
0
-218
-183
-257
-352
-465
-606
-752
-939
-1128
-1319
-1400
-1496
-1614
-1747
-1892
-1952
-2037
-2151
-2242
-2358
-2401
-2478
-2559
-2623
-2648
-2669
-2707
-2764
-2838
-2904
-3112
-3258
-3461
-3641
-3875
0
-29
-61
-104
-153
-213
-281
-362
-457
-570
-698
-758
-826
-897
-976
-1075
-1116
-1169
-1234
-1301
-1391
-1435
-1486
-1546
-1617
-1692
-1736
-1781
-1835
-1900
-1974
-2164
-2344
-2540
-2751
-2956
0
-43
-67
-98
-159
-225
-304
-392
-502
-624
-770
-829
-900
-994
-1072
-1201
-1235
-1288
-1382
-1441
-1553
-1599
-1653
-1727
-1805
-1873
-1926
-1977
-2031
-2101
-2183
-2411
-2599
-2840
-3066
-3298
0
0
0
0
0
0
0
0
0
0
0
0
0
0
0
0
0
0
0
0
0
0
0
0
0
0
0
0
0
0
0
0
0
0
0
0
Groundwater Incidental Net base withdrawals recharge
flow, Camp ----=a=bo:.:v.::e;o:ga3go;:e.::al:__ __,::ab:.:o::ve::_g"'a"'g'O:e :::at:__
Verde gage Clarkdale Camp Clarkdale Camp
0
-261
-250
-356
-511
-689
-910
-1144
-1441
-1752
-2089
-2230
-2396
-2608
-2819
-3093
-3187
-3325
-3533
-3684
-3911
-4001
-4132
-4286
-4428
-4521
-4595
-4684
-4795
-4939
-5087
-5523
-5857
-6300
-6707
-7173
0
-17
-17
-17
-17
-17
-17
-17
-17
-17
-17
-17
-18
-18
-18
-18
-18
-18
-31
-34
-34
-34
-34
-257
-261
-261
-261
-264
-264
-264
-264
-289
-289
-298
-839
-983
Verde Verde
0
-18
-18
-18
-613
-613
-613
-613
-613
-613
-878
-878
-880
-880
-1262
-1262
-1262
-1262
-1274
-1278
-1358
-1358
-1358
-1581
-1946
-2030
-2180
-2183
-2564
-2564
-2564
-2670
-3020
-3184
-3725
-3878
0
-39
-39
-39
-39
-39
-39
-39
-39
-39
-39
-39
-39
-39
-39
-39
-39
-39
-90
-90
-90
-90
-90
-90
-90
-90
-90
-90
-90
-90
-90
-160
-160
-188
-333
-525
0
-39
-39
-39
-39
-39
-39
-39
-39
-39
-49
-49
-49
-49
-49
-49
-49
-49
-100
-100
-100
-100
-100
-100
-100
-100
-100
-100
-100
-100
-100
-170
-170
-198
-343
-535

40 Human Effects on the Hydrologic System of the Verde Valley, Central Arizona, 1910-2005 and 2005-2110
Table1.5. Relative changes in water-budget components attributable to human stresses, 2005--2110, based on a condition of increased human stresses, Verde Valley, central Arizona. [GW, grOlUldwater; SW, surface water; all values in acre-feet per year; values are described by variable M
1 in equation (3) in main body of text]
Simluated date
1/1/2006
7/16/2006
3/8/2007
12/16/2007
11/19/2008
111/2010
5/6/2011
12/15/2012
11/22/2014
3/19/2017
12/31/2019
5/5/2021
12/15/2022
11/2112024
3/19/2027
12/30/2029
5/5/2031
12/14/2032
11/21/2034
3/18/2037
12/30/2039
5/4/2041
12/14/2042
11/20/2044
3/19/2047
12/30/2049
5/5/2051
12/14/2052
11121/2054
3/18/2057
12/30/2059
9/19/2066
10111/2074
6/14/2084
1/24/2096
12/30/2109
Incidental recharge
0
0
0
0
0
0
47
47
47
37
37
84
84
84
84
84
131
131
131
131
131
178
178
178
178
178
225
225
225
225
225
272
272
272
307
307
Baseflow infiltration
0
50
72
128
188
256
384
482
597
715
829
909
989
1063
1137
1222
1288
1336
1393
1465
1531
1596
1659
1636
1663
1696
1757
1784
1811
1856
1895
2025
2072
1966
2049
2126
Groundwater inflow
Natural recharge
Underflow from
0
-6
-6
-6
-6
-6
-6
-6
-6
-6
-6
-6
-6
-15
-15
-15
-15
-15
-15
-15
-15
-15
-15
-15
-15
-15
-15
-15
-15
-15
-15
-15
-15
-15
0
0
Upper Verde Valley sub-basin
0
7
II
15
20
26
33
42
53
65
80
87
96
106
118
132
138
146
155
166
178
183
190
199
208
219
224
230
236
244
253
274
296
320
346
372
Colorado Plateau
0
-18
-23
-28
-32
-36
-40
-44
-44
-43
-37
-33
-28
-20
-8
10
20
34
53
80
119
140
172
217
288
414
499
573
583
595
611
672
724
777
835
896
Verde Canyon
0
-7
-5
-5
-5
-6
-5
-6
-5
-5
-4
-4
-4
-4
-4
-4
-3
-3
-3
-2
-2
-3
-3
-3
-2
-2
-3
-3
-3
-3
-3
-4
-3
-4
-3
-2
Groundwater outflow
Withdrawals Discharge as base flow
0
-1
-I
-I
-596
-596
-35
-35
-35
-309
-309
244
244
-161
-161
-161
381
381
381
381
293
832
832
333
-261
-261
248
248
248
248
-69
106
106
-162
175
175
0
-168
-111
-129
-165
-209
-277
-348
-431
-511
-597
-659
-701
-763
-840
-917
-973
-1032
-1092
-1169
-1246
-1284
-1340
-1391
-1432
-1512
-1536
-1577
-1631
-1693
-1758
-1939
-2090
-2282
-2486
-2673
Evapotranspiration
0
-6
-9
-14
-20
-26
-35
-45
-56
-68
-82
-89
-97
-105
-116
-127
-133
-141
-149
-159
-169
-174
-180
-246
-252
-259
-262
-266
-269
-272
-276
-285
-292
-416
-432
-450

Appendix 1. Results of Water Budgets for Model Runs, 191D-2005 and 200!;-2110 41
Table 1.5. Relative changes in water-budget components attributable to human stresses, 2005-2110, based on a condition of increased human stresses, Verde Valley, central Arizona.-Continued
Simluated date
1/1/2006
7116/2006
3/8/2007
12/16/2007
ll/19/2008
1/1/2010
5/6/2011
12/15/2012
ll/22/2014
3/19/2017
12/31/2019
5/5/2021
12/15/2022
11121/2024
3/19/2027
12/30/2029
5/5/2031
12/14/2032
11/21/2034
3/18/2037
12/30/2039
5/4/2041
12/14/2042
11120/2044
3119/2047
12/30/2049
5/5/2051
12/14/2052
11121/2054
3/18/2057
12/3012059
9119/2066
10/ll/2074
6114/2084
1/24/2096
12/30/2109
Net --:----,---,---cc--==-=--=-.,----,--- SW outflow,
Ground- Streandlow Base flow (gage) at irrigation water produced in --------consumptive storage Verde Vallev change
0
216
194
276
971
1097
782
965
l162
1636
1885
1550
1698
2257
2439
2641
2302
2436
2584
2749
3045
2693
2847
3455
4278
4533
4251
4420
4533
4638
5084
5342
5632
6174
6248
6644
0
-218
-183
-257
-352
-465
-662
-830
-1028
-1226
-1426
-1568
-1690
-1826
-1977
-2139
-2261
-2368
-2485
-2633
-2776
-2880
-3000
-3027
-3095
-3208
-3292
-3361
-3441
-3549
-3652
-3963
-4161
-4248
-4535
-4799
Paulden Clarkdale
0
-29
-61
-104
-153
-213
-290
-378
-481
-605
-738
-807
-883
-961
-1053
-1162
-1216
-1278
-1358
-1447
-1550
-1602
-1669
-1743
-1826
-1927
-1983
-2043
-2111
-2197
-2293
-2512
-2729
-2962
-3190
-3415
0
-43
-67
-98
-159
-225
-313
-411
-526
-659
-808
-879
-961
-1056
-1153
-1285.
-1339
-1407
-1496
-1608
-1724
-1767
-1847
-1925
-2007
-2122
-2179
-2246
-2312
-24ll
-2527
-2778
-3007
-3285
-3544
-3795
use
0
0
0
0
0
0
0
0
0
0
0
0
0
0
0
0
0
0
0
0
0
0
0
0
0
0
0
0
0
0
0
0
0
0
0
0
Groundwater Net base withdrawals
flow, Camp _ _,a:::bo::v:::e2!ga,g':e_,a,_t _ Verde gage Clarkdale Camp
0
-261
-250
-356
-511
-689
-974
-1241
-1554
-1886
-2234
-2447
-2651
-2882
-3130
-3423
-3600
-3775
-3981
-4241
-4501
-4647
-4846
-4952
-5102
-5330
-5471
-5608
-5754
-5960
-6180
-6742
-7168
-7533
-8080
-8594
0
-17
-17
-17
-17
-17
857
857
857
857
857
1731
1731
1731
1731
1718
2592
2592
2588
2588
2345
3213
3213
3208
3208
3208
4073
4073
4073
4073
4067
4910
4900
4259
4251
4091
Verde
0
-18
-18
-18
-613
-613
822
822
822
549
549
1975
1975
1570
1570
1557
2973
2973
2969
2969
2639
4045
4045
3542
2947
2947
4321
4321
4321
4321
3998
5016
5006
4096
4426
4266
Incidental recharge
above gage at
Clarkdale Camp Verde
0
-39
-39
-39
-39
-39
295
295
295
295
295
628
628
628
628
574
906
906
906
906
906
1238
1238
1238
1238
1238
1570
1570
1570
1570
1570
1902
1785
1698
1656
1471
0
-39
-39
-39
-39
-39
342
342
342
332
332
712
712
712
712
658
1037
1037
1037
1037
1037
1416
1416
1416
1416
1416
1795
1795
1795
1795
1795
2173
2057
1969
1963
1778

42 Human Effects on the Hydrologic System of the Verde Valley, Central Arizona, 1910-2005 and 2005-2110
Appendix 2. Evapotranspiration by Riparian Vegetation, 2000-2010, Estimated Using Remote Sensing
This appendix provi<:les an estimate of riparian evapotranspiration (ET) in the Verde Valley that is independent of the methods used by the Northern Arizona Regional Groundwater Flow Model. Advances in satellite-based remotesensing technology have enabled the development of methods that use empirical regression models to estimate ET in the American Southwest (Nagler and Glenn, 2009; Nagler and others, 2009), This method was used at a regional scale for the determination of groundwater availability (Tillman and others, 20 II), and the same method has been applied to the Verde Valley, with the results presented in this appendix. Average annual groundwater discharge by riparian vegetation was estimated for the study area for the period 2000 through 20 I 0.
Methods
This method uses a regression model that relates measured ET to remotely sensed data from the Moderate Resolution Imaging Spectroradiometer (MODIS) satellite's Enhanced Vegetation Index (EVI) grid data (Oak Ridge National Laboratory, 2008). Computation of final values consisted of four steps, described in the following sections.
Estimates of Monthly ET Across Entire Verde Valley
Enhanced Vegetation Index (EVI) is a measure of vegetation greenness to which evapotranspiration is directly correlated (Nagler and Glenn, 2009; Nagler and others, 2009). EVI raster data from the MODIS instrumentation aboard the Terra and Aqua satellites operated by the National Aeronautics and Space Administration (NASA) were obtained fi·om the Oak Ridge National Laboratory (Oak Ridge National Laboratory, 2008) in multiple 171 115-mi bands and combined using a mosaic tool to cover the study area. Near-daily satellite passes provided 820 820-ft resolution EVI data composited over 16-day intervals for the 2000 through 2010 time period. ET (in millimeters per day; mm/day) was calculated inArcGIS™ on 820 820-ft individual grid cells for the entire study area from EVI data using a relation developed previously by researchers with the USGS Southwest Biological Science Center and the University of Arizona (Nagler and Glenn, 2009; Nagler and others, 2009):
ET~ 1.22 ET, EVf, (I)
where ET0
is the reference crop evapotranspiration (in millimeters per day) and EVI" is scaled EVL This relation between ET, ET
0, and EVI* was developed by regressing actual ET
data measured by sap flux sensors, moisture flux towers, and neutron hydroprobe water balance measurements in ripar-ian and agricultural areas along the Lower Colorado River in
Arizona, and it is validated in other publications (Nagler and Glenn, 2009; Nagler and others, 2009). Plants included in the regression model were alfalfa (the most common crop along the Lower Colorado River), saltcedar (the most common riparian species), cottonwoods, and arrowweed.
ET0
was estimated on a monthly basis using a modified Blaney-Criddle relation (Brouwer and Heibloem, 1986):
ET, ~ p (0.46 T'"""" + 8) , (2) where p is mean daily percentage of annual daytime hours (percent) obtained from published values for the study area (Brouwer and Heibloem, 1986) and Tmean is mean daily temperature. Tmean was calculated on a monthly basis from daily minimum and maximum temperature data (PRISM Climate Group, 2012). EVI is converted to a scaled value (EVI') following the relation of Nagler and others (2005):
EVI* ~ 1-(0.542-EVJ)/(0.542-0.091), (3)
where 0.542 and 0.091 represent maximmn and minimum EVI values, respectively, from a large data set of riparian plant communities in the Southwest (Nagler and others, 2005; Dennison and others, 2009). These same riparian plant communities are found throughout the Verde Valley, the study area of the present report.
Computed groundwater-discharge-by-vegetation grid cells of 820 820ft using equations (I), (2), and (3) were downsampled in ArcGIS to 164 164-ft grids using nearest neighbor interpolation for further analyses. The 164 164-ft grid values that were spatially associated with the combined stream buffer and land cover areas were extracted for computation of summary statistics.
Subselect Areas Where ET is Likely from Groundwater
Geographic areas of presumed groundwater-using vegetation were defined using a combination of proximity to surface-water drainages and landcover types. First, a 164-ft (50-meter) buffer was created around all named surface-water drainages in the study area using geographic information system tools (Arizona State Land Department, 1993). The 164-ft buffer distance was selected to adequately encompass riparian vegetative areas based on analyses of satellite and aerial photography of the surface-water drainages in the study area. Areas within the 164-ft surface-drainage buffer that were defined in the 200 I National Land Cover Dataset (NLCD; Homer and others, 2004) as "hay/pasture" or "cultivated crops" were removed, because these areas are normally irrigated in the study area and do not use groundwater directly. All remaining vegetation within the buffer area was presumed to be using primarily groundwater for growth and maintenance.
Not all of the surface-water drainages identified in this analysis necessarily have riparian ET associated with them, particularly the smallest and most ephemeral streams. For the purposes of comparison, named streams were further subdivided into two groups. Oak Creek, Wet Beaver Creek, and West Clear Creek formed the first group, and are the major perermial streams in the Verde Valley. The second group comprised all remaining named surface-water drainages.

Appendix 2. Evapotranspiration by Riparian Vegetation, 2000-2010, Estimated Using Remote Sensing 43
Specific land coverages within the NLCD were used to define additional areas of groundwater-using vegetation in the study area that were outside the 164-ft surface-drainage buffer. Land classifications of~'herbaceous wetland" and "woody wetland" were selected to represent locations at which all or nearly all water extracted by plants comes from groundwater. Herbaceous V·ietland is defined in NLCD as land in which the soil or substrate is periodically saturated or inundated with water and which is covered by more than 80 percent pereilllial herbaceous vegetation; woody wetland is defined as land in which the soil or substrate is periodically saturated or inundated with water and which is covered by more than 20 percent forest or shrubland.
Adjustment for Possible Contributions of Direct Precipitation
Direct precipitation may potentially be at least a partial source of water for vegetation greenness and associated EVI in the subset areas defined above. Therefore, a lower bound on estimated groundwater discharge by vegetation for the study area was developed by subtracting monthly precipitation (PRISM Climate Group, 2012) from monthly riparian ET estimates developed in the preceding step.
Calculation of Summary Statistics
Monthly values of groundwater ET were summed to obtain annual values for the years 2000-2010. Annual mean values were then calculated from these annual values, and those are reported in the tables of this appendix and in the main body of this repOit.
All values calculated using these methods were converted from original metric units to the units used throughout this report. For example, cubic meters per year were converted to acre-feet per year.
Results
Annual average groundwater discharge by riparian vegetation in the Verde Valley for 2000-2010 was estimated to be 23,000-41,000 acre-ftlyr (table 2.1) if it is assumed that all named surfacewater drainages have riparian ET. The variability between the low and high values in this range is accounted for by the amount of precipitation falling on the areas of presumed riparian ET.
Because Oak Creek, Wet Beaver Creek, and West Clear Creek are considered to be the only named surface-water drainages that likely have riparian ET, the estimated amJUal average groundwater discharge by riparian vegetation in the Verde Valley for 2000-2010 was reduced to 14,000-22,000 acre-ftlyr.
Cyclical seasonal patterns were evident in the temporal computed ET data, with high rates and volumes of ET during summer months and low rates and volumes during winter months. For most winter time periods, minimal ET rates combined with adequate precipitation resulted in little or no groundwater ET for the lower bound estimate. The woody wetland land-cover area produced the greatest volume of annual ET-as much as about 5,300 acre-ft!yr.
Table 2.1. Riparian evapotranspration estimated by using remotely sensed satellite data, 2000-2010, Verde Valley, central Arizona.
Woody wetlands Landcoveil 3,883 5,276 Oak Creek Stream proximity4 2,912 4,707 Verde River Stream proximity 2,889 4,224 West Clear Creek Stream proximity 2,056 4,319 Emergent herbaceous Landcover 1,214 1,621 wetlands
Wet Beaver Creek Stream proximity 1,138 1,908 Subtotal 14,000 22,000
!lPJ~~~r!~~~-tfl;iW'~!lffii91J)t~iliiDrD~J.VrPtfii~~~:I!P~?-!~~Z!Y~P1Jj(~H~P!~~t!:~~j Jacks Canyon Stream proximity 787 1,817 Dty Beaver Creek Stream proximity 601 1,277 Spring Creek Stream proximity 581 1,281 West Fork Oak Creek Stream proximity 580 1,214 Rarick Canyon Stream proximity 577 1,320 Dry Creek Stream proximity 532 1,177 Rattlesnake Canyon Stream proximity 485 1,117 Cherry Creek Stream proximity 468 902 Oak Wash Stream proximity 408 683 Clover Creek Stream proximity 368 831 Beaver Creek Stream proximity 346 587 Toms Creek Stream proximity 308 706 Wickiup Creek Stream proximity 267 608 Walker Creek Stream proximity 246 480 Coffee Creek Stream proximity 229 542 Pumphouse Wash Stream proximity 219 516 Walnut Creek Stream proximity 207 444 Brady Canyon Stream proximity 191 474 Corduroy Wash Stream proximity 188 446 Long Canyon Stream proximity 187 520 Blowout Creek Stream proximity 145 295 Gaddis Wash Stream proximity 140 255 Bitter Creek Stream proximity 118 277 Woody Wash Strean1 proximity 116 269 Soldier Wash Stream proximity 113 226 Russell Wash Stream proximity Ill 222 Grief Hill Wash Stream proximity 79 175 Schoolhouse Draw Stream proximity 77 199 Grandpa Wash Stream proximity 56 128 Turkey Creek Stream proximity
1Annual mean computed for calendar years 2000-2010. 2Gridded precipitation obtained from PRISM <;:limate Group (2012). 3Selected on the basis of National Land Cover Dataset (Homer and others, 2004). 4Selected on the basis of being within 164 feet of a named stream channel.

44 Human Effects on the Hydrologic System of the Verde Valley, Central Arizona, 1910-2005 and 2005-2110
Appendix 3. Irrigation-Water Consumptive Use, 2010, Estimated Using a Crop Inventorying Approach
Irrigation water use in the Verde Valley historically has not been well characterized. To better understand this component of the water budget, an indirect method to estimate irrigation withdrawal was employed (Dickens and others, 2011 ). This calculates an estimate of irrigation consumptive use in the Verde Valley that is independent of the Northern Arizona Regional Groundwater Flow Model. Total itrigation water needs were estimated for each crop by using the equation:
where W, =(A, CJ I L 1
We is irrigation withdrawals per growing season for a particular crop in acre-feet per grOwing season,
Ac is total planted area of a given crop in acres, Cc is the consumptive water requirement for a given crop
in feet per growing season, and L, is a dimensionless irrigation-efficiency coefficient ' between 0 and I for the irrigation infrastructure used for each
field of the given crop.
A, (total planted acreage) was calculated for each crop using a combination of aerial photography, field inspection, and a geographic information system (fig. 3.1). For each nonfallow field, the crop type, iiTigation~water source, irrigation system, irrigationsystem efficiency, and any other observations regarding irrigation practices were recorded during both the summer and winter field inventories. Golf courses and athletic fields were assumed to obtain irrigation water from groundwater wells.
Cc (consumptive water requirement) was estimated by using the modified Blaney-Criddle ET method (U.S. Bureau of Reclamation, 1992). Local average temperature and rainfall data from the Montez~ma Castle National Monument weather station (National Oceanic and Atmospheric Administration, 2010), which is located about 5 miles north of Camp Verde, Arizona, were applied in this method.
L(irrigation-efficiency coefficient) represents all water ' losses caused by inefficiencies in irrigation infrastructure and
water~application method. The factors considered include: conveyance loss, irrigation system efficiency, overwatering, and irrigation-system age and condition, among others. Ranges for L were obtained from Howell (2003), and specific values
' were chosen through professional judgment. About 97 percent of all irrigated agricultural acres in the study area used flood
Alfalfa Grass Home grass Horse property Orchard and grass Pecan and grass
Figure 3.1. Consumptive use of irrigation water in the Verde Valley, central Arizona. A Photograph of irrigated fields observed in July 2010. 8, Photograph of horse property and pasture land being flooded with surface water. C, Conceptual map showing example of area inventoried in July 2010 for irrigation consumptive use.

Appendix 4. One-Hundred-Year Capture Maps for the Verde Valley 45
irrigation, whose efficiency was estimated to be 0.5, or 50 percent. Two percent of irrigated acreage was watered with sprinklers, which were observed to have a system efficiency of0.8 (that is, SO-percent efficient). Less than one percent of irrigated acreage was watered using drip irrigation, which has an efficiency of about 0.9.
In July 2010, about 10,500 acre-ft of irrigation surface water was estimated to be needed to meet the water demands of crops in the study area on the basis of these methods (see the table in the inset titles "An Independent Estimate of Crop Irrigation Consumptive Use" in the main body of this report). Because of system inefficiencies in iiTigation infrastructure and application methods, 20,800 acre-ft of water was estimated to be needed to be diverted from streams. Discussion of the amount of water needed by irrigation systems but not used by crops (10,300 acre-ft) was beyond the scope of this report; possible pathways for such water include ditch leakage, evaporation, ET from vegetation along irrigation ditches, and irrigation excess or return flow (Healy and others, 2007) that either runs off fields or infiltrates past root zones and becomes groundwater recharge. Future studies, particularly ones producing a more complete view of the hydrology of the ditch diversions, could help researchers understand this better.
In Febmary 2011, the same fields (inventoried in July 2010) were re-inventoried. No active use of irrigation water was observed. Although some ditch diversions continue to convey water during the winter months, no evidence was observed of this water being applied for winter irrigation. A small amount of diverted water in ditches may be used to maintain stock tanks or ponds in the winter months1 but quantifying such use was beyond the scope of this report.
Appendix 4. One-Hundred-Year Capture Maps for the Verde Valley
The main body of this report evaluated basin-wide effects of human stresses by using water budgets, but did not generally discuss the spatial distribution of those stresses. However, there is value in exploring their spatial distribution. This appendix presents three maps produced by a technique known as capture-map development. Groundwater pumping removes water from storage in the aquifer, and with time, the effects of pumping will spread to greater distances and can reduce groundwater discharge to natural features. The timing of these effects is dependent on aquifer properties and on the proximity of pumping locations to streams, springs, wetlands, and riparian vegetation. Both of these factors in the timing of capture are spatial in nature.
Capture maps indicate, for a given location, what fraction of water from a well would be derived from capture-the reduction in natural discharge and (or) increase in natural recharge-after a fixed period oftime for a given layer of a groundwater·ftow model. Locations on these maps with larger
values for this fraction (redder colors, as much as a fraction of 1.0) indicate that a larger amount of water would be obtained by capture than area.<; with smaller values of this fraction (bluer colors, as little as a fraction of 0.0). The maps were created by researchers assuming a well in a location pumps water at a constant rate for the period of time encompassed (I 00 years in this example), that the groundwater system responds linearly, and that changes in saturated thickness of aquifers (and therefore changes in transmissivity) are negligible. Capture maps can be used as guides for locating wells or rutificial recharge infrastructure and to understand how soon such equipment might produce an effect on-a connected feature such as a stream or wetland. Capture maps also can be used in the reverse sense to understand the timing of enhanced water availability to streams and vegetation by artificial recharge. For example, recharge in red map areas would enhance water availability much more quickly than recharge in blue map areas.
The method documented in Leake and others (2010) and Leake and Pool (20 1 0) was used to create these maps. Leake and Pool (201 0) published capture maps for the Verde Valley for 10- and 50-year intervals. This appendix presents maps for the I 00-year interval, which corresponds to the amount of time used for forward~ looking model runs in the main body of this report. The maps in this appendix were generated from raw tabular data associated with Leake and Pool (20 1 0). Maps in this appendix are, therefore, visualizations of alreadypublished data, employing the same method of visualization as used by Leake and Pool (2010).
The capture map for layer 1 (fig. 4.1) has only a small portion of the study area shaded in any color. This is because layer 1 ofthe underlying groundwater-flow model is not laterally extensive in the study area (layer 1 is used to simulate the fluviolacustrine facies of the Verde Formation and saturated stream alluvium). The pattern of coloration in this 100-year capture map generally is the same as the 10- and 50-year maps of Leake and Pool (2010), except that all colors are shaded more toward the red (more capture), and a larger area is fully red (90 to 100 percent capture).
The capture map for layer 2 (fig. 4.2) covers a larger portion of the Verde Valley; layer 2 is used to simulate the Supai Formation of the Colorado Plateau and the sand and gravel facies of the Verde Fonnation.
The capture map for layer 3 (fig. 4.3) covers almost all of the study area as well as the adjacent upper portion of the Verde Valley subbasin. This map expresses capture within the Red wall aquifer that underlies almost all of the study area; it also includes some areas of older crystalline and sedimentary rocks along the southern margins of the study area. One part of the map near Stoneman Lake could not be visualized because the method employed in developing capture maps failed to have the groundwater-How model converge to a solution. This likely was caused by the dewatering of layer 2 in this area, which resulted in a change in hydraulic properties between layers 2 and 3. In this area, layer 2 (simulating the Supai Formation) has low saturated thickness (S. Leake, U.S. Geological Survey, oral commun., 2012).

46 Human Effects on the Hydrologic System ofthe Verde Valley, Central Arizona, 1910-2005 and 2005-2110
Figure 4.1 Map showing computed reduction in flow of streams and springs and reduction in riparian eva potra nspi ration as a fraction of pumping rate that would result from pumping groundwater from NARGFM layer 1 at a constant rate for 100 years. The color at any location represents the fraction ofthe pumping rate by a well at that location that can be attributed to changes in outflow from or inflow to the aquifer.
Figure 4.2 Map showing computed reduction in flow of streams and springs and reduction in riparian evapotranspiration as a fraction of pumping rate that would result from pumping groundwater from NARGFM layer 2 at a constant rate for 100 years. The color at any location represents the fraction of the pumping rate by a well at that location that can be attributed to changes in outflow from or inflow to the aquifer.
35"
"""
35"
34"3(1"
Base modified from U.S. Geological Survey digital data, 1:100,000, 1982 Universal Transverse Msrcator projection, Zone 12
10 15 ?.0 KILOMI?TEf!S
Total reduced flow as a fraction of
pumping rate at lOG years
~
Q-0.1
0.1-D.2
0.2·--0.3
0.3-{).4
; 0.4-D.S
0.5-0.6
0.8-0.7
0.7-0.8
0.8-0.9
0.9-1.0
0-0.1
0.1--().2
0.2-().3
0.3-0.4
0.4-0.5
0.5-0.6
0.6-0.7
0.7-D.S
0.8-0.9
0.9-1.0

Figure 4.3. Map showing computed reduction in flow of streams and springs and reduction in riparian eva potra nspi ration as a fraction of pumping rate that would result from pumping groundwater from NARGFM layer 3 at a constant rate for 100 years. The color at any location represents the fraction ofthe pumping rate by a well at that location that can be attributed to changes in outflow from or inflow to the aquifer.
35°
34"30"
Appendix 4. One-Hundred-Year Capture Maps for the Verde Valley 47
Base modified 11om U.S. Geological Survey digital data. 1:100.000. 1982 Universal Transverse Mercator projection. Zone 12
ID 15 7.0 KILOMETERS
Total reduced flow as a fraction of
0.2-0.3
0.3-0.4
0.4-D.5
0 5-D 6
0.6-0.7
0.7-0.8
0.8-09
0.9-1.0
Menlo Park Publishing Service Center, California
Manuscript approved for publication, February 5, 2013
Edited by Larry B. Slack and Claire M. Landowski Design and layout by Jeanne S. Dileo