Embed Size (px)
Citation preview

By:
Ahmed Salem Al Memari
Student Number 2014148132
Project submitted in partial fulfilment of the requirements for the
degree of MSc Engineering Management
Faculty of Engineering & Information Technology
Module Coordinator
Dr. Alaa A-Ameer
MAY 2016
Improving Healthcare Services by Quality Function Deployment (QFD)
(QFD)تحسین الخدمات الصحیھ بالستخدام نشر تطبیق الجودة

1
الملخص
. الصحیة الرعایة قطاع في المنافسة لزیادة نظرا كبیرة أھمیة (TQM) الشاملة الجودة إدارة أدوات اكتسبت
بستخدام المستشفى نطاق على تطبیقھا من لابد و ،لھذا النھج دارةالإ ضمان على قومی أن إلى البیع نھج یحتاج
البحث لھذا اختیارھا تم التي المستشفى من الملاحظات أظھرت. للجودة المستمر لتحسینا لضمان منتظم نھج
منھجي أسلوب ھو (QFD) الجودة تطبیق نشر. المناطق بعض في العملاء توقعات تلبیة أجل من كافحت اأنھ
واسع نطاق على الأداة استخدام یتم لذلك،. العملاء احتیاجات على تعتمد التي المنتجات أو الخدمات لتصمیم
.تقریبا الصناعات جمیع في
لتطویر كأسلوب) QFD( الجودة تطبیق نشر فیھا إستخدام یتم التي الأسباب على البحثیة الورقة ھذه وتشرح
الورقة ھذه الجودة. حالة دراسةل ، بالستخدام مستشفى مختارالصحیة الرعایة في الشاملة الجودة نموذج
الدراسة وأظھرت. الصحیة الرعایة خدمات في) QFD( الجودة نطبیق نشر استخدام إمكانیة تكتشف البحثیة
المادي الصناعي الإنتاج خارج التقلیدیة) QFD( الجودة نطبیق نشر نظریة على المفروضة القیود بعض
إلى واستنادا. الصحیة الرعایة خدمات في) QFD( الجودة تطبیق للنشر امتدادا تعدیلاتلكن أضھرت الو
.الشاملة الجودة التنمیة في الصحیة الرعایة إدارة في بھا للاسترشاد الشاملة الجودة نموذج تطویر تم نتائج،ال
2
ABSTRACT
The tools of the Total Quality Management (TQM) have gained high importance due to
increasing competitions in the healthcare industry. As a selling approach needs to be based on
management assurance, this has to be applied hospital-wide with a systematic approach for the
continuous quality improvement. The observations from the selected hospital for this research
showed that it is struggling to meet customers' expectations in some areas. The quality
function deployment (QFD) is a systematic technique for designing services or products that
are based on the customers' needs. Therefore, the tool is widely used in almost all industries.
This research paper elaborates on the reasons the quality function deployment (QFD) is
selected as a technique to develop a total quality healthcare model. With the help of a hospital-
based case study, this research paper discovers the possibility of using the quality function
deployment (QFD) in the healthcare service. The paper showed some limitations of the
conventional quality function deployment (QFD) outside the physical industrial production
and presented modifications as an extension of the quality function deployment (QFD) in the
healthcare service. Based on the outcomes, a total quality model was developed to guide the
healthcare management in their total quality development.
3
Table of Contents CHAPTER ONE ......................................................................................................................................... 5
INTRODUCTION ....................................................................................................................................... 5
1.1. Research Problem ....................................................................................................................... 5
1.2. Research Aims ............................................................................................................................. 5
1.3. Research Methodology (Quality Function Deployment QFD) ................................................ 6
1.4. Quality Function Deployment (QFD) Benefits ......................................................................... 7
CHAPTER TWO ........................................................................................................................................ 8
LITERATURE REVIEW .......................................................................................................................... 8
2.1. Definition ..................................................................................................................................... 8
2.2. Background ................................................................................................................................. 9
2.3. Quality Function Deployment (QFD) Methodology (House of Quality) .............................. 10
CHAPTER THREE .................................................................................................................................. 13
HOUSE OF QUALITY METHOD ......................................................................................................... 13
3.1. Customer’s Needs (Voice of Customers) ................................................................................. 13
3.2. Technical Requirements (Voice of the Engineers) ................................................................. 15
3.3. Competitive Analysis ................................................................................................................ 15
3.4. Relationship Matrix .................................................................................................................. 17
3.5. Technical Correlation Matrix .................................................................................................. 18
3.6. Technical Properties and Targets ............................................................................................ 19
CHAPTER FOUR ..................................................................................................................................... 20
HOUSE OF QUALITY ANALYSIS ....................................................................................................... 20
4.1. Step (1) Relative Weights Analysis for Technical Requirements ......................................... 20
4.2. Step (2) Relative Weights Analysis for Customers’ Requirements ...................................... 21
4.3. Step (3) Competitive Analysis for Customers’ Requirements .............................................. 22
CHAPTER FIVE ...................................................................................................................................... 24
DESIGN FOR QUALITY ........................................................................................................................ 24
CHAPTER SIX ......................................................................................................................................... 28
CONCLUSION AND RECOMMENDATIONS .................................................................................... 28
6.1. Conclusion ................................................................................................................................. 28
6.2. Recommendations ..................................................................................................................... 29
References .................................................................................................................................................. 31
Appendix A ................................................................................................................................................ 33
4
Appendix B ................................................................................................................................................ 36
Table of Figures: Figure 2.1 The house of quality (HoQ) model.....…………….…………………………….……..… 12
Figure 3.1 House of quality model for hospital A …………………………………………………... 14
Figure 3.2 Patients requirements survey analysis ………………………………………………….. 16
Figure 5.1 New house of quality model for hospital A ……………………………………………... 27
Table of Tables: Table 3.1 Patients requirements weights ................................................................................................ 16 Table 4.1 Quality requirements weight/importance and relative weight ............................................. 20 Table 4.2 Customers' requirements relative weights ............................................................................. 21 Table 4.3 Customers' requirements percentage score ........................................................................... 21 Table 4.4 Customers’ requirements average hospitals score ................................................................ 22 Table 5.1 Hospitals national average ("Health Authority - Abu Dhabi", 2016) ................................. 24 Table 6.1 Priorities - implementation plan ............................................................................................. 30
5
CHAPTER ONE
INTRODUCTION
1.1. Research Problem
Governments provide various public services to their citizens, and a healthcare service
is one of them. It is being an essential rather than luxury service, and the governments spend a
huge amount of money on it. The principle behind providing a good health service to the
people is to ensure a healthy society. A study shows that there is a chance of fast recovery of
the patient if he/she is satisfied with the service the one receives (Rogers & Smith, 1999). One
of the most important services the government of the UAE focuses on is improving its health
services provided through the public and the private hospitals. According to the Prosperity
Index, the United Arab Emirates (UAE) was ranked as (32nd) in (2012) while in (2015), its
rank dropped down to (34th) (The 2015 Legatum Prosperity Index, 2016). That difference
made the government to focuses more on the improvement of country’s healthcare services. In
(2016), Dubai government established the new vision to convince the people of the city to get
a medical service before their tours. The program is aimed to ensure the improvement of their
focus on healthcare (UAE Vision 2021, 2016).
1.2. Research Aims
The focus on healthcare defines the process of applying the quality function
deployment (QFD) as a part of the general management of the healthcare system in the United
Arab Emirates (UAE). The quality function deployment (QFD) is a procedure to determine
customers’ needs and evaluate, manage, and design a mechanism to enhance the current
system (ReVelle, Moran, & Cox, 1998). The research will present a case study of applying the
quality function deployment (QFD) model to enhance the healthcare processes and the
customers’ satisfaction at the private hospitals (Hospital A) in Dubai, compared to other
hospitals of a region. The study will use an organized method based on hospital customer-
surveys to assess their current satisfaction level and will identify detailed actions that can be
done to improve the overall quality of hospital services.
6
The followings are the aims for this research:
• The first aim of this research is to introduce and understand the quality function
deployment (QFD) application and the tools associated with its use in the real
world, to help design and improve a product or a service.
• The second aim is to define the strategic and technical requirements through
this method usage to help fulfil the customers’ demands and the other steps in
product planning.
• The third aim is to show how the quality function deployment (QFD) can be
implemented and what are the benefits of using such method in the chosen
scenario.
1.3. Research Methodology (Quality Function Deployment QFD)
The main objective of this research is to increase the hospitals’ operational quality. To
start the process, customers’ needs should be identified to determine the improvement actions.
An online survey will be conducted to determine the needs and wants of the customers. The
research can be summarized in four steps (Bhattacharyya, 1998):
• Step 1: Define and prioritize customer needs;
• Step 2: Use the hospital reports and the survey to determine the customer
satisfaction level.
• Step 3: Use the quality function deployment (QFD) to analyze and define the
area that requires enhancement and design the improvement process (House of
Quality Matrix).
• Step 4: Implement the analysis outcomes, and monitor the process.
7
1.4. Quality Function Deployment (QFD) Benefits
The quality function deployment (QFD) is driven by customers and focuses on their
needs and requirements, which needs data collection from the competitors in the business. This
practice helps to organize the resources and restructures them according to the information
collected about the customers’ experiences. The quality function deployment (QFD) helps to
decrease the development and implementation time for the new product, which helps to
minimize any design changes in the future. Other benefits of the quality function deployment
(QFD) will also be introduced and demonstrated throughout this research (Bhattacharyya,
1998).

8
CHAPTER TWO
LITERATURE REVIEW 2.1. Definition
Six Sigma is one of the most famous quality methods used all over the world. It
focuses on the customer needs for continuous improvement and development. It also helps in
minimizing (3.4) defects per million in products and process designs. It is used to endorse
excellence in companies’ processes with strong target sets. Six Sigma method was invented by
Bill Smith, an engineer at Motorola Company in (1984). It is based on the statistical methods
to determine the standard deviation and is used to detect the amount of variation in any
process. Six Sigma has five steps which are (1) Define, (2) Measure, (3) Analyze, (4) Improve
and (5) Control (DMAIC). These steps are used for continuance improvement and focus on
customer satisfaction to reduce the cost by decreasing the variation in the processes. The aims
of the five steps (DMAIC) are to identify the problem, measure the service or the process
performance, examine the process to determine the root causes, enhance the process or the
service by removing the root causes, and then using the identified measures to improve the
performance of the process (Pyzdek, 2003).
The basic element that helps any company to implement Six Sigma is the ‘Voice of the
Customers’. The company needs to understand what the customer wants and needs as a first
step of the process. This will help to identify, structure, and arrange the customers’
requirements. It will also allow the companies to understand the customers’ expectations at the
start of the project and act accordingly. The companies need to understand what quality means
to the customers and how they define it. To do that, a data collection is required using
methods, for example, surveys or interviews. This will help get the customer feedback, and the
quality function deployment (QFD) will be used to measure the product requirements
according to the customer needs. The companies need to promptly respond to the customers’
needs to stay in business (Ficalora, Cohen, & Cohen, 2010).
9
2.2. Background
The quality function deployment (QFD) is widely used as it helps to determine the
voice of the customers and interprets it into the technical requirements that should be fulfilled
in the product or service design to achieve customer satisfaction. The quality function
deployment (QFD) was developed by Yogi Akao in (1966) and was presented in Japan
between (1960 and 1970). Later, it was used by Mitsubishi’s Kobe shipyard in (1972). Since
then, the quality function deployment (QFD) was introduced worldwide, especially in the
manufacturing sector of the United States of America. The use of quality function deployment
(QFD) was not limited to manufacturing, it has been used in all process designs, starting with
customers’ needs analysis, process design, product design, quality management, and other
engineering areas (Hunt & Killen, 2004).
The quality function deployment (QFD) can be used in any service or business. It has
been applied to improve many service features in the manufacturing and design industry,
aviation sector, healthcare service, and many other businesses. The quality function
deployment (QFD) helps to achieve customers’ satisfaction by determining their exact
requirements and needs to help the company survive in the competitive market. The
advantages of using the quality function deployment (QFD) at any process is that it does not
inspect the quantity and only focuses on the quality of the design, which will help to reduce the
time of process development and will lower the cost of starting a design. It helps in fulfilling
the customer requirements and can be used for future improvements in the design (Hunt &
Killen, 2004).
The quality function deployment (QFD) is a process used to incorporate customers’
requirements into the design of the products or the services. Understanding the customer
requirements and needs are critical to the success of the design of the products. The customers’
requirements and needs will be used to populate the quality table to ensure that these
requirements are implemented at all design levels and are used to determine the company’s
requirements. Nowadays, the quality function deployment (QFD) is implemented in the
strategic planning processes to focus on the voice of the customers to help achieve the
company’s goals and visions. The quality function deployment (QFD) is a process different
than the other quality tools that helps to minimize the quality glitches. A cross-functional team
10
is responsible for implementing the quality function deployment (QFD) process within the
organization (Forster Cornejo, 1998).
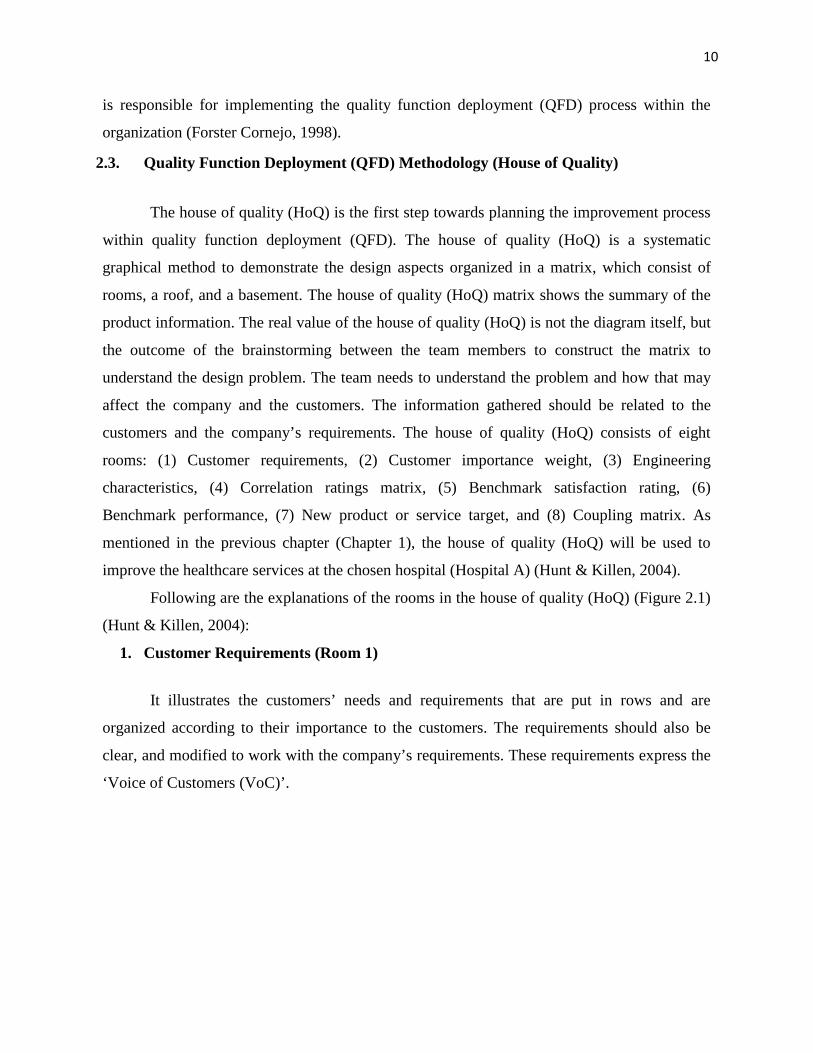
2.3. Quality Function Deployment (QFD) Methodology (House of Quality)
The house of quality (HoQ) is the first step towards planning the improvement process
within quality function deployment (QFD). The house of quality (HoQ) is a systematic
graphical method to demonstrate the design aspects organized in a matrix, which consist of
rooms, a roof, and a basement. The house of quality (HoQ) matrix shows the summary of the
product information. The real value of the house of quality (HoQ) is not the diagram itself, but
the outcome of the brainstorming between the team members to construct the matrix to
understand the design problem. The team needs to understand the problem and how that may
affect the company and the customers. The information gathered should be related to the
customers and the company’s requirements. The house of quality (HoQ) consists of eight
rooms: (1) Customer requirements, (2) Customer importance weight, (3) Engineering
characteristics, (4) Correlation ratings matrix, (5) Benchmark satisfaction rating, (6)
Benchmark performance, (7) New product or service target, and (8) Coupling matrix. As
mentioned in the previous chapter (Chapter 1), the house of quality (HoQ) will be used to
improve the healthcare services at the chosen hospital (Hospital A) (Hunt & Killen, 2004).
Following are the explanations of the rooms in the house of quality (HoQ) (Figure 2.1)
(Hunt & Killen, 2004):
1. Customer Requirements (Room 1)
It illustrates the customers’ needs and requirements that are put in rows and are
organized according to their importance to the customers. The requirements should also be
clear, and modified to work with the company’s requirements. These requirements express the
‘Voice of Customers (VoC)’.
11
2. Customer Importance Weight (Room 2)
This is next to the customer requirements column, a weighting column using values
between (0) for less important to (100) for most important. The weighting is important to
analyze how significant these requirements are in terms of the customers’ needs.
3. Engineering Characteristics (Room 3)
It lies under the roof to list the quantitative performance limits and their related units. It
is used to measure the level of customer satisfaction associated with every requirement.
4. Correlation Rating Matrix (Room 4)
It is a biggest and the most important room in the house, and consists of rows and
columns that are used to show the amount of correlation between the customer and engineering
requirements. Each cell has six of three correlation-rating numbers or symbols indicating the
ranks. For positive correlation (1) is low, (3) is medium, and (9) is high, while for negative
correlation (-1, -3 and -9) are the numbers used. If there is no correlation between the
requirements, the cell will be left blank, but if there is no correlation between the customer
requirements and the engineering requirements, it will lead to a wrong measurement of
customers’ satisfaction.
5. Benchmark Satisfaction Rating (Room 5)
This step compares the service or the product of the company with other competitors as
a benchmark. The team members have to rate the current product or service according to the
customer requirements. After that, the competitors’ product or service is rated using the
collected data about the product or the service provided by other companies.
6. Benchmark Performance (Room 6)
It is located underneath the correlation matrix and is used to show the performance of
each benchmark product or service to designate the performance with respect to the
engineering requirements.
12
7. New Product or Service Target (Room 7)
It used to determine the performance target and set the required goals for the new
product or service.
8. Coupling Matrix (Room 8)
It is the triangle roof for the house of quality (HoQ) and is used to show the correlation
between the engineering requirements with the rating numbers. For a positive correlation, (1)
is a lower value, (3) is medium, and (9) is high while for a negative correlation (-1, -3 and -9)
are the subsequent values. There will be some requirements that are not correlated and can be
improved by focusing one requirement after another without affecting the other engineering
requirements. The correlated requirements show that some concessions should be made. For
instance, improvement applied to one requirement might violate the rules for the other one.
Figure 2.1 The house of quality (HoQ) model, (Hunt & Killen, 2004)
13
CHAPTER THREE
HOUSE OF QUALITY METHOD
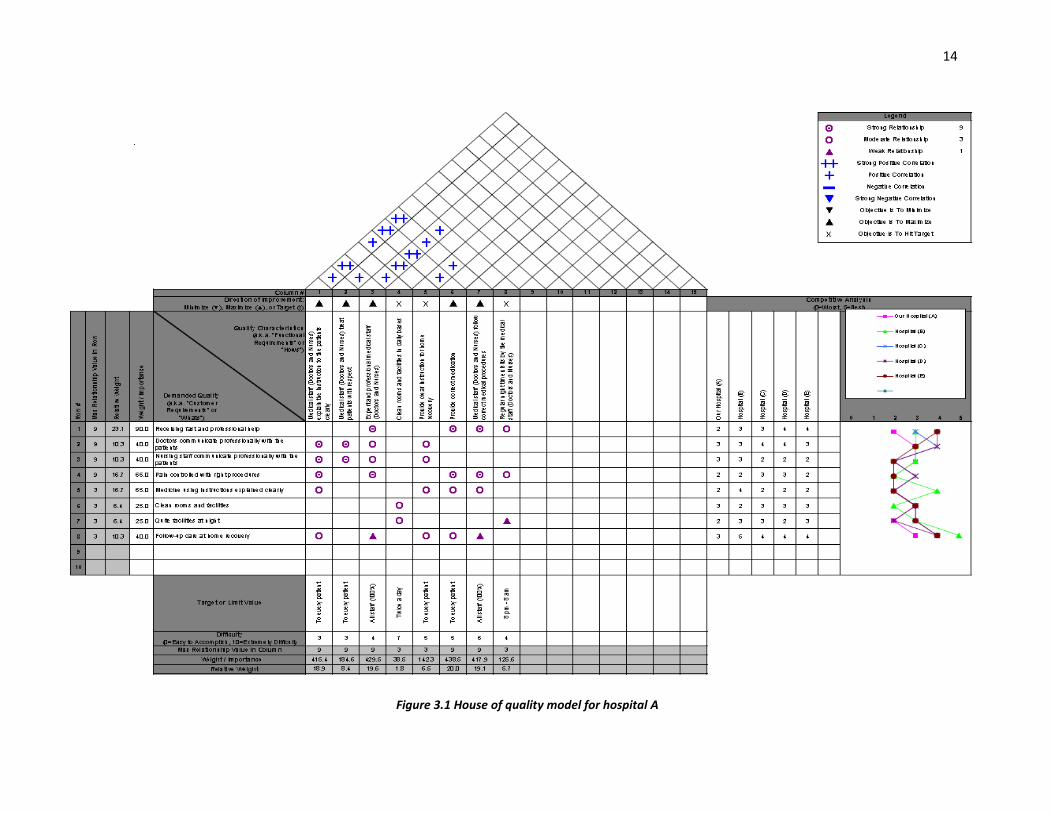
3.1. Customer’s Needs (Voice of Customers)
The identification of the customers’ needs is the first step towards applying the quality
function deployment (QFD) and focuses on defining, clarifying, and identifying the customer’s
demands. The customers’ requirements are the drivers of the house of quality (HoQ) model. It
will lay out the foundation to ensure that the process will be designed according to the
customers’ needs. A survey was conducted (Appendix A) and was designed to determine the
needs of the customers and focused to gather information about the patients’ demands at the
selected hospital (Hospital A) (56) patients did take the survey in total (The survey conducted
online using a healthcare survey templet from www.surveymonkey.com).
The survey context showed that the quality requirements are (1) Receiving fast and
professional help, (2) Doctors communicate professionally with the patients, (3) Nursing staff
communicate professionally with the patients, (4) Pain controlled with the right procedures, (5)
Medicine using instructions explained clearly, (6) Clean rooms and facilities, (7) Quite
facilities at night, and (8) Follow-up care at home recovery (Akao, 2004). The customers’
requirements lay at the left side of the house of quality (HoQ) model (QFD Online - Free
House of Quality (QFD) Templates for Excel, 2016), and the first four columns consist of (1)
Demand quality, (2) Weight/importance, and (3) Maximum relationship value row. The
weight/importance column will be filled with a number from (0 to 100) to show how important
this requirement is (Figure 3.1). The most important factors with high weight is a fast and
professional help, while the communication between the doctors and the nurses with the
patients has the second priority. On the other hand, clean rooms and facilities are more
important than the follow-up care (Akao, 2004).
14
Figure 3.1 House of quality model for hospital A
15
The next column will be filled with relative weights, which will be affected by their
importance to the patients. The comparative weight will affect the hospital procedures when
they deal with the patients. The hospital management will give a high priority to control the
pain with the right procedures against other requirements, keeping in mind the improvement of
each requirement according to its importance to the patient (Figure 3.1) (Akao, 2004).
3.2. Technical Requirements (Voice of the Engineers)
The identification of the technical requirements is the second step to construct the
house of quality (HoQ). These requirements will be designed on the basis of the customers’
requirements to help the hospital design the right system to meet the customers’ needs. The
technical requirements are: (1) Medical staff (Doctors and Nurses) explain the instructions to
the patients clearly, (2) Medical staff (Doctors and Nurses) treat the patients with respect, (3)
Expert and professional medical staff (Doctors and Nurses), (4) Clean rooms and facilities in
daily bases, (5) Provide clear instructions for home recovery, (6) Provide correct medication,
(7) Medical staff (Doctors and Nurses) follow correct medical procedures, and (8) Regular
night time visits by the medical staff (Doctors and Nurses) (Figure. 3.1) (Akao, 2004).
3.3. Competitive Analysis
The third step in designing the house of quality matrix is to focus on comparing the
selected hospital with its four compotator hospitals (Hospital B, C, D and E). Nevertheless, an
across-hospital comparison will also be conducted with respect to the customers’ requirements
as a reference. The hospitals will be ranked from (0 to 5), where (0) is being the lowest rank,
and (5) is being the highest one. The selected hospital will be ranked using the patients’ survey
outcomes, which are used to determine the patients’ requirements. The rating for the
requirement will be done using the following system (0%-49%, 50%-59%, 60%-69%, 70%-
79%, 80%-89%, 90%-100%), which is equivalent to (0, 1, 2, 3, 4, and 5) respectively. This
step will help the management to understand how the patients see the hospital compared to
other hospitals. It will help the hospitals to provide better services against their competitors by
using them as a benchmark (Figure. 3.1) (Akao, 2004).
16
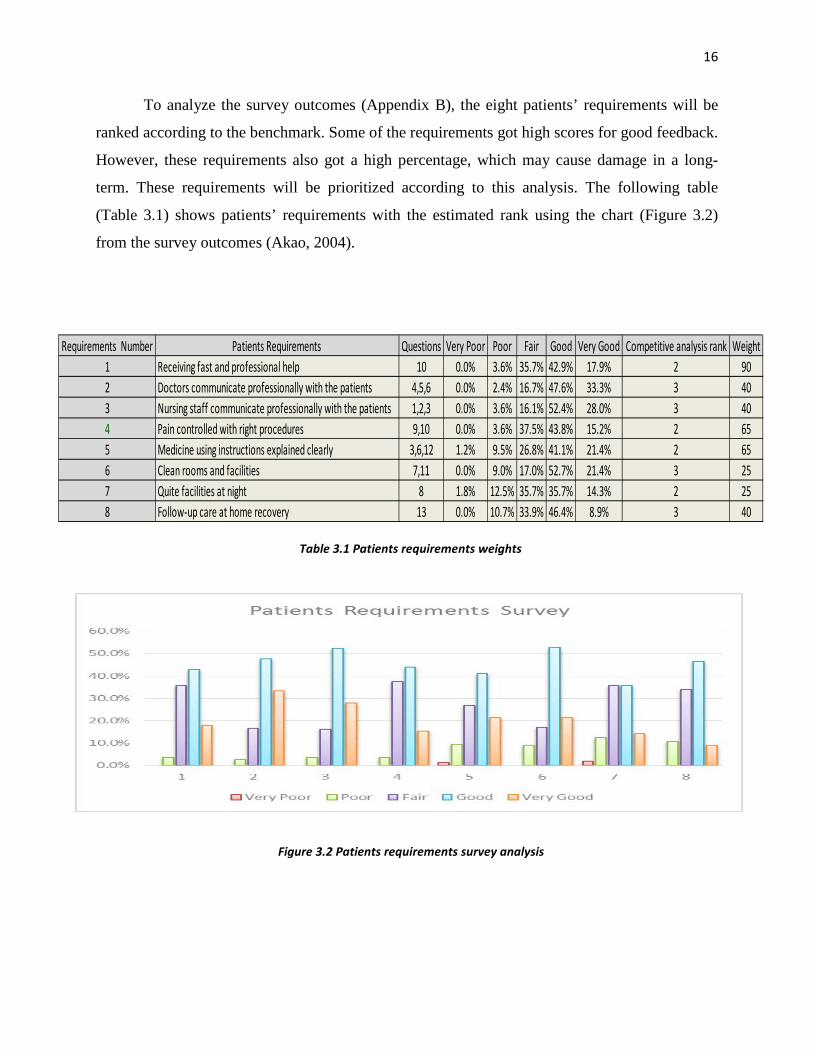
To analyze the survey outcomes (Appendix B), the eight patients’ requirements will be
ranked according to the benchmark. Some of the requirements got high scores for good feedback.
However, these requirements also got a high percentage, which may cause damage in a long-
term. These requirements will be prioritized according to this analysis. The following table
(Table 3.1) shows patients’ requirements with the estimated rank using the chart (Figure 3.2)
from the survey outcomes (Akao, 2004).
Figure 3.2 Patients requirements survey analysis
Requirements Number Patients Requirements Questions Very Poor Poor Fair Good Very Good Competitive analysis rank Weight1 Receiving fast and professional help 10 0.0% 3.6% 35.7% 42.9% 17.9% 2 902 Doctors communicate professionally with the patients 4,5,6 0.0% 2.4% 16.7% 47.6% 33.3% 3 403 Nursing staff communicate professionally with the patients 1,2,3 0.0% 3.6% 16.1% 52.4% 28.0% 3 404 Pain controlled with right procedures 9,10 0.0% 3.6% 37.5% 43.8% 15.2% 2 655 Medicine using instructions explained clearly 3,6,12 1.2% 9.5% 26.8% 41.1% 21.4% 2 656 Clean rooms and facilities 7,11 0.0% 9.0% 17.0% 52.7% 21.4% 3 257 Quite facilities at night 8 1.8% 12.5% 35.7% 35.7% 14.3% 2 258 Follow-up care at home recovery 13 0.0% 10.7% 33.9% 46.4% 8.9% 3 40
Table 3.1 Patients requirements weights
17
The patients’ requirements will be weighted in accordance with the competitive rank.
The lowest rank will have the highest weight. The most important requirement of receiving
fast and professional help (Requirement 1) will be weighted (90), while the second important
requirement that is the pain controlled with right procedures and medicine-dosage instructions
explained clearly (Requirements 4, 5) will be weighted (65). Other requirements including,
communication of the hospital staff (Doctors and Nurses) with the patients and follow-up care
at home recovery (Requirement 2, 3, 8) will be weighted (40). The last two requirements
(Requirement 6, 7) will be weighted (25) (Figure. 3.1) (Akao, 2004).
3.4. Relationship Matrix
The relationship matrix is the fourth step in the house of quality (HoQ) (Figure. 3.1). It
is used to show the relationship between the patients’ requirements and the technical
requirements, and how strongly they relate to each other. The relationship between them will
be shown using symbols, illustrating a strong, moderate, and weak relationships, with a given
value of (9, 3, and 1). The aim of this strategic step is to improve the service to fulfil the
patients’ demands. The competitive analysis between the hospitals showed the strengths and
weaknesses of the selected hospital, which can help to show the areas that require
improvements and the changes to compete. The relationship matrix has to align at least one
patient’s requirement with one from the technical requirements (Akao, 2004).
For example, the analysis for the patients and the technical requirements showed that
the medical staff (Doctors and Nurses) explains the instruction to the patients clearly.
Furthermore, if the staff treats the patients with respect, there is a better chance that the
professional communication between the staff and the patients will be improved. The reason
for this strong relationship is that the patients expect the medical staff to communicate clearly
with them and to deal with any issues professionally. Medical staff (Doctors and Nurses)
explains the instruction to the patients clearly, and a follow-up care at home also builds a
moderate relationship. The matrix will be filled using the same method by defining a rational
connection between the patients’ requirements and technical requirements (Akao, 2004).
18
3.5. Technical Correlation Matrix
The technical correlation matrix step represents the roof of the house of quality (HoQ)
(Figure. 3.1), and its uses to show the relationship between the technical requirements and the
way they affect each other. The relationship is shown as a symbol. There are four symbols
which represent strong positive correlation, positive correlation, negative correlation, and a
strong negative correlation. For example, if there is a strong or strong positive relationship
between two requirements, any changes have to be made by the management to ensure a
positive impact. If there is a negative or strong negative relationship between two
requirements, the management needs to make sure that there is no change in the requirements
to avoid a negative impact on them (Akao, 2004).
The management has to implement the required changes if there is a negative
correlation. Nevertheless, some changes may have a negative impact because the technical
requirements have a strong relationship with each other. In this case, the management will not
apply any changes to improve these requirements. The matrix (Figure. 3.1) shows that there
are no negative or strong negative relationships between the technical requirements, which
mean that no changes are needed to the requirements. If all the requirements have positive and
strong positive correlation, these correlations are linked to each other and have the potential to
affect each other to a major extent (Figure. 3.1). For example, the technical requirement
experts, and professional medical staff (Doctors and Nurses) follow the correct medical
procedures to ensure a strong positive correlation. Since the expert medical staff (Doctors and
Nurses) will provide the correct medication with correct dosages, each one is expected to have
a positive impact on each other. The use of correct medical procedures by the medical experts
is a good example of a positive correlation between the requirements (Akao, 2004).
19
3.6. Technical Properties and Targets
The technical properties and targets identification is the final step is the designing of
the house of quality (HoQ) matrix. It focuses on ranking the technical requirements by using
the following methods: target or limit value difficulty, maximize the relationship value, weight
/ importance, and relative weight. The reason for using these methods in the management is to
determine the most important problems to work on to gain a higher customer satisfaction. As a
first step, the management has to set the target for each technical requirement. The
management gives the most difficult requirement the high importance to achieving that goal.
For example, the hospitals should achieve the ultimate patients’ satisfaction by having an
expert medical staff (Doctors and Nurses) to explain the instructions to every patient clearly
and treat them with respect. The numbers showing the difficulty to achieve the target values
are (0) Easy to Accomplish, (10) Extremely Difficult (Figure. 3.1) (Akao, 2004).
20
Table 4.1 Quality requirements weight/importance and relative weight
CHAPTER FOUR
HOUSE OF QUALITY ANALYSIS
The current house of quality (HoQ) shows the current position of the chosen hospital
compared to other hospitals. To improve its position and increase patients’ satisfaction, the
current house of quality (HoQ) model requires some improvements. The design will give each
quality characteristic a weight according to its importance to define the characteristics preferred
by the patients. A relationship matrix showed the correlation between the patients’ demands and
the technical requirements that will also help in defining the required weights. It also showed the
level of efforts put in the quality characteristics.
4.1. Step (1) Relative Weights Analysis for Technical Requirements
The weight will be selected according to the importance of the technical requirement to
the hospital and will be given a numerical number. The most important technical requirement is
‘expert and professional medical staff (Doctors and Nurses)’. Although the other requirements
are also significant for the hospital, ‘expert and professional medical staff (Doctors and Nurses)’
is a major characteristic, which ensures the success of other requirements. This requirement will
be used to determine the weights for other technical requirements. A relative weight will be
determined using the weight/importance (Table. 4.1) (Bernal, Dornberger, Suvelza, & Byrnes, 2009).
Quality requirements Weight/Importance Relative WeightMedical staff (Doctors and Nurses) explain the instruction to the patients clearly 60 13.0Medical staff (Doctors and Nurses) treat patients with respect 50 10.9Expert and professional medical staff (Doctors and Nurses) 100 21.7Clean rooms and facilities in daily bases 30 6.5Provide clear instruction for home recovery 50 10.9Provide correct medication 75 16.3Medical staff (Doctors and Nurses) follow correct medical procedures 75 16.3Regular night time visits by the medical staff (Doctors and Nurses) 20 4.3
Total 460 100.0
21
4.2. Step (2) Relative Weights Analysis for Customers’ Requirements
A relative weight for the quality characteristics will be used to calculate the relative
weight of the customers’ requirements. This will be done to determine a numerical relationship
between the quality requirements and the customers’ requirements, and it will be shown how
important they are to each other. To determine the relative weights of the customers’
requirements, the relative weight for the quality requirements will be multiplied with the
weight/importance score for the customers’ requirements (Table 4.2) (Bernal, Dornberger, Suvelza,
& Byrnes, 2009).
A percentage score will be calculated using the relative weight of the customers’
requirements (Table 4.3). This step is important to help conduct a comparative analysis between
the information collected from the selected hospitals and other comparative hospitals (Bernal,
Dornberger, Suvelza, & Byrnes, 2009).
Customers' requirments Weight/Importance Relative WeightReceiving fast and professional help 90 1173.9Doctors communicate professionally with the patients 40 434.8Nursing staff communicate professionally with the patients 40 869.6Pain controlled with right procedures 65 423.9Medicine using instructions explained clearly 65 706.5Clean rooms and facilities 25 407.6Quite facilities at night 25 407.6Follow-up care at home recovery 40 173.9
Total 390 4597.8
Table 4.2 Customers’ requirements relative weights
Customers' requirments Weight/Importance Relative Weight Percentage scoreReceiving fast and professional help 90 1173.9 25.5Doctors communicate professionally with the patients 40 434.8 9.5Nursing staff communicate professionally with the patients 40 869.6 18.9Pain controlled with right procedures 65 423.9 9.2Medicine using instructions explained clearly 65 706.5 15.4Clean rooms and facilities 25 407.6 8.9Quite facilities at night 25 407.6 8.9Follow-up care at home recovery 40 173.9 3.8
Total 390 4598 100
Table 4.3 Customers’ requirements percentage score
22
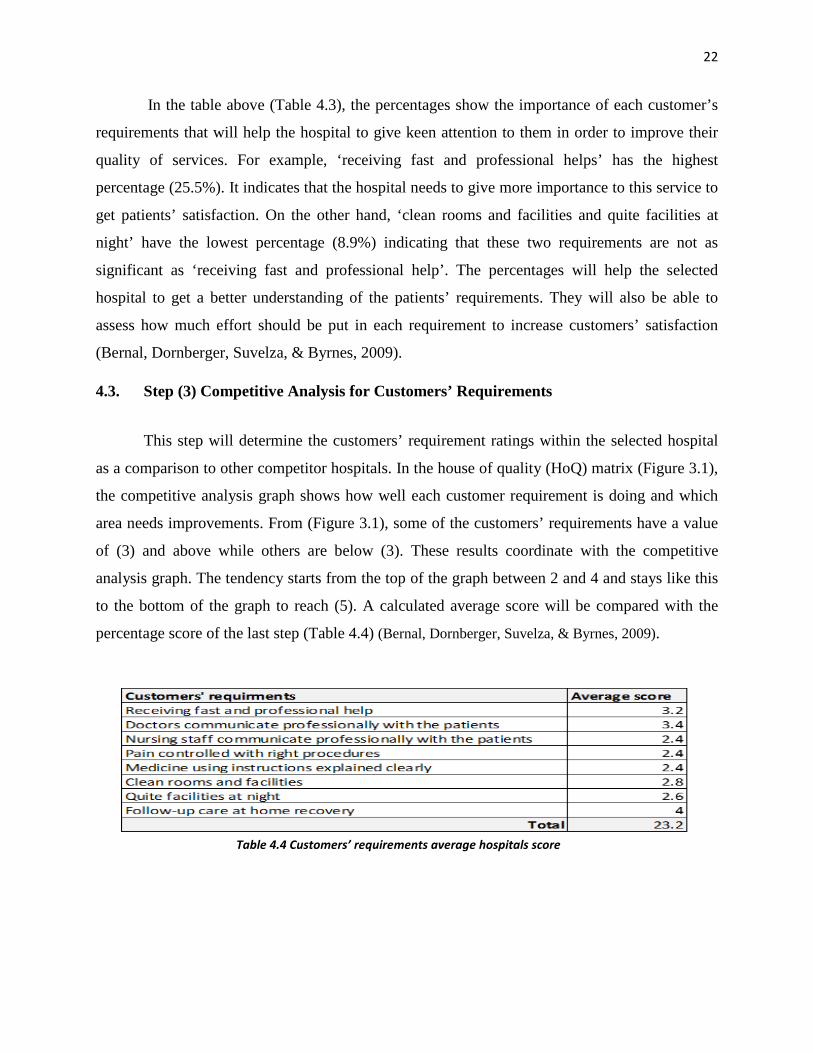
In the table above (Table 4.3), the percentages show the importance of each customer’s
requirements that will help the hospital to give keen attention to them in order to improve their
quality of services. For example, ‘receiving fast and professional helps’ has the highest
percentage (25.5%). It indicates that the hospital needs to give more importance to this service to
get patients’ satisfaction. On the other hand, ‘clean rooms and facilities and quite facilities at
night’ have the lowest percentage (8.9%) indicating that these two requirements are not as
significant as ‘receiving fast and professional help’. The percentages will help the selected
hospital to get a better understanding of the patients’ requirements. They will also be able to
assess how much effort should be put in each requirement to increase customers’ satisfaction
(Bernal, Dornberger, Suvelza, & Byrnes, 2009).
4.3. Step (3) Competitive Analysis for Customers’ Requirements
This step will determine the customers’ requirement ratings within the selected hospital
as a comparison to other competitor hospitals. In the house of quality (HoQ) matrix (Figure 3.1),
the competitive analysis graph shows how well each customer requirement is doing and which
area needs improvements. From (Figure 3.1), some of the customers’ requirements have a value
of (3) and above while others are below (3). These results coordinate with the competitive
analysis graph. The tendency starts from the top of the graph between 2 and 4 and stays like this
to the bottom of the graph to reach (5). A calculated average score will be compared with the
percentage score of the last step (Table 4.4) (Bernal, Dornberger, Suvelza, & Byrnes, 2009).
Table 4.4 Customers’ requirements average hospitals score
23
The table above (Table 4.4) illustrates that the hospital can work on many complexities
and improves its average rating. Furthermore, the conducted survey can also help the hospital to
improve its service quality compared to its competitors. The percentage score is a measurement
tool to observe and decide what needs to be done, and it works as a standard to be followed. A
high percentage means the more effort is needed to improve the requirement score. The
management needs to decide which area requires improvement according to the percentage
score. For example, the requirement of ‘nursing staff communicate professionally with the
patients’ has a percentage of (18.9%) with (2.4) score. Therefore, the hospital management needs
to decide how much resources should be allocated to this effort. If the management puts (18.9%)
effort to improve the ‘nursing staff’s professional communication with the patients’, it might get
a satisfactory rating (Bernal, Dornberger, Suvelza, & Byrnes, 2009).
The percentage score will help the hospital to dedicate its efforts for the improvement of
patients’ satisfaction. If the average score needs improvement, the hospital management should
perfect its efforts to achieve a high average. Quite the opposite, if the average score is high, it
will be reasonable to reduce the efforts spent on one specific area and increase it in another one.
While it is important to fulfil all customer requirements, it is also essential to get enough
understanding of the customers’ requirements before trying to improve their rating (Bernal,
Dornberger, Suvelza, & Byrnes, 2009).
24
CHAPTER FIVE
DESIGN FOR QUALITY
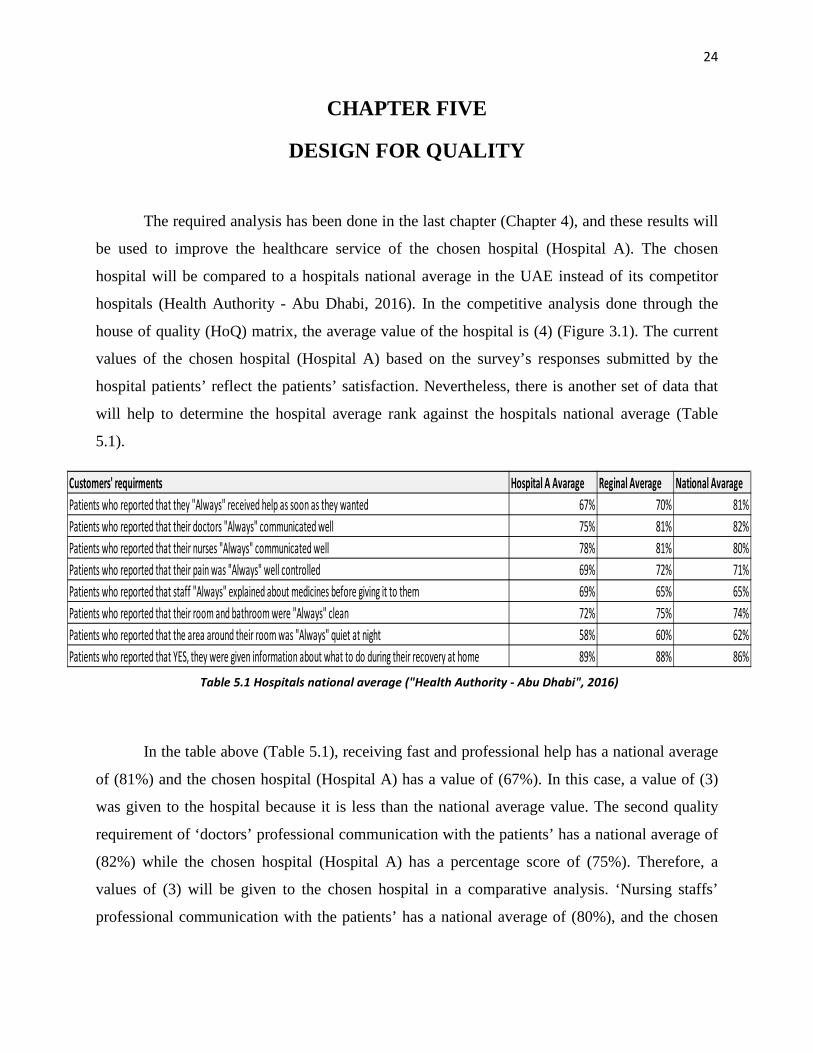
The required analysis has been done in the last chapter (Chapter 4), and these results will
be used to improve the healthcare service of the chosen hospital (Hospital A). The chosen
hospital will be compared to a hospitals national average in the UAE instead of its competitor
hospitals (Health Authority - Abu Dhabi, 2016). In the competitive analysis done through the
house of quality (HoQ) matrix, the average value of the hospital is (4) (Figure 3.1). The current
values of the chosen hospital (Hospital A) based on the survey’s responses submitted by the
hospital patients’ reflect the patients’ satisfaction. Nevertheless, there is another set of data that
will help to determine the hospital average rank against the hospitals national average (Table
5.1).
In the table above (Table 5.1), receiving fast and professional help has a national average
of (81%) and the chosen hospital (Hospital A) has a value of (67%). In this case, a value of (3)
was given to the hospital because it is less than the national average value. The second quality
requirement of ‘doctors’ professional communication with the patients’ has a national average of
(82%) while the chosen hospital (Hospital A) has a percentage score of (75%). Therefore, a
values of (3) will be given to the chosen hospital in a comparative analysis. ‘Nursing staffs’
professional communication with the patients’ has a national average of (80%), and the chosen
Customers' requirments Hospital A Avarage Reginal Average National AvaragePatients who reported that they "Always" received help as soon as they wanted 67% 70% 81%Patients who reported that their doctors "Always" communicated well 75% 81% 82%Patients who reported that their nurses "Always" communicated well 78% 81% 80%Patients who reported that their pain was "Always" well controlled 69% 72% 71%Patients who reported that staff "Always" explained about medicines before giving it to them 69% 65% 65%Patients who reported that their room and bathroom were "Always" clean 72% 75% 74%Patients who reported that the area around their room was "Always" quiet at night 58% 60% 62%Patients who reported that YES, they were given information about what to do during their recovery at home 89% 88% 86%
Table 5.1 Hospitals national average ("Health Authority - Abu Dhabi", 2016)
25
hospital (Hospital A) has (78%). Again, a value of (3) will be given to this characteristic because
of its score lower than the national average (Figure 5.1).
‘Pain controlled with right procedures’ has a national average of (71%), and the chosen
hospital (Hospital A) has a percentage score of (69%) that leads the chosen hospital to get a
value of (3). ‘Medicine using instructions explained clearly’ has a national average of (65%) and
the chosen hospital (Hospital A) has a score of (69%). Therefore, it gets a value (2) in the
comparative analysis because the hospital score is higher than the national average one. The
national average for the ‘clean rooms and facilities’ is (72%) while for the chosen hospital
(Hospital A), it is (74%). As there is no significant difference between the two scores, the
hospital gets a value of (3) (Figure 5.1).
‘Quite facilities at night’ has a national average of (62%), and the chosen hospital
(Hospital A) has a score of (58%) and gets a value of (3). The last customer requirement is
‘follow-up care at home’ that has a national average of (86%), and the chosen hospital (Hospital
A) has a percentage of (89%). Due to the small difference between both values, a score of 3 will
be given to the chosen hospital. From the table above (Table 5.1), it can be noticed that the
selected hospital has only two customers’ requirements with an average score that is higher than
the national average one. These requirements are ‘medicine using instructions explained clearly’
and ‘follow-up care at home after recovery’ (Figure 5.1).
‘Medicine using instructions explained clearly’ has an average percentage of (69%) that
is higher than the national average and has (15.4%) percentage score in the comparative analysis.
Although this requirement has the third highest percentage, the Hospital has a good overall
average in it and does not need to do much to improve this requirement. ‘Follow-up care at home
after recovery’ has an average percentage of (89%) which is higher than the national average.
With (3.8%) percentage score in the competitive analysis, this requirement has the lowest
percentage in it and has a lower overall percentage in it. However, the customers still have a
good satisfaction over this service. Therefore, the hospital is not required to make any changes in
this requirement for the sake of improvement (Figure 5.1).
‘Following customers’ requirements’ has the highest percentage. ‘Receiving fast and
professional help’ has (25.5%). For other requirements, the percentage is as follows: ‘nursing
staff communicate professionally with the patients’ (18.9%), ‘doctors communicate
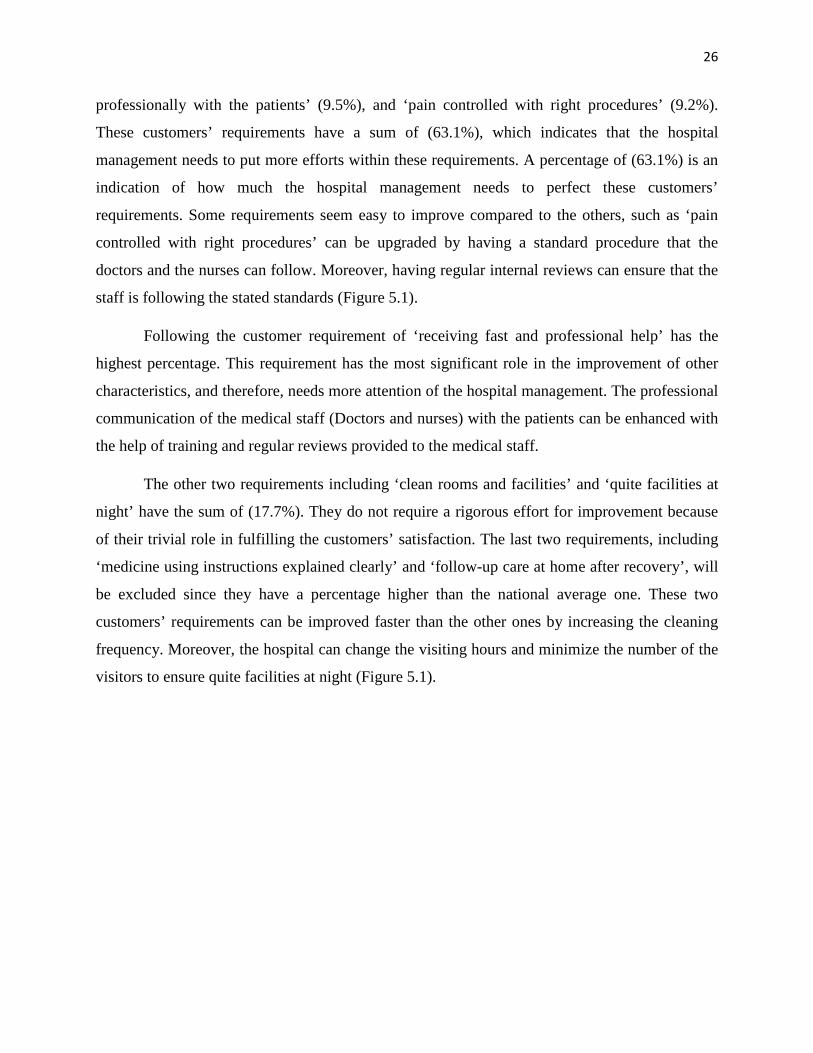
26
professionally with the patients’ (9.5%), and ‘pain controlled with right procedures’ (9.2%).
These customers’ requirements have a sum of (63.1%), which indicates that the hospital
management needs to put more efforts within these requirements. A percentage of (63.1%) is an
indication of how much the hospital management needs to perfect these customers’
requirements. Some requirements seem easy to improve compared to the others, such as ‘pain
controlled with right procedures’ can be upgraded by having a standard procedure that the
doctors and the nurses can follow. Moreover, having regular internal reviews can ensure that the
staff is following the stated standards (Figure 5.1).
Following the customer requirement of ‘receiving fast and professional help’ has the
highest percentage. This requirement has the most significant role in the improvement of other
characteristics, and therefore, needs more attention of the hospital management. The professional
communication of the medical staff (Doctors and nurses) with the patients can be enhanced with
the help of training and regular reviews provided to the medical staff.
The other two requirements including ‘clean rooms and facilities’ and ‘quite facilities at
night’ have the sum of (17.7%). They do not require a rigorous effort for improvement because
of their trivial role in fulfilling the customers’ satisfaction. The last two requirements, including
‘medicine using instructions explained clearly’ and ‘follow-up care at home after recovery’, will
be excluded since they have a percentage higher than the national average one. These two
customers’ requirements can be improved faster than the other ones by increasing the cleaning
frequency. Moreover, the hospital can change the visiting hours and minimize the number of the
visitors to ensure quite facilities at night (Figure 5.1).
27
Figure 5.1 New house of quality model for hospital A
28
CHAPTER SIX
CONCLUSION AND RECOMMENDATIONS
6.1. Conclusion
Over the years, the total quality management proved its vibrant role in improving the
companies’ services or products. For the quality management, each company uses quality
techniques that serve its organizational strategies. The quality functional deployment (QFD) is
one of the most popular tools in the total quality management and proved to be useful in
improving services or products for an ultimate customers’ satisfaction. In the case study, the
competitor hospitals are ahead of the chosen hospital in some areas, and the hospital
management needs to focus on those areas to improve its customer satisfaction. The analysis
started by gathering customers’ feedback with the help of a survey about the current services
provided by the hospital. These survey outcomes helped to fill the rooms in the house of quality
(HoQ) and showed how the customers' feel about the hospital. The results will help the hospital
management determine customer and technical requirements and priorities these requirements
according to their importance to the customers.
The analysis continued by adding some weights of importance to the customers’ and
technical requirements, which helped the hospital management determine the areas that need an
improvement. The final house of quality model helped explain to the hospital management the
relations between different parts of the hospital and a direct association with how good the
hospital responds to the patient’s requirements. The results helped make few changes to the
quality functional deployment (QFD) and the house of quality (HoQ) plan.
The percentage scoring system put light on the areas that are strong and helps in
exploring the hospital services that can be made better. Although the percentage scores helped in
allotting a required effort to attain a customer’s satisfaction, it did not show the other parts of the
hospitals can be managed. For example, it is obvious that funding is required to help improve the
services with the help of staff training, but this information could not be gathered from the
29
survey results. A short-term plan has been initiated to help improve the areas that are necessary
for the quality improvement.
6.2. Recommendations
The hospital management should work on necessary changes to improve its service.
Chapter 5 distinguished a few vital steps to help the hospital design a proper plan in order to get
to the required customers’ satisfaction. The management needs to adopt the most important
technical requirements that are achievable within their capability and strategy. At the moment, a
suitable plan is to implement a systematic approach using a lean system. Additionally, a quality
officer should be there to monitor the service quality and solve the quality issues.
The reason to adopt lean system is that it is time saving and can help reduce the
predicament in attracting more patients. The new system will take at least two to three years to
be fully implemented after the hospital management accepts and approve the new plan. This will
happen due to the wide range of departments within the hospital and a large number of
employees. The survey needs to be run for long period of time to measure the hospital
performance, for example the survey can run at least for two months and the performance can be
analyzed in weekly bases to determine when the hospital is performing well or bad. Finally, for
the further improvement, the financial aspect should also be considered to enhance the quality
plan.
30
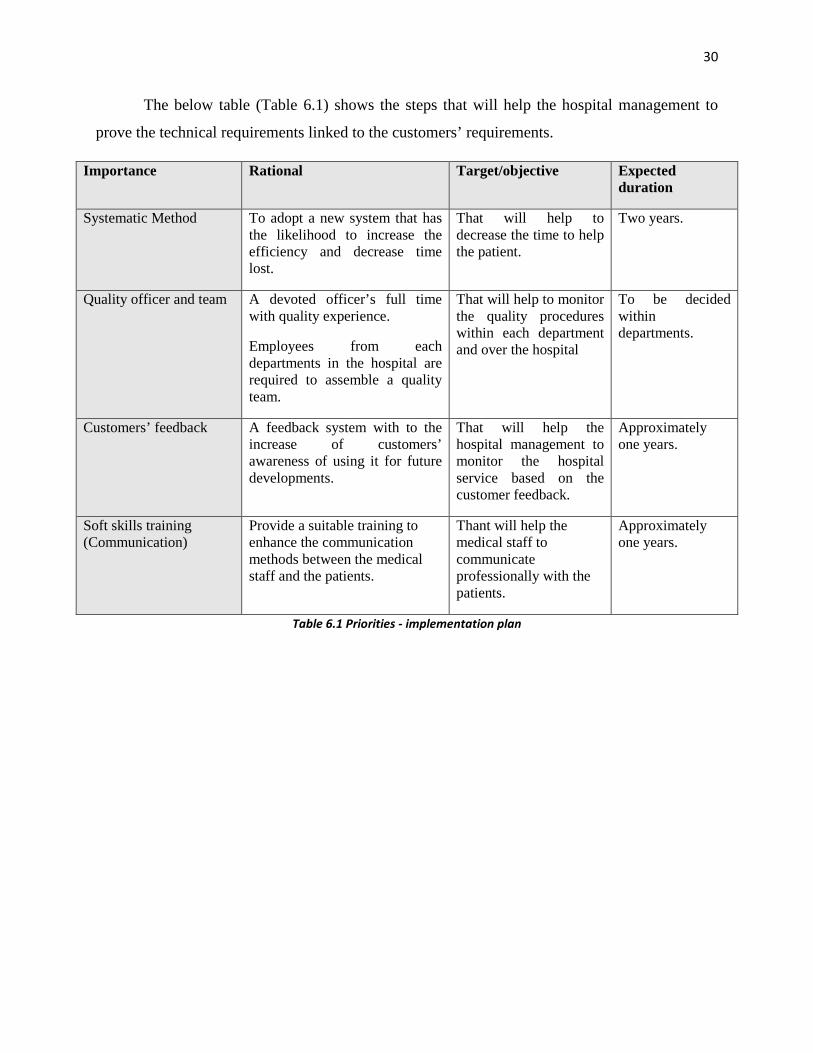
The below table (Table 6.1) shows the steps that will help the hospital management to
prove the technical requirements linked to the customers’ requirements.
Importance Rational Target/objective Expected duration
Systematic Method To adopt a new system that has the likelihood to increase the efficiency and decrease time lost.
That will help to decrease the time to help the patient.
Two years.
Quality officer and team A devoted officer’s full time with quality experience.
Employees from each departments in the hospital are required to assemble a quality team.
That will help to monitor the quality procedures within each department and over the hospital
To be decided within departments.
Customers’ feedback A feedback system with to the increase of customers’ awareness of using it for future developments.
That will help the hospital management to monitor the hospital service based on the customer feedback.
Approximately one years.
Soft skills training (Communication)
Provide a suitable training to enhance the communication methods between the medical staff and the patients.
Thant will help the medical staff to communicate professionally with the patients.
Approximately one years.
Table 6.1 Priorities - implementation plan
31
References
Akao, Y. (2004). Quality Function Deployment: Integrating Customer Requirements into
Product Design. Productivity Press.
Bernal, L., Dornberger, U., Suvelza, A., & Byrnes, T. (2009). Quality Function Deployment
(QFD) for Services Handbook. International SEPT Program.
Bhattacharyya, S. (1998). The International Warwick Manufacturing Group. Assembly
Automation, 18(2). http://dx.doi.org/10.1108/aa.1998.03318baa.002
Ficalora, J., Cohen, L., & Cohen, L. (2010). Quality function deployment and Six Sigma. Upper
Saddle River, NJ: Prentice Hall.
Forster Cornejo, E. (1998). Application of quality function deployment in defense technology
development.
Health Authority - Abu Dhabi. (2016). Haad.ae. Retrieved 10 April 2016, from
http://www.haad.ae/haad/
Hunt, R. & Killen, C. (2004). Best practice quality function deployment (QFD). Bradford,
England: Emerald Group Pub.
Pyzdek, T. (2003). The Six Sigma handbook. New York: McGraw-Hill.
QFD Online - Free House of Quality (QFD) Templates for Excel. (2016). Qfdonline.com.
Retrieved 10 February 2016, from http://www.qfdonline.com/templates/
ReVelle, J., Moran, J., & Cox, C. (1998). The QFD handbook. New York: Wiley.
Rogers, G. & Smith, D. (1999). Methodology matters. Reporting comparative results from
hospital patient surveys. International Journal For Quality In Health Care, 11(3), 251-259.
http://dx.doi.org/10.1093/intqhc/11.3.251
The 2015 Legatum Prosperity Index. (2016). Prosperity Index 2015. Retrieved 9 February 2016,
from http://www.prosperity.com/#!/

32
UAE Vision 2021. (2016). Vision2021.ae. Retrieved 17 February 2016, from
https://www.vision2021.ae/en
https://www.surveymonkey.com/r/CZ5WDJL
33
Appendix A Patient Satisfaction Surveys (https://www.surveymonkey.com/r/CZ5WDJL).
During your visit to the hospital, your care was provided by Doctors, physicists’ assistant and nurse practitioner. Please answer the following questions with that health care provider in mind:
1. During this stay at the hospital, how often did nurses treat you with courtesy and respect?
Very Poor
Poor
Fair
Good
Very Good 2. During this stay at the hospital, how often did nurses listen carefully to you?
Very Poor
Poor
Fair
Good
Very Good 3. During this stay at the hospital, how often did nurses explain things in a way you could understand?
Very Poor
Poor
Fair
Good
Very Good 4. During this stay at the hospital, how often did doctors treat you with courtesy and respect?
Very Poor
Poor
Fair
Good
Very Good 5. During this stay at the hospital, how often did doctors listen carefully to you?
Very Poor
Poor
34
Fair
Good
Very Good 6. During this stay at the hospital, how often did doctors explain things in a way you could understand?
Very Poor
Poor
Fair
Good
Very Good 7. During this stay at the hospital, how often were your room and bathroom kept clean?
Very Poor
Poor
Fair
Good
Very Good 8. During your stay at the hospital, how often the hospital was kept quiet?
Very Poor
Poor
Fair
Good
Very Good 9. During this stay at the hospital, how often was your pain well controlled?
Very Poor
Poor
Fair
Good
Very Good 10. During this stay at the hospital, how often did the hospital staff do everything they could to help you with your pain?
Very Poor
Poor
Fair
Good
Very Good 11. Before giving you any new medicine, how often did hospital staff at the hospital tell you what the medicine was for?
35
Very Poor
Poor
Fair
Good
Very Good 12. Before giving you any new medicine, how often did hospital staff at the hospital describe possible side effects in a way you could understand?
Very Poor
Poor
Fair
Good
Very Good 13. How well did your provider explain your follow-up care?
Very Poor
Poor
Fair
Good
Very Good 14. Comments (describe good or bad experience):
36
Appendix B
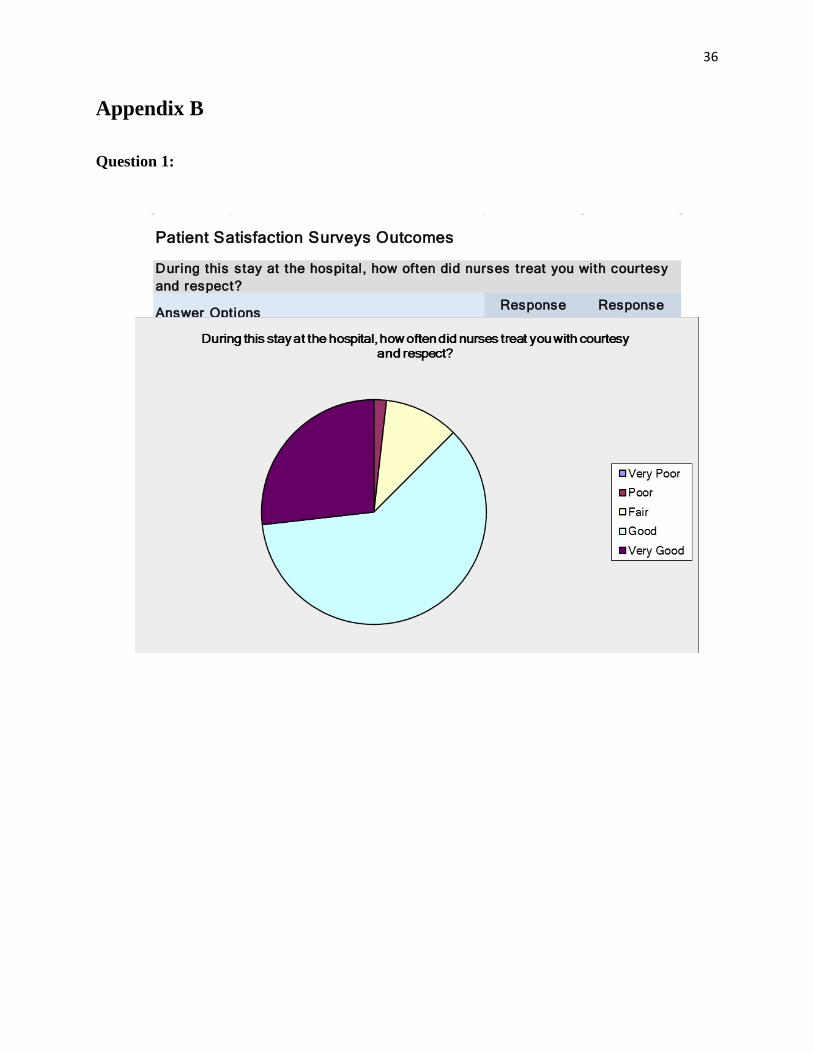
Question 1:
Response Percent
Response Count
0.0% 01.8% 1
10.7% 660.7% 3426.8% 15
560skipped question
During this stay at the hospital, how often did nurses treat you with courtesy and respect?
Good
Very Poor
answered question
Patient Satisfaction Surveys Outcomes
Fair
Answer Options
Very Good
Poor
37
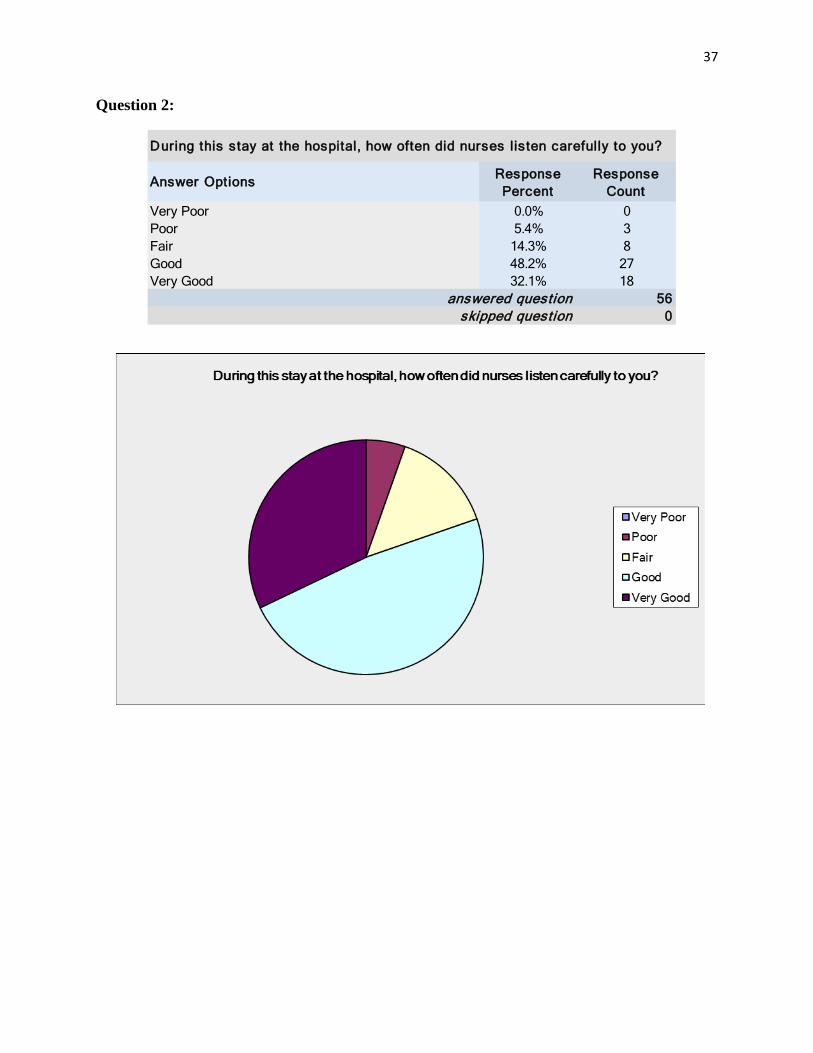
Question 2:
Response Percent
Response Count
0.0% 05.4% 3
14.3% 848.2% 2732.1% 18
560skipped question
During this stay at the hospital, how often did nurses listen carefully to you?
Good
Very Poor
answered question
Fair
Answer Options
Very Good
Poor
38
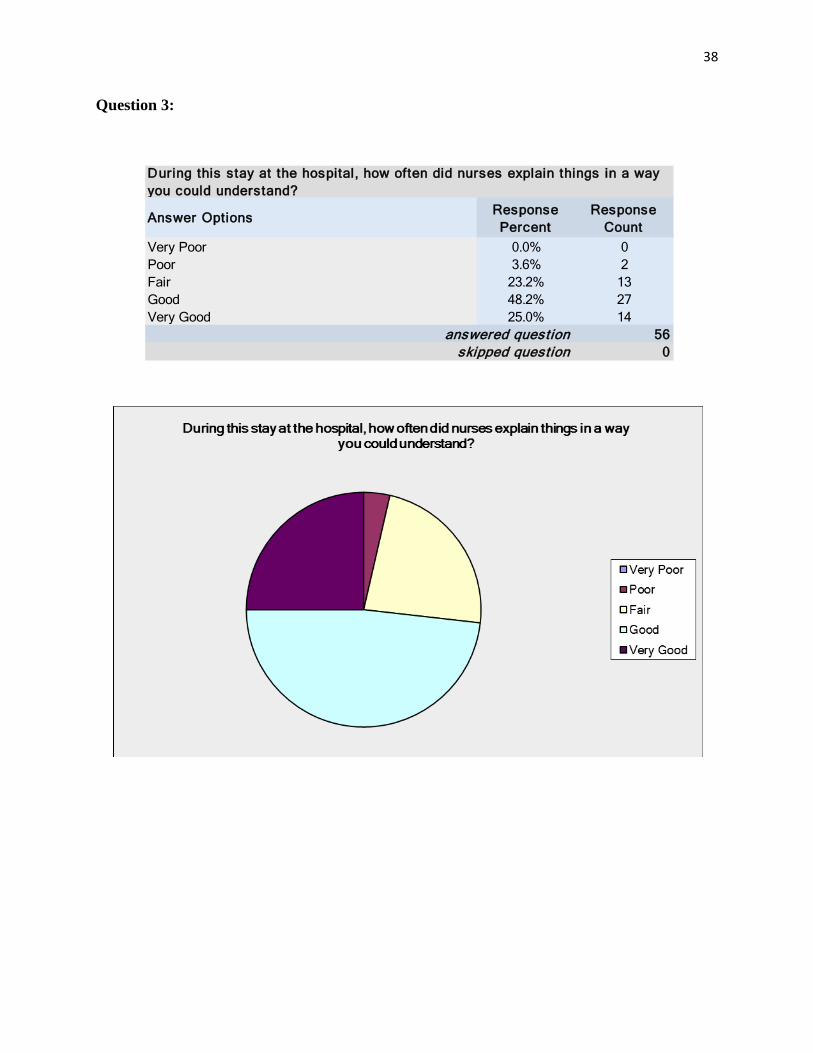
Question 3:
Response Percent
Response Count
0.0% 03.6% 2
23.2% 1348.2% 2725.0% 14
560skipped question
During this stay at the hospital, how often did nurses explain things in a way you could understand?
Good
Very Poor
answered question
Fair
Answer Options
Very Good
Poor
39
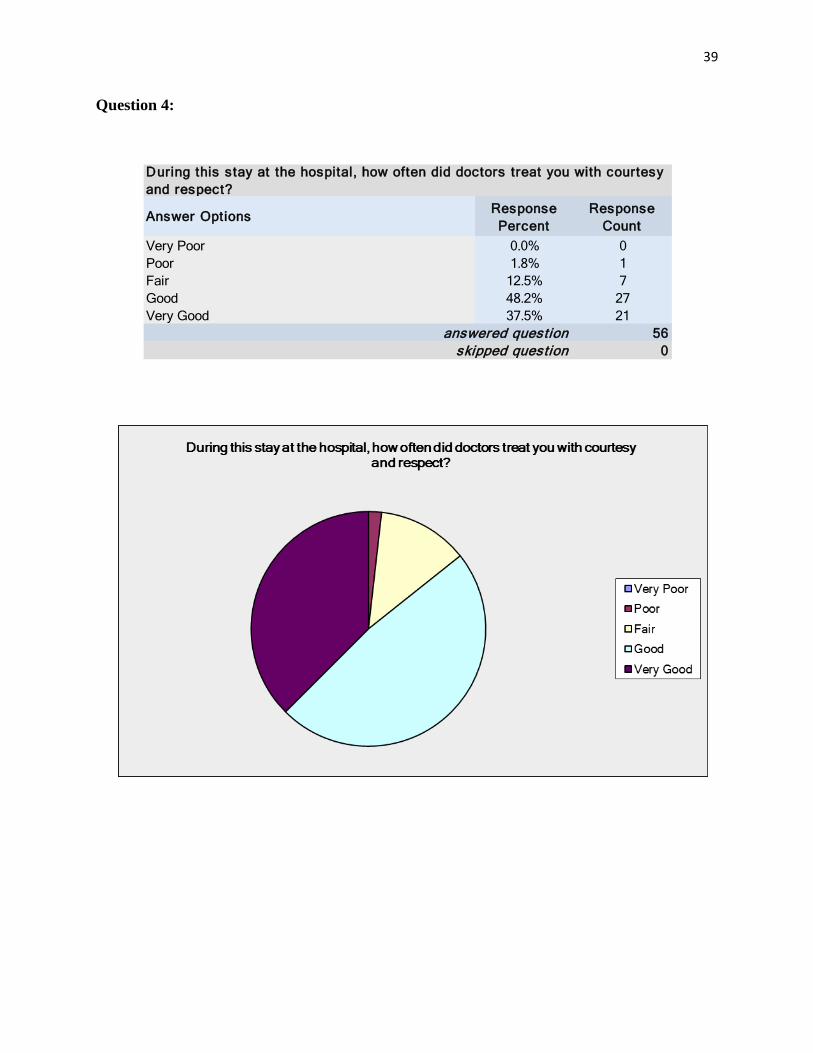
Question 4:
Response Percent
Response Count
0.0% 01.8% 1
12.5% 748.2% 2737.5% 21
560skipped question
During this stay at the hospital, how often did doctors treat you with courtesy and respect?
Good
Very Poor
answered question
Fair
Answer Options
Very Good
Poor
40
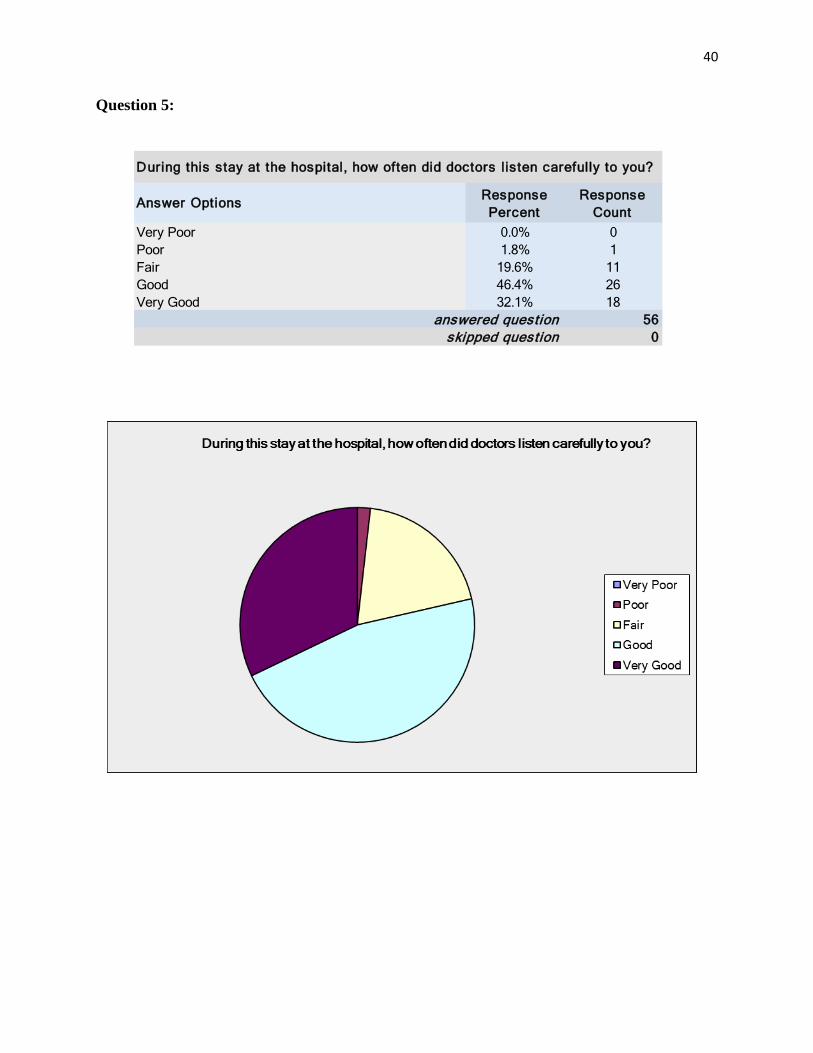
Question 5:
Response Percent
Response Count
0.0% 01.8% 1
19.6% 1146.4% 2632.1% 18
560skipped question
During this stay at the hospital, how often did doctors listen carefully to you?
Good
Very Poor
answered question
Fair
Answer Options
Very Good
Poor
41
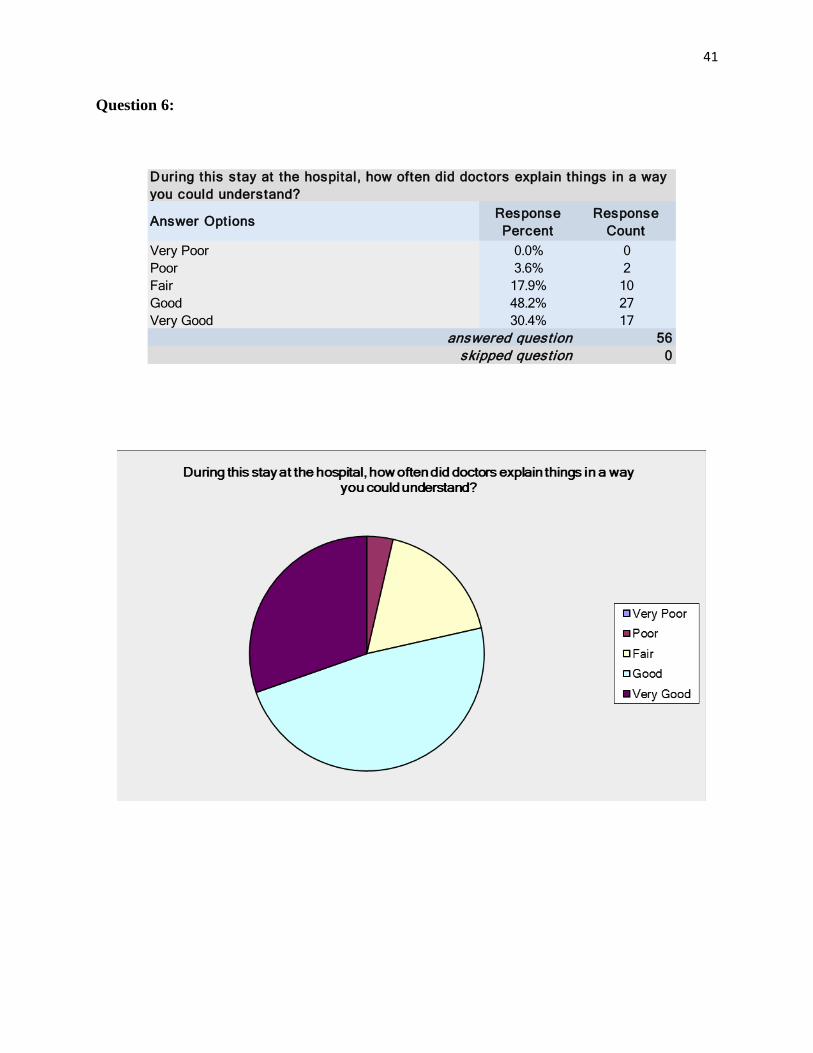
Question 6:
Response Percent
Response Count
0.0% 03.6% 2
17.9% 1048.2% 2730.4% 17
560skipped question
During this stay at the hospital, how often did doctors explain things in a way you could understand?
Good
Very Poor
answered question
Fair
Answer Options
Very Good
Poor
42
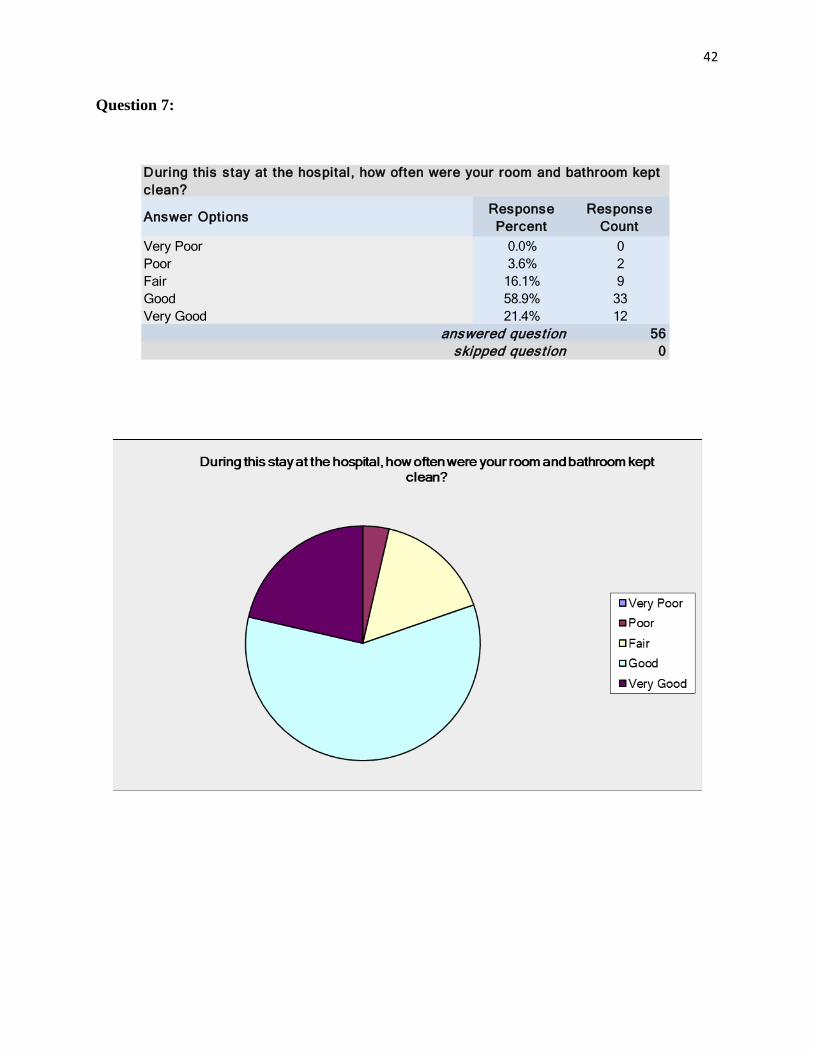
Question 7:
Response Percent
Response Count
0.0% 03.6% 2
16.1% 958.9% 3321.4% 12
560skipped question
During this stay at the hospital, how often were your room and bathroom kept clean?
Good
Very Poor
answered question
Fair
Answer Options
Very Good
Poor
43
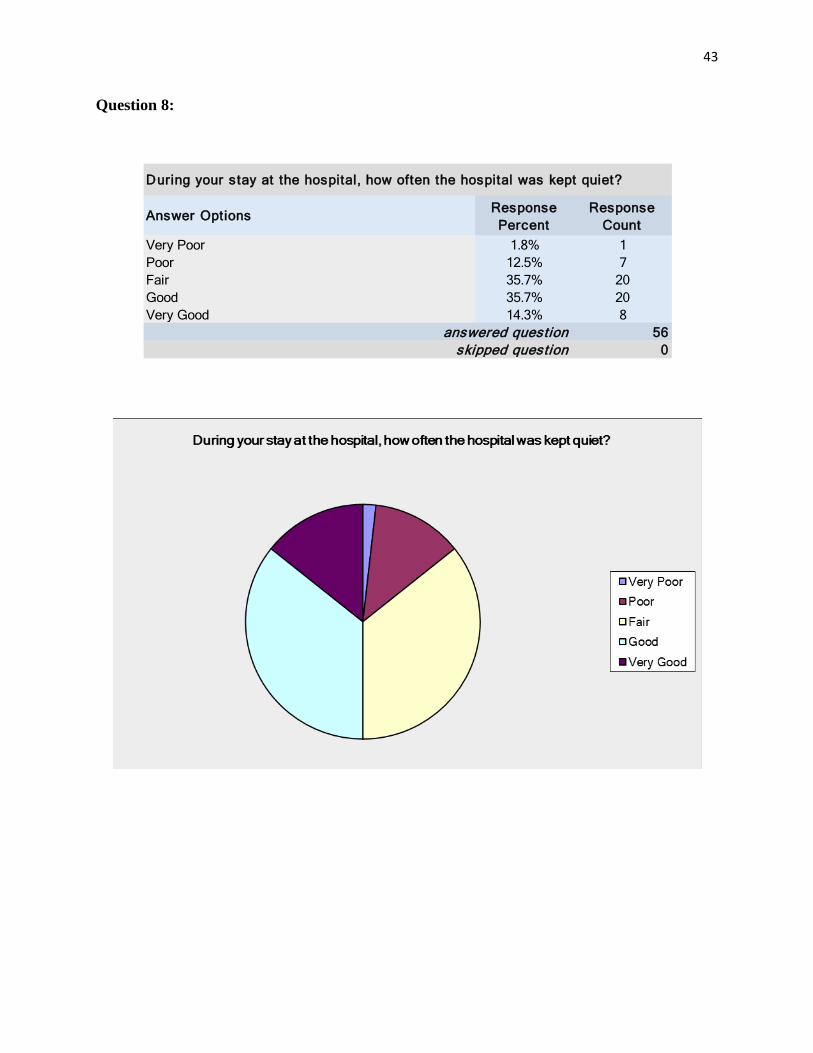
Question 8:
Response Percent
Response Count
1.8% 112.5% 735.7% 2035.7% 2014.3% 8
560skipped question
During your stay at the hospital, how often the hospital was kept quiet?
Good
Very Poor
answered question
Fair
Answer Options
Very Good
Poor
44
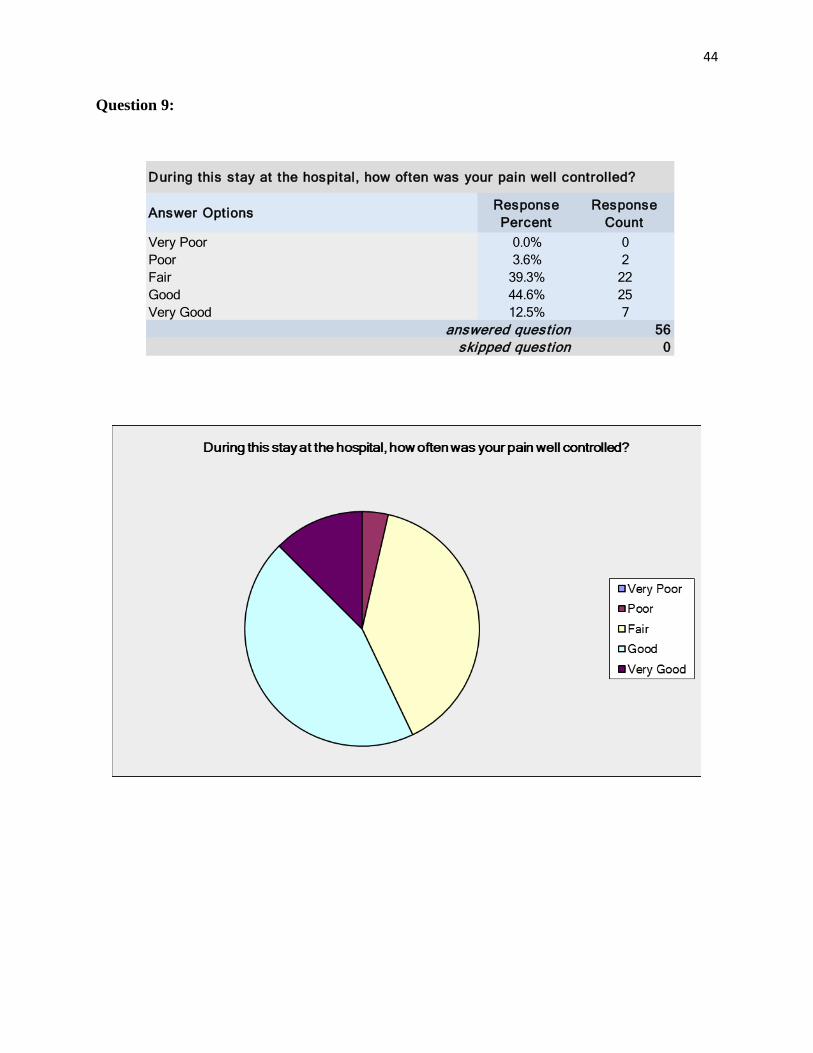
Question 9:
Response Percent
Response Count
0.0% 03.6% 2
39.3% 2244.6% 2512.5% 7
560skipped question
During this stay at the hospital, how often was your pain well controlled?
Good
Very Poor
answered question
Fair
Answer Options
Very Good
Poor
45
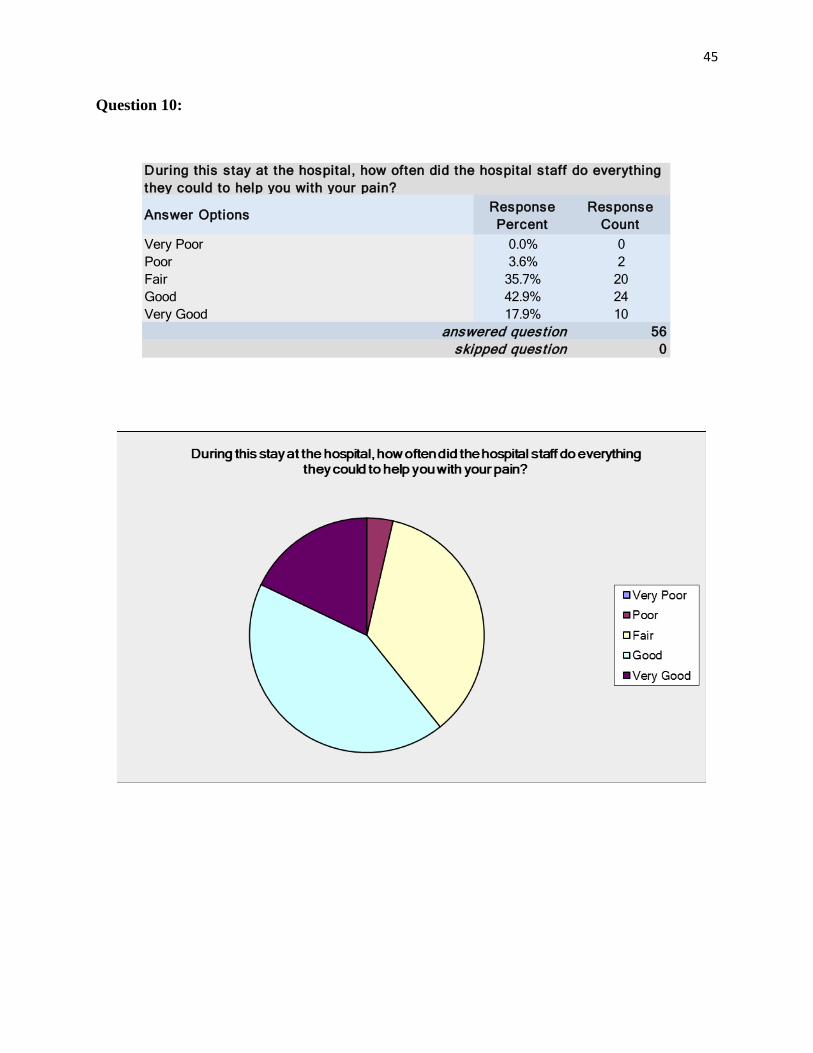
Question 10:
Response Percent
Response Count
0.0% 03.6% 2
35.7% 2042.9% 2417.9% 10
560skipped question
During this stay at the hospital, how often did the hospital staff do everything they could to help you with your pain?
Good
Very Poor
answered question
Fair
Answer Options
Very Good
Poor
46
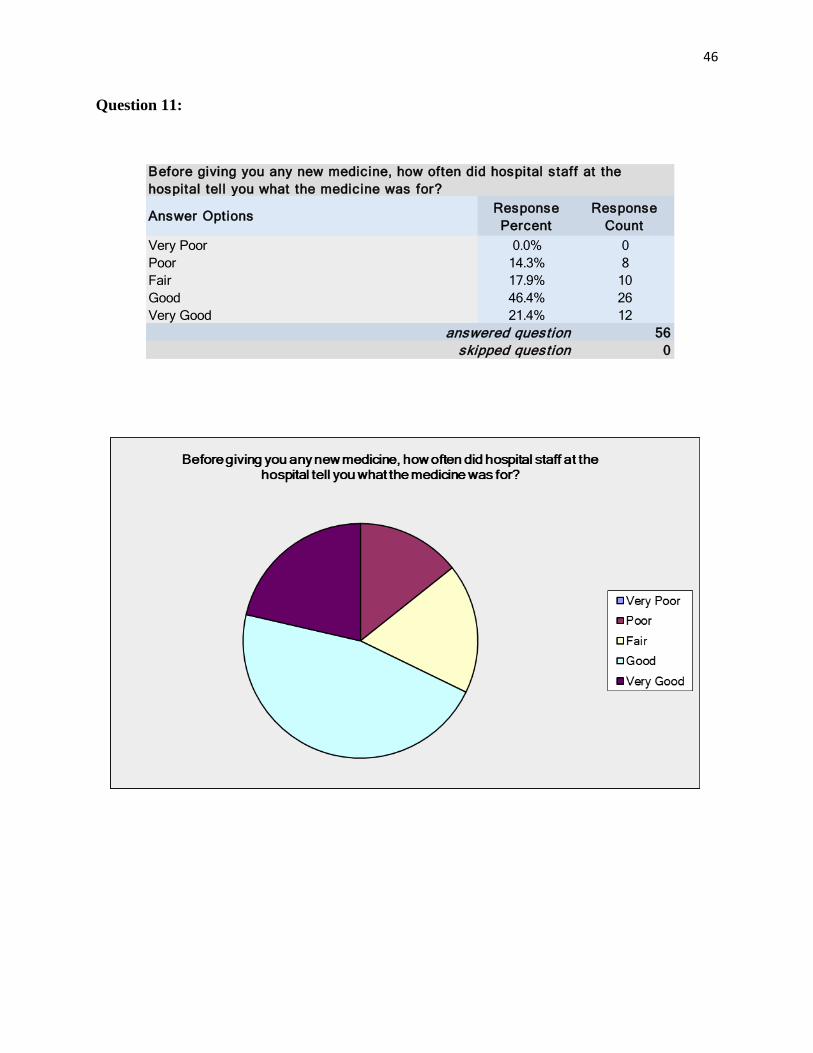
Question 11:
Response Percent
Response Count
0.0% 014.3% 817.9% 1046.4% 2621.4% 12
560skipped question
Before giving you any new medicine, how often did hospital staff at the hospital tell you what the medicine was for?
Good
Very Poor
answered question
Fair
Answer Options
Very Good
Poor
47
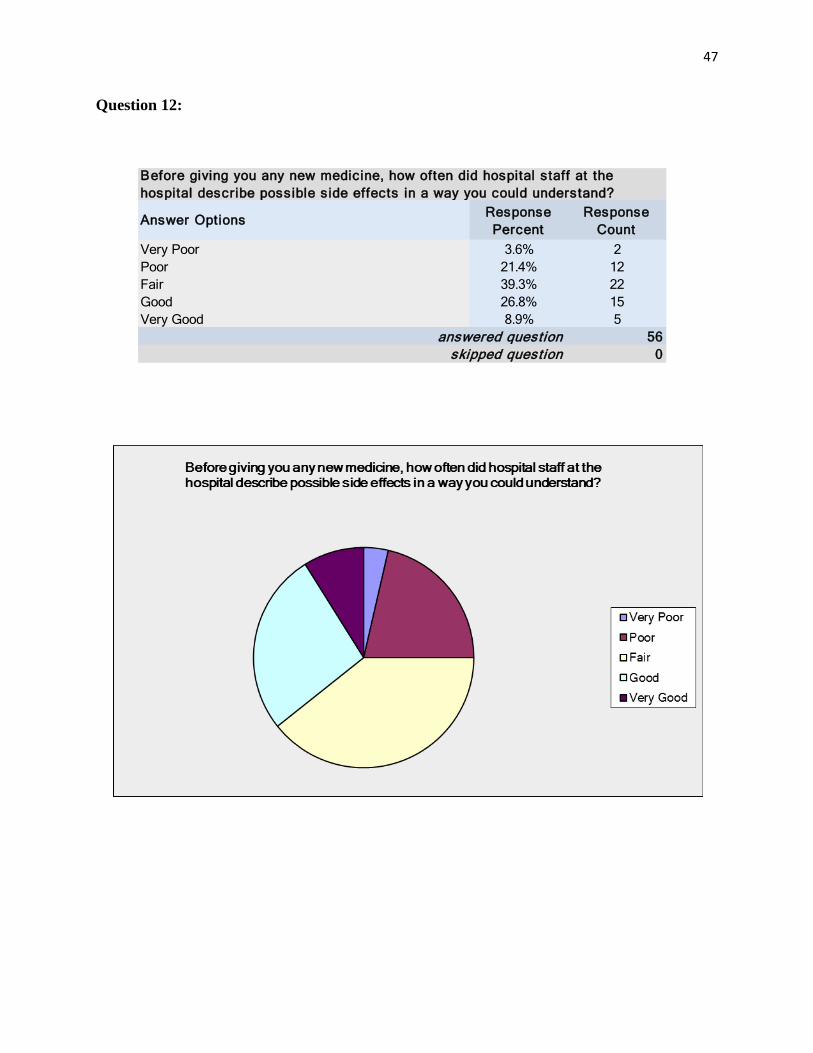
Question 12:
Response Percent
Response Count
3.6% 221.4% 1239.3% 2226.8% 158.9% 5
560skipped question
Before giving you any new medicine, how often did hospital staff at the hospital describe possible side effects in a way you could understand?
Good
Very Poor
answered question
Fair
Answer Options
Very Good
Poor
48
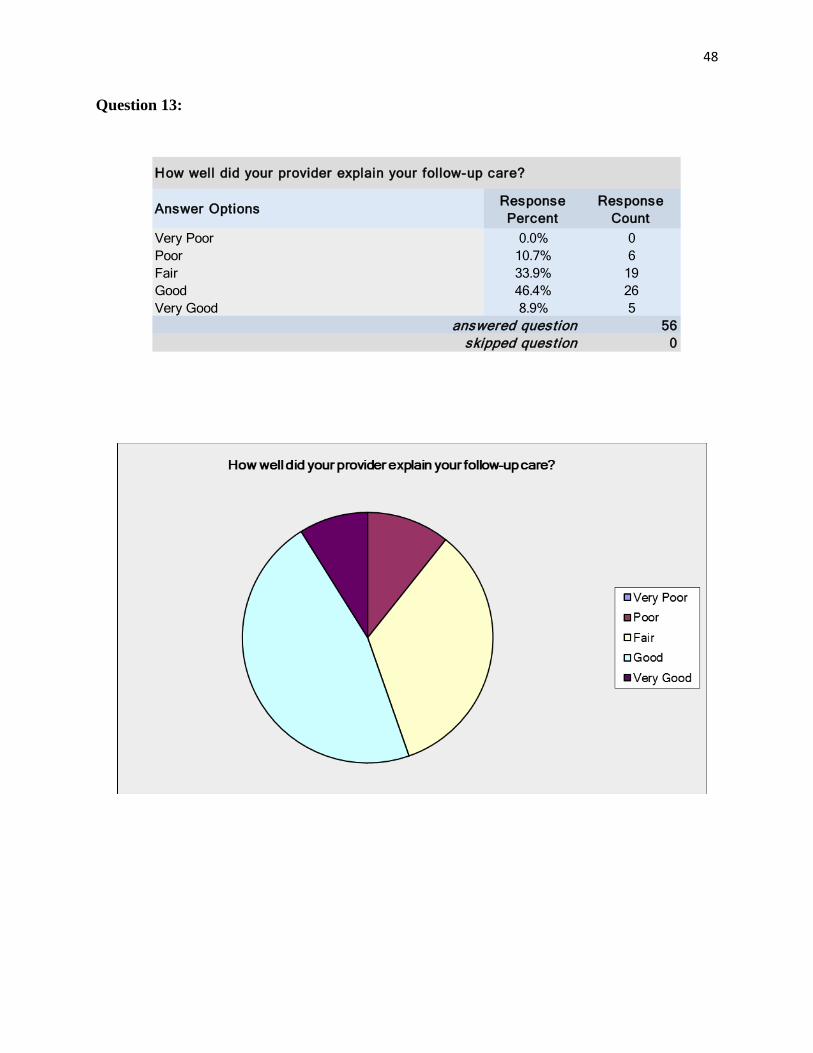
Question 13:
Response Percent
Response Count
0.0% 010.7% 633.9% 1946.4% 268.9% 5
560skipped question
How well did your provider explain your follow-up care?
Good
Very Poor
answered question
Fair
Answer Options
Very Good
Poor
49
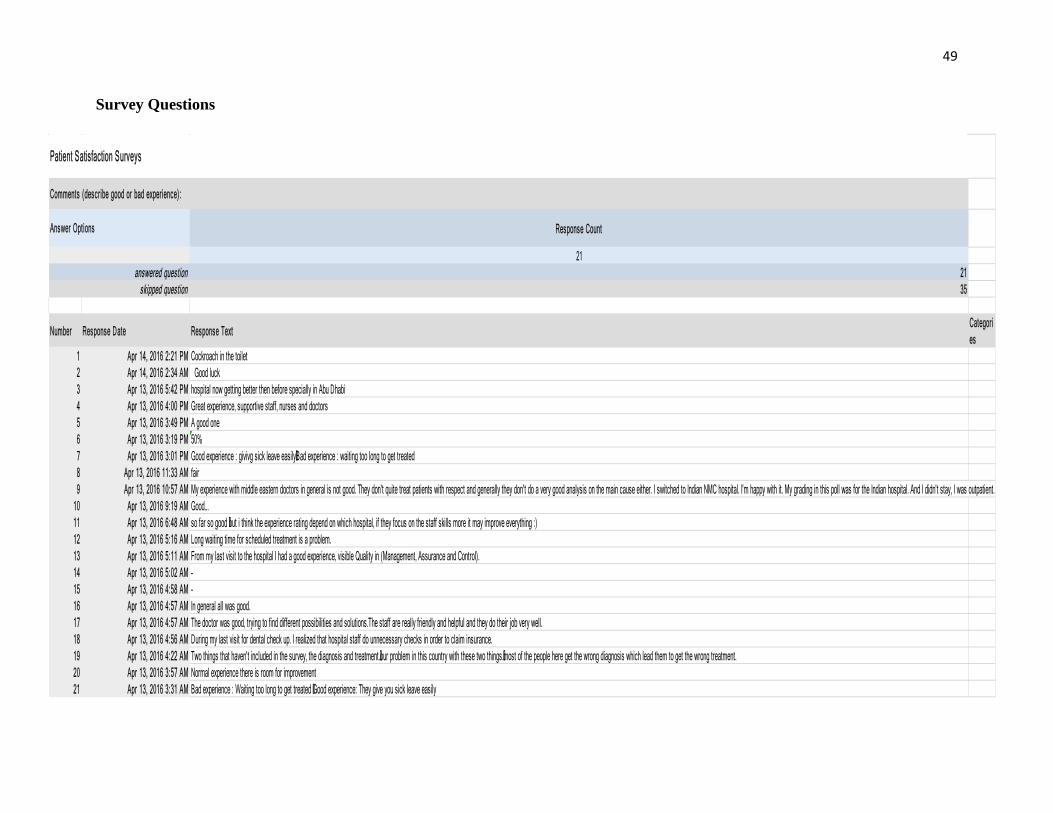
Survey Questions
Response Count
212135
Number Response Date Response TextCategories
1 Apr 14, 2016 2:21 PM Cockroach in the toilet2 Apr 14, 2016 2:34 AM Good luck 3 Apr 13, 2016 5:42 PM hospital now getting better then before specially in Abu Dhabi4 Apr 13, 2016 4:00 PM Great experience, supportive staff, nurses and doctors5 Apr 13, 2016 3:49 PM A good one6 Apr 13, 2016 3:19 PM 50%7 Apr 13, 2016 3:01 PM Good experience : givivg sick leave easily Bad experience : waiting too long to get treated 8 Apr 13, 2016 11:33 AM fair9 Apr 13, 2016 10:57 AM My experience with middle eastern doctors in general is not good. They don't quite treat patients with respect and generally they don't do a very good analysis on the main cause either. I switched to Indian NMC hospital. I'm happy with it. My grading in this poll was for the Indian hospital. And I didn't stay, I was outpatient.
10 Apr 13, 2016 9:19 AM Good...11 Apr 13, 2016 6:48 AM so far so good but i think the experience rating depend on which hospital, if they focus on the staff skills more it may improve everything :)12 Apr 13, 2016 5:16 AM Long waiting time for scheduled treatment is a problem.13 Apr 13, 2016 5:11 AM From my last visit to the hospital I had a good experience, visible Quality in (Management, Assurance and Control). 14 Apr 13, 2016 5:02 AM -15 Apr 13, 2016 4:58 AM -16 Apr 13, 2016 4:57 AM In general all was good.17 Apr 13, 2016 4:57 AM The doctor was good, trying to find different possibilities and solutions.The staff are really friendly and helpful and they do their job very well. 18 Apr 13, 2016 4:56 AM During my last visit for dental check up. I realized that hospital staff do unnecessary checks in order to claim insurance.19 Apr 13, 2016 4:22 AM Two things that haven't included in the survey, the diagnosis and treatment. our problem in this country with these two things. most of the people here get the wrong diagnosis which lead them to get the wrong treatment.20 Apr 13, 2016 3:57 AM Normal experience there is room for improvement21 Apr 13, 2016 3:31 AM Bad experience : Waiting too long to get treated Good experience: They give you sick leave easily
Patient Satisfaction Surveys
Comments (describe good or bad experience):
Answer Options
answered questionskipped question

50