Embed Size (px)
Citation preview
www.exal.com
BUYING GREEN
Quantifying the Impact of Sustainability on Purchase Decisions in
Consumer Goods
2
www.exal.com
Environmental Awareness and Consumer Purchasing Decisions
Consumer buying decisions are driven by a mix of the rational and the emotional.
In the area of eco-friendly packaging, the rational is represented by the practical value of recycling. According to the U.S. EPA, the percent of consumer packaging and containers recycled by weight grew from 38 percent in 2000 to 53 percent in 2015. Clearly consumers are more conscious of the recyclability of the materials they purchase.
But the emotional component may be even more powerful. Consumers today are increasingly exposed to heart-tugging social media videos and news stories highlighting the impact of plastic on ocean environments and the marine life they support. From viral videos of a sea turtle with a plastic straw stuck up its nostril to news reports of an “island” of plastic floating in the Pacific Ocean, today’s consumers are being forced to face the impact of their material choices.
A Shift to SustainabilityThis combination of rational and emotional forces is causing consumer brands that are heavily dependent on non-sustainable packaging to consider changes. However, these brands are operating in a highly competitive market and must balance the cost of moving to eco-friendly materials with the impact of those moves on sales, market share and profitability.
3
www.exal.com
Environmental Awareness and Consumer Purchasing Decisions
Within that context, Exal Corporation commissioned the Boston Consulting Group to perform a blind research study to better understand consumer attitudes toward sustainability, preferences regarding material packaging options and willingness to pay more for eco-friendly products in the beverage and personal care categories.
Capturing the views of more than 5,000 consumers whose gender, age and income distribution closely align with U.S. Census data, the survey provides guidance for brands considering a move to more eco-friendly packaging options.
4
I consider myself to be an environmentally aware consumer.“
It is important to me that the products I buy are packaged in environmentally friendly packaging.“
The majority of consumers today identify themselves as environmentally aware, and an even higher percentage prioritize environmentally friendly packaging.12
%11
%
37
%37
%
4%
4%
20
%25
%
Strongly Agree
Agree
Disagree
Strongly Disagree
Strongly Agree
Agree
Disagree
Strongly Disagree
Agree
Agree
Disagree
Disagreewww.exal.com
Majority of Consumers Identify as Environmentally Aware
It’s one thing to suspect consumers are becoming more environmentally aware and another to be able to quantify it.
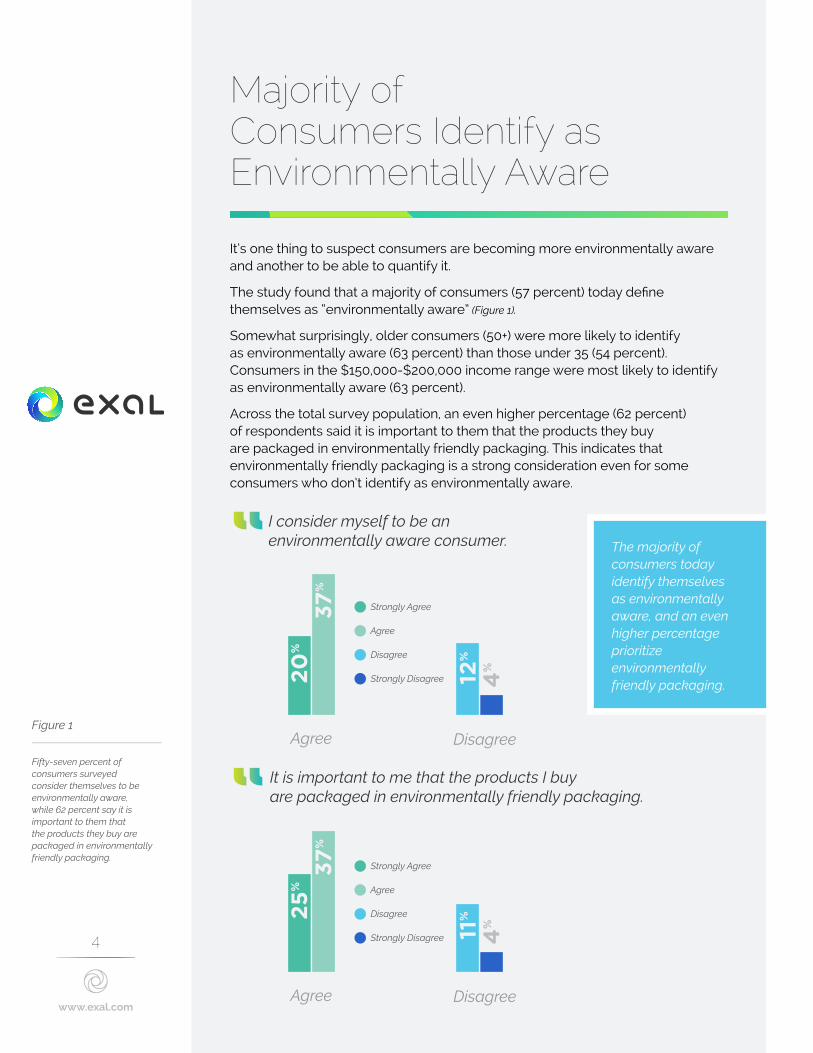
The study found that a majority of consumers (57 percent) today define themselves as “environmentally aware” (Figure 1).
Somewhat surprisingly, older consumers (50+) were more likely to identify as environmentally aware (63 percent) than those under 35 (54 percent). Consumers in the $150,000-$200,000 income range were most likely to identify as environmentally aware (63 percent).
Across the total survey population, an even higher percentage (62 percent) of respondents said it is important to them that the products they buy are packaged in environmentally friendly packaging. This indicates that environmentally friendly packaging is a strong consideration even for some consumers who don’t identify as environmentally aware.
Figure 1
Fifty-seven percent of consumers surveyed consider themselves to be environmentally aware, while 62 percent say it is important to them that the products they buy are packaged in environmentally friendly packaging.
5
The sustainability of packaging is a factor in my product selection process.“
I look for information on the recyclability or sustainability of the packaging I buy.“
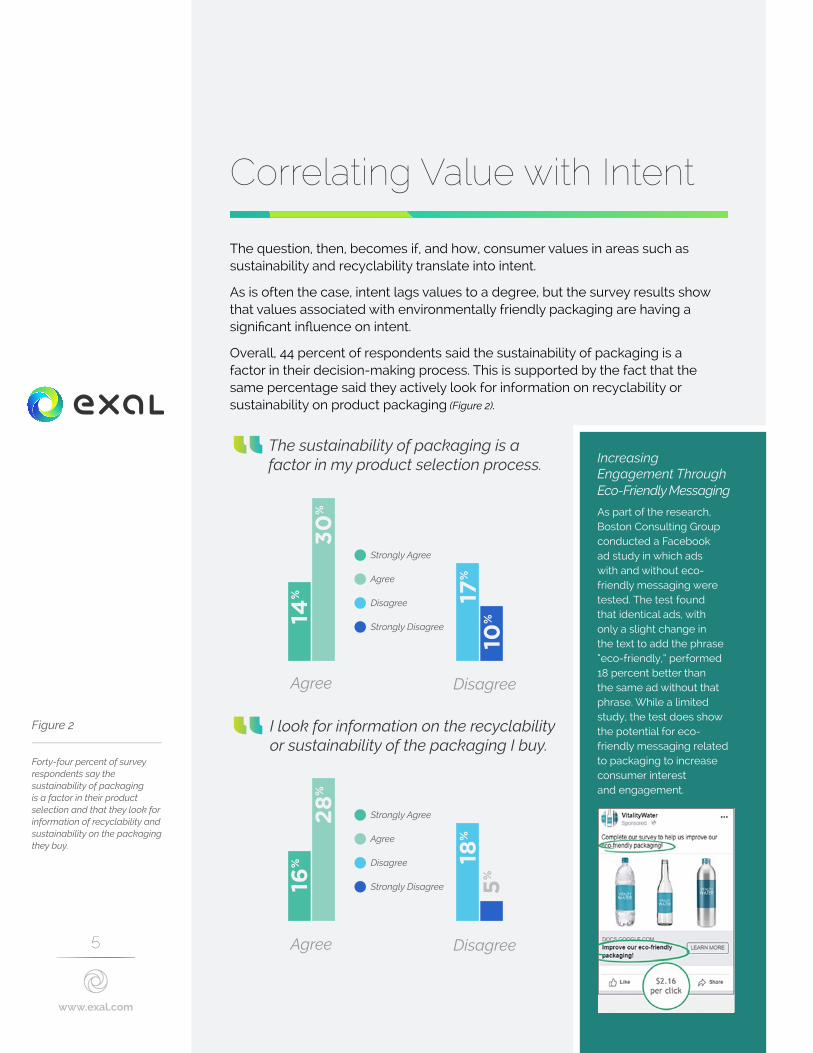
Increasing Engagement Through Eco-Friendly Messaging As part of the research, Boston Consulting Group conducted a Facebook ad study in which ads with and without eco-friendly messaging were tested. The test found that identical ads, with only a slight change in the text to add the phrase “eco-friendly,” performed 18 percent better than the same ad without that phrase. While a limited study, the test does show the potential for eco-friendly messaging related to packaging to increase consumer interest and engagement.
17%
18%
30
%28
%
10%
5%
14%
16%
Strongly Agree
Agree
Disagree
Strongly Disagree
Strongly Agree
Agree
Disagree
Strongly Disagree
Agree
Agree
Disagree
Disagree
www.exal.com
Correlating Value with Intent
The question, then, becomes if, and how, consumer values in areas such as sustainability and recyclability translate into intent.
As is often the case, intent lags values to a degree, but the survey results show that values associated with environmentally friendly packaging are having a significant influence on intent.
Overall, 44 percent of respondents said the sustainability of packaging is a factor in their decision-making process. This is supported by the fact that the same percentage said they actively look for information on recyclability or sustainability on product packaging (Figure 2).
Figure 2
Forty-four percent of survey respondents say the sustainability of packaging is a factor in their product selection and that they look for information of recyclability and sustainability on the packaging they buy.
6
I am less likely to buy products with packaging that is harmful to the environment.“
I won’t buy products with packaging that is harmful to the environment.“
A significant percentage of consumers seek out information on recyclability and sustainability and reject products they consider harmful to the environment.
22
%
24
%
12%
13%
14%
35
%
6%
22
%
Strongly Agree
Agree
Disagree
Strongly Disagree
Strongly Agree
Agree
Disagree
Strongly Disagree
Agree
Agree
Disagree
Disagree
www.exal.com
Correlating Value with Intent
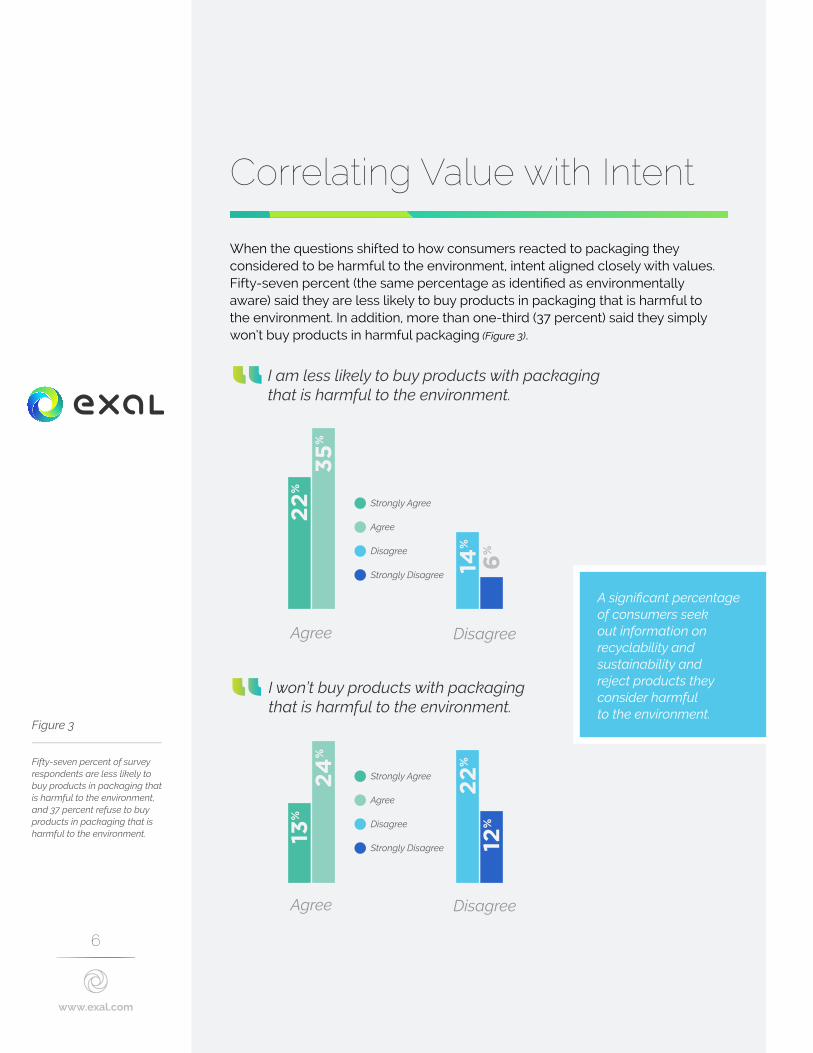
When the questions shifted to how consumers reacted to packaging they considered to be harmful to the environment, intent aligned closely with values. Fifty-seven percent (the same percentage as identified as environmentally aware) said they are less likely to buy products in packaging that is harmful to the environment. In addition, more than one-third (37 percent) said they simply won’t buy products in harmful packaging (Figure 3).
Figure 3
Fifty-seven percent of survey respondents are less likely to buy products in packaging that is harmful to the environment, and 37 percent refuse to buy products in packaging that is harmful to the environment.
7
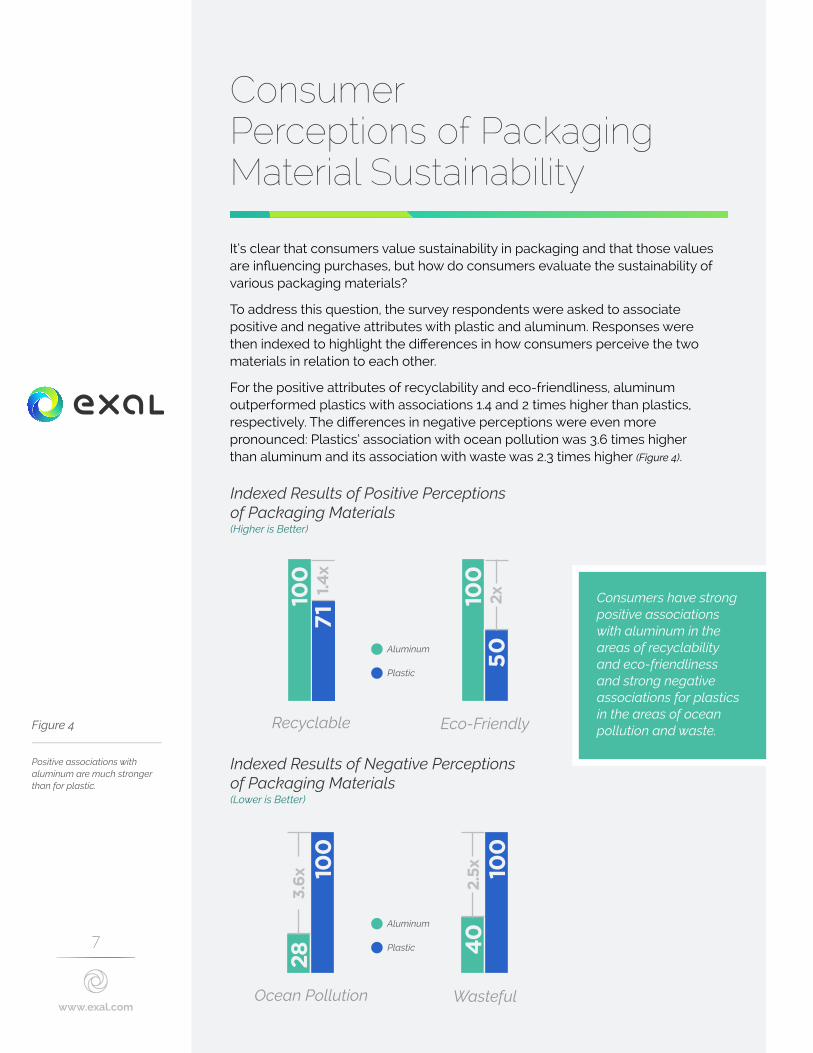
Indexed Results of Positive Perceptions of Packaging Materials(Higher is Better)
Indexed Results of Negative Perceptions of Packaging Materials(Lower is Better)
Consumers have strong positive associations with aluminum in the areas of recyclability and eco-friendliness and strong negative associations for plastics in the areas of ocean pollution and waste.
100
100
100
71
Aluminum
Plastic
Aluminum
Plastic
Recyclable
Ocean Pollution
Eco-Friendly
Wasteful
100
100
50
40
28
2.5x
3.6x
1.4x
2x
www.exal.com
Consumer Perceptions of Packaging Material Sustainability
It’s clear that consumers value sustainability in packaging and that those values are influencing purchases, but how do consumers evaluate the sustainability of various packaging materials?
To address this question, the survey respondents were asked to associate positive and negative attributes with plastic and aluminum. Responses were then indexed to highlight the differences in how consumers perceive the two materials in relation to each other.
For the positive attributes of recyclability and eco-friendliness, aluminum outperformed plastics with associations 1.4 and 2 times higher than plastics, respectively. The differences in negative perceptions were even more pronounced: Plastics’ association with ocean pollution was 3.6 times higher than aluminum and its association with waste was 2.3 times higher (Figure 4).
Figure 4
Positive associations with aluminum are much stronger than for plastic.
8
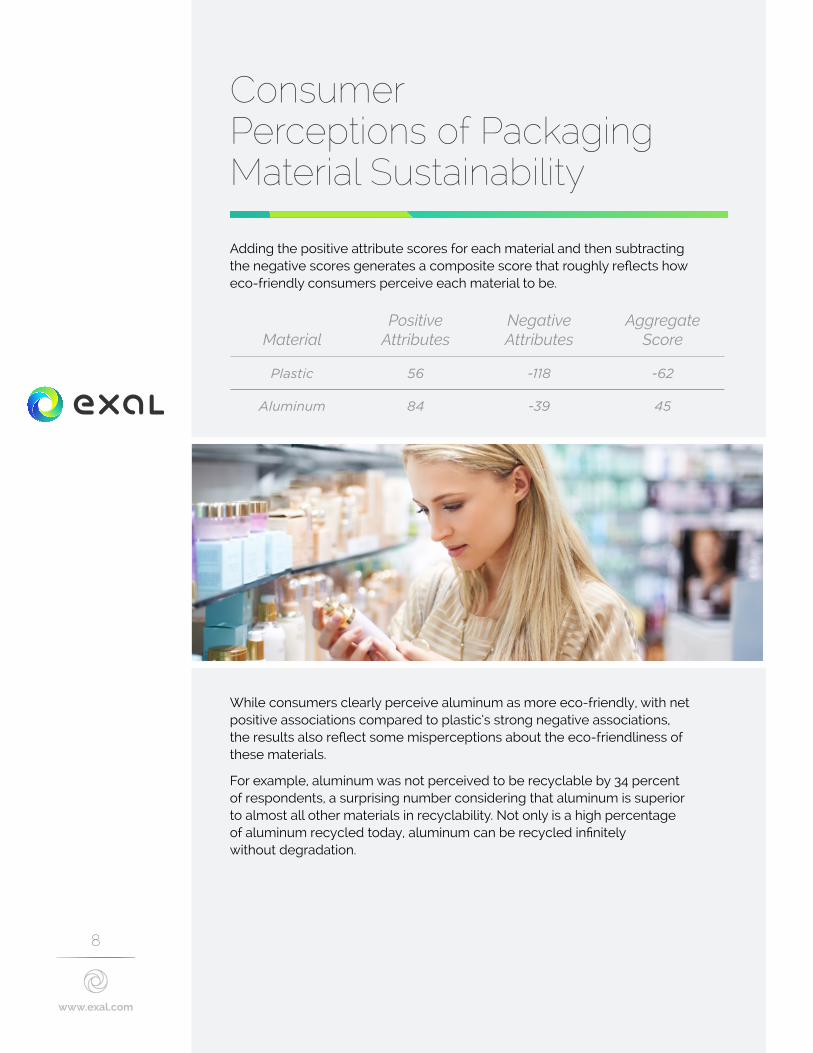
MaterialPositive
AttributesNegative Attributes
Aggregate Score
Plastic 56 -118 -62
Aluminum 84 -39 45
www.exal.com
Consumer Perceptions of Packaging Material Sustainability
Adding the positive attribute scores for each material and then subtracting the negative scores generates a composite score that roughly reflects how eco-friendly consumers perceive each material to be.
While consumers clearly perceive aluminum as more eco-friendly, with net positive associations compared to plastic’s strong negative associations, the results also reflect some misperceptions about the eco-friendliness of these materials.
For example, aluminum was not perceived to be recyclable by 34 percent of respondents, a surprising number considering that aluminum is superior to almost all other materials in recyclability. Not only is a high percentage of aluminum recycled today, aluminum can be recycled infinitely without degradation.
9
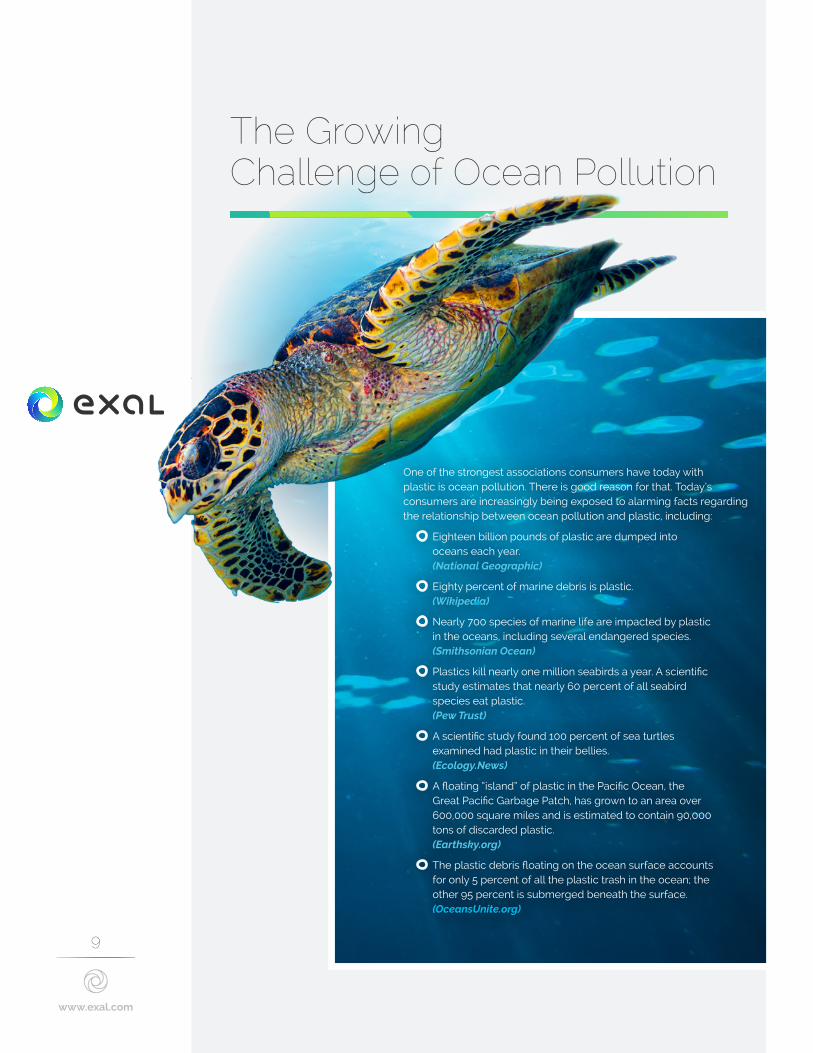
One of the strongest associations consumers have today with plastic is ocean pollution. There is good reason for that. Today’s consumers are increasingly being exposed to alarming facts regarding the relationship between ocean pollution and plastic, including:
Eighteen billion pounds of plastic are dumped into oceans each year. (National Geographic)
Eighty percent of marine debris is plastic. (Wikipedia)
Nearly 700 species of marine life are impacted by plastic in the oceans, including several endangered species. (Smithsonian Ocean)
Plastics kill nearly one million seabirds a year. A scientific study estimates that nearly 60 percent of all seabird species eat plastic. (Pew Trust)
A scientific study found 100 percent of sea turtles examined had plastic in their bellies. (Ecology.News)
A floating “island” of plastic in the Pacific Ocean, the Great Pacific Garbage Patch, has grown to an area over 600,000 square miles and is estimated to contain 90,000 tons of discarded plastic. (Earthsky.org)
The plastic debris floating on the ocean surface accounts for only 5 percent of all the plastic trash in the ocean; the other 95 percent is submerged beneath the surface. (OceansUnite.org)
www.exal.com
The Growing Challenge of Ocean Pollution
10
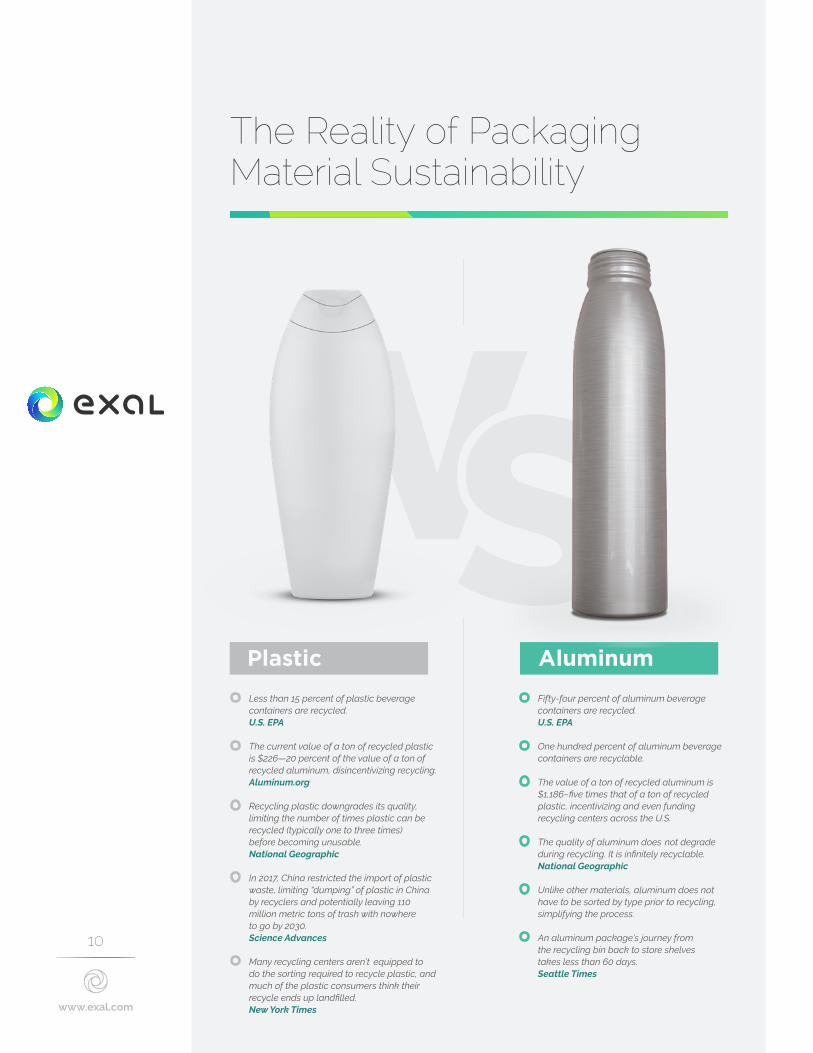
AluminumPlastic
www.exal.com
The Reality of Packaging Material Sustainability
Fifty-four percent of aluminum beverage containers are recycled. U.S. EPA
One hundred percent of aluminum beverage containers are recyclable.
The value of a ton of recycled aluminum is $1,186–five times that of a ton of recycled plastic, incentivizing and even funding recycling centers across the U.S.
The quality of aluminum does not degrade during recycling. It is infinitely recyclable. National Geographic
Unlike other materials, aluminum does not have to be sorted by type prior to recycling, simplifying the process.
An aluminum package’s journey from the recycling bin back to store shelves takes less than 60 days. Seattle Times
Less than 15 percent of plastic beverage containers are recycled. U.S. EPA
The current value of a ton of recycled plastic is $226—20 percent of the value of a ton of recycled aluminum, disincentivizing recycling. Aluminum.org
Recycling plastic downgrades its quality, limiting the number of times plastic can be recycled (typically one to three times) before becoming unusable. National Geographic
In 2017, China restricted the import of plastic waste, limiting “dumping” of plastic in China by recyclers and potentially leaving 110 million metric tons of trash with nowhere to go by 2030. Science Advances
Many recycling centers aren’t equipped to do the sorting required to recycle plastic, and much of the plastic consumers think their recycle ends up landfilled. New York Times
11
WH
ILE
Beverage Category Personal Care Category
www.exal.com
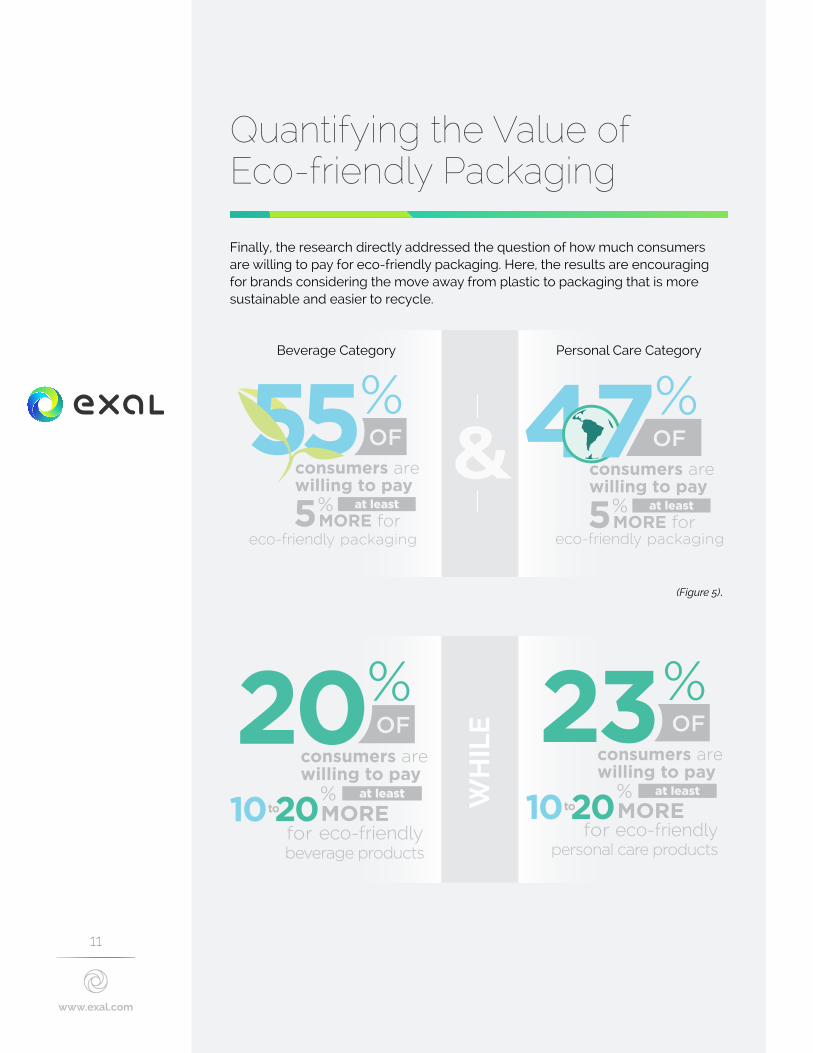
Quantifying the Value of Eco-friendly Packaging
Finally, the research directly addressed the question of how much consumers are willing to pay for eco-friendly packaging. Here, the results are encouraging for brands considering the move away from plastic to packaging that is more sustainable and easier to recycle.
(Figure 5).
12
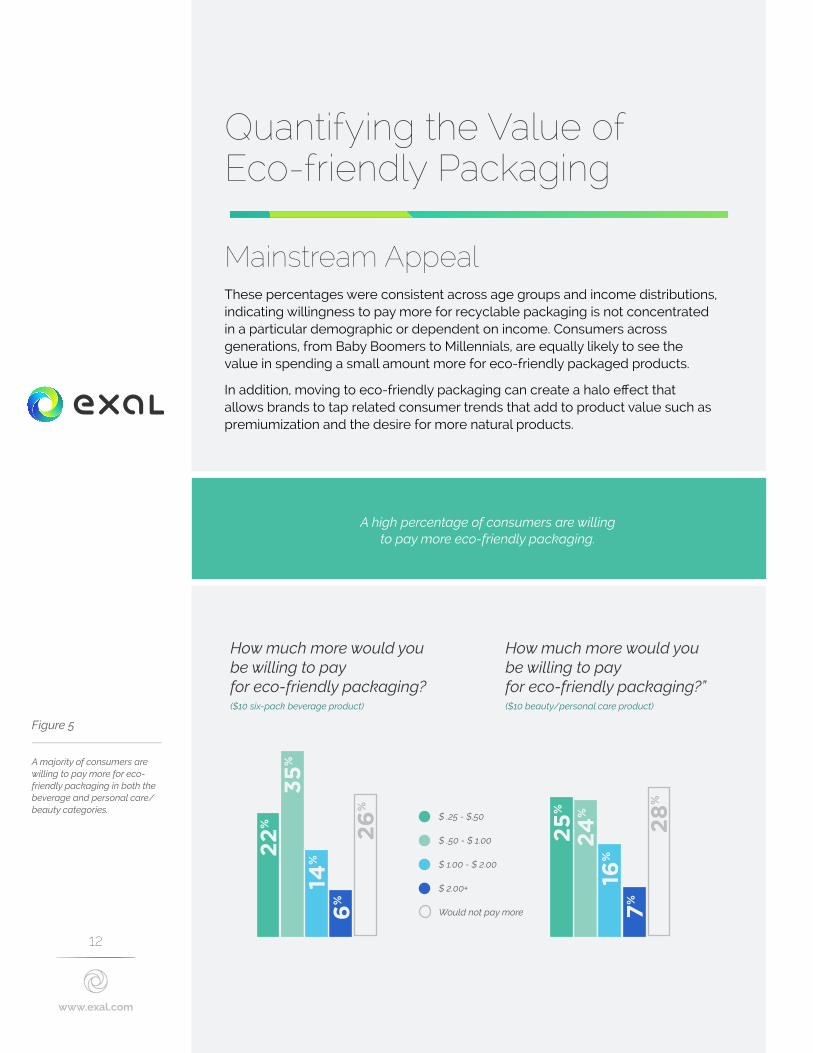
How much more would you be willing to pay for eco-friendly packaging?($10 six-pack beverage product)
$ .25 - $.50
$ .50 - $ 1.00
$ 1.00 - $ 2.00
$ 2.00+
Would not pay more
How much more would you be willing to pay for eco-friendly packaging?”($10 beauty/personal care product)
35
%
14%
22
%
6%
26
%
24
%
16%
25
%
7%
28
%
A high percentage of consumers are willing to pay more eco-friendly packaging.
www.exal.com
Quantifying the Value of Eco-friendly Packaging
Mainstream Appeal These percentages were consistent across age groups and income distributions, indicating willingness to pay more for recyclable packaging is not concentrated in a particular demographic or dependent on income. Consumers across generations, from Baby Boomers to Millennials, are equally likely to see the value in spending a small amount more for eco-friendly packaged products.
In addition, moving to eco-friendly packaging can create a halo effect that allows brands to tap related consumer trends that add to product value such as premiumization and the desire for more natural products.
Figure 5
A majority of consumers are willing to pay more for eco-friendly packaging in both the beverage and personal care/beauty categories.
13
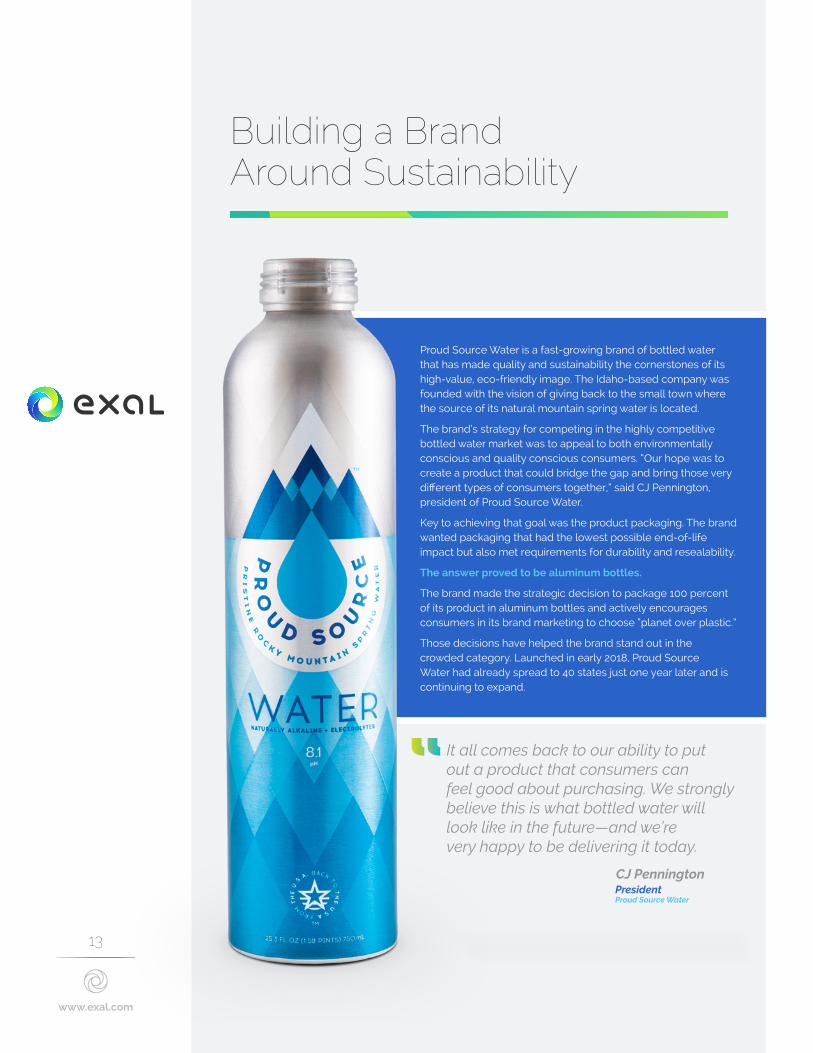
Proud Source Water is a fast-growing brand of bottled water that has made quality and sustainability the cornerstones of its high-value, eco-friendly image. The Idaho-based company was founded with the vision of giving back to the small town where the source of its natural mountain spring water is located.
The brand’s strategy for competing in the highly competitive bottled water market was to appeal to both environmentally conscious and quality conscious consumers. “Our hope was to create a product that could bridge the gap and bring those very different types of consumers together,” said CJ Pennington, president of Proud Source Water.
Key to achieving that goal was the product packaging. The brand wanted packaging that had the lowest possible end-of-life impact but also met requirements for durability and resealability.
The answer proved to be aluminum bottles.
The brand made the strategic decision to package 100 percent of its product in aluminum bottles and actively encourages consumers in its brand marketing to choose “planet over plastic.”
Those decisions have helped the brand stand out in the crowded category. Launched in early 2018, Proud Source Water had already spread to 40 states just one year later and is continuing to expand.
www.exal.com
Building a Brand Around Sustainability
It all comes back to our ability to put out a product that consumers can feel good about purchasing. We strongly believe this is what bottled water will look like in the future—and we’re very happy to be delivering it today.
CJ Pennington President Proud Source Water
“
14
www.exal.com
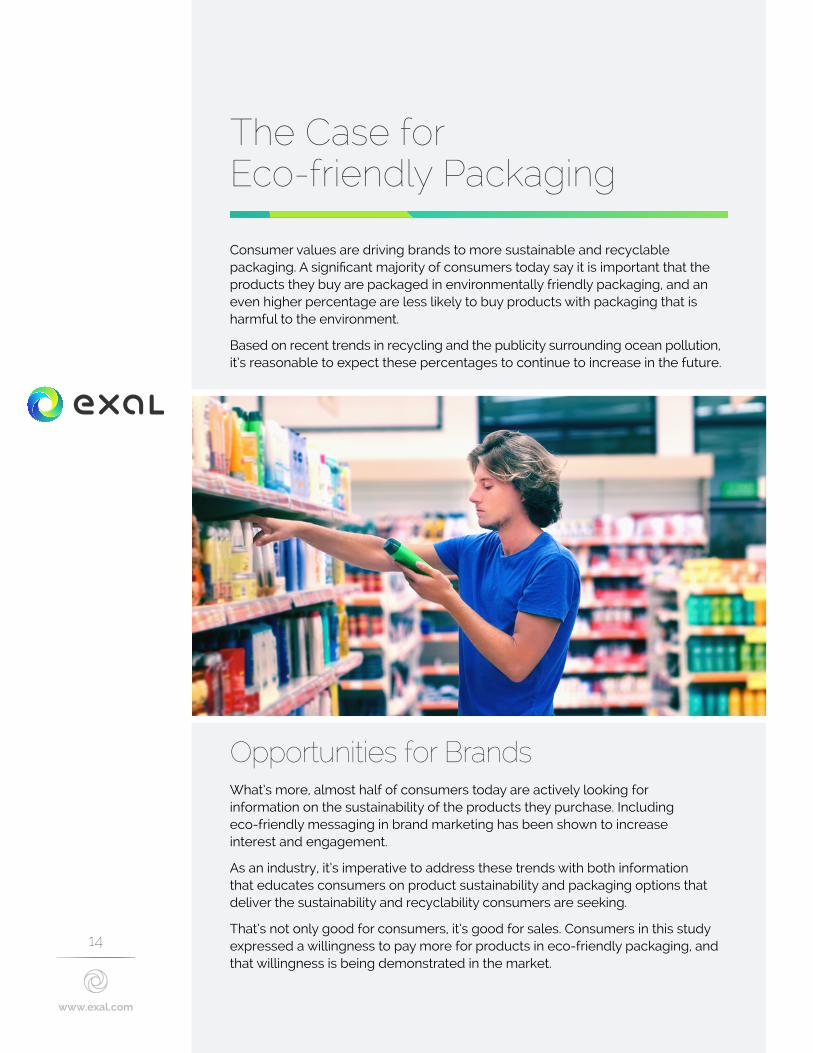
The Case for Eco-friendly Packaging
Consumer values are driving brands to more sustainable and recyclable packaging. A significant majority of consumers today say it is important that the products they buy are packaged in environmentally friendly packaging, and an even higher percentage are less likely to buy products with packaging that is harmful to the environment.
Based on recent trends in recycling and the publicity surrounding ocean pollution, it’s reasonable to expect these percentages to continue to increase in the future.
Opportunities for BrandsWhat’s more, almost half of consumers today are actively looking for information on the sustainability of the products they purchase. Including eco-friendly messaging in brand marketing has been shown to increase interest and engagement.
As an industry, it’s imperative to address these trends with both information that educates consumers on product sustainability and packaging options that deliver the sustainability and recyclability consumers are seeking.
That’s not only good for consumers, it’s good for sales. Consumers in this study expressed a willingness to pay more for products in eco-friendly packaging, and that willingness is being demonstrated in the market.
15
www.exal.com
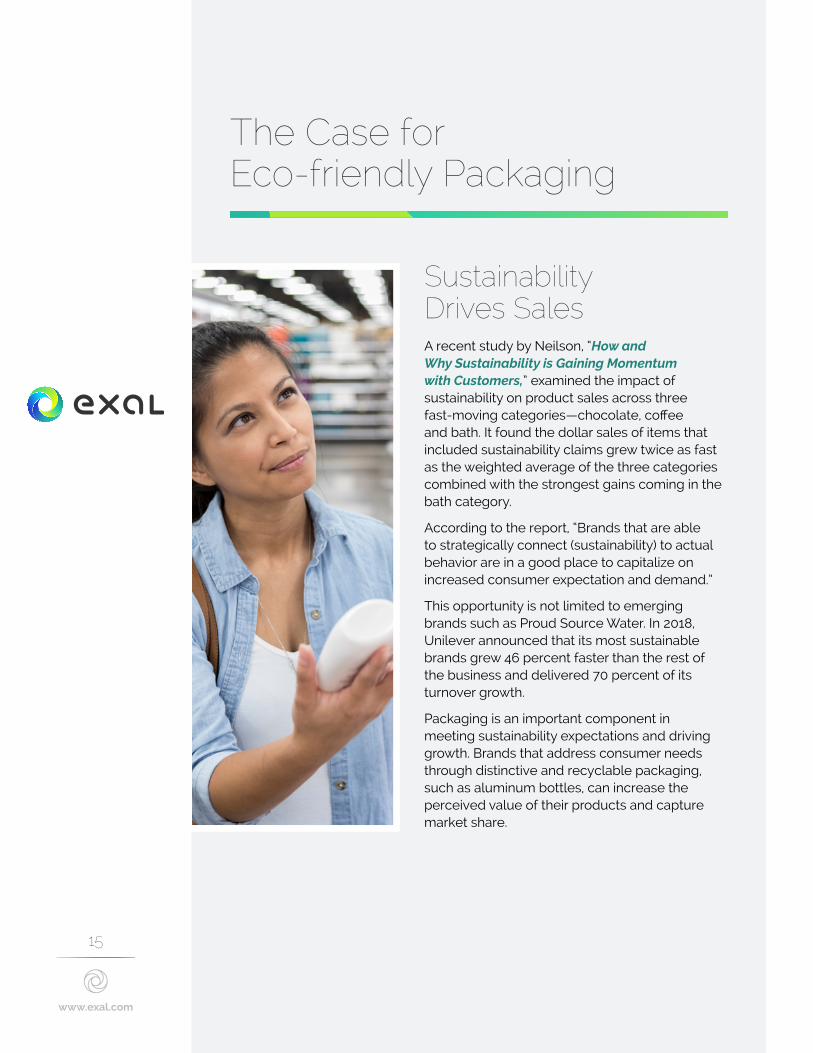
The Case for Eco-friendly Packaging
Sustainability Drives SalesA recent study by Neilson, “How and Why Sustainability is Gaining Momentum with Customers,” examined the impact of sustainability on product sales across three fast-moving categories—chocolate, coffee and bath. It found the dollar sales of items that included sustainability claims grew twice as fast as the weighted average of the three categories combined with the strongest gains coming in the bath category.
According to the report, “Brands that are able to strategically connect (sustainability) to actual behavior are in a good place to capitalize on increased consumer expectation and demand.”
This opportunity is not limited to emerging brands such as Proud Source Water. In 2018, Unilever announced that its most sustainable brands grew 46 percent faster than the rest of the business and delivered 70 percent of its turnover growth.
Packaging is an important component in meeting sustainability expectations and driving growth. Brands that address consumer needs through distinctive and recyclable packaging, such as aluminum bottles, can increase the perceived value of their products and capture market share.
16
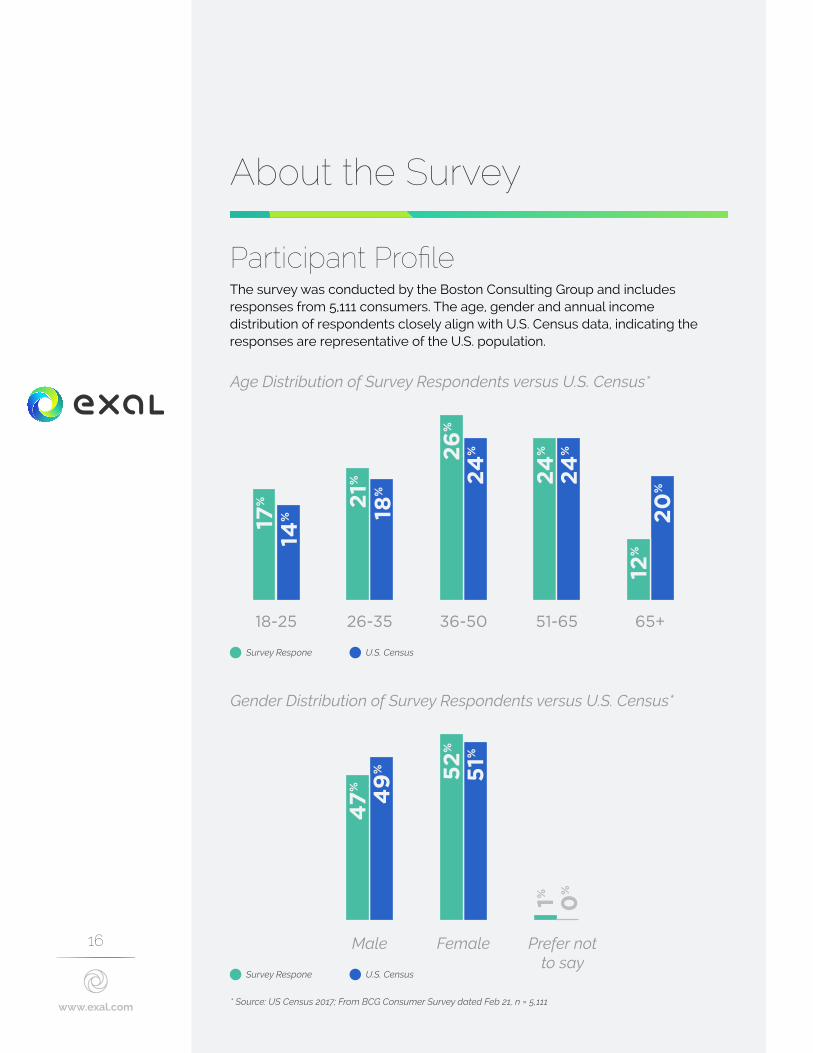
Age Distribution of Survey Respondents versus U.S. Census*
* Source: US Census 2017; From BCG Consumer Survey dated Feb 21, n = 5,111
Gender Distribution of Survey Respondents versus U.S. Census*
Survey Respone U.S. Census
Survey Respone U.S. Census
24
%
24
%
20
%12
%
24
%26
%
51%52
%
0%1%
49
%47
%21%
18%
17%
14%
18-25 26-35 36-50
Female Prefer not to say
Male
51-65 65+
www.exal.com
About the Survey
Participant Profile The survey was conducted by the Boston Consulting Group and includes responses from 5,111 consumers. The age, gender and annual income distribution of respondents closely align with U.S. Census data, indicating the responses are representative of the U.S. population.
17
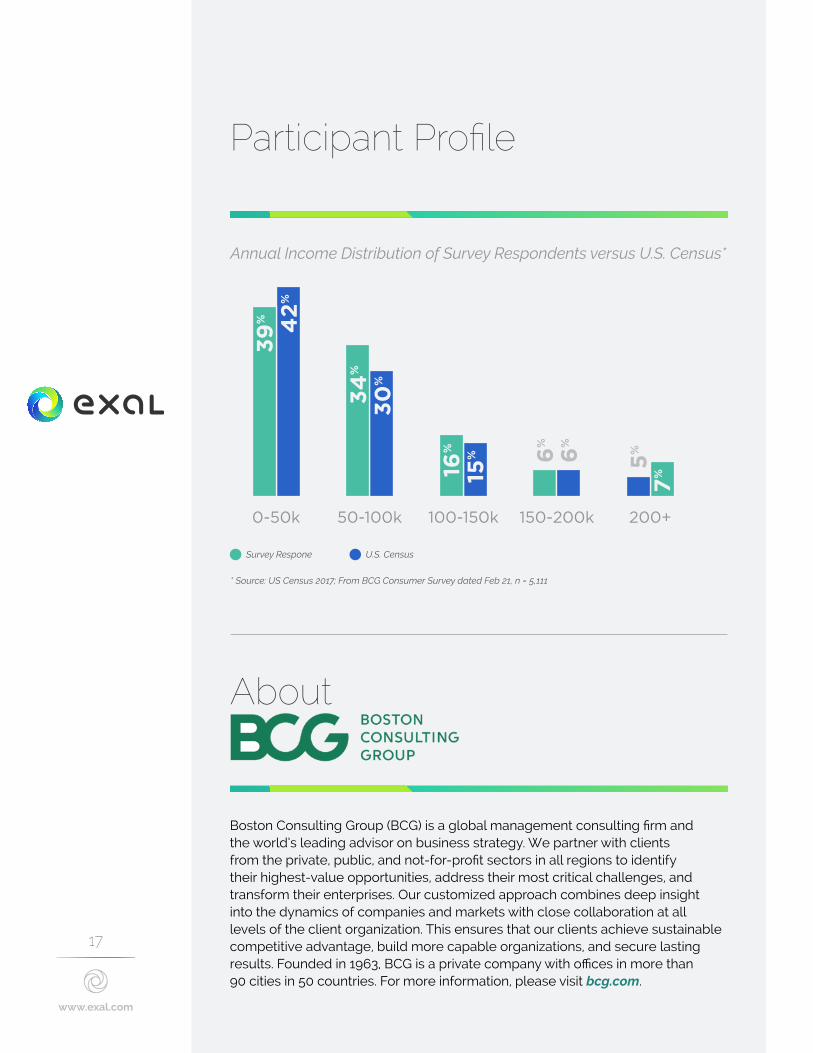
Annual Income Distribution of Survey Respondents versus U.S. Census*
* Source: US Census 2017; From BCG Consumer Survey dated Feb 21, n = 5,111
Survey Respone U.S. Census6
%
6%
7%5
%
15%
16%
34
%
30
%
39
% 42
%
0-50k 50-100k 100-150k 150-200k 200+
www.exal.com
Participant Profile
About
Boston Consulting Group (BCG) is a global management consulting firm and the world’s leading advisor on business strategy. We partner with clients from the private, public, and not-for-profit sectors in all regions to identify their highest-value opportunities, address their most critical challenges, and transform their enterprises. Our customized approach combines deep insight into the dynamics of companies and markets with close collaboration at all levels of the client organization. This ensures that our clients achieve sustainable competitive advantage, build more capable organizations, and secure lasting results. Founded in 1963, BCG is a private company with offices in more than 90 cities in 50 countries. For more information, please visit bcg.com.
18
www.exal.com
About Exal
Exal helps brands break through the sea of sameness with breakthrough aluminum packaging for all types of brands. Pioneering new solutions that become industry standards, like the aluminum beverage bottle, Exal partners with brands to create premium, custom aluminum containers that stand out and can be produced in flexible run sizes.
We’d love to tell you more. If you have questions, need more information or want to see what we can do for your brand,
contact us at the email address below:
www.exal.com