Embed Size (px)
Citation preview
INITIATING COVERAGE 17 MAR 2015
Suzlon Energy BUY
Wind in its sails, againHaving faced multiple crises over FY09-14, we believe Suzlon is on the cusp of a turnaround. It has aggressively reduced debt from its heavily levered balance sheet by divesting its German subsidiary Senvion (for Euro 1bn) and via a preferential issue of Rs 18bn to Dilip Shanghvi and Associates (DSA). These developments will enable the company to not only reduce debt but also provide much needed working capital to ramp up business in the rapidly growing Indian wind energy market.
With the NDA government’s ambitious plans for renewable energy, we expect favourable policy environment for wind power to continue. Aided by significant operating and financial leverage, we expect Suzlon’s earnings to grow manifold over the next few years. Suzlon is among a handful of listed companies levered to India’s fast growing renewables industry. We initiate coverage with a BUY and TP of Rs 34/sh based on 14x FY17E EV/ EBITDA.
Suzlon will utilise Rs 90bn (raised via Senvion sale and DSA equity infusion) to cut its debt by Rs 60bn to Rs 77bn and also utilize the remaining amount (Rs 22bn, ex capex) to fund its working capital requirements. With working capital funds available, we believe the company can easily ramp up volumes in the rapidly evolving Indian wind power market.
Our confidence stems from primary customer feedback which suggests that Suzlon has the best overall product offering and it lost market share
primarily owing to funding constraints. The Indian wind energy market is also set for a big leap as accelerated depreciation (AD) and generation based incentives (GBI) have been re-introduced. The NDA government has ambitious plans of adding 38GW over FY15-22.
As 25% of Suzlon’s expenses are fixed in nature (FY16E), we expect a quantum jump in profits as volumes ramp up. We expect Suzlon to achieve PBT break-even in FY16E (1,250MW of sales, 150% increase over FY15E), which implies 35% market share. This looks plausible, given the company’s order book of 1,147MW. With a capacity of 3.6GW, Suzlon can further ramp up volumes without incurring significant capex.
We initiate coverage on Suzlon with a TP of 34/sh, based on 14x FY17E EV/EBITDA. Our assigned multiple is at a premium to European WTG companies which we believe is justified given better growth prospects of the Indian market and Suzlon’s abnormally depressed earnings. BUY
FINANCIAL SUMMARY* (Rs mn) FY14 FY15E FY16E FY17E FY18E Net Sales 204,029 196,545 97,517 134,959 162,710 Operating EBITDA 1,147 7,450 11,007 19,208 24,240 APAT (28,051) (22,905) 16 6,257 9,914 Diluted EPS (Rs) (4.6) (3.9) 0.0 1.0 1.7 P/E (x) NM NM NM 24.9 15.7 EV / EBITDA (x) 183.8 32.8 20.5 11.7 8.9 RoCE (%) (0.9) (0.9) 8.5 31.2 34.0
Source : Company, HDFC sec Inst Research *FY16/17/18 estimates exclude Senvion
INDUSTRY CAPITAL GOODS CMP (As on 16 Mar 15) Rs 26 Target Price Rs 34 Nifty 8,633
Sensex 28,438
KEY STOCK DATA
Bloomberg SUEL IN
No. of Shares (mn) 3,539
MCap (Rs bn) / ($ mn) 92/1,464
6m avg traded value (Rs mn) 886
STOCK PERFORMANCE (%)
52 Week high / low Rs 37/9
3M 6M 12M
Absolute (%) 101.6 18.5 160.0
Relative (%) 95.4 11.1 129.6
SHAREHOLDING PATTERN (%)
Promoters 29.75
FIs & Local MFs 23.04
FIIs 13.05
Public & Others 34.16
Source : BSE
Abhinav Sharma [email protected] +91-22-6171-7331 Raahil Shah [email protected] +91-22-6171-7327
HDFC securities Institutional Research is also available on Bloomberg HSLB <GO>
SUZLON ENERGY : INITIATING COVERAGE
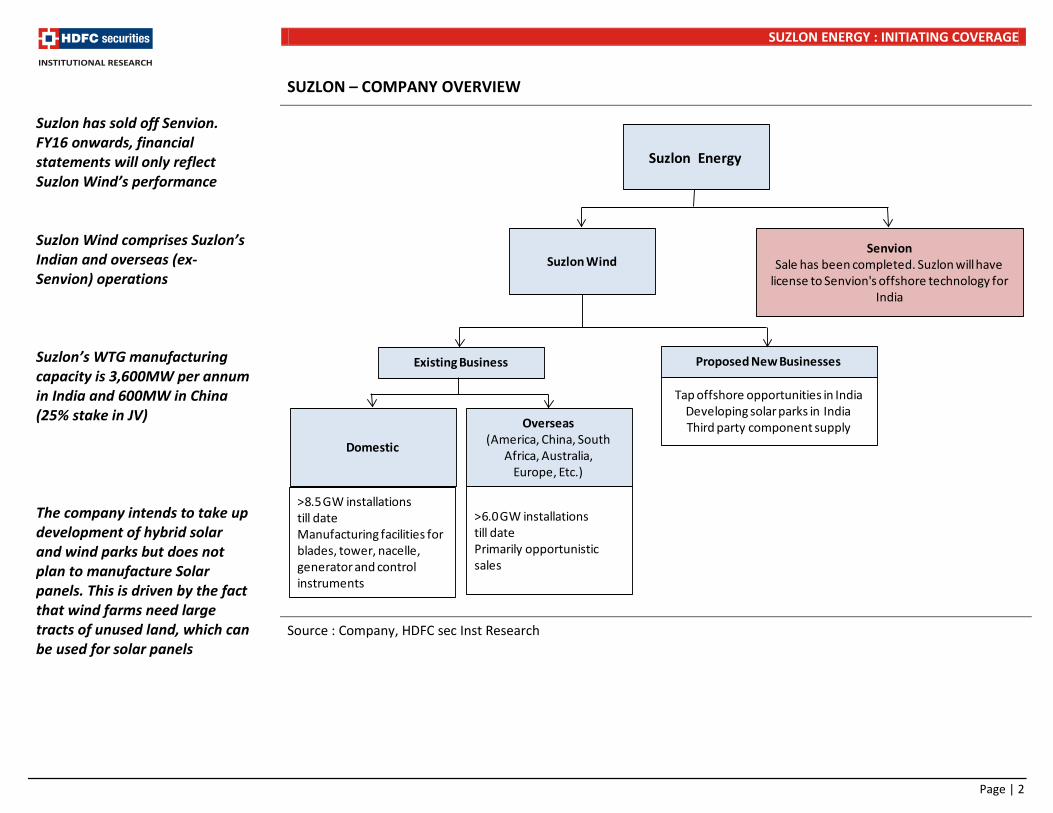
SUZLON – COMPANY OVERVIEW
Source : Company, HDFC sec Inst Research
Suzlon has sold off Senvion. FY16 onwards, financial statements will only reflect Suzlon Wind’s performance Suzlon Wind comprises Suzlon’s Indian and overseas (ex-Senvion) operations Suzlon’s WTG manufacturing capacity is 3,600MW per annum in India and 600MW in China (25% stake in JV) The company intends to take up development of hybrid solar and wind parks but does not plan to manufacture Solar panels. This is driven by the fact that wind farms need large tracts of unused land, which can be used for solar panels
Suzlon Wind
Existing Business Proposed New Businesses
Tap offshore opportunities in IndiaDeveloping solar parks in IndiaThird party component supply
Domestic
>8.5 GW installations till dateManufacturing facilities for blades, tower, nacelle, generator and control instruments
Overseas (America, China, South
Africa, Australia, Europe, Etc.)
>6.0 GW installations till datePrimarily opportunistic sales
SenvionSale has been completed. Suzlon will have
license to Senvion's offshore technology for India
Suzlon Energy
Page | 2
SUZLON ENERGY : INITIATING COVERAGE
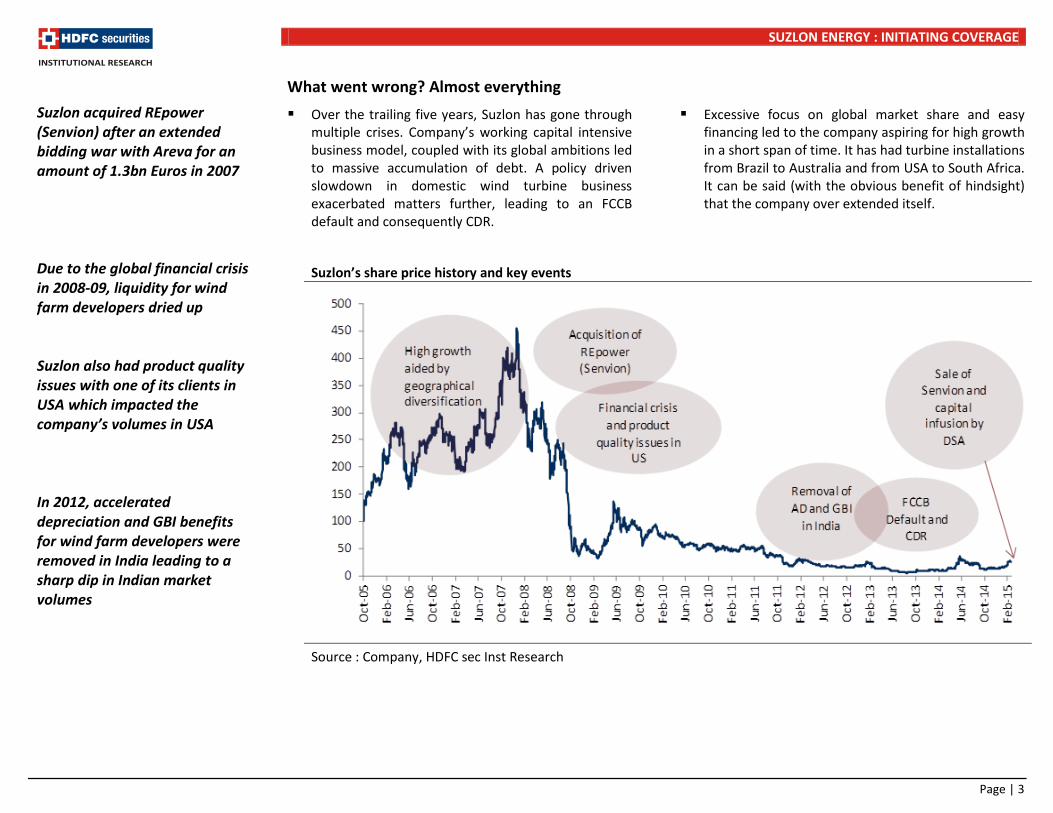
What went wrong? Almost everything Over the trailing five years, Suzlon has gone through
multiple crises. Company’s working capital intensive business model, coupled with its global ambitions led to massive accumulation of debt. A policy driven slowdown in domestic wind turbine business exacerbated matters further, leading to an FCCB default and consequently CDR.
Excessive focus on global market share and easy financing led to the company aspiring for high growth in a short span of time. It has had turbine installations from Brazil to Australia and from USA to South Africa. It can be said (with the obvious benefit of hindsight) that the company over extended itself.
Suzlon’s share price history and key events
Source : Company, HDFC sec Inst Research
Suzlon acquired REpower (Senvion) after an extended bidding war with Areva for an amount of 1.3bn Euros in 2007 Due to the global financial crisis in 2008-09, liquidity for wind farm developers dried up Suzlon also had product quality issues with one of its clients in USA which impacted the company’s volumes in USA In 2012, accelerated depreciation and GBI benefits for wind farm developers were removed in India leading to a sharp dip in Indian market volumes
Page | 3
SUZLON ENERGY : INITIATING COVERAGE
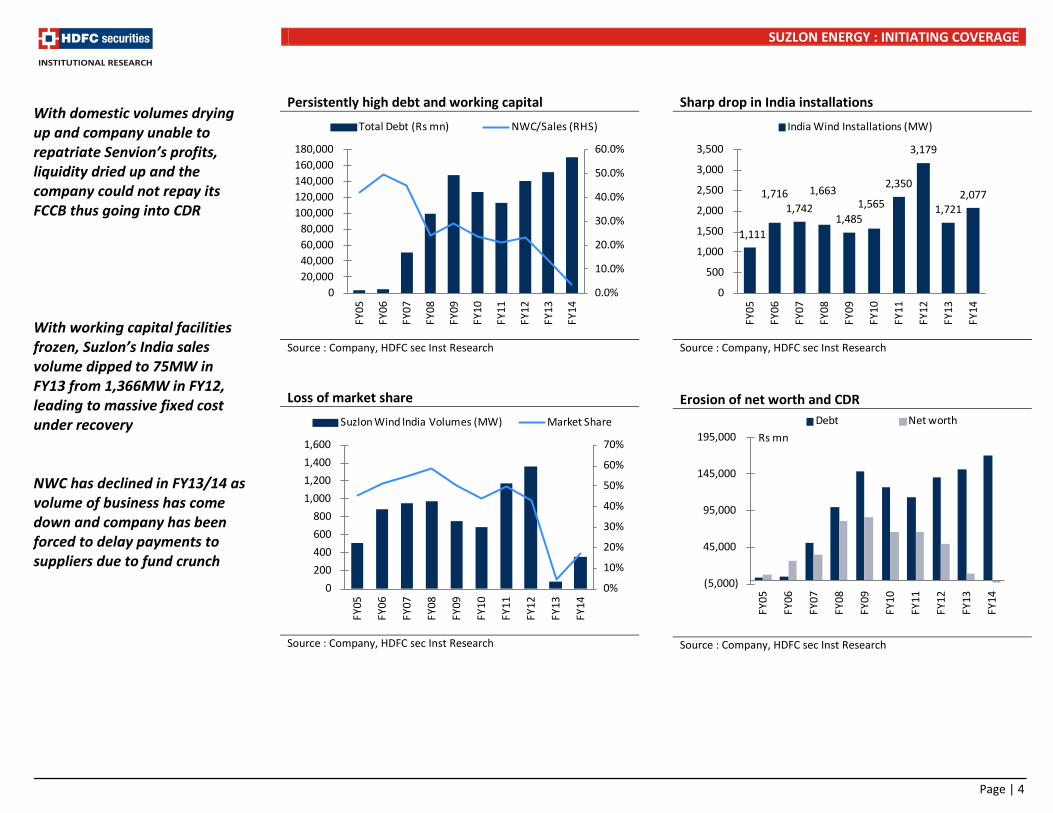
Persistently high debt and working capital
Source : Company, HDFC sec Inst Research
Loss of market share
Source : Company, HDFC sec Inst Research
Sharp drop in India installations
Source : Company, HDFC sec Inst Research Erosion of net worth and CDR
Source : Company, HDFC sec Inst Research
With domestic volumes drying up and company unable to repatriate Senvion’s profits, liquidity dried up and the company could not repay its FCCB thus going into CDR With working capital facilities frozen, Suzlon’s India sales volume dipped to 75MW in FY13 from 1,366MW in FY12, leading to massive fixed cost under recovery NWC has declined in FY13/14 as volume of business has come down and company has been forced to delay payments to suppliers due to fund crunch
1,111
1,716 1,742
1,663
1,485 1,565
2,350
3,179
1,721 2,077
0
500
1,000
1,500
2,000
2,500
3,000
3,500
FY05
FY06
FY07
FY08
FY09
FY10
FY11
FY12
FY13
FY14
India Wind Installations (MW)
0.0%
10.0%
20.0%
30.0%
40.0%
50.0%
60.0%
0 20,000 40,000 60,000 80,000
100,000 120,000 140,000 160,000 180,000
FY05
FY06
FY07
FY08
FY09
FY10
FY11
FY12
FY13
FY14
Total Debt (Rs mn) NWC/Sales (RHS)
0%
10%
20%
30%
40%
50%
60%
70%
0 200 400 600 800
1,000 1,200 1,400 1,600
FY05
FY06
FY07
FY08
FY09
FY10
FY11
FY12
FY13
FY14
Suzlon Wind India Volumes (MW) Market Share
(5,000)
45,000
95,000
145,000
195,000
FY05
FY06
FY07
FY08
FY09
FY10
FY11
FY12
FY13
FY14
Debt Net worthRs mn
Page | 4
SUZLON ENERGY : INITIATING COVERAGE
However, there is light at the end of the tunnel Sale of Senvion and equity infusion by DSA to reduce balance sheet stress and provide liquidity
Suzlon has sold its German subsidiary Senvion and will use the proceeds (Rs 72bn / Euro 1bn) to de-leverage its stretched balance sheet.
DSA (Dilip Shanghvi and Associates) will infuse Rs 18bn into Suzlon Energy through preferential allotment of 1bn shares at a price of Rs 18/sh. Post the deal (on a diluted basis assuming FCCBs convert fully), DSA will hold 16.7% in Suzlon while the Tanti family will end up owning 17.5%.
These two developments will lead to a reduction of rupee debt by Rs 60bn (from Rs 89bn now) and will also provide much needed working capital (Rs 22bn, ex of capex requirements) to the business. DSA can provide further non-fund based working capital support to Suzlon, if required.
Of the remaining debt, CE Bonds of $647mn (Rs 41bn) due in FY18 are likely to be postponed to FY23. There are no term debt repayments in FY16/17/18, which will allow the company to focus on operations.
DEBT AND WORKING CAPITAL POST RESTRUCTURING
Rs bn Pre deal Post deal
Domestic debt 89 29 Effective interest rate is 11%
Credit enhanced bonds (US$ mn) 647 647
(Rs 40.8bn) Effective interest rate is 6.3%
Other foreign debt (US$ mn) 115 115
(Rs 7.2bn) Total 137 77
FCCBs (US$ mn)# 484 484 (Rs 30.5bn)
Quasi equity* as conversion price is Rs 15.46
Working capital funds (Rs bn) - 22 Source : Company, HDFC sec Inst Research *Apart from US$ 28.8mn Apr-16 FCCBs which convert at Rs 54/sh #As on 9MFY15. As on date FCCBs outstanding are US$ 401mn.
Corporate restructuring will allow Suzlon to focus on its business, something which was missing in FY13-15 DSA has entered as a financial investor and has a vote pooling arrangement with the Tanti family Deleveraging of balance sheet enables Suzlon to gain access to vital working capital funds helping it to ramp up volumes in the rapidly evolving and fast growing Indian market The company intends to focus solely on the Indian market with no global ambitions as of now
Page | 5
SUZLON ENERGY : INITIATING COVERAGE
Indian central government’s focus on renewables
The NDA government has been making all the right noises with regard to renewable energy. Both Solar and Wind power are high up on the agenda. We expect faster execution of projects and removal of policy bottlenecks.
Very ambitious targets have been set for both wind and solar power. The government intends to help setting up 100GW of solar and 60GW of wind energy by the year 2022 vs. an installed base of 3GW and 22GW respectively as of now.
Key incentives for wind power: Accelerated depreciation (AD) and Generation Based Incentives (GBI) have been restored by the government. Restoration of AD will lead to a revival in the small investor market - a mainstay of Suzlon in the previous years. In addition, many state governments have provided attractive feed-in tariffs for wind energy to make these projects attractive for investors. Please see annexure 1 for details of these incentives.
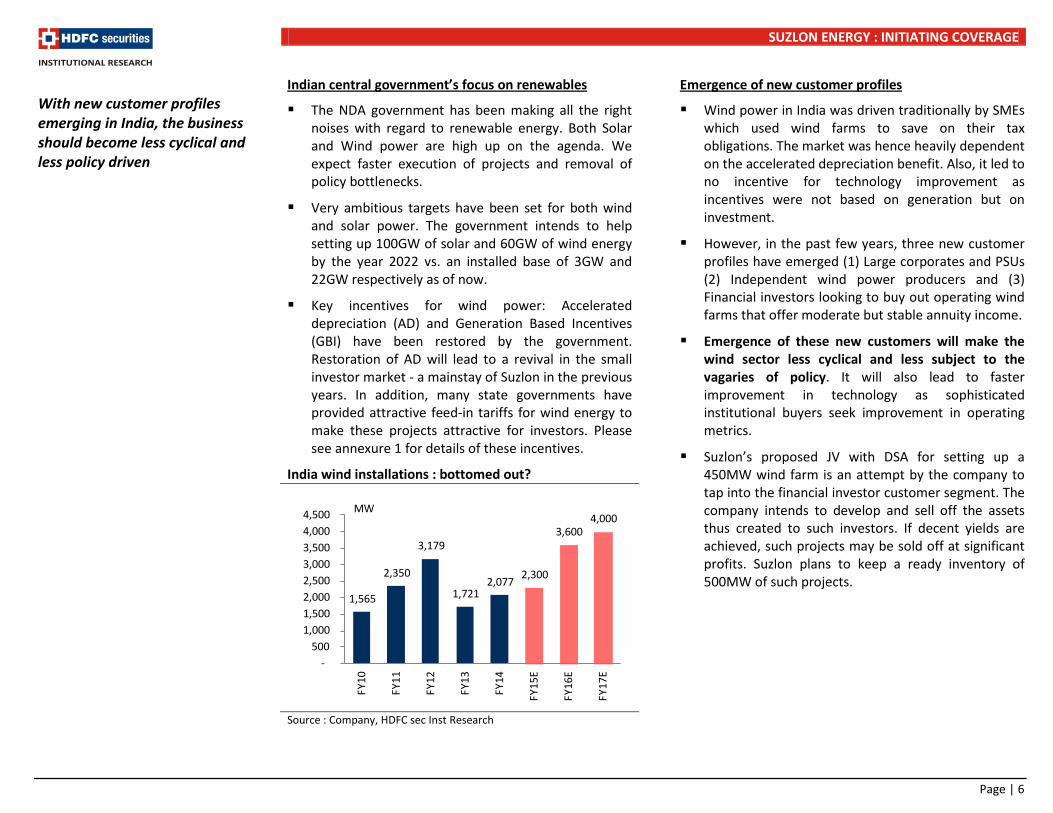
India wind installations : bottomed out?
Source : Company, HDFC sec Inst Research
Emergence of new customer profiles
Wind power in India was driven traditionally by SMEs which used wind farms to save on their tax obligations. The market was hence heavily dependent on the accelerated depreciation benefit. Also, it led to no incentive for technology improvement as incentives were not based on generation but on investment.
However, in the past few years, three new customer profiles have emerged (1) Large corporates and PSUs (2) Independent wind power producers and (3) Financial investors looking to buy out operating wind farms that offer moderate but stable annuity income.
Emergence of these new customers will make the wind sector less cyclical and less subject to the vagaries of policy. It will also lead to faster improvement in technology as sophisticated institutional buyers seek improvement in operating metrics.
Suzlon’s proposed JV with DSA for setting up a 450MW wind farm is an attempt by the company to tap into the financial investor customer segment. The company intends to develop and sell off the assets thus created to such investors. If decent yields are achieved, such projects may be sold off at significant profits. Suzlon plans to keep a ready inventory of 500MW of such projects.
1,565
2,350
3,179
1,721 2,077 2,300
3,600 4,000
-500
1,000 1,500 2,000 2,500 3,000 3,500 4,000 4,500
FY10
FY11
FY12
FY13
FY14
FY15
E
FY16
E
FY17
E
MW
With new customer profiles emerging in India, the business should become less cyclical and less policy driven
Page | 6
SUZLON ENERGY : INITIATING COVERAGE
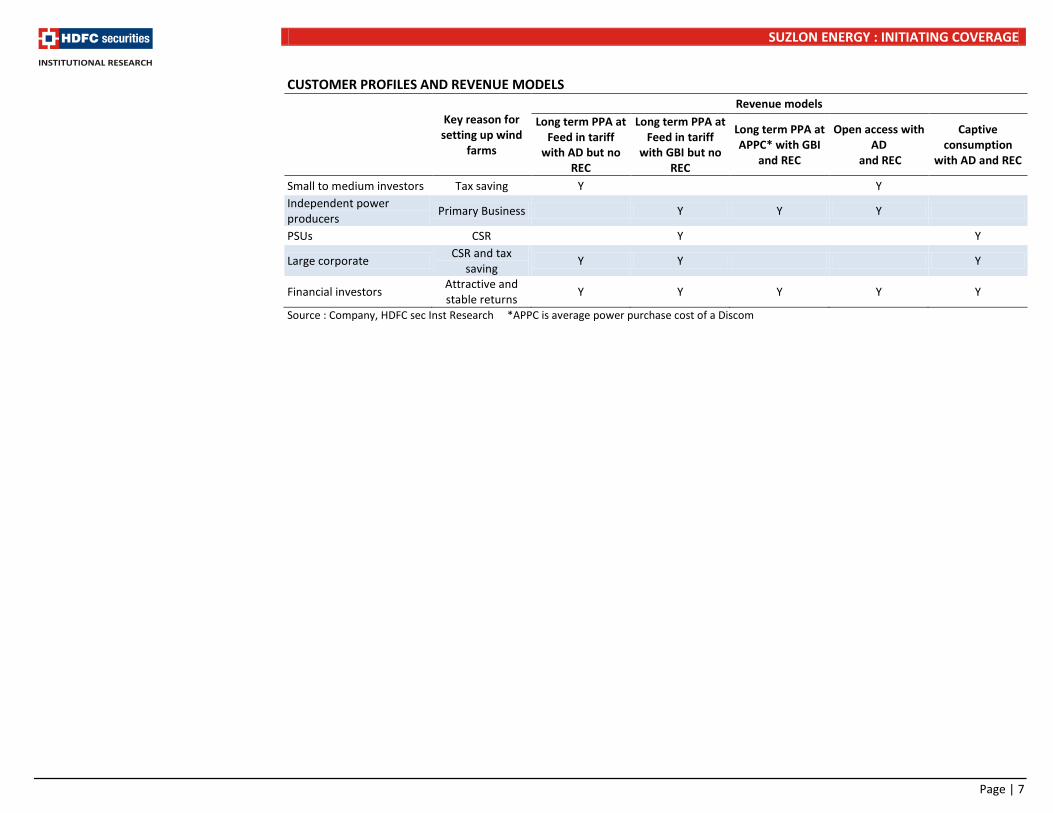
CUSTOMER PROFILES AND REVENUE MODELS
Key reason for setting up wind
farms
Revenue models Long term PPA at
Feed in tariff with AD but no
REC
Long term PPA at Feed in tariff
with GBI but no REC
Long term PPA at APPC* with GBI
and REC
Open access with AD
and REC
Captive consumption
with AD and REC
Small to medium investors Tax saving Y Y Independent power producers Primary Business Y Y Y
PSUs CSR Y Y
Large corporate CSR and tax saving Y Y Y
Financial investors Attractive and stable returns Y Y Y Y Y
Source : Company, HDFC sec Inst Research *APPC is average power purchase cost of a Discom
Page | 7
SUZLON ENERGY : INITIATING COVERAGE
Suzlon’s competitive positioning remains strong Wind site is the most important criterion for choosing
a supplier, especially for an investor. Suzlon, by virtue of being in the industry for the last 20 years, has one of the best wind site inventories available according to customers.
Suzlon has very strong presence in the small investor segment. The company virtually pioneered the concept of total solutions, wherein Suzlon takes care of the whole process of setting up and operating a wind farm. Suzlon does everything from scouting the wind site to liaison with the SEBs. The developer only provides funding.
Suzlon’s equipment is at par with competitors in terms of performance and technology. However,
owing to the funds crunch faced by Suzlon, their after sales service suffered.
With increased liquidity, we believe Suzlon will be able to regain market share. Traditionally, Suzlon has been the best supplier for investors as it had the best land sites and also offered lax payment terms.
Major competitors include Gamesa, Regen, Windworld (Enercon), Inox Wind, GE and Siemens. MNCs like GE and Siemens only supply equipment and do not offer EPC. Thus, they are at a disadvantage with respect to Suzlon, especially when it comes to servicing the retail segment.
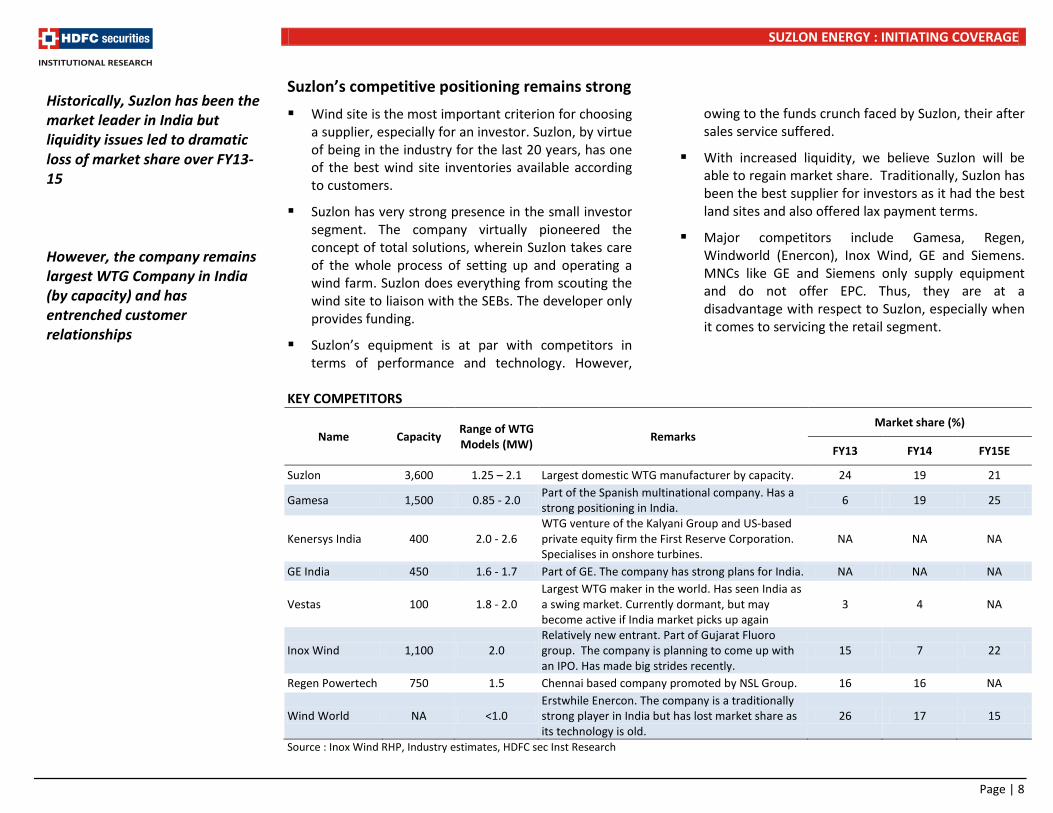
KEY COMPETITORS
Name Capacity Range of WTG Models (MW) Remarks
Market share (%)
FY13 FY14 FY15E
Suzlon 3,600 1.25 – 2.1 Largest domestic WTG manufacturer by capacity. 24 19 21
Gamesa 1,500 0.85 - 2.0 Part of the Spanish multinational company. Has a strong positioning in India. 6 19 25
Kenersys India 400 2.0 - 2.6 WTG venture of the Kalyani Group and US-based private equity firm the First Reserve Corporation. Specialises in onshore turbines.
NA NA NA
GE India 450 1.6 - 1.7 Part of GE. The company has strong plans for India. NA NA NA
Vestas 100 1.8 - 2.0 Largest WTG maker in the world. Has seen India as a swing market. Currently dormant, but may become active if India market picks up again
3 4 NA
Inox Wind 1,100 2.0 Relatively new entrant. Part of Gujarat Fluoro group. The company is planning to come up with an IPO. Has made big strides recently.
15 7 22
Regen Powertech 750 1.5 Chennai based company promoted by NSL Group. 16 16 NA
Wind World NA <1.0 Erstwhile Enercon. The company is a traditionally strong player in India but has lost market share as its technology is old.
26 17 15
Source : Inox Wind RHP, Industry estimates, HDFC sec Inst Research
Historically, Suzlon has been the market leader in India but liquidity issues led to dramatic loss of market share over FY13-15 However, the company remains largest WTG Company in India (by capacity) and has entrenched customer relationships
Page | 8
SUZLON ENERGY : INITIATING COVERAGE
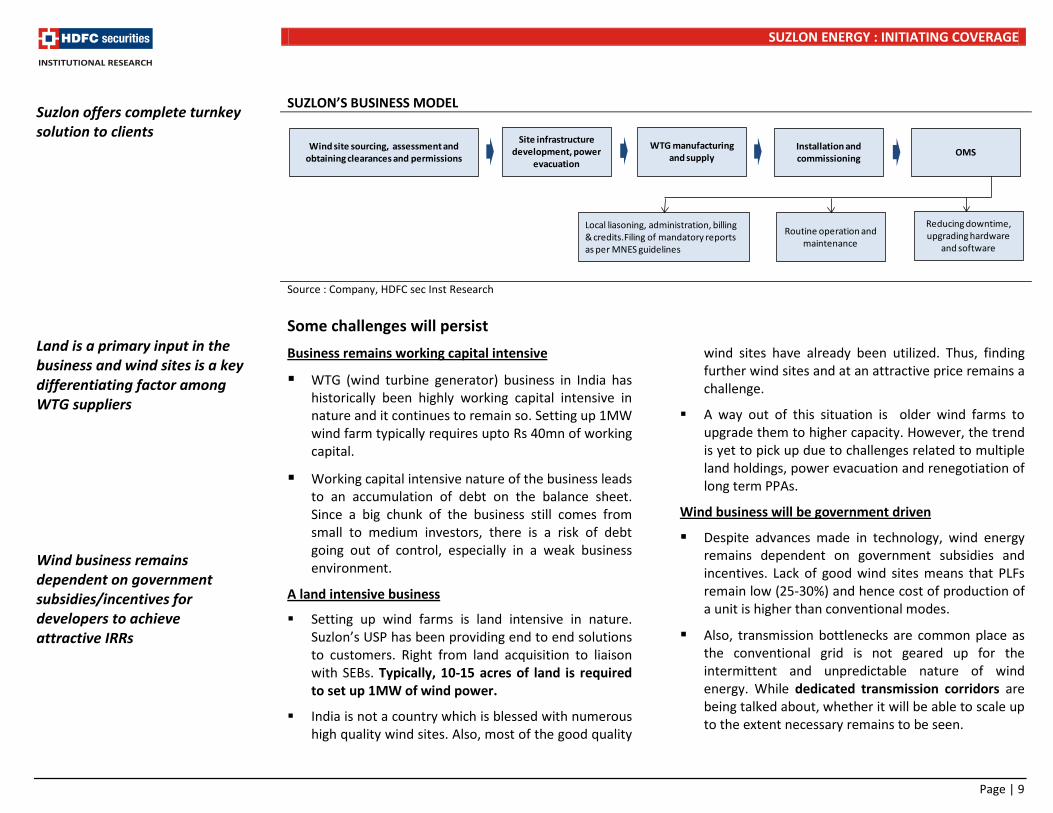
SUZLON’S BUSINESS MODEL
Source : Company, HDFC sec Inst Research Some challenges will persist Business remains working capital intensive
WTG (wind turbine generator) business in India has historically been highly working capital intensive in nature and it continues to remain so. Setting up 1MW wind farm typically requires upto Rs 40mn of working capital.
Working capital intensive nature of the business leads to an accumulation of debt on the balance sheet. Since a big chunk of the business still comes from small to medium investors, there is a risk of debt going out of control, especially in a weak business environment.
A land intensive business
Setting up wind farms is land intensive in nature. Suzlon’s USP has been providing end to end solutions to customers. Right from land acquisition to liaison with SEBs. Typically, 10-15 acres of land is required to set up 1MW of wind power.
India is not a country which is blessed with numerous high quality wind sites. Also, most of the good quality
wind sites have already been utilized. Thus, finding further wind sites and at an attractive price remains a challenge.
A way out of this situation is older wind farms to upgrade them to higher capacity. However, the trend is yet to pick up due to challenges related to multiple land holdings, power evacuation and renegotiation of long term PPAs.
Wind business will be government driven
Despite advances made in technology, wind energy remains dependent on government subsidies and incentives. Lack of good wind sites means that PLFs remain low (25-30%) and hence cost of production of a unit is higher than conventional modes.
Also, transmission bottlenecks are common place as the conventional grid is not geared up for the intermittent and unpredictable nature of wind energy. While dedicated transmission corridors are being talked about, whether it will be able to scale up to the extent necessary remains to be seen.
Suzlon offers complete turnkey solution to clients Land is a primary input in the business and wind sites is a key differentiating factor among WTG suppliers Wind business remains dependent on government subsidies/incentives for developers to achieve attractive IRRs
Wind site sourcing, assessment and obtaining clearances and permissions
WTG manufacturing and supply
Site infrastructure development, power
evacuation
Installation and commissioning OMS
Routine operation and maintenance
Local liasoning, administration, billing & credits.Filing of mandatory reports as per MNES guidelines
Reducing downtime,upgrading hardware
and software
Page | 9
SUZLON ENERGY : INITIATING COVERAGE
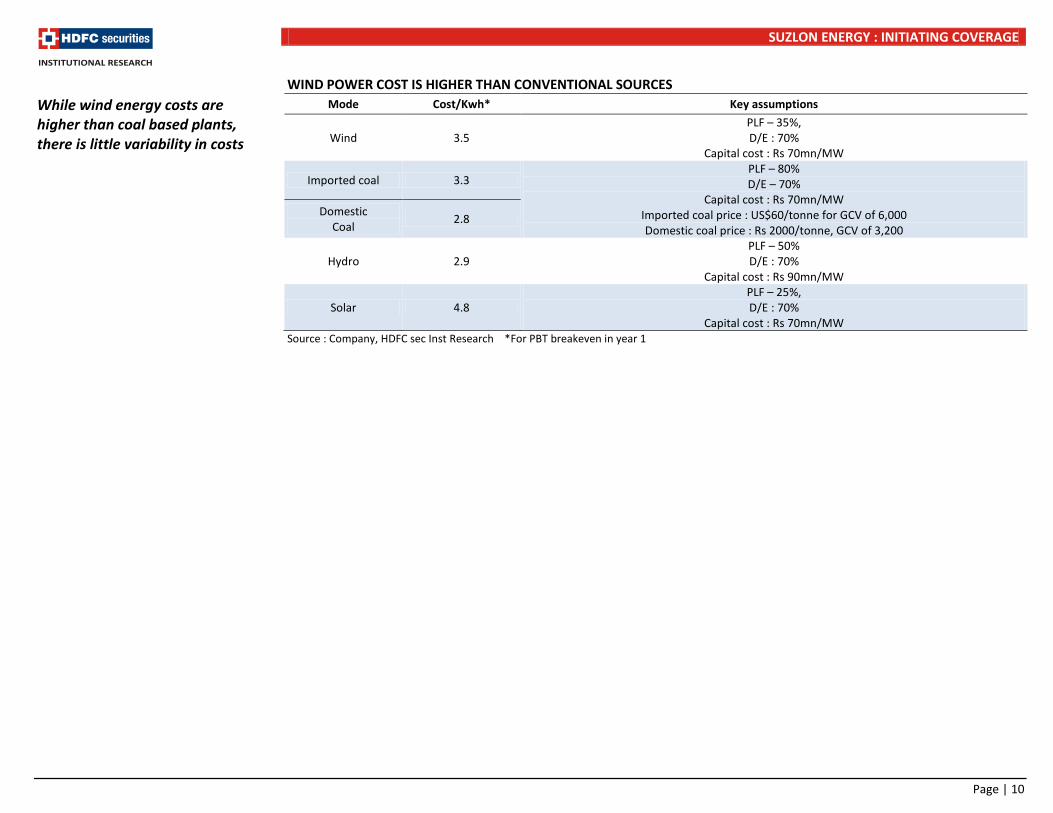
WIND POWER COST IS HIGHER THAN CONVENTIONAL SOURCESMode Cost/Kwh* Key assumptions
Wind 3.5 PLF – 35%, D/E : 70%
Capital cost : Rs 70mn/MW
Imported coal 3.3 PLF – 80% D/E – 70%
Capital cost : Rs 70mn/MW Imported coal price : US$60/tonne for GCV of 6,000 Domestic coal price : Rs 2000/tonne, GCV of 3,200
Domestic Coal 2.8
Hydro 2.9 PLF – 50% D/E : 70%
Capital cost : Rs 90mn/MW
Solar 4.8 PLF – 25%, D/E : 70%
Capital cost : Rs 70mn/MW Source : Company, HDFC sec Inst Research *For PBT breakeven in year 1
While wind energy costs are higher than coal based plants, there is little variability in costs
Page | 10
SUZLON ENERGY : INITIATING COVERAGE
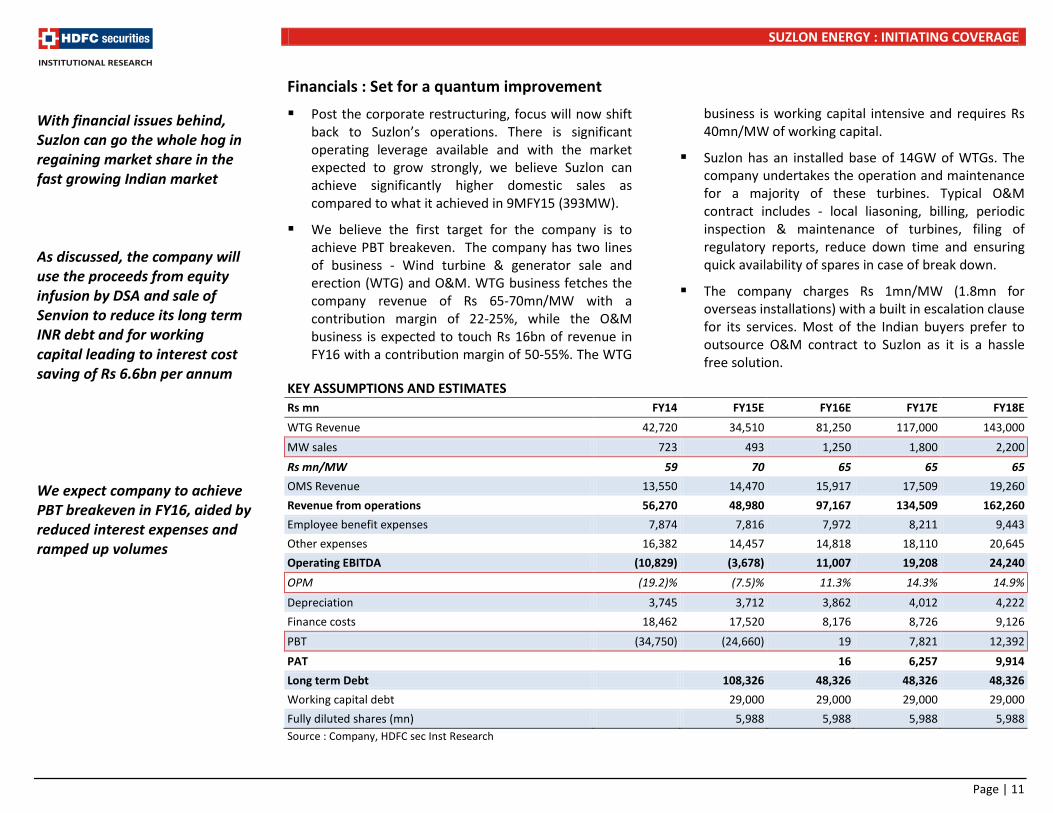
Financials : Set for a quantum improvement Post the corporate restructuring, focus will now shift
back to Suzlon’s operations. There is significant operating leverage available and with the market expected to grow strongly, we believe Suzlon can achieve significantly higher domestic sales as compared to what it achieved in 9MFY15 (393MW).
We believe the first target for the company is to achieve PBT breakeven. The company has two lines of business - Wind turbine & generator sale and erection (WTG) and O&M. WTG business fetches the company revenue of Rs 65-70mn/MW with a contribution margin of 22-25%, while the O&M business is expected to touch Rs 16bn of revenue in FY16 with a contribution margin of 50-55%. The WTG
business is working capital intensive and requires Rs 40mn/MW of working capital.
Suzlon has an installed base of 14GW of WTGs. The company undertakes the operation and maintenance for a majority of these turbines. Typical O&M contract includes - local liasoning, billing, periodic inspection & maintenance of turbines, filing of regulatory reports, reduce down time and ensuring quick availability of spares in case of break down.
The company charges Rs 1mn/MW (1.8mn for overseas installations) with a built in escalation clause for its services. Most of the Indian buyers prefer to outsource O&M contract to Suzlon as it is a hassle free solution.
KEY ASSUMPTIONS AND ESTIMATES Rs mn FY14 FY15E FY16E FY17E FY18E WTG Revenue 42,720 34,510 81,250 117,000 143,000 MW sales 723 493 1,250 1,800 2,200 Rs mn/MW 59 70 65 65 65 OMS Revenue 13,550 14,470 15,917 17,509 19,260 Revenue from operations 56,270 48,980 97,167 134,509 162,260 Employee benefit expenses 7,874 7,816 7,972 8,211 9,443 Other expenses 16,382 14,457 14,818 18,110 20,645 Operating EBITDA (10,829) (3,678) 11,007 19,208 24,240 OPM (19.2)% (7.5)% 11.3% 14.3% 14.9% Depreciation 3,745 3,712 3,862 4,012 4,222 Finance costs 18,462 17,520 8,176 8,726 9,126 PBT (34,750) (24,660) 19 7,821 12,392 PAT 16 6,257 9,914 Long term Debt 108,326 48,326 48,326 48,326 Working capital debt 29,000 29,000 29,000 29,000 Fully diluted shares (mn) 5,988 5,988 5,988 5,988 Source : Company, HDFC sec Inst Research
With financial issues behind, Suzlon can go the whole hog in regaining market share in the fast growing Indian market As discussed, the company will use the proceeds from equity infusion by DSA and sale of Senvion to reduce its long term INR debt and for working capital leading to interest cost saving of Rs 6.6bn per annum We expect company to achieve PBT breakeven in FY16, aided by reduced interest expenses and ramped up volumes
Page | 11
SUZLON ENERGY : INITIATING COVERAGE
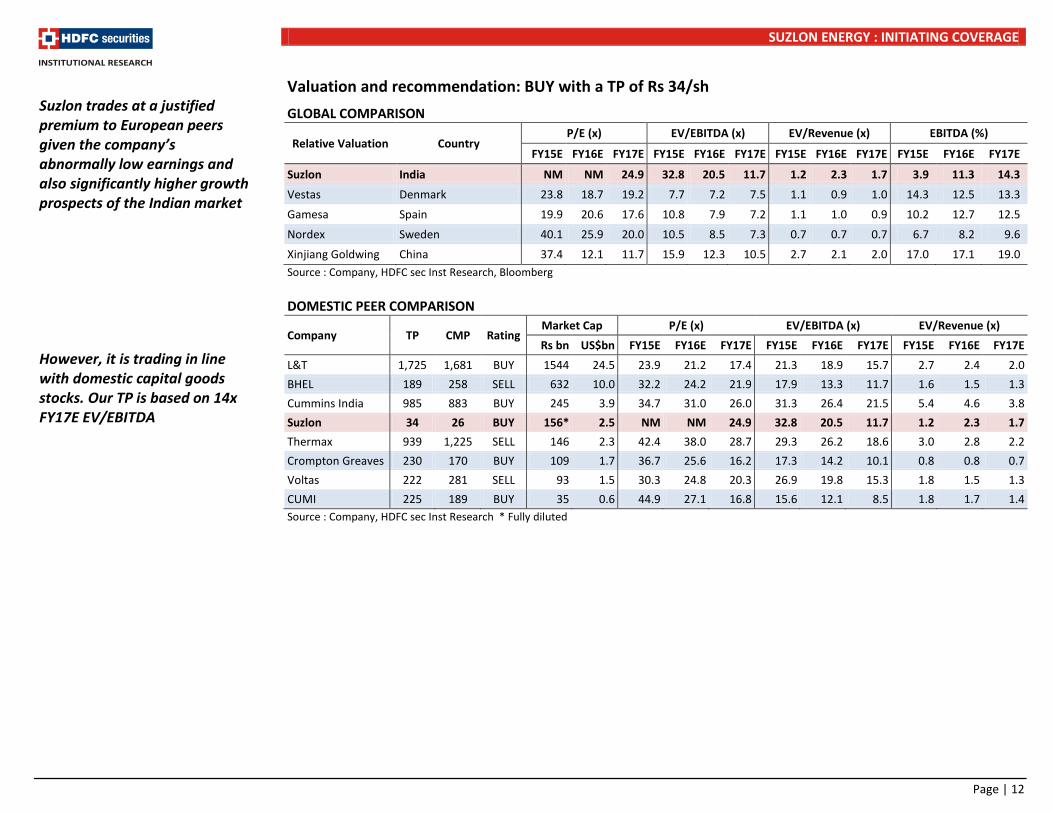
Valuation and recommendation: BUY with a TP of Rs 34/sh GLOBAL COMPARISON
Relative Valuation Country P/E (x) EV/EBITDA (x) EV/Revenue (x) EBITDA (%)
FY15E FY16E FY17E FY15E FY16E FY17E FY15E FY16E FY17E FY15E FY16E FY17E
Suzlon India NM NM 24.9 32.8 20.5 11.7 1.2 2.3 1.7 3.9 11.3 14.3
Vestas Denmark 23.8 18.7 19.2 7.7 7.2 7.5 1.1 0.9 1.0 14.3 12.5 13.3
Gamesa Spain 19.9 20.6 17.6 10.8 7.9 7.2 1.1 1.0 0.9 10.2 12.7 12.5
Nordex Sweden 40.1 25.9 20.0 10.5 8.5 7.3 0.7 0.7 0.7 6.7 8.2 9.6
Xinjiang Goldwing China 37.4 12.1 11.7 15.9 12.3 10.5 2.7 2.1 2.0 17.0 17.1 19.0 Source : Company, HDFC sec Inst Research, Bloomberg DOMESTIC PEER COMPARISON
Company TP CMP Rating Market Cap P/E (x) EV/EBITDA (x) EV/Revenue (x) Rs bn US$bn FY15E FY16E FY17E FY15E FY16E FY17E FY15E FY16E FY17E
L&T 1,725 1,681 BUY 1544 24.5 23.9 21.2 17.4 21.3 18.9 15.7 2.7 2.4 2.0 BHEL 189 258 SELL 632 10.0 32.2 24.2 21.9 17.9 13.3 11.7 1.6 1.5 1.3 Cummins India 985 883 BUY 245 3.9 34.7 31.0 26.0 31.3 26.4 21.5 5.4 4.6 3.8 Suzlon 34 26 BUY 156* 2.5 NM NM 24.9 32.8 20.5 11.7 1.2 2.3 1.7 Thermax 939 1,225 SELL 146 2.3 42.4 38.0 28.7 29.3 26.2 18.6 3.0 2.8 2.2 Crompton Greaves 230 170 BUY 109 1.7 36.7 25.6 16.2 17.3 14.2 10.1 0.8 0.8 0.7 Voltas 222 281 SELL 93 1.5 30.3 24.8 20.3 26.9 19.8 15.3 1.8 1.5 1.3 CUMI 225 189 BUY 35 0.6 44.9 27.1 16.8 15.6 12.1 8.5 1.8 1.7 1.4 Source : Company, HDFC sec Inst Research * Fully diluted
Suzlon trades at a justified premium to European peers given the company’s abnormally low earnings and also significantly higher growth prospects of the Indian market However, it is trading in line with domestic capital goods stocks. Our TP is based on 14x FY17E EV/EBITDA
Page | 12
SUZLON ENERGY : INITIATING COVERAGE
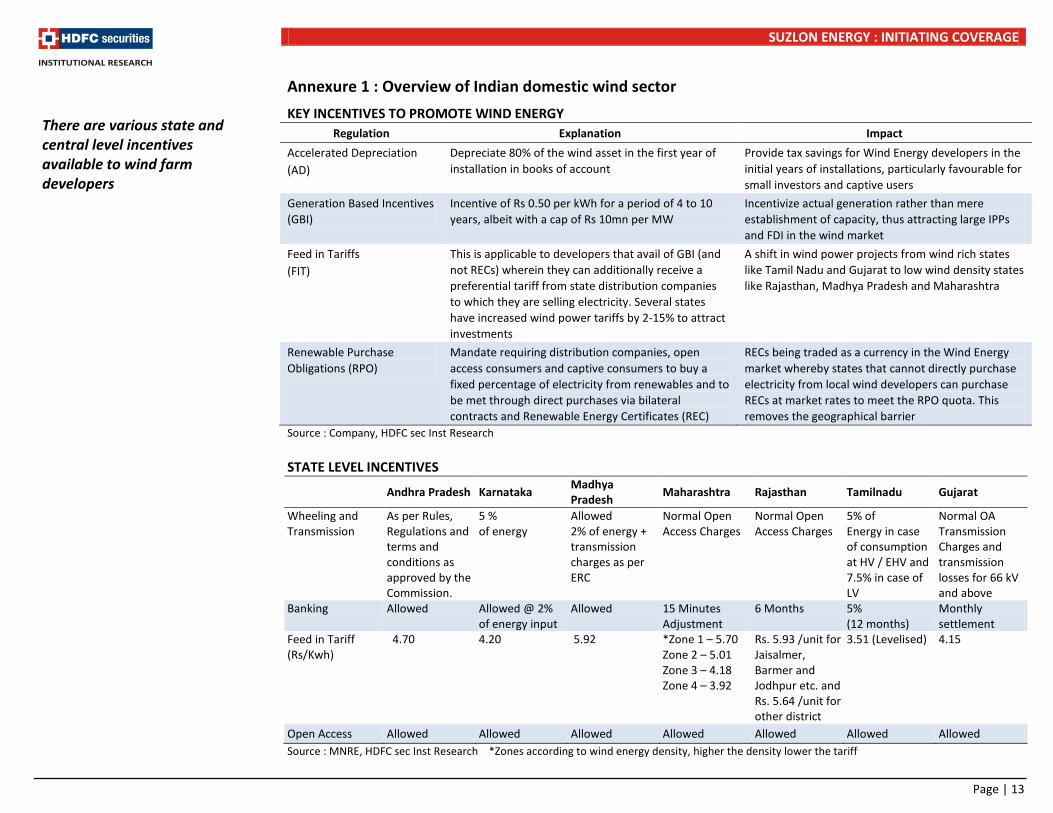
Annexure 1 : Overview of Indian domestic wind sector KEY INCENTIVES TO PROMOTE WIND ENERGY
Regulation Explanation Impact Accelerated Depreciation (AD)
Depreciate 80% of the wind asset in the first year of installation in books of account
Provide tax savings for Wind Energy developers in the initial years of installations, particularly favourable for small investors and captive users
Generation Based Incentives (GBI)
Incentive of Rs 0.50 per kWh for a period of 4 to 10 years, albeit with a cap of Rs 10mn per MW
Incentivize actual generation rather than mere establishment of capacity, thus attracting large IPPs and FDI in the wind market
Feed in Tariffs (FIT)
This is applicable to developers that avail of GBI (and not RECs) wherein they can additionally receive a preferential tariff from state distribution companies to which they are selling electricity. Several states have increased wind power tariffs by 2-15% to attract investments
A shift in wind power projects from wind rich states like Tamil Nadu and Gujarat to low wind density states like Rajasthan, Madhya Pradesh and Maharashtra
Renewable Purchase Obligations (RPO)
Mandate requiring distribution companies, open access consumers and captive consumers to buy a fixed percentage of electricity from renewables and to be met through direct purchases via bilateral contracts and Renewable Energy Certificates (REC)
RECs being traded as a currency in the Wind Energy market whereby states that cannot directly purchase electricity from local wind developers can purchase RECs at market rates to meet the RPO quota. This removes the geographical barrier
Source : Company, HDFC sec Inst Research STATE LEVEL INCENTIVES
Andhra Pradesh Karnataka Madhya Pradesh Maharashtra Rajasthan Tamilnadu Gujarat
Wheeling and Transmission
As per Rules, Regulations and terms and conditions as approved by the Commission.
5 % of energy
Allowed 2% of energy + transmission charges as per ERC
Normal Open Access Charges
Normal Open Access Charges
5% of Energy in case of consumption at HV / EHV and 7.5% in case of LV
Normal OA Transmission Charges and transmission losses for 66 kV and above
Banking Allowed Allowed @ 2% of energy input
Allowed 15 Minutes Adjustment
6 Months 5% (12 months)
Monthly settlement
Feed in Tariff (Rs/Kwh)
4.70
4.20 5.92 *Zone 1 – 5.70 Zone 2 – 5.01 Zone 3 – 4.18 Zone 4 – 3.92
Rs. 5.93 /unit for Jaisalmer, Barmer and Jodhpur etc. and Rs. 5.64 /unit for other district
3.51 (Levelised) 4.15
Open Access Allowed Allowed Allowed Allowed Allowed Allowed Allowed Source : MNRE, HDFC sec Inst Research *Zones according to wind energy density, higher the density lower the tariff
There are various state and central level incentives available to wind farm developers
Page | 13
SUZLON ENERGY : INITIATING COVERAGE
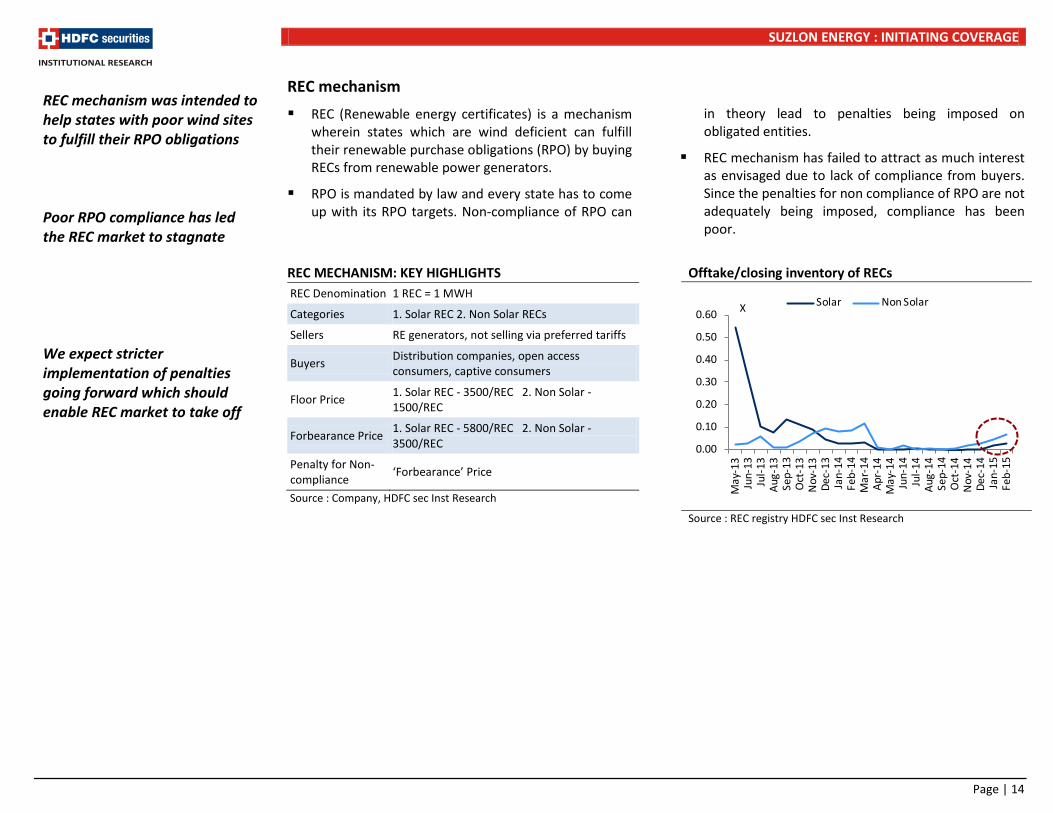
REC mechanism REC (Renewable energy certificates) is a mechanism
wherein states which are wind deficient can fulfill their renewable purchase obligations (RPO) by buying RECs from renewable power generators.
RPO is mandated by law and every state has to come up with its RPO targets. Non-compliance of RPO can
in theory lead to penalties being imposed on obligated entities.
REC mechanism has failed to attract as much interest as envisaged due to lack of compliance from buyers. Since the penalties for non compliance of RPO are not adequately being imposed, compliance has been poor.
REC MECHANISM: KEY HIGHLIGHTS Offtake/closing inventory of RECs REC Denomination 1 REC = 1 MWH
Categories 1. Solar REC 2. Non Solar RECs
Sellers RE generators, not selling via preferred tariffs
Buyers Distribution companies, open access consumers, captive consumers
Floor Price 1. Solar REC - 3500/REC 2. Non Solar - 1500/REC
Forbearance Price 1. Solar REC - 5800/REC 2. Non Solar - 3500/REC
Penalty for Non-compliance ‘Forbearance’ Price
Source : Company, HDFC sec Inst Research
Source : REC registry HDFC sec Inst Research
0.00
0.10
0.20
0.30
0.40
0.50
0.60
May
-13
Jun-
13Ju
l-13
Aug-
13Se
p-13
Oct
-13
Nov
-13
Dec-
13Ja
n-14
Feb-
14M
ar-1
4Ap
r-14
May
-14
Jun-
14Ju
l-14
Aug-
14Se
p-14
Oct
-14
Nov
-14
Dec-
14Ja
n-15
Feb-
15
Solar Non SolarX
REC mechanism was intended to help states with poor wind sites to fulfill their RPO obligations Poor RPO compliance has led the REC market to stagnate We expect stricter implementation of penalties going forward which should enable REC market to take off
Page | 14
SUZLON ENERGY : INITIATING COVERAGE
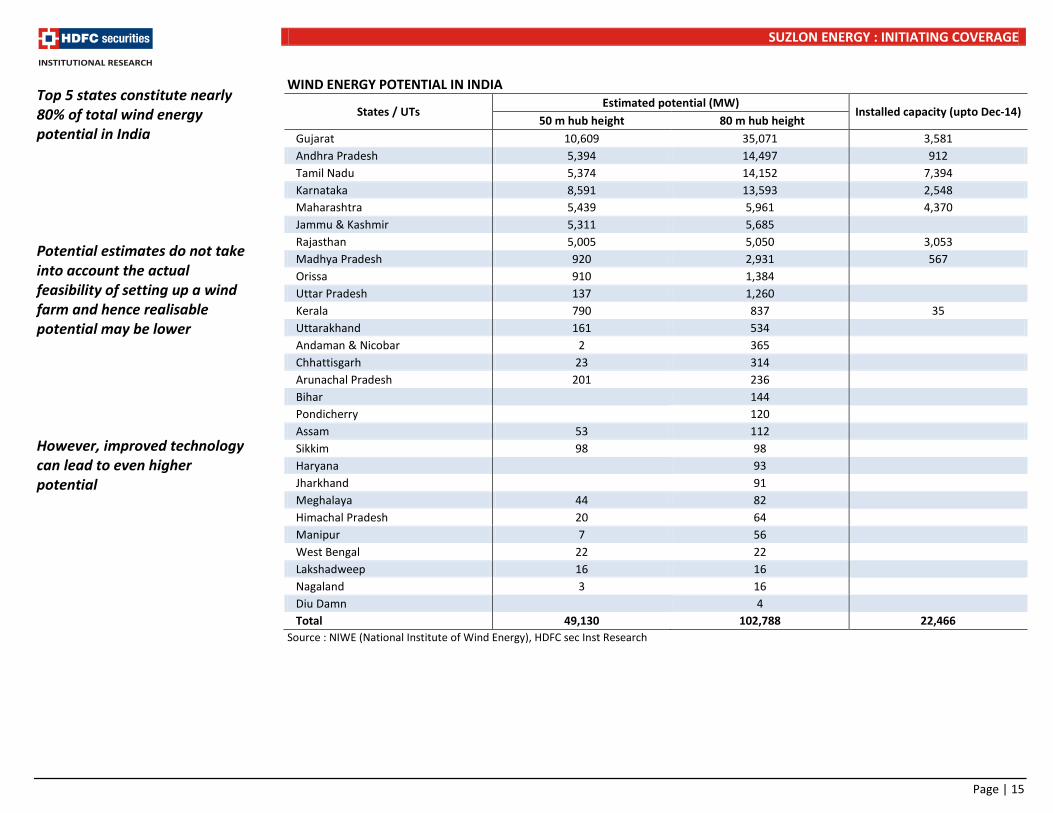
WIND ENERGY POTENTIAL IN INDIA
States / UTs Estimated potential (MW)
Installed capacity (upto Dec-14) 50 m hub height 80 m hub height
Gujarat 10,609 35,071 3,581 Andhra Pradesh 5,394 14,497 912 Tamil Nadu 5,374 14,152 7,394 Karnataka 8,591 13,593 2,548 Maharashtra 5,439 5,961 4,370 Jammu & Kashmir 5,311 5,685 Rajasthan 5,005 5,050 3,053 Madhya Pradesh 920 2,931 567 Orissa 910 1,384 Uttar Pradesh 137 1,260 Kerala 790 837 35 Uttarakhand 161 534 Andaman & Nicobar 2 365 Chhattisgarh 23 314 Arunachal Pradesh 201 236 Bihar 144 Pondicherry 120 Assam 53 112 Sikkim 98 98 Haryana 93 Jharkhand 91 Meghalaya 44 82 Himachal Pradesh 20 64 Manipur 7 56 West Bengal 22 22 Lakshadweep 16 16 Nagaland 3 16 Diu Damn 4 Total 49,130 102,788 22,466 Source : NIWE (National Institute of Wind Energy), HDFC sec Inst Research
Top 5 states constitute nearly 80% of total wind energy potential in India Potential estimates do not take into account the actual feasibility of setting up a wind farm and hence realisable potential may be lower However, improved technology can lead to even higher potential
Page | 15
SUZLON ENERGY : INITIATING COVERAGE
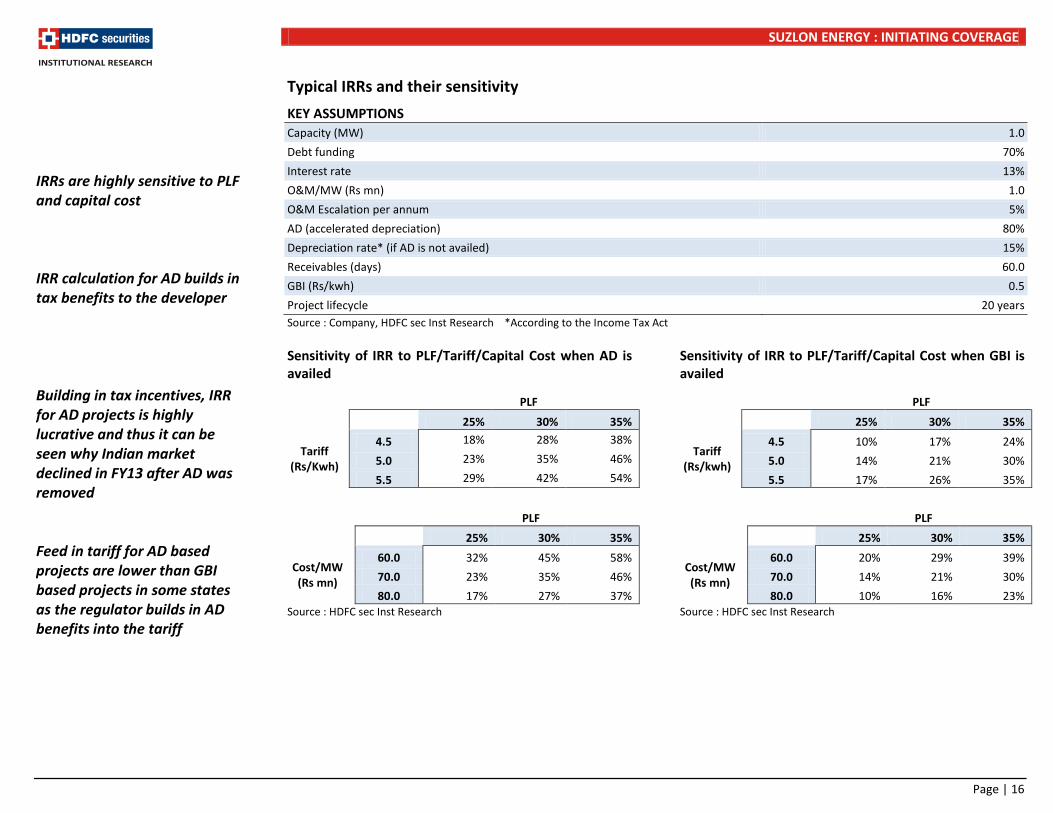
Typical IRRs and their sensitivity KEY ASSUMPTIONS Capacity (MW) 1.0 Debt funding 70% Interest rate 13% O&M/MW (Rs mn) 1.0 O&M Escalation per annum 5% AD (accelerated depreciation) 80% Depreciation rate* (if AD is not availed) 15% Receivables (days) 60.0 GBI (Rs/kwh) 0.5 Project lifecycle 20 years Source : Company, HDFC sec Inst Research *According to the Income Tax Act Sensitivity of IRR to PLF/Tariff/Capital Cost when AD is availed
PLF
12% 25% 30% 35%
Tariff (Rs/Kwh)
4.5 18% 28% 38%
5.0 23% 35% 46%
5.5 29% 42% 54%
PLF
12% 25% 30% 35%
Cost/MW (Rs mn)
60.0 32% 45% 58% 70.0 23% 35% 46% 80.0 17% 27% 37%
Source : HDFC sec Inst Research
Sensitivity of IRR to PLF/Tariff/Capital Cost when GBI is availed
PLF
12% 25% 30% 35%
Tariff (Rs/kwh)
4.5 10% 17% 24% 5.0 14% 21% 30% 5.5 17% 26% 35%
PLF
12% 25% 30% 35%
Cost/MW (Rs mn)
60.0 20% 29% 39% 70.0 14% 21% 30% 80.0 10% 16% 23%
Source : HDFC sec Inst Research
IRRs are highly sensitive to PLF and capital cost IRR calculation for AD builds in tax benefits to the developer Building in tax incentives, IRR for AD projects is highly lucrative and thus it can be seen why Indian market declined in FY13 after AD was removed Feed in tariff for AD based projects are lower than GBI based projects in some states as the regulator builds in AD benefits into the tariff
Page | 16
SUZLON ENERGY : INITIATING COVERAGE
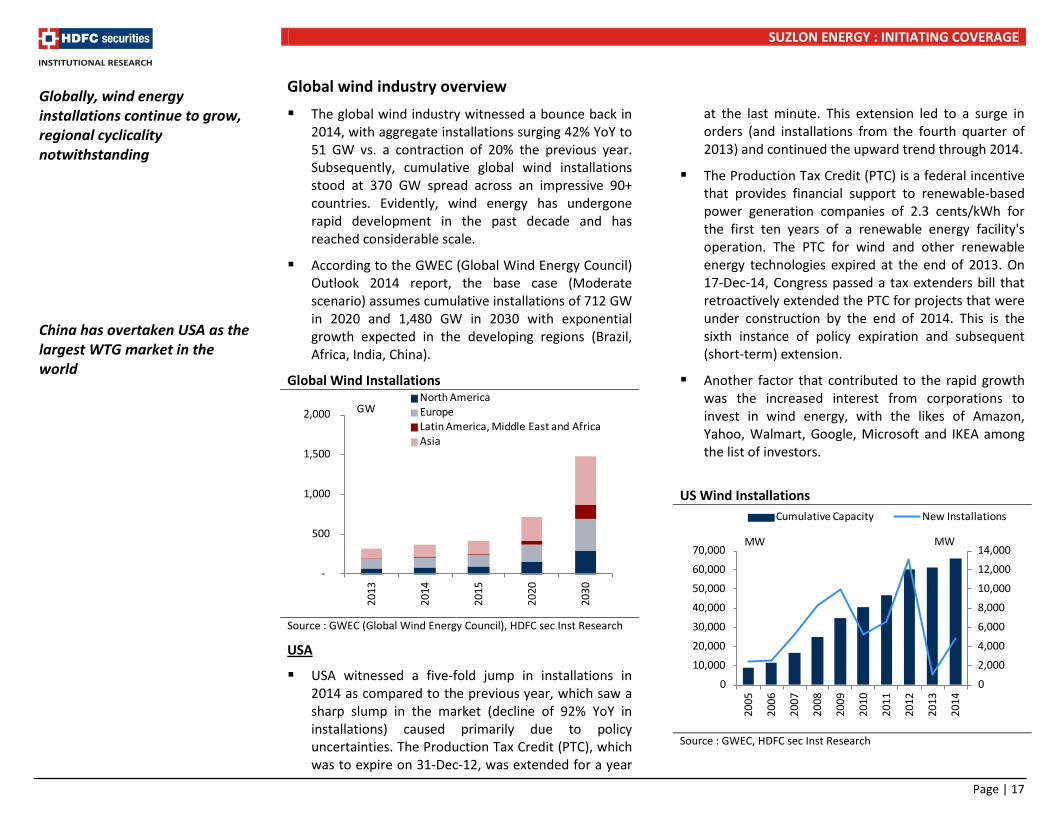
Global wind industry overview The global wind industry witnessed a bounce back in
2014, with aggregate installations surging 42% YoY to 51 GW vs. a contraction of 20% the previous year. Subsequently, cumulative global wind installations stood at 370 GW spread across an impressive 90+ countries. Evidently, wind energy has undergone rapid development in the past decade and has reached considerable scale.
According to the GWEC (Global Wind Energy Council) Outlook 2014 report, the base case (Moderate scenario) assumes cumulative installations of 712 GW in 2020 and 1,480 GW in 2030 with exponential growth expected in the developing regions (Brazil, Africa, India, China).
Global Wind Installations
Source : GWEC (Global Wind Energy Council), HDFC sec Inst Research
USA
USA witnessed a five-fold jump in installations in 2014 as compared to the previous year, which saw a sharp slump in the market (decline of 92% YoY in installations) caused primarily due to policy uncertainties. The Production Tax Credit (PTC), which was to expire on 31-Dec-12, was extended for a year
at the last minute. This extension led to a surge in orders (and installations from the fourth quarter of 2013) and continued the upward trend through 2014.
The Production Tax Credit (PTC) is a federal incentive that provides financial support to renewable-based power generation companies of 2.3 cents/kWh for the first ten years of a renewable energy facility's operation. The PTC for wind and other renewable energy technologies expired at the end of 2013. On 17-Dec-14, Congress passed a tax extenders bill that retroactively extended the PTC for projects that were under construction by the end of 2014. This is the sixth instance of policy expiration and subsequent (short-term) extension.
Another factor that contributed to the rapid growth was the increased interest from corporations to invest in wind energy, with the likes of Amazon, Yahoo, Walmart, Google, Microsoft and IKEA among the list of investors.
US Wind Installations
Source : GWEC, HDFC sec Inst Research
0
2,000
4,000
6,000
8,000
10,000
12,000
14,000
0
10,000
20,000
30,000
40,000
50,000
60,000
70,000
2005
2006
2007
2008
2009
2010
2011
2012
2013
2014
Cumulative Capacity New Installations
MW MW
Globally, wind energy installations continue to grow, regional cyclicality notwithstanding China has overtaken USA as the largest WTG market in the world
-
500
1,000
1,500
2,000
2013
2014
2015
2020
2030
North AmericaEuropeLatin America, Middle East and AfricaAsia
GW
Page | 17
SUZLON ENERGY : INITIATING COVERAGE
China
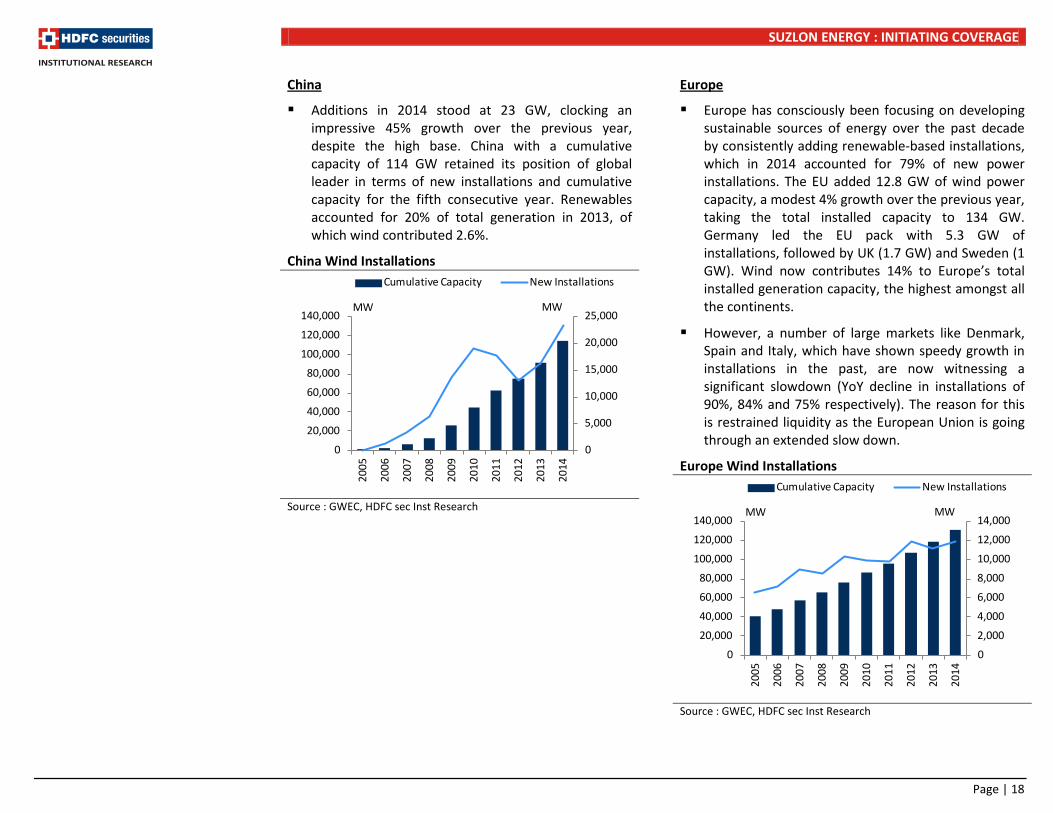
Additions in 2014 stood at 23 GW, clocking an impressive 45% growth over the previous year, despite the high base. China with a cumulative capacity of 114 GW retained its position of global leader in terms of new installations and cumulative capacity for the fifth consecutive year. Renewables accounted for 20% of total generation in 2013, of which wind contributed 2.6%.
China Wind Installations
Source : GWEC, HDFC sec Inst Research
Europe
Europe has consciously been focusing on developing sustainable sources of energy over the past decade by consistently adding renewable-based installations, which in 2014 accounted for 79% of new power installations. The EU added 12.8 GW of wind power capacity, a modest 4% growth over the previous year, taking the total installed capacity to 134 GW. Germany led the EU pack with 5.3 GW of installations, followed by UK (1.7 GW) and Sweden (1 GW). Wind now contributes 14% to Europe’s total installed generation capacity, the highest amongst all the continents.
However, a number of large markets like Denmark, Spain and Italy, which have shown speedy growth in installations in the past, are now witnessing a significant slowdown (YoY decline in installations of 90%, 84% and 75% respectively). The reason for this is restrained liquidity as the European Union is going through an extended slow down.
Europe Wind Installations
Source : GWEC, HDFC sec Inst Research
0
5,000
10,000
15,000
20,000
25,000
0
20,000
40,000
60,000
80,000
100,000
120,000
140,000
2005
2006
2007
2008
2009
2010
2011
2012
2013
2014
Cumulative Capacity New Installations
MW MW
0
2,000
4,000
6,000
8,000
10,000
12,000
14,000
0
20,000
40,000
60,000
80,000
100,000
120,000
140,000
2005
2006
2007
2008
2009
2010
2011
2012
2013
2014
Cumulative Capacity New Installations
MW MW
Page | 18
SUZLON ENERGY : INITIATING COVERAGE
Offshore wind : An idea for the future
Offshore wind power is a relatively new technology that involves setting up of wind turbines in water bodies to generate electricity. Offshore turbines are more efficient in terms of generation capacity as the wind speeds are much stronger vis-à-vis wind speeds on land.
However, the industry is still in its infancy as the cost of setting up offshore wind farms is very high. The cost of offshore wind farms is 1.5-2x that of onshore wind farms. Further, under sea transmission infrastructure and grid integration is a work in progress even in the developed European markets.
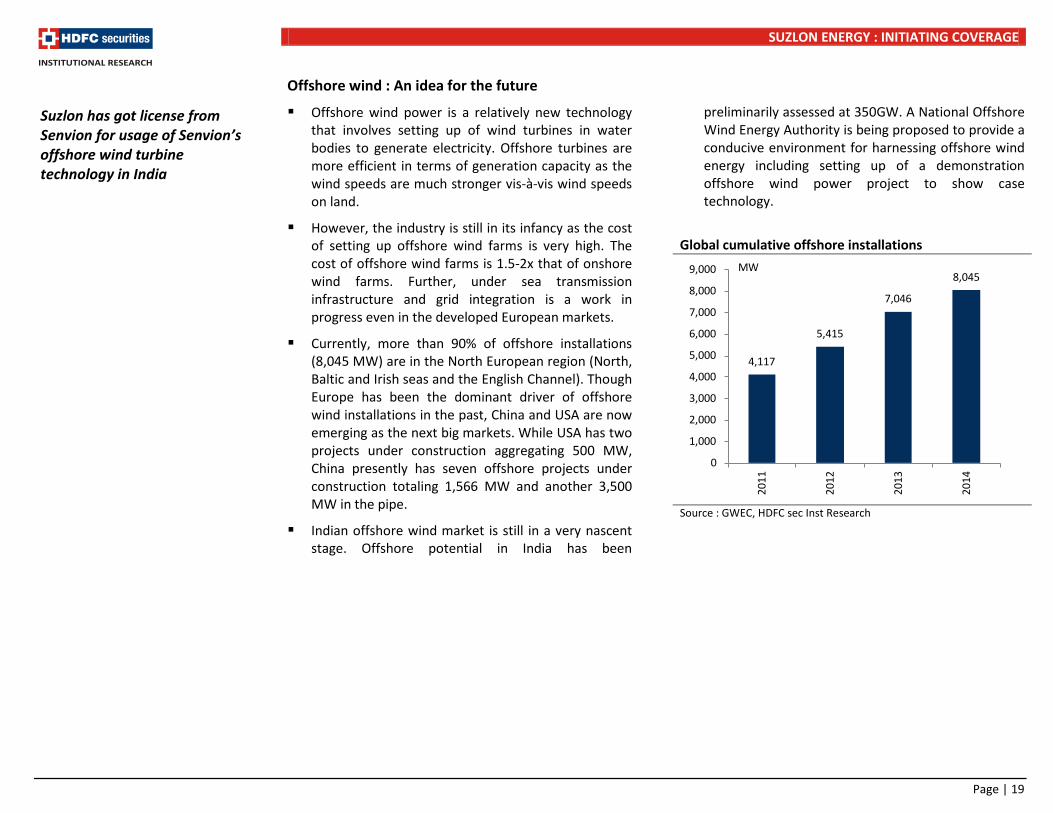
Currently, more than 90% of offshore installations (8,045 MW) are in the North European region (North, Baltic and Irish seas and the English Channel). Though Europe has been the dominant driver of offshore wind installations in the past, China and USA are now emerging as the next big markets. While USA has two projects under construction aggregating 500 MW, China presently has seven offshore projects under construction totaling 1,566 MW and another 3,500 MW in the pipe.
Indian offshore wind market is still in a very nascent stage. Offshore potential in India has been
preliminarily assessed at 350GW. A National Offshore Wind Energy Authority is being proposed to provide a conducive environment for harnessing offshore wind energy including setting up of a demonstration offshore wind power project to show case technology.
Global cumulative offshore installations
Source : GWEC, HDFC sec Inst Research
4,117
5,415
7,046
8,045
0
1,000
2,000
3,000
4,000
5,000
6,000
7,000
8,000
9,000
2011
2012
2013
2014
MW
Suzlon has got license from Senvion for usage of Senvion’s offshore wind turbine technology in India
Page | 19
SUZLON ENERGY : INITIATING COVERAGE
MAIN CATEGORIES OF INCENTIVES GLOBALLY
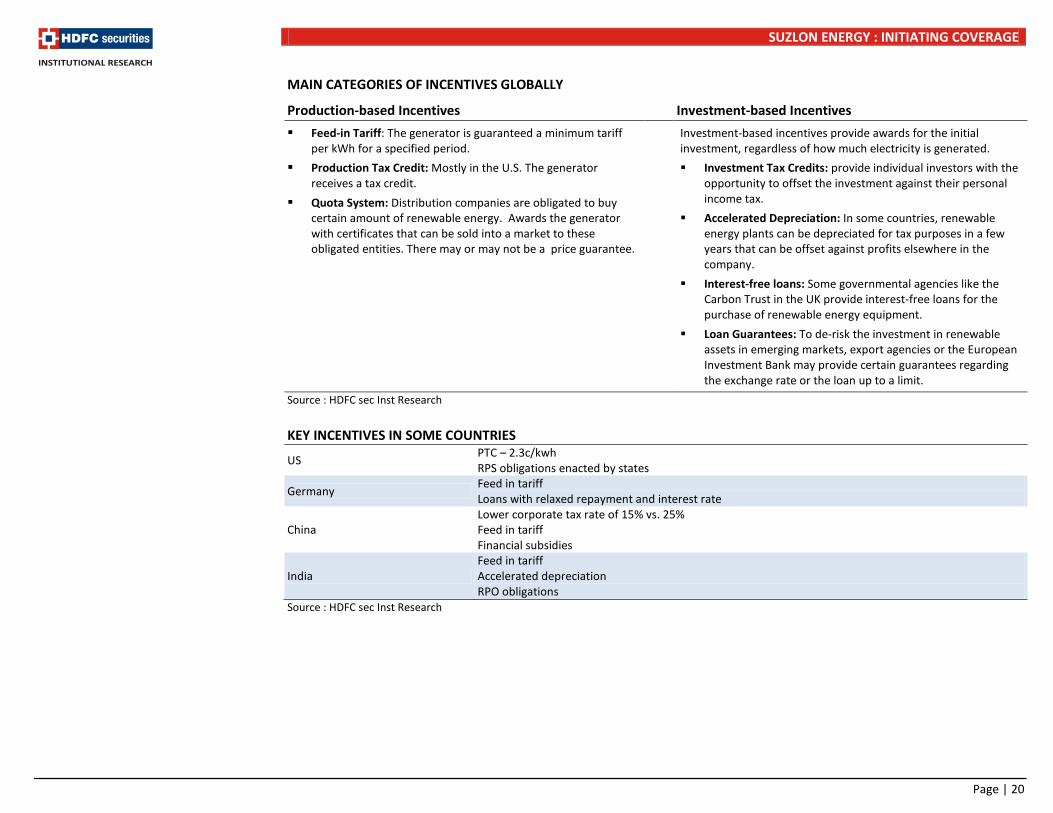
Production-based Incentives Investment-based Incentives Feed-in Tariff: The generator is guaranteed a minimum tariff
per kWh for a specified period. Production Tax Credit: Mostly in the U.S. The generator
receives a tax credit. Quota System: Distribution companies are obligated to buy
certain amount of renewable energy. Awards the generator with certificates that can be sold into a market to these obligated entities. There may or may not be a price guarantee.
Investment-based incentives provide awards for the initial investment, regardless of how much electricity is generated. Investment Tax Credits: provide individual investors with the
opportunity to offset the investment against their personal income tax.
Accelerated Depreciation: In some countries, renewable energy plants can be depreciated for tax purposes in a few years that can be offset against profits elsewhere in the company.
Interest-free loans: Some governmental agencies like the Carbon Trust in the UK provide interest-free loans for the purchase of renewable energy equipment.
Loan Guarantees: To de-risk the investment in renewable assets in emerging markets, export agencies or the European Investment Bank may provide certain guarantees regarding the exchange rate or the loan up to a limit.
Source : HDFC sec Inst Research
KEY INCENTIVES IN SOME COUNTRIES
US PTC – 2.3c/kwh RPS obligations enacted by states
Germany Feed in tariff Loans with relaxed repayment and interest rate
China Lower corporate tax rate of 15% vs. 25% Feed in tariff Financial subsidies
India Feed in tariff Accelerated depreciation RPO obligations
Source : HDFC sec Inst Research
Page | 20
SUZLON ENERGY : INITIATING COVERAGE
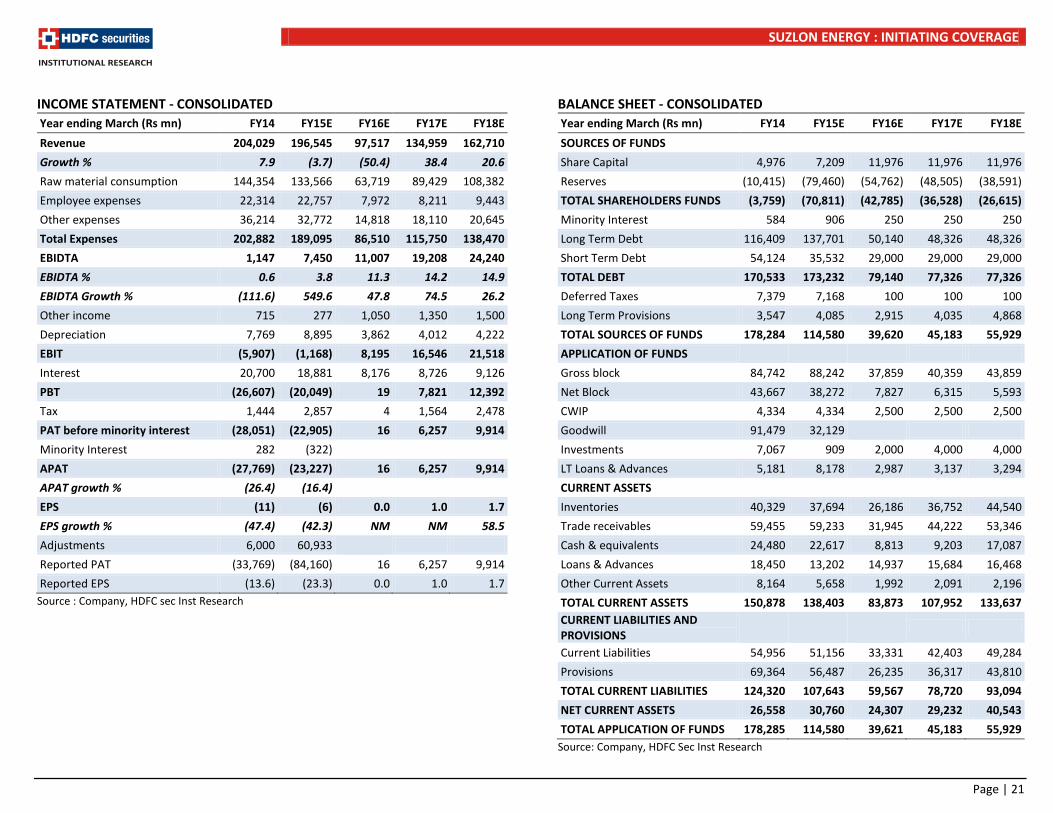
INCOME STATEMENT - CONSOLIDATED Year ending March (Rs mn) FY14 FY15E FY16E FY17E FY18E Revenue 204,029 196,545 97,517 134,959 162,710 Growth % 7.9 (3.7) (50.4) 38.4 20.6 Raw material consumption 144,354 133,566 63,719 89,429 108,382 Employee expenses 22,314 22,757 7,972 8,211 9,443 Other expenses 36,214 32,772 14,818 18,110 20,645 Total Expenses 202,882 189,095 86,510 115,750 138,470 EBIDTA 1,147 7,450 11,007 19,208 24,240 EBIDTA % 0.6 3.8 11.3 14.2 14.9 EBIDTA Growth % (111.6) 549.6 47.8 74.5 26.2 Other income 715 277 1,050 1,350 1,500 Depreciation 7,769 8,895 3,862 4,012 4,222 EBIT (5,907) (1,168) 8,195 16,546 21,518 Interest 20,700 18,881 8,176 8,726 9,126 PBT (26,607) (20,049) 19 7,821 12,392 Tax 1,444 2,857 4 1,564 2,478 PAT before minority interest (28,051) (22,905) 16 6,257 9,914 Minority Interest 282 (322) APAT (27,769) (23,227) 16 6,257 9,914 APAT growth % (26.4) (16.4) EPS (11) (6) 0.0 1.0 1.7 EPS growth % (47.4) (42.3) NM NM 58.5 Adjustments 6,000 60,933 Reported PAT (33,769) (84,160) 16 6,257 9,914 Reported EPS (13.6) (23.3) 0.0 1.0 1.7
Source : Company, HDFC sec Inst Research
BALANCE SHEET - CONSOLIDATED Year ending March (Rs mn) FY14 FY15E FY16E FY17E FY18E SOURCES OF FUNDS Share Capital 4,976 7,209 11,976 11,976 11,976 Reserves (10,415) (79,460) (54,762) (48,505) (38,591) TOTAL SHAREHOLDERS FUNDS (3,759) (70,811) (42,785) (36,528) (26,615) Minority Interest 584 906 250 250 250 Long Term Debt 116,409 137,701 50,140 48,326 48,326 Short Term Debt 54,124 35,532 29,000 29,000 29,000 TOTAL DEBT 170,533 173,232 79,140 77,326 77,326 Deferred Taxes 7,379 7,168 100 100 100 Long Term Provisions 3,547 4,085 2,915 4,035 4,868 TOTAL SOURCES OF FUNDS 178,284 114,580 39,620 45,183 55,929 APPLICATION OF FUNDS Gross block 84,742 88,242 37,859 40,359 43,859 Net Block 43,667 38,272 7,827 6,315 5,593 CWIP 4,334 4,334 2,500 2,500 2,500 Goodwill 91,479 32,129 Investments 7,067 909 2,000 4,000 4,000 LT Loans & Advances 5,181 8,178 2,987 3,137 3,294 CURRENT ASSETS Inventories 40,329 37,694 26,186 36,752 44,540 Trade receivables 59,455 59,233 31,945 44,222 53,346 Cash & equivalents 24,480 22,617 8,813 9,203 17,087 Loans & Advances 18,450 13,202 14,937 15,684 16,468 Other Current Assets 8,164 5,658 1,992 2,091 2,196 TOTAL CURRENT ASSETS 150,878 138,403 83,873 107,952 133,637 CURRENT LIABILITIES AND PROVISIONS
Current Liabilities 54,956 51,156 33,331 42,403 49,284 Provisions 69,364 56,487 26,235 36,317 43,810 TOTAL CURRENT LIABILITIES 124,320 107,643 59,567 78,720 93,094 NET CURRENT ASSETS 26,558 30,760 24,307 29,232 40,543 TOTAL APPLICATION OF FUNDS 178,285 114,580 39,621 45,183 55,929
Source: Company, HDFC Sec Inst Research
Page | 21
SUZLON ENERGY : INITIATING COVERAGE
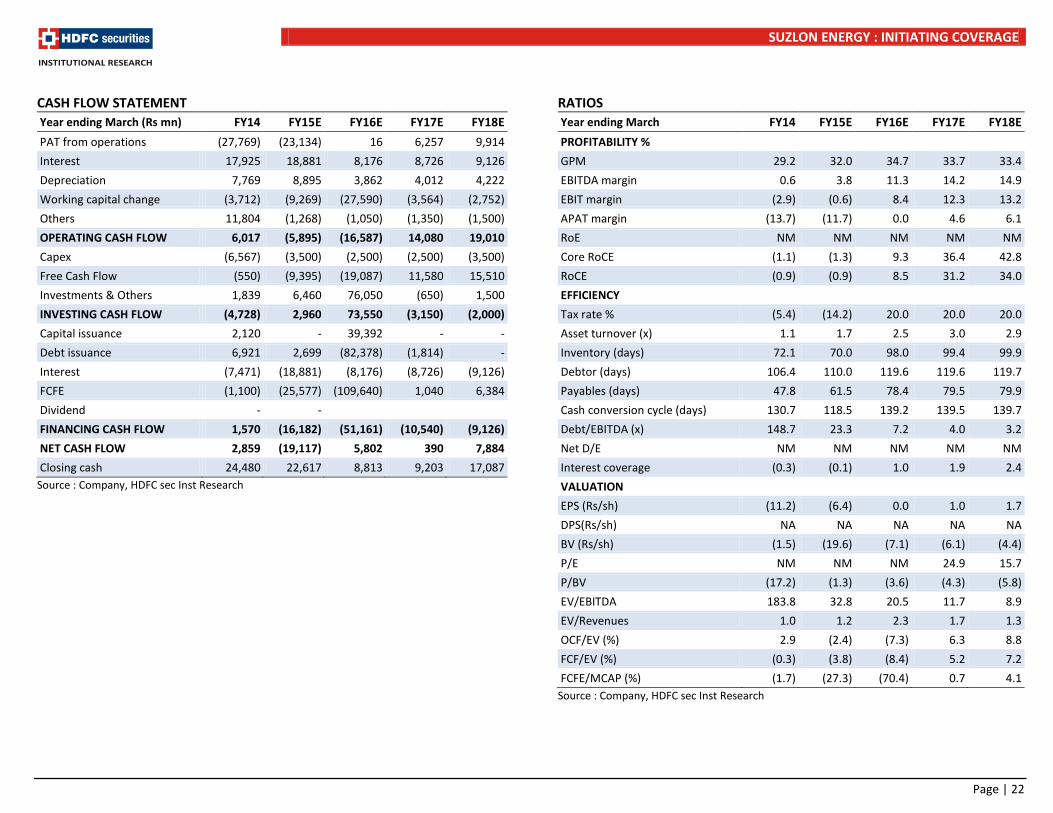
CASH FLOW STATEMENT Year ending March (Rs mn) FY14 FY15E FY16E FY17E FY18E PAT from operations (27,769) (23,134) 16 6,257 9,914 Interest 17,925 18,881 8,176 8,726 9,126 Depreciation 7,769 8,895 3,862 4,012 4,222 Working capital change (3,712) (9,269) (27,590) (3,564) (2,752) Others 11,804 (1,268) (1,050) (1,350) (1,500) OPERATING CASH FLOW 6,017 (5,895) (16,587) 14,080 19,010 Capex (6,567) (3,500) (2,500) (2,500) (3,500) Free Cash Flow (550) (9,395) (19,087) 11,580 15,510 Investments & Others 1,839 6,460 76,050 (650) 1,500 INVESTING CASH FLOW (4,728) 2,960 73,550 (3,150) (2,000) Capital issuance 2,120 - 39,392 - - Debt issuance 6,921 2,699 (82,378) (1,814) - Interest (7,471) (18,881) (8,176) (8,726) (9,126) FCFE (1,100) (25,577) (109,640) 1,040 6,384 Dividend - - FINANCING CASH FLOW 1,570 (16,182) (51,161) (10,540) (9,126) NET CASH FLOW 2,859 (19,117) 5,802 390 7,884 Closing cash 24,480 22,617 8,813 9,203 17,087
Source : Company, HDFC sec Inst Research
RATIOS Year ending March FY14 FY15E FY16E FY17E FY18E PROFITABILITY % GPM 29.2 32.0 34.7 33.7 33.4 EBITDA margin 0.6 3.8 11.3 14.2 14.9 EBIT margin (2.9) (0.6) 8.4 12.3 13.2 APAT margin (13.7) (11.7) 0.0 4.6 6.1 RoE NM NM NM NM NM Core RoCE (1.1) (1.3) 9.3 36.4 42.8 RoCE (0.9) (0.9) 8.5 31.2 34.0 EFFICIENCY Tax rate % (5.4) (14.2) 20.0 20.0 20.0 Asset turnover (x) 1.1 1.7 2.5 3.0 2.9 Inventory (days) 72.1 70.0 98.0 99.4 99.9 Debtor (days) 106.4 110.0 119.6 119.6 119.7 Payables (days) 47.8 61.5 78.4 79.5 79.9 Cash conversion cycle (days) 130.7 118.5 139.2 139.5 139.7 Debt/EBITDA (x) 148.7 23.3 7.2 4.0 3.2 Net D/E NM NM NM NM NM Interest coverage (0.3) (0.1) 1.0 1.9 2.4 VALUATION EPS (Rs/sh) (11.2) (6.4) 0.0 1.0 1.7 DPS(Rs/sh) NA NA NA NA NA BV (Rs/sh) (1.5) (19.6) (7.1) (6.1) (4.4) P/E NM NM NM 24.9 15.7 P/BV (17.2) (1.3) (3.6) (4.3) (5.8) EV/EBITDA 183.8 32.8 20.5 11.7 8.9 EV/Revenues 1.0 1.2 2.3 1.7 1.3 OCF/EV (%) 2.9 (2.4) (7.3) 6.3 8.8 FCF/EV (%) (0.3) (3.8) (8.4) 5.2 7.2 FCFE/MCAP (%) (1.7) (27.3) (70.4) 0.7 4.1
Source : Company, HDFC sec Inst Research
Page | 22
SUZLON ENERGY : INITIATING COVERAGE
Rating Definitions BUY : Where the stock is expected to deliver more than 10% returns over the next 12 month period NEUTRAL : Where the stock is expected to deliver (-)10% to 10% returns over the next 12 month period SELL : Where the stock is expected to deliver less than (-)10% returns over the next 12 month period
Disclosure: We, Abhinav Sharma, MBA & Raahil Shah, authors and the names subscribed to this report, hereby certify that all of the views expressed in this research report accurately reflect our views about the subject issuer(s) or securities. We also certify that no part of our compensation was, is, or will be directly or indirectly related to the specific recommendation(s) or view(s) in this report. Research Analyst or his/her relative or HDFC Securities Ltd. does not have any financial interest in the subject company. Also Research Analyst or his relative or HDFC Securities Ltd. or its Associate may have beneficial ownership of 1% or more in the subject company at the end of the month immediately preceding the date of publication of the Research Report. Further Research Analyst or his relative or HDFC Securities Ltd. or its associate does not have any material conflict of interest. Any holding in stock – No Disclaimer: This report has been prepared by HDFC Securities Ltd and is meant for sole use by the recipient and not for circulation. The information and opinions contained herein have been compiled or arrived at, based upon information obtained in good faith from sources believed to be reliable. Such information has not been independently verified and no guaranty, representation of warranty, express or implied, is made as to its accuracy, completeness or correctness. All such information and opinions are subject to change without notice. This document is for information purposes only. Descriptions of any company or companies or their securities mentioned herein are not intended to be complete and this document is not, and should not be construed as an offer or solicitation of an offer, to buy or sell any securities or other financial instruments. This report is not directed to, or intended for display, downloading, printing, reproducing or for distribution to or use by, any person or entity who is a citizen or resident or located in any locality, state, country or other jurisdiction where such distribution, publication, reproduction, availability or use would be contrary to law or regulation or what would subject HDFC Securities Ltd or its affiliates to any registration or licensing requirement within such jurisdiction. If this report is inadvertently send or has reached any individual in such country, especially, USA, the same may be ignored and brought to the attention of the sender. This document may not be reproduced, distributed or published for any purposes without prior written approval of HDFC Securities Ltd . Foreign currencies denominated securities, wherever mentioned, are subject to exchange rate fluctuations, which could have an adverse effect on their value or price, or the income derived from them. In addition, investors in securities such as ADRs, the values of which are influenced by foreign currencies effectively assume currency risk. It should not be considered to be taken as an offer to sell or a solicitation to buy any security. HDFC Securities Ltd may from time to time solicit from, or perform broking, or other services for, any company mentioned in this mail and/or its attachments. HDFC Securities and its affiliated company(ies), their directors and employees may; (a) from time to time, have a long or short position in, and buy or sell the securities of the company(ies) mentioned herein or (b) be engaged in any other transaction involving such securities and earn brokerage or other compensation or act as a market maker in the financial instruments of the company(ies) discussed herein or act as an advisor or lender/borrower to such company(ies) or may have any other potential conflict of interests with respect to any recommendation and other related information and opinions. HDFC Securities Ltd, its directors, analysts or employees do not take any responsibility, financial or otherwise, of the losses or the damages sustained due to the investments made or any action taken on basis of this report, including but not restricted to, fluctuation in the prices of shares and bonds, changes in the currency rates, diminution in the NAVs, reduction in the dividend or income, etc. HDFC Securities Ltd and other group companies, its directors, associates, employees may have various positions in any of the stocks, securities and financial instruments dealt in the report, or may make sell or purchase or other deals in these securities from time to time or may deal in other securities of the companies / organizations described in this report. HDFC Securities or its associates might have managed or co-managed public offering of securities for the subject company or might have been mandated by the subject company for any other assignment in the past twelve months. HDFC Securities or its associates might have received any compensation from the companies mentioned in the report during the period preceding twelve months from the date of this report for services in respect of managing or co-managing public offerings, corporate finance, investment banking or merchant banking, brokerage services or other advisory service in a merger or specific transaction in the normal course of business. HDFC Securities or its analysts did not receive any compensation or other benefits from the companies mentioned in the report or third party in connection with preparation of the research report. Accordingly, neither HDFC Securities nor Research Analysts have any material conflict of interest at the time of publication of this report. Compensation of our Research Analysts is not based on any specific merchant banking, investment banking or brokerage service transactions. HDFC Securities may have issued other reports that are inconsistent with and reach different conclusion from the information presented in this report. Research entity has not been engaged in market making activity for the subject company. Research analyst has not served as an officer, director or employee of the subject company. We have not received any compensation/benefits from the subject company or third party in connection with the Research Report.
Page | 23
SUZLON ENERGY : INITIATING COVERAGE
HDFC securities Institutional Equities Unit No. 1602, 16th Floor, Tower A, Peninsula Business Park, Senapati Bapat Marg, Lower Parel, Mumbai - 400 013 Board : +91-22-6171 7330 www.hdfcsec.com
Page | 24


![SUZLON ENERGY LIMITED › pdf › EGM-Notice.pdf · 1 SUZLON ENERGY LIMITED [CIN: L40100GJ1995PLC025447] Regd. Office: “Suzlon”, 5, Shrimali Society, Near Shri Krishna Complex,](https://img.pdfslide.us/doc/110x75/5f15898a520e5b2ad14d236e/suzlon-energy-limited-a-pdf-a-egm-noticepdf-1-suzlon-energy-limited-cin.jpg)