Embed Size (px)
DESCRIPTION
Citation preview

REGISTERED OFFICE
“Suzlon” 5, Shrimali Society,Near Shri Krishna Complex, Navrangpura, Ahmedabad - 380 009, IndiaTel.: +91-79-2647 1100Fax: +91-79-2656 5540
CORPORATE OFFICE
One Earth, Hadapsar,Pune - 411 028, IndiaTel.: +91-20-4012 2000Fax: +91-20-4012 2100
Annual Report 2009 - 10
SUSTAINING DEVELOPMENTACROSS 5 CONTINENTS.
25 COUNTRIES.
D:\DCCPC6-D_Current_Jobs\Annual Report_2k10\21000978_Suzlon_AR_2k9-2k10
AN
NU
AL REPO
RT 2009 - 10SU
ZLON
ENERG
Y LIMITED

D:\DCCPC6-D_Current_Jobs\Annual Report_2k10\21000978_Suzlon_AR_2k9-2k10
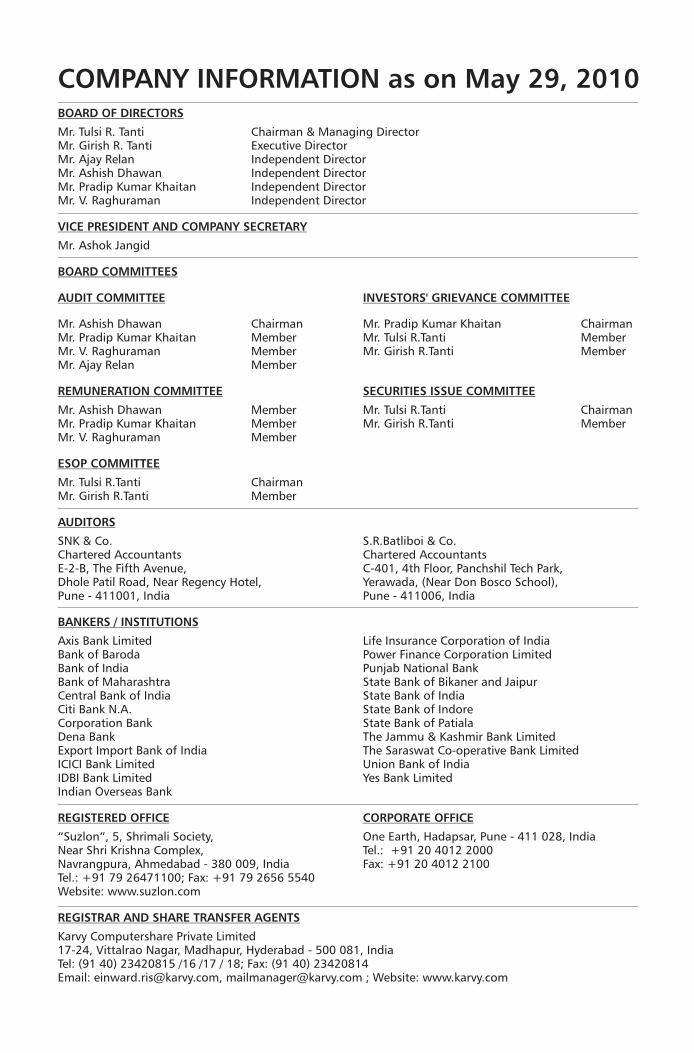
COMPANY INFORMATION as on May 29, 2010BOARD OF DIRECTORS
Mr. Tulsi R. Tanti Chairman & Managing DirectorMr. Girish R. Tanti Executive DirectorMr. Ajay Relan Independent DirectorMr. Ashish Dhawan Independent DirectorMr. Pradip Kumar Khaitan Independent DirectorMr. V. Raghuraman Independent Director
VICE PRESIDENT AND COMPANY SECRETARY
Mr. Ashok Jangid
BOARD COMMITTEES
AUDIT COMMITTEE INVESTORS' GRIEVANCE COMMITTEE
Mr. Ashish Dhawan Chairman Mr. Pradip Kumar Khaitan ChairmanMr. Pradip Kumar Khaitan Member Mr. Tulsi R.Tanti MemberMr. V. Raghuraman Member Mr. Girish R.Tanti MemberMr. Ajay Relan Member
REMUNERATION COMMITTEE SECURITIES ISSUE COMMITTEE
Mr. Ashish Dhawan Member Mr. Tulsi R.Tanti ChairmanMr. Pradip Kumar Khaitan Member Mr. Girish R.Tanti MemberMr. V. Raghuraman Member
ESOP COMMITTEE
Mr. Tulsi R.Tanti ChairmanMr. Girish R.Tanti Member
AUDITORS
SNK & Co. S.R.Batliboi & Co.Chartered Accountants Chartered AccountantsE-2-B, The Fifth Avenue, C-401, 4th Floor, Panchshil Tech Park,Dhole Patil Road, Near Regency Hotel, Yerawada, (Near Don Bosco School),Pune - 411001, India Pune - 411006, India
BANKERS / INSTITUTIONS
Axis Bank Limited Life Insurance Corporation of IndiaBank of Baroda Power Finance Corporation LimitedBank of India Punjab National BankBank of Maharashtra State Bank of Bikaner and JaipurCentral Bank of India State Bank of IndiaCiti Bank N.A. State Bank of IndoreCorporation Bank State Bank of PatialaDena Bank The Jammu & Kashmir Bank LimitedExport Import Bank of India The Saraswat Co-operative Bank LimitedICICI Bank Limited Union Bank of IndiaIDBI Bank Limited Yes Bank LimitedIndian Overseas Bank
REGISTERED OFFICE CORPORATE OFFICE
“Suzlon”, 5, Shrimali Society, One Earth, Hadapsar, Pune - 411 028, IndiaNear Shri Krishna Complex, Tel.: +91 20 4012 2000Navrangpura, Ahmedabad - 380 009, India Fax: +91 20 4012 2100Tel.: +91 79 26471100; Fax: +91 79 2656 5540Website: www.suzlon.com
REGISTRAR AND SHARE TRANSFER AGENTS
Karvy Computershare Private Limited17-24, Vittalrao Nagar, Madhapur, Hyderabad - 500 081, IndiaTel: (91 40) 23420815 /16 /17 / 18; Fax: (91 40) 23420814Email: [email protected], [email protected] ; Website: www.karvy.com
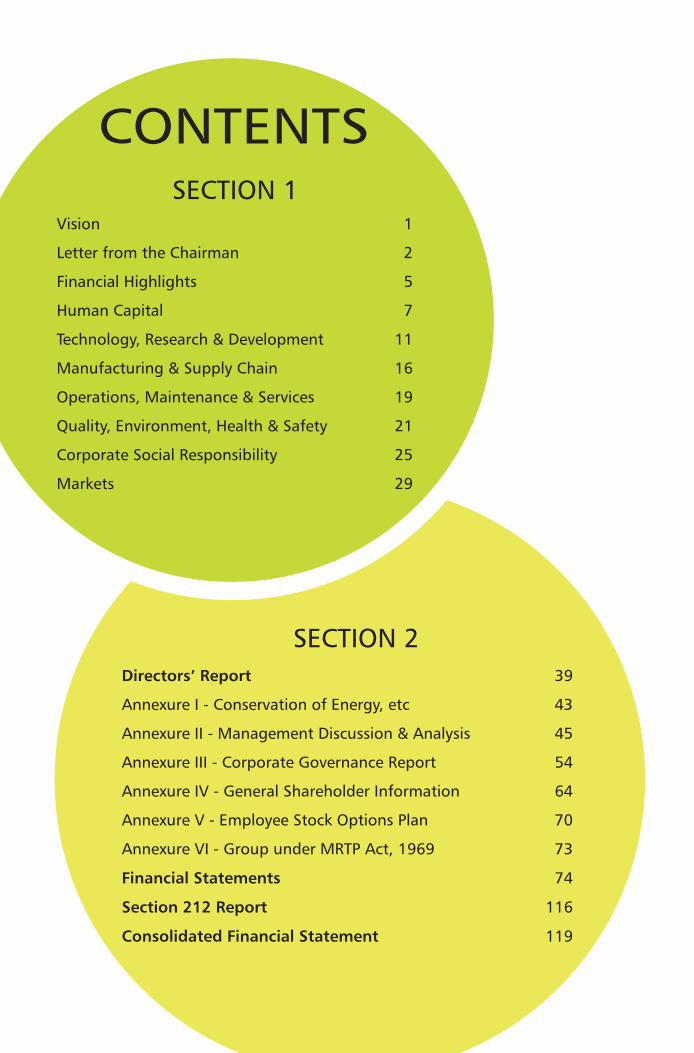
SECTION 1
SECTION 2
Vision 1
Letter from the Chairman 2
Financial Highlights 5
Human Capital 7
Technology, Research & Development 11
Manufacturing & Supply Chain 16
Operations, Maintenance & Services 19
Quality, Environment, Health & Safety 21
Corporate Social Responsibility 25
Markets 29
CONTENTS
Directors’ Report 39
Annexure I - Conservation of Energy, etc 43
Annexure II - Management Discussion & Analysis 45
Annexure III - Corporate Governance Report 54
Annexure IV - General Shareholder Information 64
Annexure V - Employee Stock Options Plan 70
Annexure VI - Group under MRTP Act, 1969 73
Financial Statements 74
Section 212 Report 116
Consolidated Financial Statement 119

1111
VISIONTechnology leadership in the wind sector.
Be among the top 3 wind companies in all the key markets of the
world.
Be the global leader in providing profitable end-to-end wind power
solutions.
Be the “Stakeholders’ Choice” company.
1

LETTER FROM THE CHAIRMANThe past year has been an unprecedented one for the wind industry with a record of global wind turbine installations amidst the challenges of global economic downturn.
In 2009 approximately 38,000 MW was installed by the Wind industry, taking the world's global base to 160,000 MW. The year saw the dominance of Asia as the largest and fastest growing region, with South and East Asia contributing to almost 40 per cent of the total wind installations compared to 30 per cent by the Americas and Europe each*. China emerged as the world's largest market – installing a staggering 14,000 MW and the market for offshore has also seen significant growth.
The economic downturn had a significant impact on lowering demand – and therefore the relative price – of energy. The COP15 meeting in Copenhagen did something to reverse the trend. Although COP15 failed to produce the legally binding resolution that had been hoped for, it did bring together more than 180 nations to focus on what I believe remains humanity's greatest danger: climate change.
Suzlon Group (Suzlon along with REpower) has maintained its position of being the third largest player in the industry with a global market share of 9.8 per cent and with a supply of 3718 MW in 2009*. With its strong global footprint, the Group is in the top three positions in key wind markets of Australia, Brazil, France, Germany, India, UK and USA. 2009 also saw for the first time the entry of three Chinese players in the top ten and new entrants from Korea. In all the markets, we see the local players consolidating and growing their position of strength. India itself has more than doubled the rate at which it installed renewable energy capacity during the previous year. It added
#1570 MW of wind power during the year compared #to 790 MW the previous year, making India the
world's fifth largest wind energy generator. Suzlon maintained its leadership position in India for the
th12 year with more than 50 per cent market share.
Although from company performance standpoint this has been a disappointing year for Suzlon – posting our first ever full-year loss – real progress has been made on a number of other fronts: significant cost reduction, complete review of our supply chain, exciting technological developments, the completion of our refinance program, realizing a net debt reduction of 17 per cent and reaching new levels of acceptance across the world – making The Case for Wind.
Our strengths as a Group, I believe, are complemented by our subsidiary REpower,
which had a solid year, delivering high growth and winning some very
impressive orders. FY2009-10 has been their most profitable year with highest revenues in the history of the company to date. A growth of almost 40 per cent over the past year accompanied by a major increase in the orders for large-sized wind turbines in the 3 to 6 MW class.
With the introduction of the Suzlon's S97 - 2.1 MW and REpower's 3.2M114 and 3.4M104
wind turbines, specially designed to perform at low-wind speeds, Suzlon
VISION
Group brings to the market the most comprehensive product portfolio in the industry, allowing the Group to meet diverse needs across all geographies, customer profiles and offshore & onshore markets.
Hansen has maintained its position of being the second largest player in the wind turbine gearbox market. The components industry also faced challenges due to a reduction in demand and the economic downturn. Hansen was no exception and did report a loss. However, it is encouraging to note that since our initial investment in Hansen in 2006 the company has successfully diversified their customer base and is on target to deliver 14,000 MW of capacity by the year 2013. That is a growth in manufacturing capacity of over four times.
Going forward, we see the global economies slowly coming out of the downturn and the continued policy measures to support renewable energy would facilitate the demand. Wind today provides just 1.6 per cent* of the world's electricity supply. This is forecast to be 8.4 per cent* in a decade. The long term outlook remains intact for the Wind industry and we see it growing to an annual installed base of more than 60 GW, reaching to cumulative installed base of 464 GW by 2015*. Extrapolated that suggests a global market for wind, valued at approximately US$75 billion today, growing to more than US$124 billion in the next five years*.
As a Group, we are well poised to play our part. Suzlon and REpower are working together aggressively to grow the wind market around the world. We are strongly poised to push into promising new geographies, and build on our position in key markets like North America, Australia, Europe, India and China – and taking our local and global experience from emerging and developed markets to geographies like Africa and Latin America.
Soon, the public stage will return focus on renewables as the world gathers for COP16 in Mexico, but I firmly believe that while governments can set direction, and they need to – it is industry that has to step up and create the future.
We have a key part of this future, and I am confident that together we will lead the way for the growth of the wind energy sector, creating value for you - our stakeholders. And in doing so, fulfill our greater promise – sustainable economic and ecological development to build a better future for the generations to come.
Regards,
Tulsi R. Tanti
Chairman and Managing Director
Pune, June 2010
3
*Source BTM Consult ApS March 2010 #Ministry of New and Renewable Energy
Suzlon Energy Limited, Annual Report 2009-10

Suzlon wind farm at Hallett,Australia
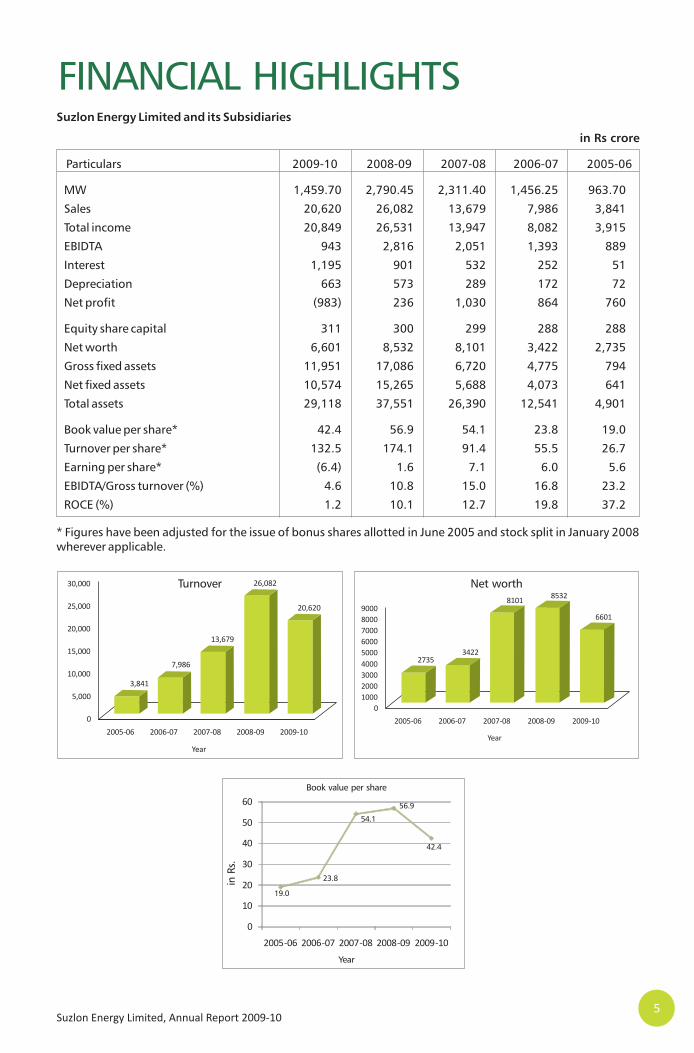
in Rs crore
Particulars 2009-10 2008-09 2007-08 2006-07 2005-06
MW 1,459.70 2,790.45 2,311.40 1,456.25 963.70
Sales 20,620 26,082 13,679 7,986 3,841
Total income 20,849 26,531 13,947 8,082 3,915
EBIDTA 943 2,816 2,051 1,393 889
Interest 1,195 901 532 252 51
Depreciation 663 573 289 172 72
Net profit (983) 236 1,030 864 760
Equity share capital 311 300 299 288 288
Net worth 6,601 8,532 8,101 3,422 2,735
Gross fixed assets 11,951 17,086 6,720 4,775 794
Net fixed assets 10,574 15,265 5,688 4,073 641
Total assets 29,118 37,551 26,390 12,541 4,901
Book value per share* 42.4 56.9 54.1 23.8 19.0
Turnover per share* 132.5 174.1 91.4 55.5 26.7
Earning per share* (6.4) 1.6 7.1 6.0 5.6
EBIDTA/Gross turnover (%) 4.6 10.8 15.0 16.8 23.2
ROCE (%) 1.2 10.1 12.7 19.8 37.2
Suzlon Energy Limited and its Subsidiaries
* Figures have been adjusted for the issue of bonus shares allotted in June 2005 and stock split in January 2008 wherever applicable.
FINANCIAL HIGHLIGHTS
0
10
20
30
40
50
60
2005-06 2006-07 2007-08 2008-09 2009-10
Book value per share
19.0
23.8
54.1
56.9
42.4
Year
in R
s.
0
5,000
10,000
15,000
20,000
25,000
30,000
2005-06 2006-07 2007-08 2008-09 2009-10
3,841
7,986
13,679
26,082
20,620
Year
0100020003000400050006000700080009000
2005-06 2006-07 2007-08 2008-09 2009-10
27353422
81018532
6601
Year
Net worth
5
Turnover
Suzlon Energy Limited, Annual Report 2009-10
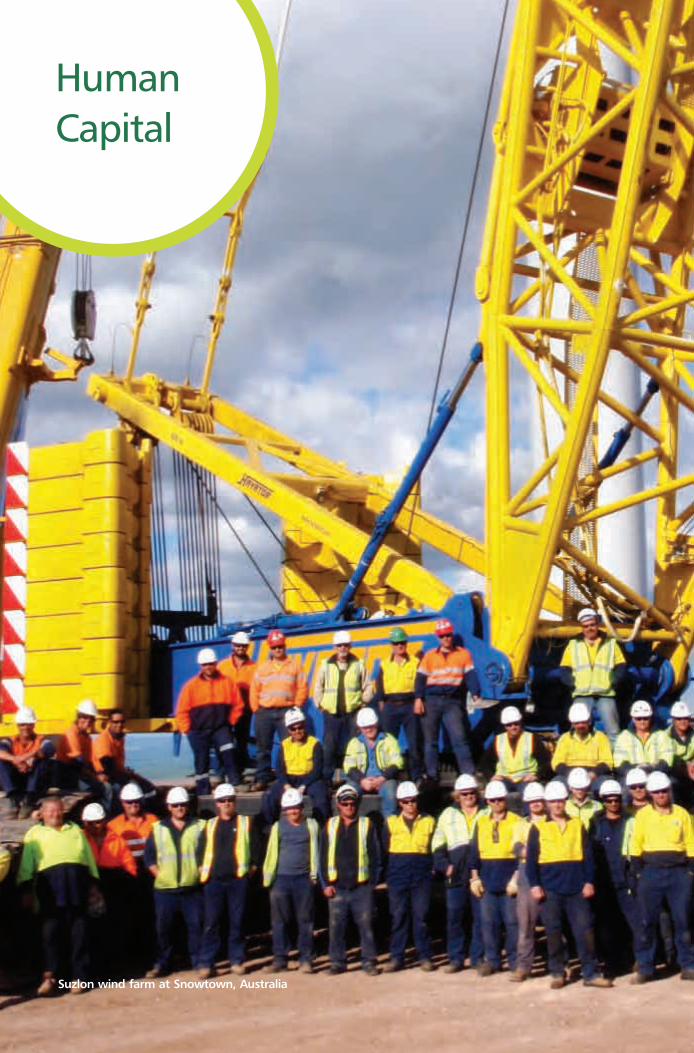
HumanCapital
Suzlon wind farm at Snowtown, Australia
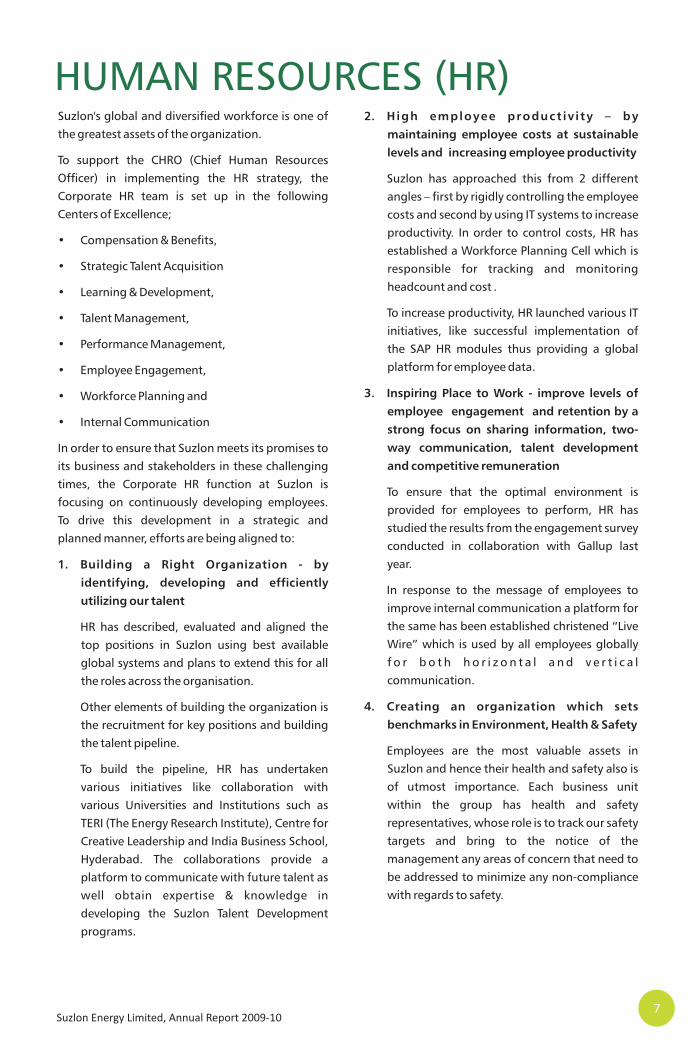
HUMAN RESOURCES (HR)Suzlon's global and diversified workforce is one of the greatest assets of the organization.
To support the CHRO (Chief Human Resources Officer) in implementing the HR strategy, the Corporate HR team is set up in the following Centers of Excellence;
• Compensation & Benefits,
• Strategic Talent Acquisition
• Learning & Development,
• Talent Management,
• Performance Management,
• Employee Engagement,
• Workforce Planning and
• Internal Communication
In order to ensure that Suzlon meets its promises to its business and stakeholders in these challenging times, the Corporate HR function at Suzlon is focusing on continuously developing employees. To drive this development in a strategic and planned manner, efforts are being aligned to:
1. Building a Right Organization - by
identifying, developing and efficiently
utilizing our talent
HR has described, evaluated and aligned the top positions in Suzlon using best available global systems and plans to extend this for all the roles across the organisation.
Other elements of building the organization is the recruitment for key positions and building the talent pipeline.
To build the pipeline, HR has undertaken various initiatives like collaboration with various Universities and Institutions such as TERI (The Energy Research Institute), Centre for Creative Leadership and India Business School, Hyderabad. The collaborations provide a platform to communicate with future talent as well obtain expertise & knowledge in developing the Suzlon Talent Development programs.
2. High employee product iv i ty – by
maintaining employee costs at sustainable
levels and increasing employee productivity
Suzlon has approached this from 2 different angles – first by rigidly controlling the employee costs and second by using IT systems to increase productivity. In order to control costs, HR has established a Workforce Planning Cell which is responsible for tracking and monitoring headcount and cost .
To increase productivity, HR launched various IT initiatives, like successful implementation of the SAP HR modules thus providing a global platform for employee data.
3. Inspiring Place to Work - improve levels of
employee engagement and retention by a
strong focus on sharing information, two-
way communication, talent development
and competitive remuneration
To ensure that the optimal environment is provided for employees to perform, HR has studied the results from the engagement survey conducted in collaboration with Gallup last year.
In response to the message of employees to improve internal communication a platform for the same has been established christened “Live Wire” which is used by all employees globally f o r b o t h h o r i z o n t a l a n d v e r t i c a l communication.
4. Creating an organization which sets
benchmarks in Environment, Health & Safety
Employees are the most valuable assets in Suzlon and hence their health and safety also is of utmost importance. Each business unit within the group has health and safety representatives, whose role is to track our safety targets and bring to the notice of the management any areas of concern that need to be addressed to minimize any non-compliance with regards to safety.
7Suzlon Energy Limited, Annual Report 2009-10
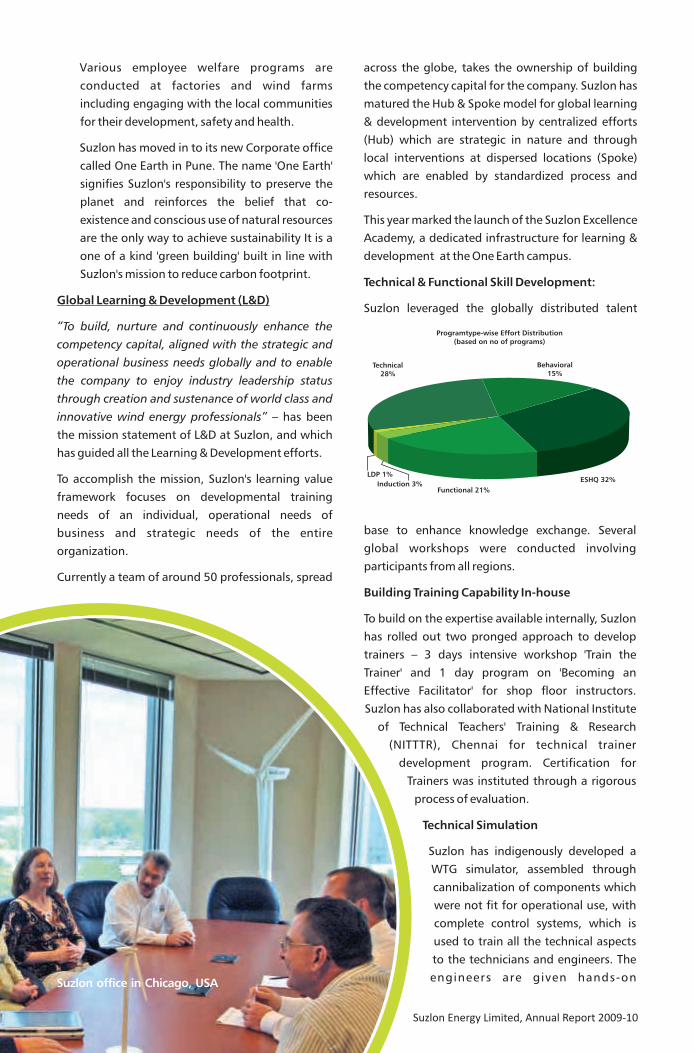
Various employee welfare programs are conducted at factories and wind farms including engaging with the local communities for their development, safety and health.
Suzlon has moved in to its new Corporate office called One Earth in Pune. The name 'One Earth' signifies Suzlon's responsibility to preserve the planet and reinforces the belief that co-existence and conscious use of natural resources are the only way to achieve sustainability It is a one of a kind 'green building' built in line with Suzlon's mission to reduce carbon footprint.
Global Learning & Development (L&D)
“To build, nurture and continuously enhance the
competency capital, aligned with the strategic and
operational business needs globally and to enable
the company to enjoy industry leadership status
through creation and sustenance of world class and
innovative wind energy professionals” – has been the mission statement of L&D at Suzlon, and which has guided all the Learning & Development efforts.
To accomplish the mission, Suzlon's learning value framework focuses on developmental training needs of an individual, operational needs of business and strategic needs of the entire organization.
Currently a team of around 50 professionals, spread
across the globe, takes the ownership of building the competency capital for the company. Suzlon has matured the Hub & Spoke model for global learning & development intervention by centralized efforts (Hub) which are strategic in nature and through local interventions at dispersed locations (Spoke) which are enabled by standardized process and resources.
This year marked the launch of the Suzlon Excellence Academy, a dedicated infrastructure for learning & development at the One Earth campus.
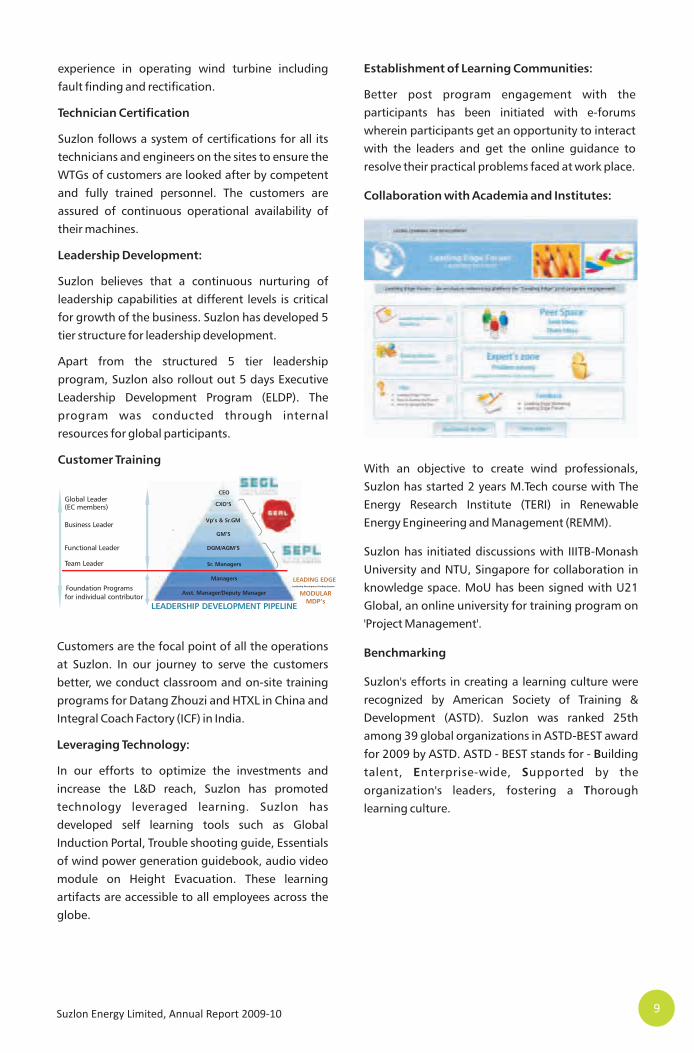
Technical & Functional Skill Development:
Suzlon leveraged the globally distributed talent
Programtype-wise Effort Distribution(based on no of programs)
Technical28%
LDP 1%
Induction 3%Functional 21%
ESHQ 32%
Behavioral15%
base to enhance knowledge exchange. Several global workshops were conducted involving participants from all regions.
Building Training Capability In-house
To build on the expertise available internally, Suzlon has rolled out two pronged approach to develop trainers – 3 days intensive workshop 'Train the Trainer' and 1 day program on 'Becoming an Effective Facilitator' for shop floor instructors. Suzlon has also collaborated with National Institute
of Technical Teachers' Training & Research (NITTTR), Chennai for technical trainer
development program. Certification for Trainers was instituted through a rigorous
process of evaluation.
Technical Simulation
Suzlon has indigenously developed a WTG simulator, assembled through cannibalization of components which were not fit for operational use, with complete control systems, which is used to train all the technical aspects to the technicians and engineers. The
engineers are given hands-on Suzlon office in Chicago, USA
Suzlon Energy Limited, Annual Report 2009-10
experience in operating wind turbine including fault finding and rectification.
Technician Certification
Suzlon follows a system of certifications for all its technicians and engineers on the sites to ensure the WTGs of customers are looked after by competent and fully trained personnel. The customers are assured of continuous operational availability of their machines.
Leadership Development:
Suzlon believes that a continuous nurturing of leadership capabilities at different levels is critical for growth of the business. Suzlon has developed 5 tier structure for leadership development.
Apart from the structured 5 tier leadership program, Suzlon also rollout out 5 days Executive Leadership Development Program (ELDP). The program was conducted through internal resources for global participants.
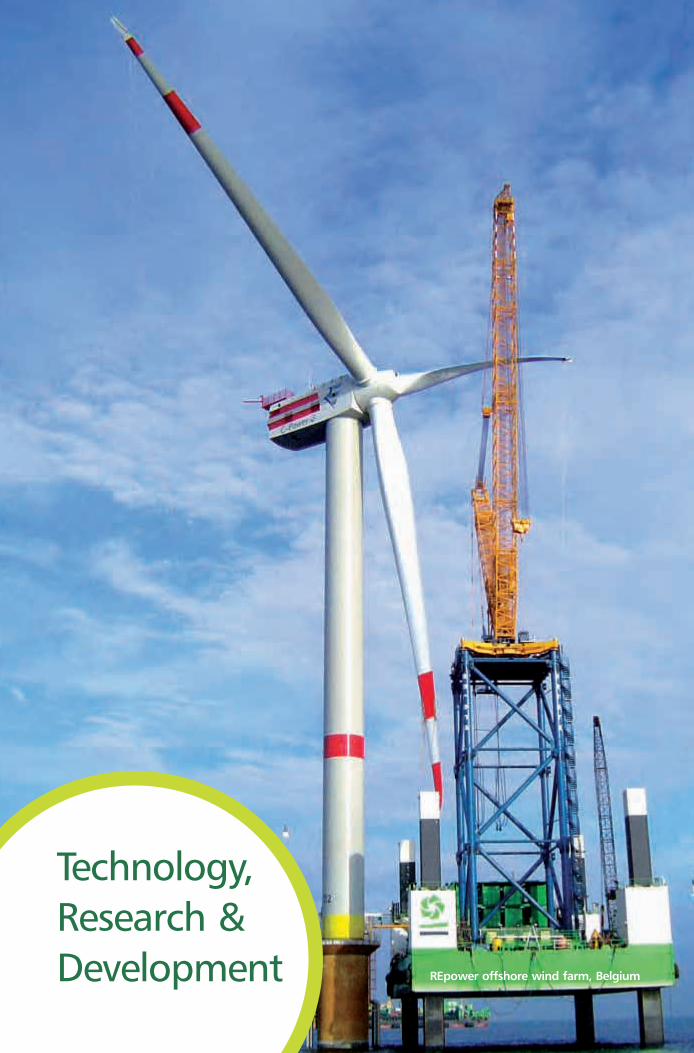
Customer Training
Customers are the focal point of all the operations at Suzlon. In our journey to serve the customers better, we conduct classroom and on-site training programs for Datang Zhouzi and HTXL in China and Integral Coach Factory (ICF) in India.
Leveraging Technology:
In our efforts to optimize the investments and increase the L&D reach, Suzlon has promoted technology leveraged learning. Suzlon has developed self learning tools such as Global Induction Portal, Trouble shooting guide, Essentials of wind power generation guidebook, audio video module on Height Evacuation. These learning artifacts are accessible to all employees across the globe.
Establishment of Learning Communities:
Better post program engagement with the participants has been initiated with e-forums wherein participants get an opportunity to interact with the leaders and get the online guidance to resolve their practical problems faced at work place.
Collaboration with Academia and Institutes:
With an objective to create wind professionals, Suzlon has started 2 years M.Tech course with The Energy Research Institute (TERI) in Renewable Energy Engineering and Management (REMM).
Suzlon has initiated discussions with IIITB-Monash University and NTU, Singapore for collaboration in knowledge space. MoU has been signed with U21 Global, an online university for training program on 'Project Management'.
Benchmarking
Suzlon's efforts in creating a learning culture were recognized by American Society of Training & Development (ASTD). Suzlon was ranked 25th among 39 global organizations in ASTD-BEST award
for 2009 by ASTD. ASTD - BEST stands for - Building
talent, Enterprise-wide, Supported by the
organization's leaders, fostering a Thorough learning culture.
CEO
CXO’S
Vp’s & Sr.GM
GM’S
DGM/AGM’S
Sr. Managers
Managers
Asst. Manager/Deputy Manager
-
Foundation Programsfor individual contributor
Team Leader
Functional Leader
Business Leader
Global Leader(EC members)
LEADERSHIP DEVELOPMENT PIPELINE
9Suzlon Energy Limited, Annual Report 2009-10
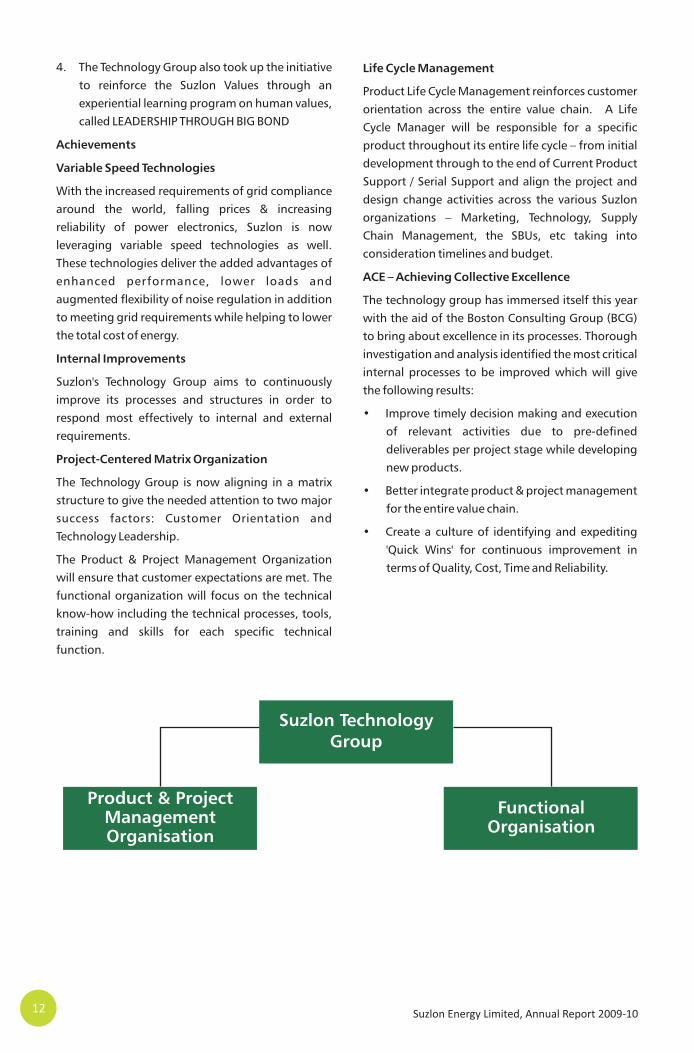
Technology,Research &Development REpower offshore wind farm, Belgium

Technology is a key enabler to allow a company to compete successfully in the long run and be the market leader. Wind turbine technology, continues to be a dynamic field of research with more focus on reliability, ease of operation, and maintenance, while developing lighter and more efficient turbines. The Technology Organization is committed to continue to improve the product and lower its cost.
Suzlon has increased its Intellectual Property Rights (IPR) related activities markedly in the past year, with filing patent applications and handling third party rights, thereby consolidating its position in the complex technological domain that exists in the wind industry.
Technology Teams
Suzlon, derive its technological success from a close collaboration between experienced development teams spread across the globe, including Germany, Netherlands, Denmark, India and very soon China. Technology related collaboration also takes place with the Supply Chain organization, 3rd Party Suppliers, and amongst the various Business Units which sell and operate wind turbines in all the regions of the world.
It has over 550 persons engaged in Technology development and R&D activities, evenly split between India and Western Europe located in close proximity to where technical talent is available. These teams cover the
full scope of engineering, from fundamental material research, to systems design, integration and field analysis.
The dedicated team has seen a very low attrition (less than 4% in Europe and less than 7% in India). The Health and Safety record remains exemplary as well. The safety trainings that are an integrated part of the Technology Group curriculum are followed to the letter and are evident in
its safety record.
TECHNOLOGY, RESEARCH & DEVELOPMENTPotential Development
Suzlon continue to improve the performance levels of the current employees by offering an array of development opportunities. It has rolled out a number of enhancements to the development portfolio.
1. Project Management development is being enhanced via an intensive, 12 week collaborative e-learning course. Parallel to that, a project management program was started with the Renewable Energy Technology Centre (RETC) in Hamburg, Germany and REpower.
2. A competency based workforce model has been established.
3. Mentoring as an organizational development intervention was institutionalized in India with the focus on facilitating smooth assimilation of new employees. Further, Technical Mentoring was introduced to augment the technical skills of employees by leveraging the knowledge of technical experts in various areas.
Central Monitoring system at the Suzlon office in Chicago, USA
Suzlon Energy Limited, Annual Report 2009-10
4. The Technology Group also took up the initiative to reinforce the Suzlon Values through an experiential learning program on human values, called LEADERSHIP THROUGH BIG BOND
Achievements
Variable Speed Technologies
With the increased requirements of grid compliance around the world, falling prices & increasing reliability of power electronics, Suzlon is now leveraging variable speed technologies as well. These technologies deliver the added advantages of enhanced performance, lower loads and augmented flexibility of noise regulation in addition to meeting grid requirements while helping to lower the total cost of energy.
Internal Improvements
Suzlon's Technology Group aims to continuously improve its processes and structures in order to respond most effectively to internal and external requirements.
Project-Centered Matrix Organization
The Technology Group is now aligning in a matrix structure to give the needed attention to two major success factors: Customer Orientation and Technology Leadership.
The Product & Project Management Organization will ensure that customer expectations are met. The functional organization will focus on the technical know-how including the technical processes, tools, training and skills for each specific technical function.
Life Cycle Management
Product Life Cycle Management reinforces customer orientation across the entire value chain. A Life Cycle Manager will be responsible for a specific product throughout its entire life cycle – from initial development through to the end of Current Product Support / Serial Support and align the project and design change activities across the various Suzlon organizations – Marketing, Technology, Supply Chain Management, the SBUs, etc taking into consideration timelines and budget.
ACE – Achieving Collective Excellence
The technology group has immersed itself this year with the aid of the Boston Consulting Group (BCG) to bring about excellence in its processes. Thorough investigation and analysis identified the most critical internal processes to be improved which will give the following results:
• Improve timely decision making and execution of relevant activities due to pre-defined deliverables per project stage while developing new products.
• Better integrate product & project management for the entire value chain.
• Create a culture of identifying and expediting 'Quick Wins' for continuous improvement in terms of Quality, Cost, Time and Reliability.
Suzlon TechnologyGroup
Product & ProjectManagement Organisation
FunctionalOrganisation
12 Suzlon Energy Limited, Annual Report 2009-10

Suzlon wind farm at Nicaragua
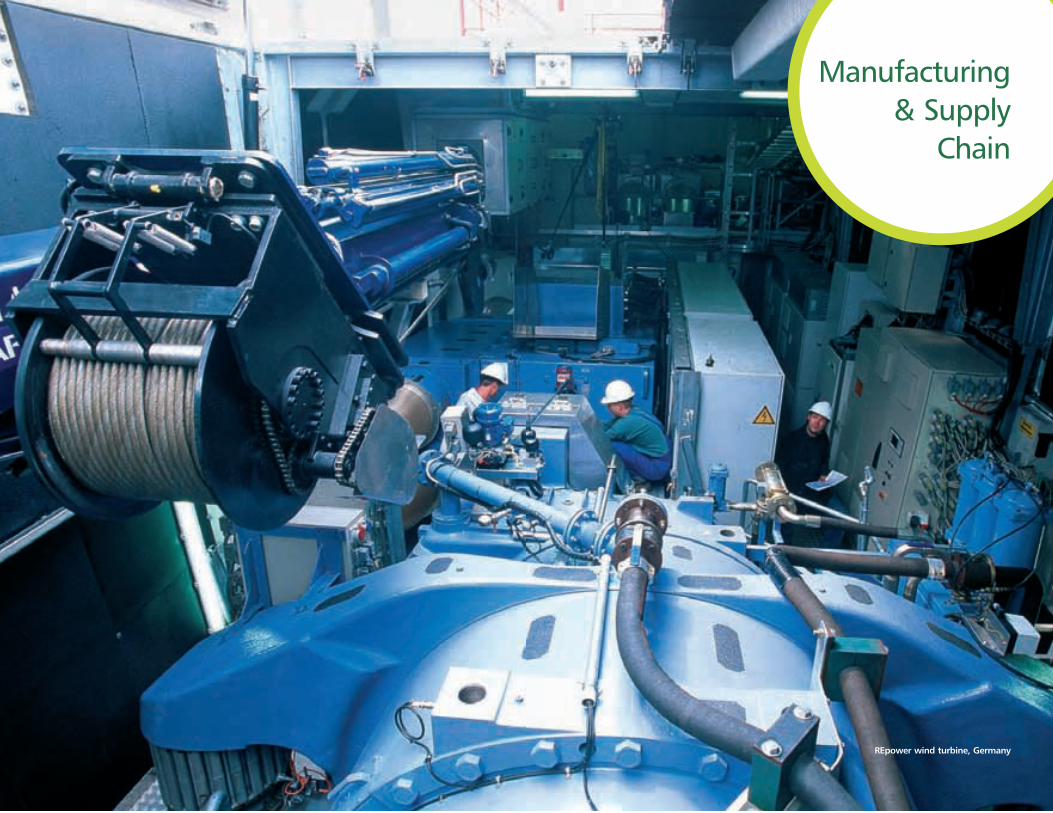
Supply Chain Management (SCM) is an important constituent of the Suzlon Value Chain. It caters to the manufacturing of the various components of the Wind Turbine Generator (WTG) through its manufacturing plants across the globe. SCM has been divided into four verticals - Nacelle, Blade, Electrical and Tower.
The current year has been a difficult year due to global economic meltdown, constrained by volatile demand, changing customer requirements, and fluctuating commodity prices. All of a sudden the market turned from a sellers' to a buyers' market. To meet these challenges and to align itself to the company vision, SCM undertook a number of transformation initiatives under the following major heads:
• Customer Centric SCM
• Quality Excellence
• Cost Leadership
• Accelerating Change
• ACE (Achieving Collective Excellence)
Key Initiatives: Progress
Customer Centric SCM
• Emphasis on product quality and on time delivery- Establishment of an order fulfillment cell.
• Service support to Regional unit through the formation of Suzlon Composite services ( SCS ) to address the blade servicing requirements. In India, the European Union and the United States of America a Blade Service Office is in place, and a 24 X 7 Composites Service Desk established.
• Formalization of Spare Management System.
Quality Excellence:
• P F M E A , P F D , Q C P p i l o t r u n , Q C P implementation at Mfg. Units.
• Supplier Quality Management.
– System based on preventive quality methodology and process.
– To bring First Time Right (FTR) product.
• Skill enhancement program.
• Focus on Employee Health & Safety.
Finance: Cost Leadership
• Inventory reduction through better planning and financial discipline.
• Aggressive inventory (slow/non-moving and blocked) reduction scheme to minimize Net Operating Working Capital (NOWC).
• Value engineering to achieve cost reduction.
Accelerating Change
• Standardised man hours and through put time.
• End-to-end waste assessment and waste reduction at plants.
• Significant improvements in Logistics to reduce costs and the transit damages.
• Leveraging SAP & IT tools.
Human Resources
• New matrix organization structure implemented at SCM with 4 verticals and 8 functional heads.
• Employee Engagement :
– Publication of Employee Magazine in manufacturing units.
– Organization of open forums for interaction with management.
– Career Development plan for middle management.
– Workshops on Effective Engagement.
– Recognition of employees periodically.
• Training Focus of the year:
– Supervisory Skills
– Process Orientation & Standardization
– Safe Working Culture
– Train the Trainer
ACE (Achieving Collective Excellence)
• Streamlining processes to Incorporate Design
MANUFACTURING AND SUPPLY CHAIN MANAGEMENT
16 Suzlon Energy Limited, Annual Report 2009-10

upgrades in products in the most efficient and cost-effective manner possible.
• Improving internal manufacturing & sourcing processes to support the on-time introduction of new products / variants.
• Implementing a 'Quick Win' program designed to extract benefits embedded in the system in terms of cost, quality, time & reliability.
The SCM team has set up its processes and systems to meet the challenge of ever changing business needs in a diverse and global market place.
Suzlon manufacturing facility in Puducherry, India

Operations,Maintenance
& Services
Suzlon wind farm at Ocotillo, USA

2009 continued to see Suzlon increase its global OMS foot print with operations in five continents. The company's flagship S88 fleet experienced substantial growth around the globe. The EU business ended the year with 11 S88 sites operating in 4 different countries. China now operates 10 sites with over 350 turbines installed. The United States and Australia nearly doubled their S88 fleets in 2009 while Suzlon's presence in India remains first within the country. Suzlon's market penetration continues with installations in Nicaragua, over 180 turbines in Brazil, with a presence in Sweden underway.
OMS Infrastructure & Personnel
Accompanying this rapid growth, Suzlon trained
and added over 200 OMS technicians worldwide.
Furthermore the company opened two new, highly
sophisticated Suzlon Monitoring Centers (SMC).
The first SMC is located in the US headquarters
Chicago office and opened in May 2009. The
second SMC became operational in February '10 at
the corporations' newly opened Pune campus, One
Earth. These centers will be able to monitor the
entire Suzlon fleet of over 7000 MW around the
world with back up capability between both
hemispheres. The Chicago facility already provides
24 x 7 support to over 2500 MW of clean,
renewable energy every day in Brazil, Nicaragua,
Spain, Portugal, Turkey and the United States.
One Earth is rapidly adding capability in
India and will continue to expand in the
coming year. OMS field technicians and
monitoring center specialist rotate
assignments to further improve
collaboration, processes, and overall
enterprise knowledge.
OPERATIONS, MAINTENANCE & SERVICES (OMS)
Safety & Quality
Suzlon introduced certification programs in the areas of fork lift, crane safety and working at height for manufacturing and Operation & Maintenance Service engineers. By adopting a BOT (Build Operate Transfer) approach Suzlon is able to scale up the safety intervention to reach out and improve compliance. The training interventions are followed by implementation through projects for effective and sustainable roll out.
The rapid growth and ever expanding OMS operating base further solidifies Suzlon's presence as one of the world's top supplier of wind turbines with our customers frequently commenting on how easy it is to do business with Suzlon.
Suzlon wind farm at Snowtown, AustraliaSuzlon wind farm at Snowtown, Australia
Suzlon Energy Limited, Annual Report 2009-10

Quality,Environment,Health &Safety
Suzlon wind farm at Pebble Springs, USA
Quality Management Vision
The Quality Management vision seeks to encompass the entire value system.
Quality management embodies Suzlon product design, production and manufacturing system and prescribes specific ways in which to establish quality system elements comprising of controlling product design, documentation, purchasing, defining production and process, defining and controlling inspection, measuring and test equipment, validating processes, product acceptance, controlling nonconforming product, instituting corrective and preventive action when errors occur, labeling and packaging controls, handling, storage, distribution and installation, records and statistical techniques. This is broadly overseen by strong management attention and Quality Audits.
QM Strategy to Reality
Suzlon QM stresses the need for continual monitoring through KPIs (Key Performance Indicators) monitoring, performance management and review systems. Suzlon QM organized a series of “Strategy to Reality Workshops” across its business verticals which helped it strategize detailed objectives. Stakeholders signed off on objectives and action plans which displays organization wide ownership towards quality, adherence and target achievements.
Quality Improvement Initiatives of 2009-10:
1. PDCA (Plan, Do, Check & Action):- It is an iterative problem-solving methodology which establishes a baseline for assessment and measurement of quality through documents taking care to choose areas which offer the most long-term benefit. This tool has helped in identification of repetitive nature of non conformances and initiation of action for improvement.
2. Process Failure Modes & Effects Analysis
(PFMEA):- PFMEA identifies root causes of failure embedded in processes, and subsequent QIP (Quality Improvement Programs), FMEA Kaizens as well as monitors and measures horizontal deployments.
3. Visual Guideline – Product Manuals:-Detailed visual guidelines with pictorial representations were designed to draw attention towards aesthetics of the product during product/ component inspection. Such visual guideline manuals have been designed for all the major components and are available to all quality inspectors and workshop personnel.
4. Supplier Quality Management (SQM):-Suzlon Quality Management embarked on another improvement journey of establishing long-term relationships with its suppliers / contractors on the basis that they should be able to share common interests and goals.
5. Skill Enhancement Program (SEP):-Through this program process wise skill, gaps and training needs for over 3500 technicians were successfully identified. The skill assessment included practical, theoretical and behavioral assessments. The process based training with identified trainers, training modules based on training calendar has been subsequently planned to reduce the skill gaps.
6. Q u a l i t y I m p r o v e m e n t – P r o g r a m
Management:- Iimprovement programs were identified in critical areas of operations. These initiatives are being managed as individual programs to fulfill the need for continual improvement involving a cross functional team and strong program management practices.
7. Management System Certifications (Quality,
Environment, Occupational Health &
Safety):- Suzlon is an ISO 9001:2008, ISO 14001:2004 and OHSAS 18001:2007 certified Company by DNV. Process, systems, documents are audited periodically by external agencies that help establish Suzlon's performance according to standards. Regular internal auditing programs (PDCA) form one of the metrics for determining the effectiveness of the existing quality system.
QUALITY MANAGEMENT
21Suzlon Energy Limited, Annual Report 2009-10
Corporate Social Responsibility
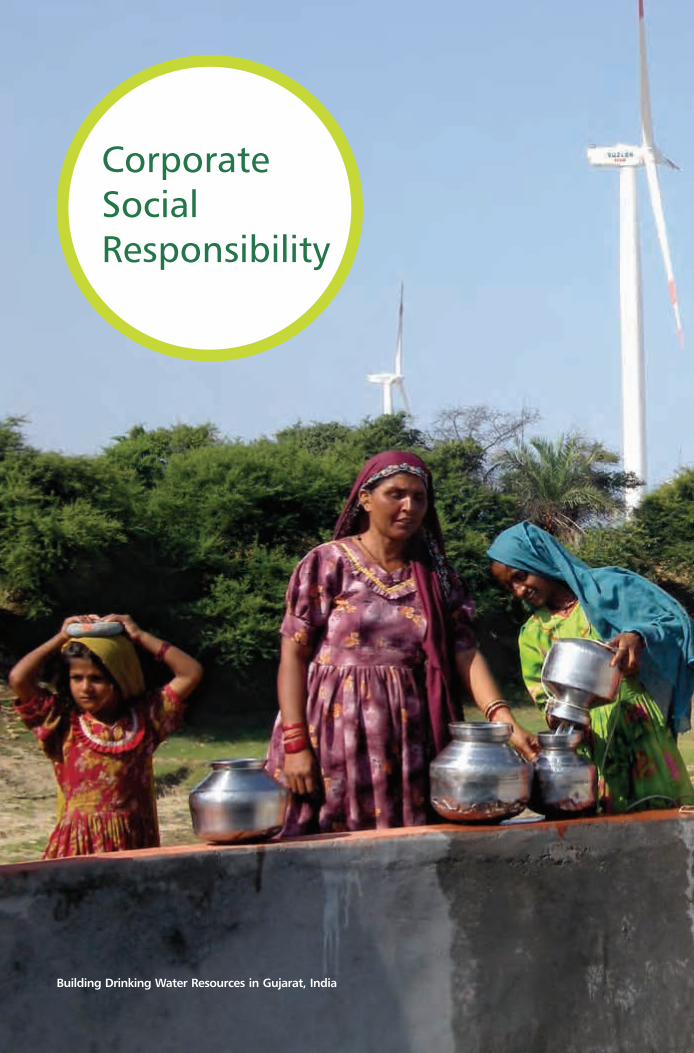
Building Drinking Water Resources in Gujarat, India
CORPORATE SOCIAL RESPONSIBILITY (CSR)Suzlon's CSR starts from within the company, engaging employees in internal projects, expanding to neighbouring communities and goes beyond business boundaries to benefit the society at large. The Suzlon Group has entrusted the Suzlon Foundation with the responsibility to facilitate CSR across all the functions and locations.
Transformative CSR interventions focus on raising the bar of ethical business standards. In 2009-10, CSR was actively involved in the following initiatives;
• Inclusion of key polices (for Prevention of Sexual Harassment, promoting diversity at workforce, HIV AIDS, Occupational health and safety).
• Integrating Corporate Citizenship in driving culture change management among the employees in Head Quarter.
• Facilitating 6 public hearings before setting up wind farms in Rajasthan and Maharashtra, wherein Suzlon engaged and responded to anxieties of advocates of community rights.
• Conducting transparent, multi stakeholder consultations in governance of CSR through active state level CSR councils Minimizing waste in manufacturing units by training of casual labour and initiating recycling of plastic waste in packaging.
• Giving priority to local vendors in consumable and food supplies to canteens.
• Composting kitchen and bio waste as garden manure.
• Channelizing voluntary social work by 1430 employees who contributed 2960 person days for a range of socially and environmentally beneficial activities.
• Donation of over 2500 blood bottles by employees across Suzlon in India.
• Setting up a process by which employees contribute to CSR activities.
Responsive CSR
Suzlon Foundation (SF) has supported 125 different projects with 32 Civil Society Organizations and collaborated with 13 Government departments. 90% of the Suzlon locations in India are covered by CSR programs.
Here is a gist of how CSR programs are strategically designed to enhance the resources around the business locations to contribute towards achievement of Millennium Development Goals (MDGs).
Proactive CSR
In 2009-10 Suzlon supported rescue and rehabilitation in two major disasters - floods in Gujarat and Karnataka. The rescue operation supported by Suzlon reached out to over a 1000 families. The rehabilitation work in Bihar flood affected areas started in 2007 was concluded this year in 35 villages for livestock health care. This initiative was supported by employee donations. Another important Proactive CSR initiative started in 2009-10 was supporting network of Climate Change Combating in South India. It consists of over 200 NGOs who will be integrated a concrete actions to help vulnerable sections of society cope better with climate changes.
25Suzlon Energy Limited, Annual Report 2009-10
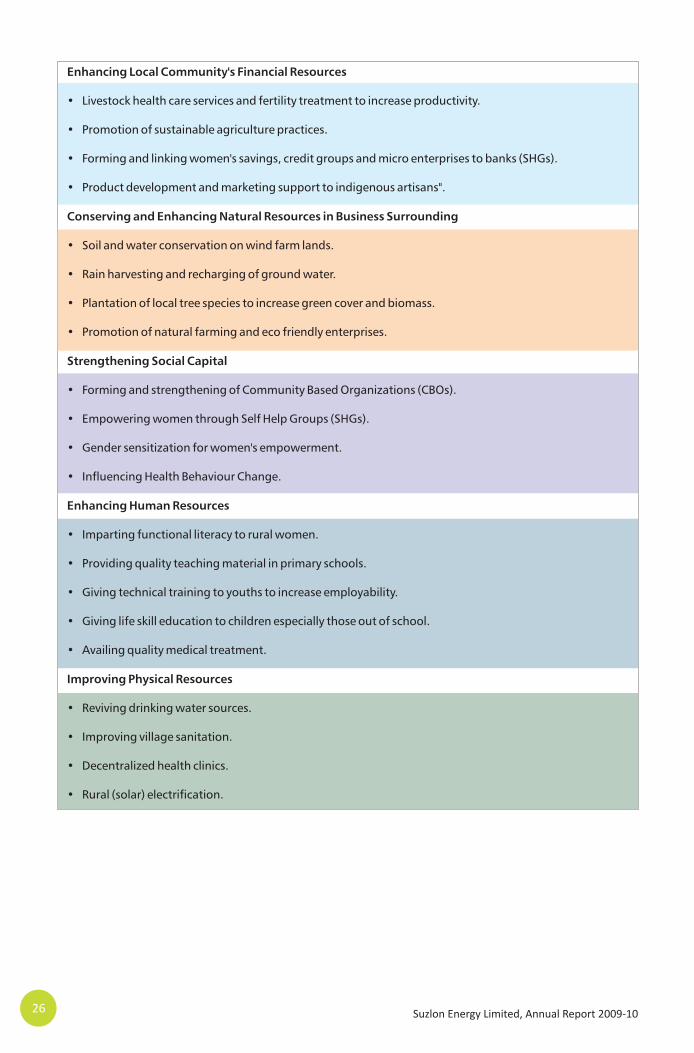
Enhancing Local Community's Financial Resources
•
• Promotion of sustainable agriculture practices.
• Forming and linking women's savings, credit groups and micro enterprises to banks (SHGs).
• Product development and marketing support to indigenous artisans".
Conserving and Enhancing Natural Resources in Business Surrounding
• Soil and water conservation on wind farm lands.
• Rain harvesting and recharging of ground water.
• Plantation of local tree species to increase green cover and biomass.
• Promotion of natural farming and eco friendly enterprises.
Strengthening Social Capital
• Forming and strengthening of Community Based Organizations (CBOs).
• Empowering women through Self Help Groups (SHGs).
• Gender sensitization for women's empowerment.
• Influencing Health Behaviour Change.
Enhancing Human Resources
• Imparting functional literacy to rural women.
• Providing quality teaching material in primary schools.
• Giving technical training to youths to increase employability.
• Giving life skill education to children especially those out of school.
• Availing quality medical treatment.
Improving Physical Resources
• Reviving drinking water sources.
• Improving village sanitation.
• Decentralized health clinics.
• Rural (solar) electrification.
Livestock health care services and fertility treatment to increase productivity.
26 Suzlon Energy Limited, Annual Report 2009-10
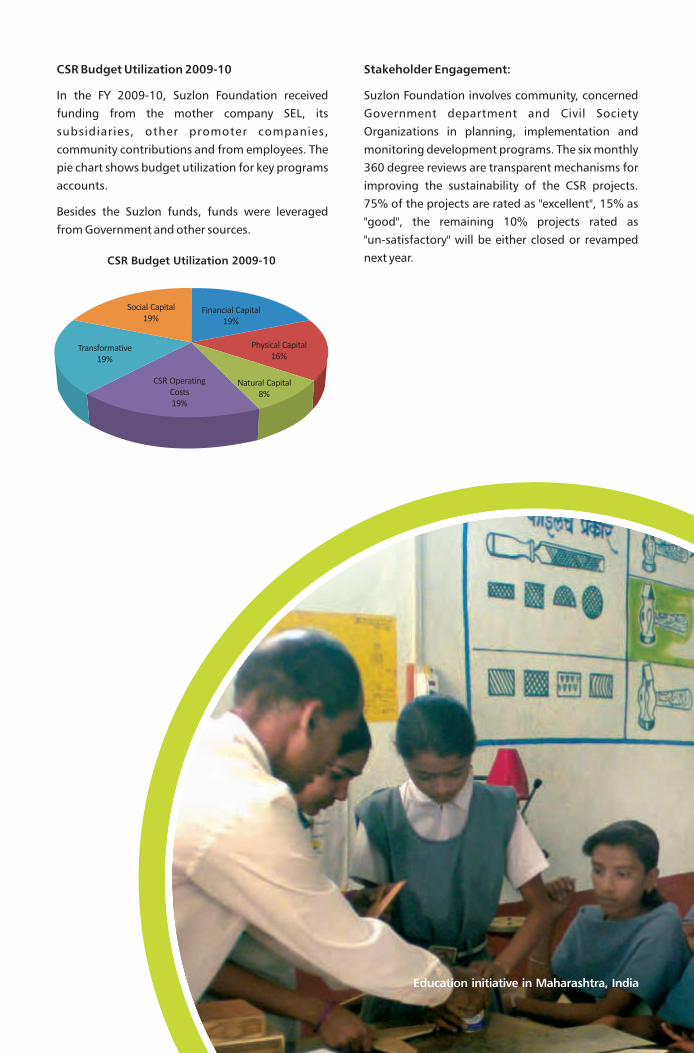
CSR Budget Utilization 2009-10
In the FY 2009-10, Suzlon Foundation received funding from the mother company SEL, its subsidiaries, other promoter companies, community contributions and from employees. The pie chart shows budget utilization for key programs accounts.
Besides the Suzlon funds, funds were leveraged from Government and other sources.
Stakeholder Engagement:
Suzlon Foundation involves community, concerned Government department and Civil Society Organizations in planning, implementation and monitoring development programs. The six monthly 360 degree reviews are transparent mechanisms for improving the sustainability of the CSR projects. 75% of the projects are rated as "excellent", 15% as "good", the remaining 10% projects rated as "un-satisfactory" will be either closed or revamped next year.
Education initiative in Maharashtra, India
Financial Capital19%
Physical Capital16%
Natural Capital8%
CSR Operating Costs19%
Transformative19%
Social Capital19%
CSR Budget Utilization 2009-10

Markets Suzlon wind farm at Snowtown, Australia
Suzlon Energy Limited & Group Companies - India OperationsSuzlon has maintained its leading position in the Indian Market, maintaining a nearly 50% market share for the last 11 years.
Suzlon continues to receive repeat orders from many of its clients, which broadly translates to more than 60% of the total order book.
Over the years Suzlon has consistently built a base for wind energy in India, with several Central and State public sector undertakings (PSUs). In FY10 Suzlon received prominent orders from Gujarat State Petronet Ltd, Rajasthan State Mines and Minerals Ltd, Gujarat Alkalies and Chemicals Ltd, State Bank of India and Gas authority of India Ltd .
During the year, Suzlon marketed its unique solution of wheeling the wind power for captive usage in the States of Gujarat, Maharashtra, Tamil Nadu and Karnataka.
Key Policy and Regulatory Developments
• Generation based incentives
The recently announced Generation Based Incentives (GBI) scheme for the renewable energy sector, links incentives to actual power generation. It will stimulate enhanced investment opportunities for Independent Power Producers, Special Economic Zones, and Export Oriented Units. Therefore, this policy comes as an additional alternative to the existing accelerated depreciation benefit.
•
The recent regulations enacted by Central Electricity Regulatory Commission (CERC) to rationalize the process of establishing tariff, is seen as a comprehensive and constructive step for furthering the growth of renewable energy sector in India. The regulations are deemed to put an end to the varying methodologies and assumptions (parameters) prevalent in different states, for calculating cost-plus tariff till this date and bring in the much needed assurance in the tariff frameworks for the years to come.
• Tariff increase in various states
The National Action Plan on Climate Change has levied a greater impetus on augmentation of the renewable energy capacities. Thus many State regulatory bodies revisited their feed-in tariffs in order to revive the investors' interest in wind energy. Rajasthan, Tamil Nadu, Karnataka, Maharashtra and Gujarat are the five major states which have taken the initiative to revise their tariffs upwards.
5GW Landmark Achievement in India
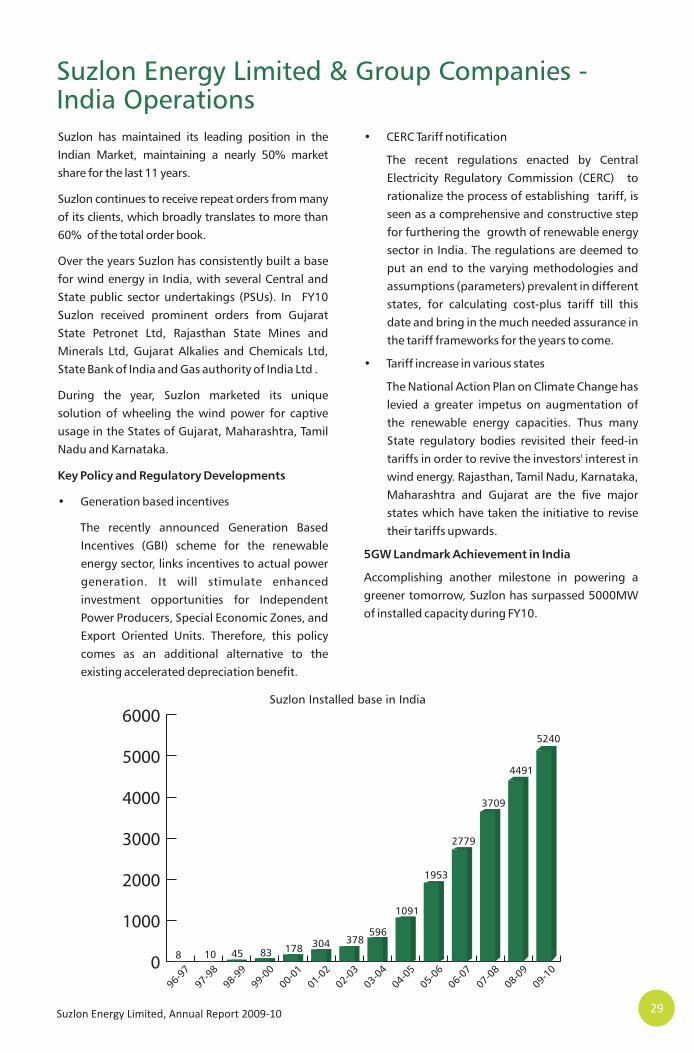
Accomplishing another milestone in powering a greener tomorrow, Suzlon has surpassed 5000MW of installed capacity during FY10.
CERC Tariff notification
Suzlon Installed base in India
29Suzlon Energy Limited, Annual Report 2009-10

Owing to the successful operation of Suzlon's 2.1 MW WTG in most of the overseas markets viz. USA, Europe and Australia, the product was successfully launched in India during FY10. It was received well by both new as well as existing customers and bagged orders of 168 MW in its debut year.
Key Communication Initiatives (events, awards,
recognitions)
Maintaining its focus on communication and awareness building initiatives, Suzlon participated in most major events related to renewable energy in India in FY10. Some of the major ones being, the Renewable Energy Expo in Delhi, CII's Energy Expo in Ahmedabad, ASSOCHAM's South Asia Renewable
Energy Conference in Delhi, Vidarbha Industries Association's Energy Summit in Nagpur, CII's Green Power Seminar in Chennai, IWPA's Conference on WE 20 by 2020 in Delhi and the Powergen Exhibition in Mumbai.
Significant Achievement in the Last Year
1. Launch of iCRMS on 27-Jun-2009 and implementation from 01-Jul-2009.
2. Inauguration of Suzlon Monitoring Center, Pune in February 2010.
3. Inauguration of Satara Knowledge Center in November 2009.
Suzlon wind farm at Dhule, India
Suzlon Energy Australia (SEA) -Australia OperationsSuzlon Energy Australia (SEA) is the leading turnkey constructor, operator and maintenance and service provider of grid connected wind farms in Australia.
Since commencing operations in mid 2004, SEA has contracted to deliver over 700 MW of wind energy projects.
Clients in Australia include leading utilities and independent power producers. This year, Suzlon has successfully secured repeat orders with a number of customers as a result of high quality work to date that sees projects delivered on time and to budget.
New Initiatives
Continuous improvement is part of the culture at SEA. SEA's Management System successfully achieved certification by Det Norske Vertias (DNV) to ISO9001 (Quality), ISO14001 (Environmental) and OHSAS 18001 (Safety) standards.
SEA began training the world's first wind apprentices in electro-technology in a pioneering partnership with Melbourne's RMIT University.
SEA developed and published a series of case studies identifying the many economic and social benefits of wind farming. In particular, the case studies highlighted the clean energy jobs potential of moving to a low carbon economy, which is of considerable interest to State and Federal Governments.
SEA is proud to be associated with Infigen Energy's launch of the Capital Wind Farm, officiated by the then Australian Prime Minister Kevin Rudd, who met with apprentices and praised the apprenticeship initiative in his speech.
Processes & Systems
In 2009, SEA began the transition of its organizational structure to a matrix system to ensure better scheduling, planning and utilization of our resources in the delivery of projects and service contracts.
The Organisational Matrix System defines the roles, responsibilities, rules and communication pathways of the business, which will provide the planning and loop back ability to co-ordinate projects across functional boundaries without compromising on functional excellence.
The broad-based scheduling system – a vital tool for project management allowing the business to optimise its skills and resources.
Integrated Information Management Systems
(SIMS) - effective information management is all about achieving a 'single version of the truth', a 'single point-of-access' and a 'single view'. The SIMS project approaches Information Management from an enterprise level rather than at the project level, based on a sound strategy, followed-up by effective governance, processes and architecture.
SEA aims at enhancing community engagement and CSR activities with the establishment of a
“Suzlon Community Fund”. This will provide support to organisations and community groups that work towards providing social, environmental and/or community benefits in their local region – in alignment with Suzlon's core values.
31Suzlon Energy Limited, Annual Report 2009-10

Suzlon Energia Eolica do Brazil Ltd. (SEOB) - Brazil OperationsSuzlon continued its successful foray into the Latin American market through its newest subsidiary – SEOB based in Fortaleza, Brazil. Brazil is the fastest growing wind market in Latin America with a government that is pushing through attractive renewable energy policies.
Key Regulatory Policies
A target of 20% electricity generation by 2025 has been announced. The last year has seen competitive bidding in the auctions for wind energy development rights. Further a stimulus grant of USD
2.5 billion has been announced in Brazil for renewable energy, bulk of which is expected to channel towards wind energy projects.
Initiatives & Acheivements in Brazil
With 395 MW currently installed in Brazil, Suzlon is a key player in the upcoming Brazilian market. Its turbines account for over 50% of all wind energy generated in Brazil. Currently, Suzlon has the privilege of the highest market share of installed capacity of wind power in Brazil.
Suzlon wind farm at Utah, USA
Suzlon Energy (Tianjin) Ltd. - China OperationsSuzlon continued to maintain its position among the top international Wind Turbine Equipment suppliers in China, with approximately 350 MW of turbines installed in the market in FY2009-10, and with the overall availability of Suzlon's units in service exceeding 97 percent. Suzlon's customers have included the country's leading IPP's, such as Datang, Guohua and Huaneng, as well as regional and private wind power project Developers.
Key Regulatory Developments
The Financial Year 2009-10 saw several major policy announcements affecting China's wind market. Two policies that were positioned and generally viewed as positive from a fair market perspective related to the establishment of fixed feed-in tariffs and the removal of China's 70% local content requirement. However, the actual market impact of these policies was limited as they largely formalized existing practice
The regulatory developments with the strongest and most immediate impact on the renewable energy sector were those dominated by the government's aim to combat overcapacity. Two examples of proposed regulatory measures to augment the entry/operational standards for the wind equipment manufacturing market were the March '10 draft on Entry Standards for the Wind Power Industry and the November '09 Notice regarding an Indigenous Innovation Product Accreditation Catalogue. Both these documents caused a strong response by foreign wind turbine manufacturers, who claimed that the draft measures were not in line with fair market practices and did not provide for a level playing field for foreign and domestic wind energy players.
New Initiatives and Achievements in China
To further strengthen Suzlon's position in the market, a number of initiatives have been undertaken this year to bring greater value to
customers and to support the development of favorable policy to nurture the development of a healthy domestic industry. Examples of initiatives and achievements include the following:
• Formation of dedicated account teams to serve our key clients in China.
• Investment in a 24/7 remote monitoring capability for the entire fleet of deployed turbines.
Suzlon was the leading participant in a number of key industry activities in 2009-10, including:
Summit/Conference
Cooperation between India & 15 April 2009China in the Renewable Energy
Sector
Renewable Energy Finance 12 May 2009Forum
Global Wind Power Conference, 21 Oct 2009Beijing
China Energy & Environment 2 Nov 2009Summit
Exhibitions
Power-GEN Asia 2009 7 Oct 2009
China Wind Power Conference 21 Oct 2009 & Exhibition
Additionally, Suzlon was a major sponsor of and contributor to community initiatives such as The Green Long March. Launched by Future Generations China and Beijing Forestry University in 2007, the Green Long March is China's largest and broadest s tudent - l ed ne twork fo r document ing environmental successes and extending best practices at the grassroots level. Last year, the Green Long March built leadership capacity among 5,000 youth, from 50 universities.
33Suzlon Energy Limited, Annual Report 2009-10
Suzlon Wind Energy A/S (SWEAS) - Europe OperationsSince its inception in Denmark, SWEAS has been an entry vehicle for Suzlon globally not only in the developed and demanding markets in Europe but also in the emerging and challenging markets in Africa, Latin America and other parts of the world.
2009 was a good year when SWEAS received two votes of confidence from its existing customers - in Turkey and in Nicaragua. The contract in Turkey was signed with Ayen and included delivery of 12 numbers S88 machines in 2010 and 15 numbers S88 machines in 2011. SWEAS also received a repeat order in Nicaragua. The contract was an EPC signed with Arctas and included delivery 11 numbers S88 machines that was delivered on a fast track in September 2009.
Apart from these repeat orders, SWEAS also entered Bulgaria and Sweden with their maiden projects this year. The project in Sweden is also the first time anywhere in the world when the Suzlon Group will be supplying the S88 with a 100 mt towers.
During 2009, in SWEAS 350 MWs went online – the highest since its inception in a single year. The first Suzlon projects in Turkey, Spain, Portugal, Bulgaria and Nicaragua has been successfully installed and handed over to the clients during the course of the year being reported. By the end of 2009, there were 123 turbines in commercial operation in 4 countries under service. Service, engineering, health-safety-environment and quality teams came together to ensure that the turbines exceed the performance levels promised to the customers through regular maintenance and upgrades.
These local set-ups in co-operation with the 24/7 remote surveillance of the turbines from Suzlon Monitoring Center in Chicago has resulted in a fleet operating with an average availability above 97 percent.
New Initiatives
This year SWEAS constituted a hub in the
Mediterranean region, the WindMed, to oversee and channelize operations in the region. The WindMed currently looks into the operations in Spain, Portugal and Italy.
As a part of building up markets, SWEAS is
implementing a Customer Relation Management System, which will support the sales activities and utilize the resources more efficiently.
Processes & Systems
Internally too, 2009 has been a challenging year for
SWEAS as the organization had to reshape the headcount and cost structure to adjust to the new business outlook. The entire management team was also recast to accommodate the new professionals joining in from within the group as well as from outside.
SWEAS also hosts function like Global Wind & Site, Global resources for the SCADA, Tower vertical, Blade technology, SAP etc. The professionals employed in these functions are world class and provide support to the entire Suzlon Global organization across the varied geographies.
Employees have done ground breaking research in the areas of turbulent loads in forested areas and calculations of extreme winds. This gives higher certainty in the estimation of suitability of our turbines in difficult site conditions. Internally, the SWEAS IT department is working on SCADA and 24/7 WTG alarm system, conditioning monitoring, global ticket system etc. to ensure smooth function of the organization. The Quality team at SWEAS has also taken up the initiative of obtaining the ISO certification for SWEAS.
34 Suzlon Energy Limited, Annual Report 2009-10
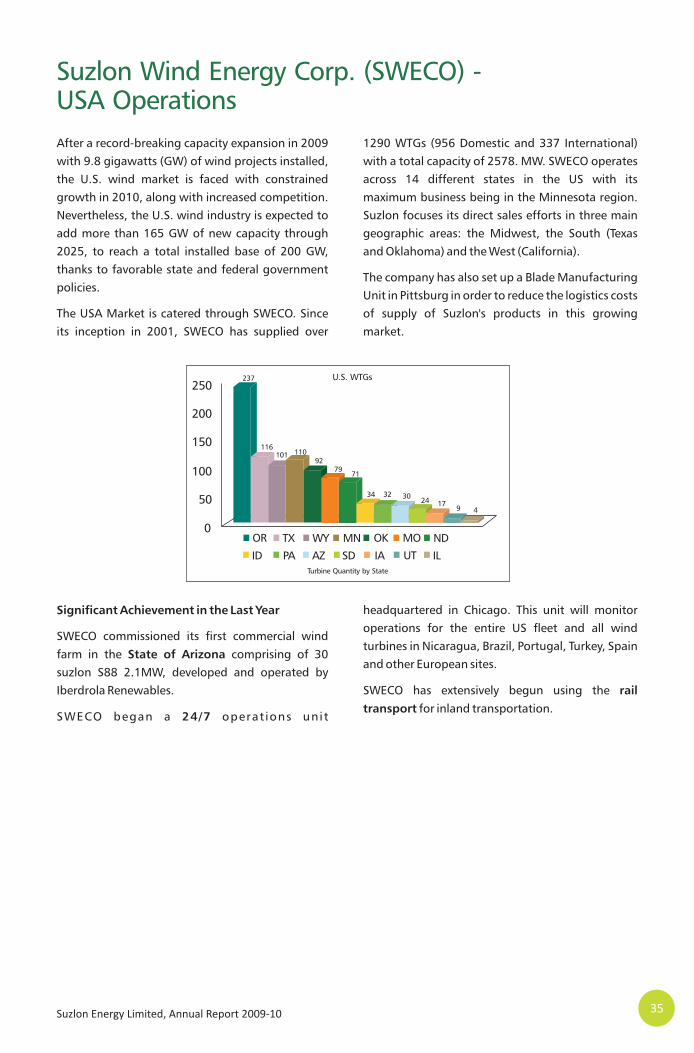
Suzlon Wind Energy Corp. (SWECO) -USA Operations After a record-breaking capacity expansion in 2009 with 9.8 gigawatts (GW) of wind projects installed, the U.S. wind market is faced with constrained growth in 2010, along with increased competition. Nevertheless, the U.S. wind industry is expected to add more than 165 GW of new capacity through 2025, to reach a total installed base of 200 GW, thanks to favorable state and federal government policies.
The USA Market is catered through SWECO. Since its inception in 2001, SWECO has supplied over
1290 WTGs (956 Domestic and 337 International) with a total capacity of 2578. MW. SWECO operates across 14 different states in the US with its maximum business being in the Minnesota region. Suzlon focuses its direct sales efforts in three main geographic areas: the Midwest, the South (Texas and Oklahoma) and the West (California).
The company has also set up a Blade Manufacturing Unit in Pittsburg in order to reduce the logistics costs of supply of Suzlon's products in this growing market.
Significant Achievement in the Last Year
SWECO commissioned its first commercial wind
farm in the State of Arizona comprising of 30 suzlon S88 2.1MW, developed and operated by
Iberdrola Renewables.
SWECO began a 24/7 operat ions unit
headquartered in Chicago. This unit will monitor operations for the entire US fleet and all wind turbines in Nicaragua, Brazil, Portugal, Turkey, Spain and other European sites.
SWECO has extensively begun using the rail
transport for inland transportation.
Turbine Quantity by State
250
200
150
100
50
0OR TX WY MN OK MO ND
PA AZ SD IA UT ILID
U.S. WTGs237
116101 110
9279
71
34 32 30 24 179 4
35Suzlon Energy Limited, Annual Report 2009-10


SECTION 2
*1 USD = Rs. 44.90 as on March 31, 2010 (1 USD = Rs. 50.71 as on March 31, 2009)
DIRECTORS' REPORTDear Shareholders,
thThe Directors present the 15 Annual Report of your Company together with the audited accounts for the financial year ended March 31, 2010.
FINANCIAL PERFORMANCE
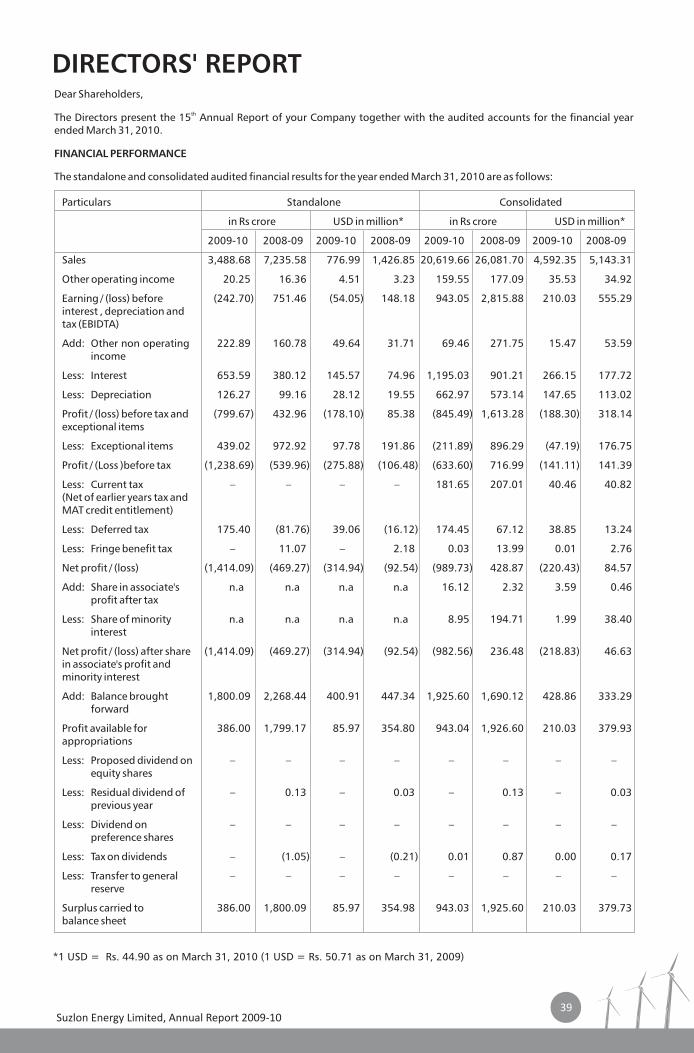
The standalone and consolidated audited financial results for the year ended March 31, 2010 are as follows:
Particulars Standalone Consolidated
in Rs crore USD in million* in Rs crore USD in million*
2009-10 2008-09 2009-10 2008-09 2009-10 2008-09 2009-10 2008-09
Sales 3,488.68 7,235.58 776.99 1,426.85 20,619.66 26,081.70 4,592.35 5,143.31
Other operating income 20.25 16.36 4.51 3.23 159.55 177.09 35.53 34.92
Earning / (loss) before (242.70) 751.46 (54.05) 148.18 943.05 2,815.88 210.03 555.29interest , depreciation and tax (EBIDTA)
Add: Other non operating 222.89 160.78 49.64 31.71 69.46 271.75 15.47 53.59income
Less: Interest 653.59 380.12 145.57 74.96 1,195.03 901.21 266.15 177.72
Less: Depreciation 126.27 99.16 28.12 19.55 662.97 573.14 147.65 113.02
Profit / (loss) before tax and (799.67) 432.96 (178.10) 85.38 (845.49) 1,613.28 (188.30) 318.14exceptional items
Less: Exceptional items 439.02 972.92 97.78 191.86 (211.89) 896.29 (47.19) 176.75
Profit / (Loss )before tax (1,238.69) (539.96) (275.88) (106.48) (633.60) 716.99 (141.11) 141.39
Less: Current tax – – – – 181.65 207.01 40.46 40.82(Net of earlier years tax and MAT credit entitlement)
Less: Deferred tax 175.40 (81.76) 39.06 (16.12) 174.45 67.12 38.85 13.24
Less: Fringe benefit tax – 11.07 – 2.18 0.03 13.99 0.01 2.76
Net profit / (loss) (1,414.09) (469.27) (314.94) (92.54) (989.73) 428.87 (220.43) 84.57
Add: Share in associate's n.a n.a n.a n.a 16.12 2.32 3.59 0.46profit after tax
Less: Share of minority n.a n.a n.a n.a 8.95 194.71 1.99 38.40interest
Net profit / (loss) after share (1,414.09) (469.27) (314.94) (92.54) (982.56) 236.48 (218.83) 46.63 in associate's profit and minority interest
Add: Balance brought 1,800.09 2,268.44 400.91 447.34 1,925.60 1,690.12 428.86 333.29forward
Profit available for 386.00 1,799.17 85.97 354.80 943.04 1,926.60 210.03 379.93 appropriations
Less: Proposed dividend on – – – – – – – –equity shares
Less: Residual dividend of – 0.13 – 0.03 – 0.13 – 0.03previous year
Less: Dividend on – – – – – – – –preference shares
Less: Tax on dividends – (1.05) – (0.21) 0.01 0.87 0.00 0.17
Less: Transfer to general – – – – – – – – reserve
Surplus carried to 386.00 1,800.09 85.97 354.98 943.03 1,925.60 210.03 379.73balance sheet
Suzlon Energy Limited, Annual Report 2009-1039
OPERATIONS REVIEW
On a standalone basis, the Company achieved sale of Rs. 3,489 crore as against Rs.7,236 crore in the previous year. Net loss after tax stood at Rs. (1,414) crore as compared to net loss after tax of Rs.(469) crore in the previous year. The loss in current year was on account of low volumes coupled with expenditure of exceptional nature, amounting to Rs. 439 crore as referred in Schedule P, Note 2 of the standalone financials.
On consolidated basis, the sale is Rs. 20,620 crore as against Rs. 26,082 crore in the previous year. Net loss after tax, share in associate's profit and minority interest is Rs. (983) crore as compared to profit of Rs. 236 crore in the previous year.
DIVIDEND
In view of loss in the current year, the Board of Directors do not recommend any dividend for the year ended March 31, 2010.
CAPITAL
During the year under review, the Company issued 5,84,00,000 equity shares of Rs. 2 each at a premium of Rs. 87.55 per equity share underlying 1,46,00,000 Global Depository Receipts (GDRs) each GDR representing 4 equity shares raising a total of USD 108.04 million.
Further, the Company allotted 12,343 equity shares of Rs. 2 each at a premium of Rs. 74.74 per equity share pursuant to conversion of FCCBs and 24,000 equity shares of Rs. 2 each at a premium of Rs. 49 per equity share pursuant to exercise of stock options by the eligible employees under the Employee Stock Option Plan-2005. Post March 31, 2010, the Company allotted 8,000 equity shares of Rs.2 each at a premium of Rs.49 per equity share pursuant to exercise of stock options by the eligible employees under the Employee Stock Option Plan-2005.
As on date, the authorised share capital of the Company is Rs. 445,00,00,000/- (Rupees four hundred forty five crore only) divided into 222,50,00,000 (Two hundred twenty two crore fifty lacs) equity shares of Rs. 2/- (Rupees two only) each and the paid-up capital of the Company is Rs. 311,34,79,486/- (Rupees three hundred eleven crore thirty four lacs seventy nine thousand four hundred eighty six only) divided into 155,67,39,743 (One hundred fifty five crore sixty seven lacs thirty nine thousand seven hundred forty three) equity shares of Rs. 2/- (Rupees two only) each.
During the year under review the Company made an issue of Zero Coupon Convertible Bonds due 2014 for USD 93.87 million (approximately Rs.452.64 crore) at an issue price of 104.30% of the principal amount of USD 90 million.
PARTICULARS OF CONSERVATION OF ENERGY, RESEARCH AND DEVELOPMENT, TECHNOLOGY ABSORPTION AND FOREIGN EXCHANGE EARNINGS AND OUTGO
Information as required under Section 217(1)(e) of the Companies Act, 1956 read with the Companies (Disclosure of particulars in the report of board of directors) Rules, 1988, has been provided as Annexure I which forms part of the Directors' Report.
SUBSIDIARIES AND CONSOLIDATED FINANCIAL STATEMENTS
The existing domestic and international subsidiaries continued to perform satisfactorily during the year under review.
A. Domestic subsidiaries
During the year under review, Shubh Realty (Gujarat) Private Limited became a wholly owned subsidiary of Suzlon Infrastructure Services Limited and, in turn, became a step-down subsidiary of the Company. Subsequently Shubh Realty (Gujarat) Private Limited was converted into public limited Company and its name was changed to SISL Green Infra Limited.
The name of SE Solar Private Limited was changed to SE Solar Limited consequent to its conversion into public limited Company.
B. Overseas subsidiaries
During the year under review RPW Investments, SGPS, S.A., Valum Holding B.V., Suzlon Wind Energy Bulgaria EOOD, Suzlon Wind Energy BH – Bosnia, Suzlon Energy Australia RWFD Pty Ltd, Einundzwanzigste Vittorio Verwaltungs GmbH, Age Pargue Eolico EL Almendro, S.L. REpower Rep Ventures Portugal S.A. became subsidiaries of the Company.
The Company through its subsidiaries acquired an additional 16.85% stake of REpower Systems AG ('REpower') thereby increasing its holding in REpower to 90.50% as on March 31, 2010.
The Company's share holding through its subsidiary in Hansen Transmissions International NV ('Hansen') has reduced to 26.06% and it ceased to be a subsidiary of the Company, subsequent to sale of 35.22% in Hansen.
C. Consolidated financial statements
Ministry of Corporate Affairs, Government of India has granted approval under Section 212 (8) of the Companies Act, 1956 that the requirement to attach various documents in respect of subsidiary companies, as set out in Sub-Section (1) of Section 212 of the Companies Act, 1956, shall not apply to the Company. Accordingly, the balance sheet, profit and loss account and other documents of the subsidiary companies are not being attached with the balance sheet of the Company. However financial information of the subsidiary companies, as required by the said approval, is disclosed in the Annual Report. The annual accounts of the subsidiary companies and the related detailed information will be made
40Suzlon Energy Limited, Annual Report 2009-10
41Suzlon Energy Limited, Annual Report 2009-10
available to any member of the Company / its subsidiaries, who may be interested in obtaining the same. The annual accounts of the subsidiary companies will also be kept for inspection by any member at the Company’s Registered Office and Corporate Office, and that of the respective subsidiary companies.
The Annual Report of the Company contains the consolidated audited financial statements prepared pursuant to Clause 41 of the listing agreement entered into with the stock exchanges and prepared in accordance with the accounting standards prescribed by the Institute of Chartered Accountants of India (ICAI).
PARTICULARS OF EMPLOYEES
In terms of the provisions of Section 217(2A) of the Companies Act, 1956, read with the Companies (Particulars of Employees) Rules, 1975 as amended, the names and other particulars of the employees are required to be set out in the annexure to the directors' report. However, as per the provisions of Section 219(1)(b)(iv) of the said Act, the Annual Report excluding the aforesaid information is being sent to all the members of the Company and others entitled thereto. Any member interested in obtaining such particulars may write to the Company Secretary at the Corporate Office of the Company.
DIRECTORS
Mr. Pradip Kumar Khaitan and Mr. Ashish Dhawan, the Non-Executive Independent Directors of the Company retire by rotation at the ensuing Annual General Meeting and being eligible offer themselves for re-appointment. As stipulated in terms of Clause 49 of the listing agreement with the stock exchanges, the brief resume of Mr. Pradip Kumar Khaitan and Mr.
thAshish Dhawan, is provided in the Notice convening the 15 Annual General Meeting of the Company.
DIRECTORS' RESPONSIBILITY STATEMENT
Pursuant to Section 217(2AA) of the Companies Act, 1956, the Directors confirm to the best of their knowledge and belief that :
a. In the preparation of the annual accounts, the applicable accounting standards have been followed and there are no material departures;
b. They have selected such accounting policies and applied them consistently and made judgements and estimates that are reasonable and prudent so as to give a true and fair view of the state of affairs of the Company as at March 31, 2010, and of the loss of the Company for the year ended on that date;
c. They have taken proper and sufficient care for the maintenance of adequate accounting records in accordance with the provisions of Companies Act, 1956. They confirm that there are adequate systems and controls for safeguarding the assets of the Company, and for preventing and detecting fraud and other irregularities; and
d. They have prepared the annual accounts on a going concern basis.
PUBLIC DEPOSITS
During the year under review, the Company did not accept any deposits within the meaning of the provisions of Section 58A of the Companies Act, 1956.
MANAGEMENT DISCUSSION AND ANALYSIS
The Management Discussion and Analysis Report on the operations and financial position of the Company has been provided as Annexure II which forms part of the Directors' Report.
CORPORATE GOVERNANCE REPORT AND GENERAL SHAREHOLDER INFORMATION
As required by Clause 49 (VI) of the listing agreement entered into by the Company with the stock exchanges, a detailed report on Corporate Governance is provided as Annexure III which forms part of the Directors' Report. The General Shareholders Information has been provided as Annexure IV which forms part of the Directors' Report. The Company is in compliance with the requirements and disclosures that have to be made in this regard. The auditors' certificate on compliance with corporate governance requirements by the Company is attached to the Corporate Governance Report and forms part of the Directors' Report.
EMPLOYEES STOCK OPTION PLANS (ESOPs)
As required under the Securities and Exchange Board of India (Employee Stock Option Scheme and Employee Stock Purchase Scheme) Guidelines, 1999, the information pertaining to various Employee Stock Option Plans (ESOPs) of the Company has been provided as Annexure V which forms part of the Directors' Report.
GROUP
Pursuant to intimation from the Promoters, the name of the Promoters and entities comprising the 'Group' as defined under the Monopolies and Restrictive Trade Practices (“MRTP”) Act, 1969, have been provided as Annexure VI which forms part of the Directors' Report.
HEALTH & SAFETY
The Company along with Suzlon Foundation conducted various programmes concerning disaster preparedness, awareness towards HIV AIDS, occupational health and safety of labour.
Programmes towards minimizing waste in manufacturing units were carried out. For instance, kitchen waste was used as green manure for gardening.
AUDITORS AND AUDITORS' REPORT
M/s. SNK & Co., Chartered Accountants, Pune, and M/s. S.R. Batliboi & Co., Chartered Accountants, Pune, the joint statutory auditors of the Company hold office until the conclusion of the ensuing annual general meeting of the Company. Both the statutory auditors have confirmed their eligibility and willingness to accept office, if re-appointed.
Information and explanation on remarks in the Auditors' Report
I) In respect of auditors observation regarding certain delay in repayment of dues to financial institutions, banks and debenture holders, it is clarified that the delay in payment of dues was temporary in nature arising from mismatches in cash – flows which are attributable to the then prevailing uncertain economic environment that adversely impacted business volumes, and delay in timely realization of receivables from our customers. Besides, implementation delays encountered in debt consolidation and refinancing arrangements, further constrained our liquidity situation. As at March 31, 2010, there were no delays, and all previous delays were duly rectified.
ii) Delay in a few cases in depositing statutory dues, arose on account of transactional complexity primarily arising from the lack of timely receipt of information from far off places due to geographical spread of our business operations, which were all subsequently rectified.
iii) Cash losses incurred by the Company in the previous year was mainly attributable to the difficult global economic environment that adversely impacted business volume and product pricing, adverse foreign exchange movement, lower absorption of fixed overheads and higher finance charges primarily due to delayed collections from customers and cost of debt consolidation and refinancing arrangement.
ACKNOWLEDGEMENT
The Directors wish to place on record their appreciation for the co-operation and support received from the government and semi-government agencies, especially from the Ministry of Non-conventional Energy Sources (MNES), all state level nodal agencies and all state electricity boards.
The Directors are thankful to all the bankers and financial institutions for their support to the Company. The Board places on record its appreciation for continued support provided by the esteemed customers, suppliers, consultants and shareholders.
The Directors also acknowledge the hard work, dedication and commitment of the employees. The enthusiasm and unstinting efforts of the employees have enabled the Company to continue to be a leading player in the wind industry.
For and on behalf of the Board of Directors of
Suzlon Energy Limited
Place: Mumbai Tulsi R.Tanti
Date: May 29, 2010 Chairman & Managing Director
Suzlon Energy Limited, Annual Report 2009-1042
43Suzlon Energy Limited, Annual Report 2009-10
ANNEXURE I to the Directors’ Report
PARTICULARS OF CONSERVATION OF ENERGY, RESEARCH AND DEVELOPMENT, TECHNOLOGY ABSORPTION AND FOREIGN EXCHANGE EARNINGS AND OUTGO –
Information as required under Section 217(1)(e) of the Companies Act, 1956, read with the Companies (Disclosure of particulars in the report of board of directors) Rules, 1988, are set out hereunder.
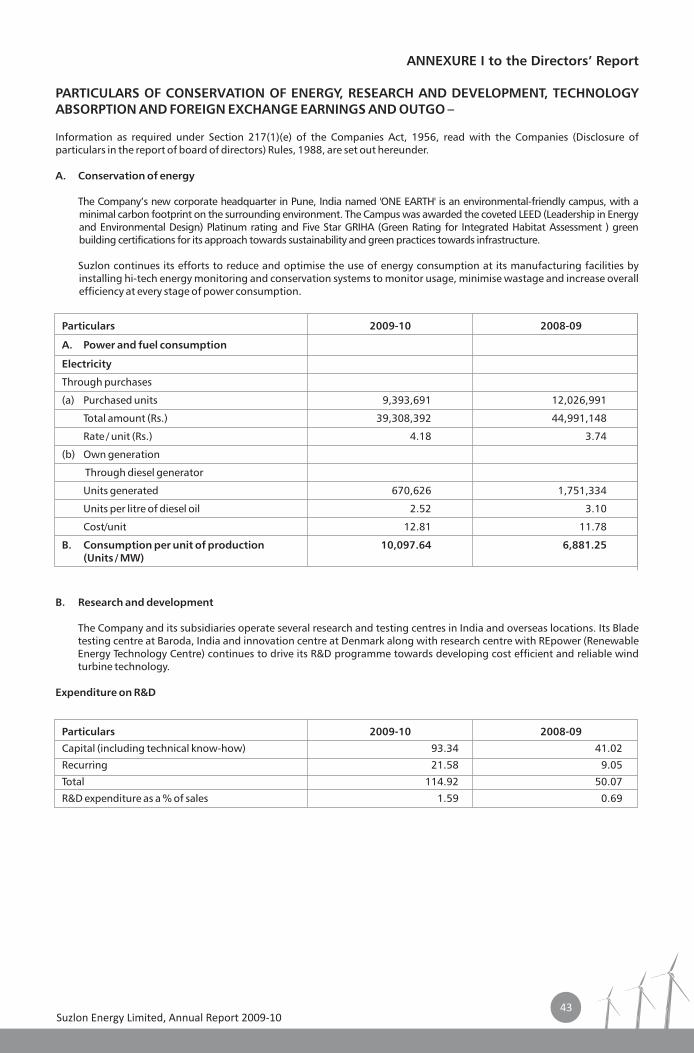
A. Conservation of energy
The Company’s new corporate headquarter in Pune, India named 'ONE EARTH' is an environmental-friendly campus, with a minimal carbon footprint on the surrounding environment. The Campus was awarded the coveted LEED (Leadership in Energy and Environmental Design) Platinum rating and Five Star GRIHA (Green Rating for Integrated Habitat Assessment ) green building certifications for its approach towards sustainability and green practices towards infrastructure.
Suzlon continues its efforts to reduce and optimise the use of energy consumption at its manufacturing facilities by installing hi-tech energy monitoring and conservation systems to monitor usage, minimise wastage and increase overall efficiency at every stage of power consumption.
Particulars 2009-10 2008-09
A. Power and fuel consumption
Electricity
Through purchases
(a) Purchased units 9,393,691 12,026,991
Total amount (Rs.) 39,308,392 44,991,148
Rate / unit (Rs.) 4.18 3.74
(b) Own generation
Through diesel generator
Units generated 670,626 1,751,334
Units per litre of diesel oil 2.52 3.10
Cost/unit 12.81 11.78
B. Consumption per unit of production 10,097.64 6,881.25(Units / MW)
B. Research and development
The Company and its subsidiaries operate several research and testing centres in India and overseas locations. Its Blade testing centre at Baroda, India and innovation centre at Denmark along with research centre with REpower (Renewable Energy Technology Centre) continues to drive its R&D programme towards developing cost efficient and reliable wind turbine technology.
Expenditure on R&D
Particulars 2009-10 2008-09
Capital (including technical know-how) 93.34 41.02
Recurring 21.58 9.05
Total 114.92 50.07
R&D expenditure as a % of sales 1.59 0.69
44Suzlon Energy Limited, Annual Report 2009-10
C. Technology absorption, adoption and innovation
Efforts towards technology absorption, adoption and innovation are briefly noted below:
a Initiatives like Kaizen, Six Sigma, O&M studies have helped in improving productivity and innovation.
b Certification from reputed institutions for design and manufacture of WTG's and rotor blades.
c In-house technology campus for improving product quality.
d Participated in Renewable Energy Expo in Delhi, CII's Energy Expo in Ahmedabad, ASSOCHAM's South Asia Renewable Energy Conference in Delhi, CII's Green Power Seminar in Chennai, IWPA's Conference on WE 20 by 2020 in Delhi. The Powergen Exhibition in Mumbai and various other national/international conferences, seminars and exhibitions.
e Improvement of product quality through use of state-of-the-art equipments and acting on customer feedbacks. The steps taken are as follows:-
• Launch of iCRMS on 27-Jun-2009 and implementation from 01-Jul-2009
• Inauguration of Suzlon Monitoring Centre, Pune on 02-Feb-2010
• Inauguration of Satara Knowledge Centre on 03-Nov-2009
These initiatives have resulted in improved product performance and customer satisfaction.
D. Foreign exchange earnings and outgo
Total foreign exchange earned by the Company during the year under review was Rs. 1,103.93 crore , compared to Rs. 4,111.56 crore during the previous year. Total foreign exchange outgo during the year under review was Rs. 1,716.27 crore, compared to Rs. 3,754.13 crore during the previous year.
Suzlon Energy Limited, Annual Report 2009-10
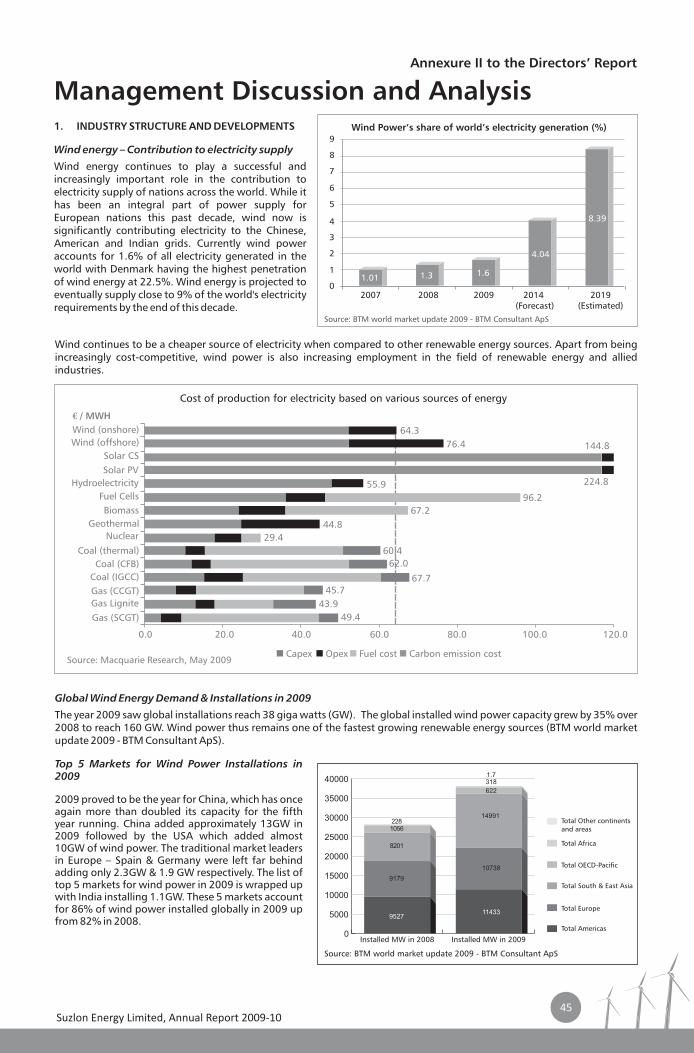
Capex Opex Fuel cost Carbon emission cost
Cost of production for electricity based on various sources of energy
Wind (onshore)Wind (offshore)
Solar CSSolar PV
Hydroelectricity Fuel CellsBiomass
GeothermalNuclear
Coal (thermal)Coal (CFB)
Coal (IGCC)Gas (CCGT)Gas LigniteGas (SCGT)
0.0 20.0 40.0 60.0 80.0 100.0 120.0
64.376.4 144.8
224.8
96.255.9
67.244.8
29.460.4
62.0
67.745.7
43.949.4
€ / MWH
Source: Macquarie Research, May 2009
Annexure II to the Directors’ Report
Management Discussion and Analysis1. INDUSTRY STRUCTURE AND DEVELOPMENTS
Wind energy – Contribution to electricity supply
Wind energy continues to play a successful and increasingly important role in the contribution to electricity supply of nations across the world. While it has been an integral part of power supply for European nations this past decade, wind now is significantly contributing electricity to the Chinese, American and Indian grids. Currently wind power accounts for 1.6% of all electricity generated in the world with Denmark having the highest penetration of wind energy at 22.5%. Wind energy is projected to eventually supply close to 9% of the world's electricity requirements by the end of this decade.
Wind continues to be a cheaper source of electricity when compared to other renewable energy sources. Apart from being increasingly cost-competitive, wind power is also increasing employment in the field of renewable energy and allied industries.
Global Wind Energy Demand & Installations in 2009
The year 2009 saw global installations reach 38 giga watts (GW). The global installed wind power capacity grew by 35% over 2008 to reach 160 GW. Wind power thus remains one of the fastest growing renewable energy sources (BTM world market update 2009 - BTM Consultant ApS).
Top 5 Markets for Wind Power Installations in 2009
2009 proved to be the year for China, which has once again more than doubled its capacity for the fifth year running. China added approximately 13GW in 2009 followed by the USA which added almost 10GW of wind power. The traditional market leaders in Europe – Spain & Germany were left far behind adding only 2.3GW & 1.9 GW respectively. The list of top 5 markets for wind power in 2009 is wrapped up with India installing 1.1GW. These 5 markets account for 86% of wind power installed globally in 2009 up from 82% in 2008.
Total Other continents and areas
Total Africa
Total OECD-Pacific
Total South & East Asia
Total Europe
Total Americas
Installed MW in 2009Installed MW in 2008
Source: BTM world market update 2009 - BTM Consultant ApS
45
0
Wind Power’s share of world’s electricity generation (%)9
8
7
6
5
4
3
2
1
2007 2008 2009 2014 (Forecast)
2019(Estimated)
1.01 1.3 1.6
4.04
8.39
Source: BTM world market update 2009 - BTM Consultant ApS
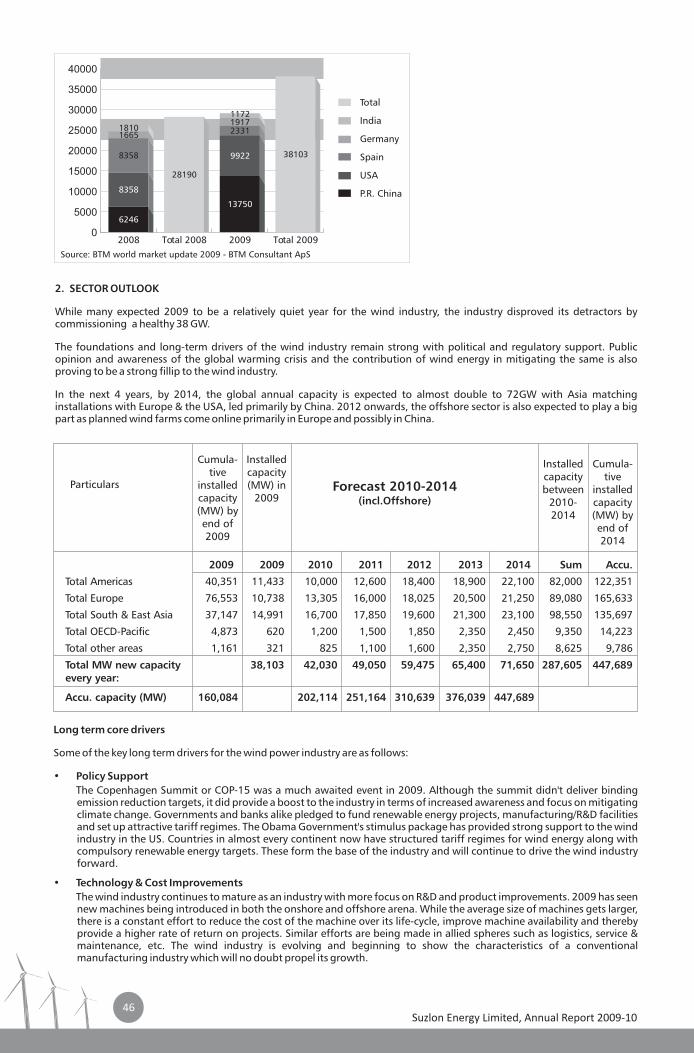
Suzlon Energy Limited, Annual Report 2009-10
2. SECTOR OUTLOOK
While many expected 2009 to be a relatively quiet year for the wind industry, the industry disproved its detractors by commissioning a healthy 38 GW.
The foundations and long-term drivers of the wind industry remain strong with political and regulatory support. Public opinion and awareness of the global warming crisis and the contribution of wind energy in mitigating the same is also proving to be a strong fillip to the wind industry.
In the next 4 years, by 2014, the global annual capacity is expected to almost double to 72GW with Asia matching installations with Europe & the USA, led primarily by China. 2012 onwards, the offshore sector is also expected to play a big part as planned wind farms come online primarily in Europe and possibly in China.
Long term core drivers
Some of the key long term drivers for the wind power industry are as follows:
• Policy Support
The Copenhagen Summit or COP-15 was a much awaited event in 2009. Although the summit didn't deliver binding emission reduction targets, it did provide a boost to the industry in terms of increased awareness and focus on mitigating climate change. Governments and banks alike pledged to fund renewable energy projects, manufacturing/R&D facilities and set up attractive tariff regimes. The Obama Government's stimulus package has provided strong support to the wind industry in the US. Countries in almost every continent now have structured tariff regimes for wind energy along with compulsory renewable energy targets. These form the base of the industry and will continue to drive the wind industry forward.
• Technology & Cost Improvements
The wind industry continues to mature as an industry with more focus on R&D and product improvements. 2009 has seen new machines being introduced in both the onshore and offshore arena. While the average size of machines gets larger, there is a constant effort to reduce the cost of the machine over its life-cycle, improve machine availability and thereby provide a higher rate of return on projects. Similar efforts are being made in allied spheres such as logistics, service & maintenance, etc. The wind industry is evolving and beginning to show the characteristics of a conventional manufacturing industry which will no doubt propel its growth.
2009 2009 2010 2011 2012 2013 2014 Sum Accu.
Total Americas 40,351 11,433 10,000 12,600 18,400 18,900 22,100 82,000 122,351
Total Europe 76,553 10,738 13,305 16,000 18,025 20,500 21,250 89,080 165,633
Total South & East Asia 37,147 14,991 16,700 17,850 19,600 21,300 23,100 98,550 135,697
Total OECD-Pacific 4,873 620 1,200 1,500 1,850 2,350 2,450 9,350 14,223
Total other areas 1,161 321 825 1,100 1,600 2,350 2,750 8,625 9,786
Total MW new capacity 38,103 42,030 49,050 59,475 65,400 71,650 287,605 447,689every year:
Accu. capacity (MW) 160,084 202,114 251,164 310,639 376,039 447,689
Cumula-tive
installed capacity (MW) by end of 2009
Installed capacity (MW) in
2009
Installed capacity between
2010-2014
Cumula-tive
installed capacity (MW) by end of 2014
Forecast 2010-2014(incl.Offshore)
Particulars
Total
India
Germany
Spain
USA
P.R. China
Total 2008 Total 20092008 2009
6246
8358
8358
16651810
19172331
9922
13750
1172
28190
38103
Source: BTM world market update 2009 - BTM Consultant ApS
46
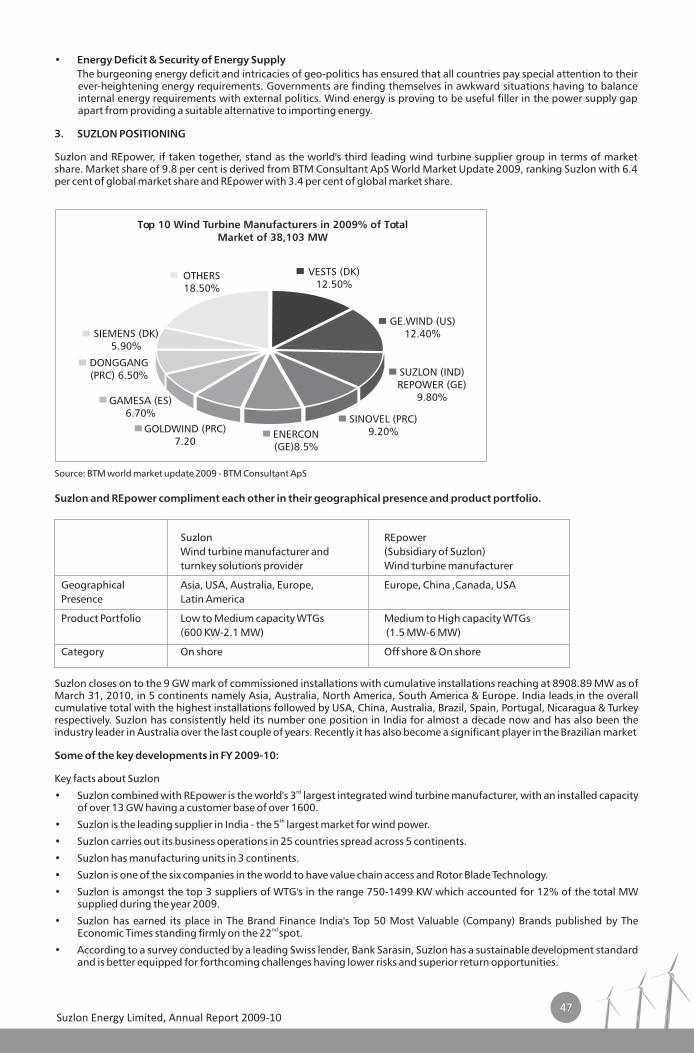
Suzlon Energy Limited, Annual Report 2009-10
Top 10 Wind Turbine Manufacturers in 2009% of TotalMarket of 38,103 MW
•
The burgeoning energy deficit and intricacies of geo-politics has ensured that all countries pay special attention to their ever-heightening energy requirements. Governments are finding themselves in awkward situations having to balance internal energy requirements with external politics. Wind energy is proving to be useful filler in the power supply gap apart from providing a suitable alternative to importing energy.
3. SUZLON POSITIONING
Suzlon and REpower, if taken together, stand as the world's third leading wind turbine supplier group in terms of market share. Market share of 9.8 per cent is derived from BTM Consultant ApS World Market Update 2009, ranking Suzlon with 6.4 per cent of global market share and REpower with 3.4 per cent of global market share.
Energy Deficit & Security of Energy Supply
Source: BTM world market update 2009 - BTM Consultant ApS
Suzlon and REpower compliment each other in their geographical presence and product portfolio.
Suzlon Wind turbine manufacturer and (Subsidiary of Suzlon)turnkey solutions provider Wind turbine manufacturer
Geographical Asia, USA, Australia, Europe, Europe, China ,Canada, USAPresence Latin America
Product Portfolio Low to Medium capacity WTGs Medium to High capacity WTGs(600 KW-2.1 MW) (1.5 MW-6 MW)
Category On shore Off shore & On shore
REpower
Suzlon closes on to the 9 GW mark of commissioned installations with cumulative installations reaching at 8908.89 MW as of March 31, 2010, in 5 continents namely Asia, Australia, North America, South America & Europe. India leads in the overall cumulative total with the highest installations followed by USA, China, Australia, Brazil, Spain, Portugal, Nicaragua & Turkey respectively. Suzlon has consistently held its number one position in India for almost a decade now and has also been the industry leader in Australia over the last couple of years. Recently it has also become a significant player in the Brazilian market
Some of the key developments in FY 2009-10:
Key facts about Suzlon
• Suzlon combined with REpower is the world's 3 largest integrated wind turbine manufacturer, with an installed capacity of over 13 GW having a customer base of over 1600.
th• Suzlon is the leading supplier in India - the 5 largest market for wind power.
• Suzlon carries out its business operations in 25 countries spread across 5 continents.
• Suzlon has manufacturing units in 3 continents.
• Suzlon is one of the six companies in the world to have value chain access and Rotor Blade Technology.
• Suzlon is amongst the top 3 suppliers of WTG's in the range 750-1499 KW which accounted for 12% of the total MW supplied during the year 2009.
• Suzlon has earned its place in The Brand Finance India's Top 50 Most Valuable (Company) Brands published by The nd Economic Times standing firmly on the 22 spot.
• According to a survey conducted by a leading Swiss lender, Bank Sarasin, Suzlon has a sustainable development standard and is better equipped for forthcoming challenges having lower risks and superior return opportunities.
rd
47
New market avenues
•
• Suzlon bagged its first order of 12.6 MW in Bulgaria.
• Suzlon turbines power the first commercial scale wind farm of Arizona (USA) having a capacity of 63 MW.
• Suzlon entered the Scandinavian region by inking an order of 4.2 MW in Sweden.
• Suzlon opened the Infigen Energy's Capital Wind Farm in Australia which has a total capacity of 141 MW.
• Suzlon received a 15 MW order from State Bank of India, India's premier banking institution, for the Indian Banking Sector's maiden foray in Wind Energy.
• Suzlon's maiden Project in Sri Lanka of 10 MW was formally inaugurated.
• Suzlon signed an MoU with the Maldives government for setting up a Windpark with 25 MW capacity.
• REpower bagged an order worth €2.2 million for offshore wind farm, the largest order for this industry till date.
Awards & Recognition
• Suzlon was awarded the prestigious All India Export Excellence Award for highest exports of thrust products.
• Suzlon was presented with for its excellence in the field of learning ASTD - BEST award 2009.
• Asian Broadcasting Union (ABU), conferred the best 'Climate Change reporting award for 2009' to 'Save the Ice' an episode of Eco Solutions, the Suzlon CNN programme.
• Suzlon was bestowed with the Premier Trading House status by the Joint Director General Foreign Trade, Pune, Ministry of Commerce & Industry, Government of India.
• Suzlon was awarded the United States Environmental Protection Agency (EPA) recognition.
• Mr. Tulsi R Tanti, Chairman & Managing Director, was honoured with CIF Chanchlani Global India award 2009 instituted by Canada India Foundation for his outstanding contributions to promote non conventional sources of energy.
• Mr. Tulsi R Tanti was bestowed by the United Nations Environment Programme (UNEP) with the "Champion of the Earth" recognition for his entrepreneurial vision in combating climate change.
• Mr. Tulsi R Tanti was awarded the CMAI Business World INFOCOM National Telecom Award (2010) for his leadership in Renewable Energy Sources.
4. BUSINESS STRATEGY
Suzlon's strategic intent for its businesses is enumerated as follows:
• Driving down cost
Suzlon has embarked upon a cost reduction drive, through improvement in operational efficiencies and reduction in administrative cost. Strategic and tactical decisions are being taken to reduce cost by improved capacity utilization, effective vendor negotiations and value engineering. The ultimate aim is to provide the wind turbines with the lowest life - cycle cost.
• Increasing customer centricity and carefully selecting markets to improve the order book
Suzlon stands on a strong foothold in view of the continued growth in Asian markets like China and India. Its manufacturing presence in these markets results in improvement of operational efficiency and timely delivery. The Company plans to approach new markets this year through careful selection so as to establish itself as a leading player in each market it enters with a long-term plan in mind. Drawing from an enviable track record of success in providing turnkey & EPC solutions in various geographies, Suzlon is confident of its flexibility to offer its customers a myriad of services and wind power solutions at competitive prices.
• Improving the product portfolio
In the coming year, Suzlon plans to significantly upgrade its existing turbines as well as add more products to its portfolio. Suzlon has a top-quality R&D set-up with centres across Europe, China & India which function seamlessly to ensure that Suzlon turbines remain among the most competitive in the world.
• Internal transformation program to further improve process excellence
Suzlon initiated a Company-wide transformation programme christened ACE (Achieving Collective Excellence) with the support of the Boston Consulting Group (BCG) in June 2009. The programme is delivering results with significant improvements being brought about in the areas of manufacturing, technology, product design, market strategy, leadership and the like. A well-thought out path has been laid out for this programme which will touch every part of Suzlon and continue in the current financial year. Suzlon is confident that this programme will improve its internal processes and systems to be among the best in the world and show results in the areas of quality, cost, time & reliability.
Suzlon commissioned its first set of turbines with a total capacity of 31.5 MW in Turkey.
Suzlon Energy Limited, Annual Report 2009-1048
5. RISK AND RISK MITIGATION
Some of the key risks identified and steps taken to mitigate the adverse impact of same are noted below:
5.1 Operational risk
• Technology
Development of technologically superior and cost – efficient wind turbine generators involve significant investments. The risk associated with translating all investments that Suzlon is making in innovation into successful business opportunities for its future growth are high. Further it may result in cost and time over-runs. Our competitors may develop advanced models faster than us.
The risk of investments in innovation projects are addressed by structured periodic reviews of all programmes and investment by senior management. The research and testing centres at India, Denmark, Belgium, Germany and Netherlands are focussed on WTG performance improvements through component research and aerodynamics developments. Suzlon and REpower's joint research centre in Germany RETC (Renewable Energy Technology Centre) would drive research towards next generation wind turbine generators.
• Supply chain risk
Critical components like gear box, slew rings, pitch bearing, towers, glass fibre, etc. are specifically designed for application in wind energy generation. Shortage of these components would affect timely delivery of wind turbines. Supply chain risk has reduced in the current year, with components supply outstripping demand.
Further through backward integration strategy, Suzlon has significantly enhanced its ability to source components in a timely manner.
5.2 Financial risk
• Foreign exchange risk
Suzlon is exposed to Currency Risk on account of its substantial exposure to International Trade – import and export. Currency movement also affects its Loan assets and Liabilities denominated in foreign currency.
Risks are recognized at the contractual juncture and hedged at various stages of project life cycle, depending upon the nature of the transactions. Presence across geographies helps in providing natural hedging in certain cases, by offsetting exposures arising from receivables and payables across certain currency.
• Credit risk
Suzlon is exposed to high debt, taken to fund its inorganic growth. With economic slow down and credit squeeze across the globe funding of Wind Projects has become difficult, leading to slow order inflow from affected markets like Europe and the United States leading to further liquidity pressure.
Suzlon has entered into a debt consolidation and refinancing arrangement with bankers, whereby banking facilities covering rupee term loans, fund - based working capital facilities and non-fund based working capital facilities has been sanctioned. The Arrangement also covers the earlier sanctioned loans, which have either been continued or converted into a new loan facility, as the case may be. Relaxed financial covenants and two year moratorium for Rupee term loan repayment and back-ended ballonning re-payments spread in 8 years for Rupee term loans has eased the liquidity pressure.
6. INTERNAL CONTROL SYSTEM AND ITS ADEQUACY
Suzlon has established adequate internal control procedures, commensurate with the nature of its business and size of its operations. To provide reasonable assurance that assets are safeguarded against loss or damage and that accounting records are reliable for preparing financial statements, management has implemented an effective internal control procedure coupled with an internal audit process. Internal controls are evaluated by the internal management-audit department and supported by management reviews. The management audit also evaluates efficiencies in operations and compliance of internal policies and relevant statutory laws and regulations.
The Audit Committee of the Board periodically reviews the management audit reports, audit plans and recommendation of the auditors and management's response to those recommendations. The Audit Committee met four times during the year under review.
Highlights of consolidated results:
A Sources of funds
1. Share capital
The share capital increased by Rs. 11 crore from Rs. 300 crore as at March 31, 2009 to Rs. 311 crore as at March 31, 2010 mainly on account of issuance of 14,600,000 Global Depository Receipts (GDRs) representing 58,400,000 Equity Shares of Rs. 2 each, exercise of 24,000 employee stock options during the financial year and conversion of certain foreign currency convertible bonds .
Suzlon Energy Limited, Annual Report 2009-1049
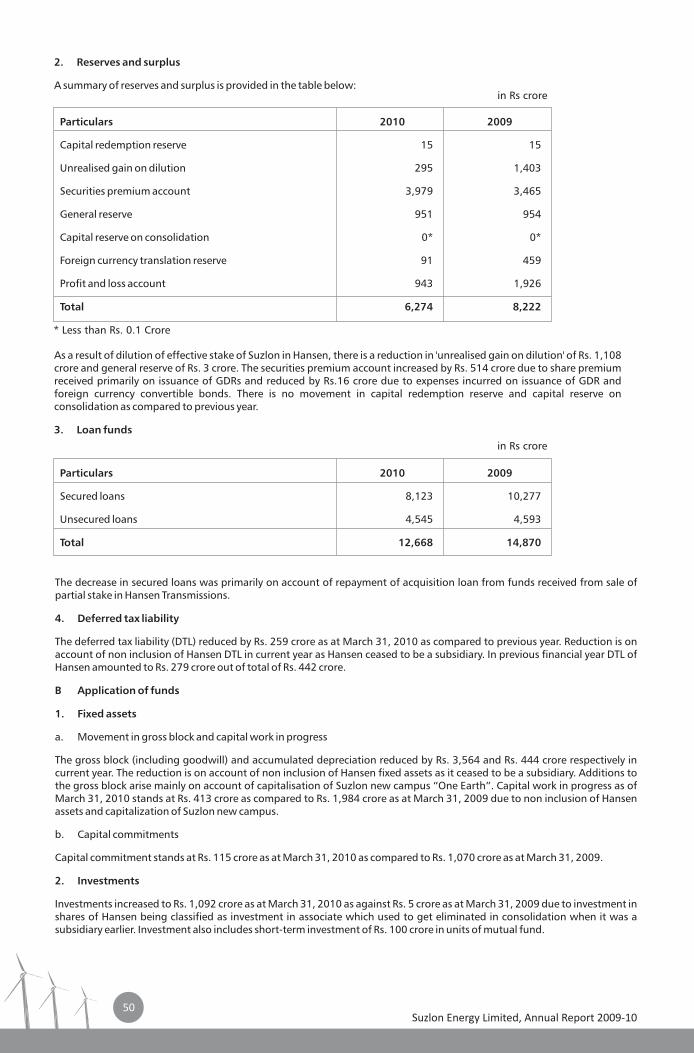
Suzlon Energy Limited, Annual Report 2009-10
Particulars 2010 2009
Capital redemption reserve 15 15
Unrealised gain on dilution 295 1,403
Securities premium account 3,979 3,465
General reserve 951 954
Capital reserve on consolidation 0* 0*
Foreign currency translation reserve 91 459
Profit and loss account 943 1,926
Total 6,274 8,222
Particulars 2010 2009
Secured loans 8,123 10,277
Unsecured loans 4,545 4,593
Total 12,668 14,870
in Rs crore
* Less than Rs. 0.1 Crore
2. Reserves and surplus
A summary of reserves and surplus is provided in the table below:
As a result of dilution of effective stake of Suzlon in Hansen, there is a reduction in 'unrealised gain on dilution' of Rs. 1,108 crore and general reserve of Rs. 3 crore. The securities premium account increased by Rs. 514 crore due to share premium received primarily on issuance of GDRs and reduced by Rs.16 crore due to expenses incurred on issuance of GDR and foreign currency convertible bonds. There is no movement in capital redemption reserve and capital reserve on consolidation as compared to previous year.
3. Loan funds
The decrease in secured loans was primarily on account of repayment of acquisition loan from funds received from sale of partial stake in Hansen Transmissions.
4. Deferred tax liability
The deferred tax liability (DTL) reduced by Rs. 259 crore as at March 31, 2010 as compared to previous year. Reduction is on account of non inclusion of Hansen DTL in current year as Hansen ceased to be a subsidiary. In previous financial year DTL of Hansen amounted to Rs. 279 crore out of total of Rs. 442 crore.
B Application of funds
1. Fixed assets
a. Movement in gross block and capital work in progress
The gross block (including goodwill) and accumulated depreciation reduced by Rs. 3,564 and Rs. 444 crore respectively in current year. The reduction is on account of non inclusion of Hansen fixed assets as it ceased to be a subsidiary. Additions to the gross block arise mainly on account of capitalisation of Suzlon new campus “One Earth”. Capital work in progress as of March 31, 2010 stands at Rs. 413 crore as compared to Rs. 1,984 crore as at March 31, 2009 due to non inclusion of Hansen assets and capitalization of Suzlon new campus.
b. Capital commitments
Capital commitment stands at Rs. 115 crore as at March 31, 2010 as compared to Rs. 1,070 crore as at March 31, 2009.
2. Investments
Investments increased to Rs. 1,092 crore as at March 31, 2010 as against Rs. 5 crore as at March 31, 2009 due to investment in shares of Hansen being classified as investment in associate which used to get eliminated in consolidation when it was a subsidiary earlier. Investment also includes short-term investment of Rs. 100 crore in units of mutual fund.
in Rs crore
50
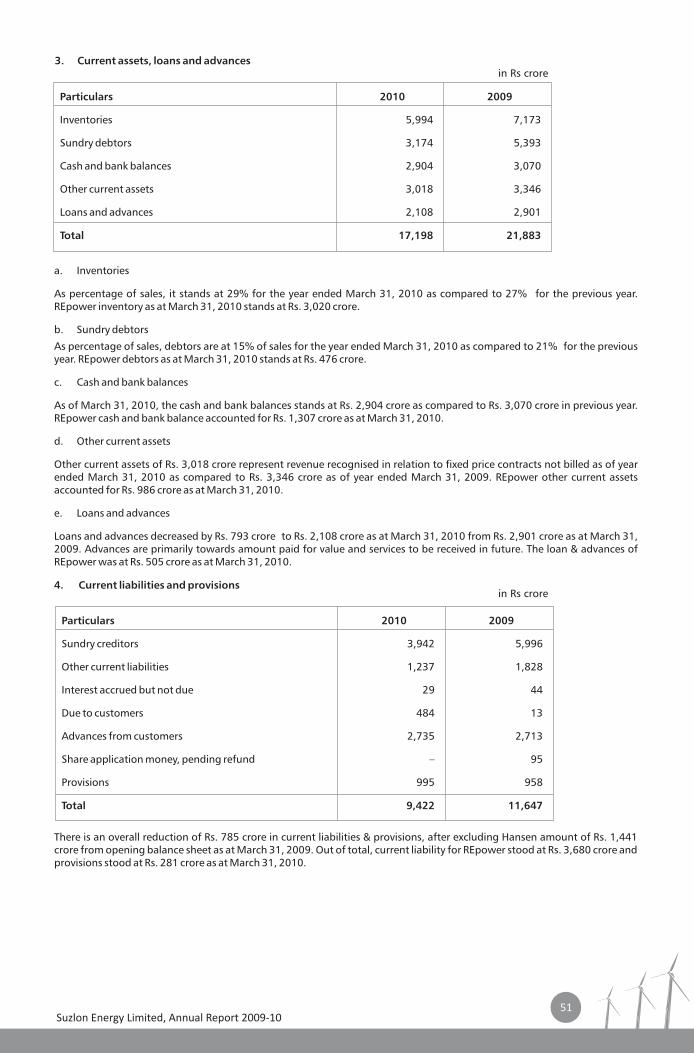
Suzlon Energy Limited, Annual Report 2009-10
Particulars 2010 2009
Inventories 5,994 7,173
Sundry debtors 3,174 5,393
Cash and bank balances 2,904 3,070
Other current assets 3,018 3,346
Loans and advances 2,108 2,901
Total 17,198 21,883
Particulars 2010 2009
Sundry creditors 3,942 5,996
Other current liabilities 1,237 1,828
Interest accrued but not due 29 44
Due to customers 484 13
Advances from customers 2,735 2,713
Share application money, pending refund – 95
Provisions 995 958
Total 9,422 11,647
3. Current assets, loans and advances
a. Inventories
As percentage of sales, it stands at 29% for the year ended March 31, 2010 as compared to 27% for the previous year. REpower inventory as at March 31, 2010 stands at Rs. 3,020 crore.
b. Sundry debtors
As percentage of sales, debtors are at 15% of sales for the year ended March 31, 2010 as compared to 21% for the previous year. REpower debtors as at March 31, 2010 stands at Rs. 476 crore.
c. Cash and bank balances
As of March 31, 2010, the cash and bank balances stands at Rs. 2,904 crore as compared to Rs. 3,070 crore in previous year. REpower cash and bank balance accounted for Rs. 1,307 crore as at March 31, 2010.
d. Other current assets
Other current assets of Rs. 3,018 crore represent revenue recognised in relation to fixed price contracts not billed as of year ended March 31, 2010 as compared to Rs. 3,346 crore as of year ended March 31, 2009. REpower other current assets accounted for Rs. 986 crore as at March 31, 2010.
e. Loans and advances
Loans and advances decreased by Rs. 793 crore to Rs. 2,108 crore as at March 31, 2010 from Rs. 2,901 crore as at March 31, 2009. Advances are primarily towards amount paid for value and services to be received in future. The loan & advances of REpower was at Rs. 505 crore as at March 31, 2010.
4. Current liabilities and provisions
in Rs crore
There is an overall reduction of Rs. 785 crore in current liabilities & provisions, after excluding Hansen amount of Rs. 1,441 crore from opening balance sheet as at March 31, 2009. Out of total, current liability for REpower stood at Rs. 3,680 crore and provisions stood at Rs. 281 crore as at March 31, 2010.
in Rs crore
51
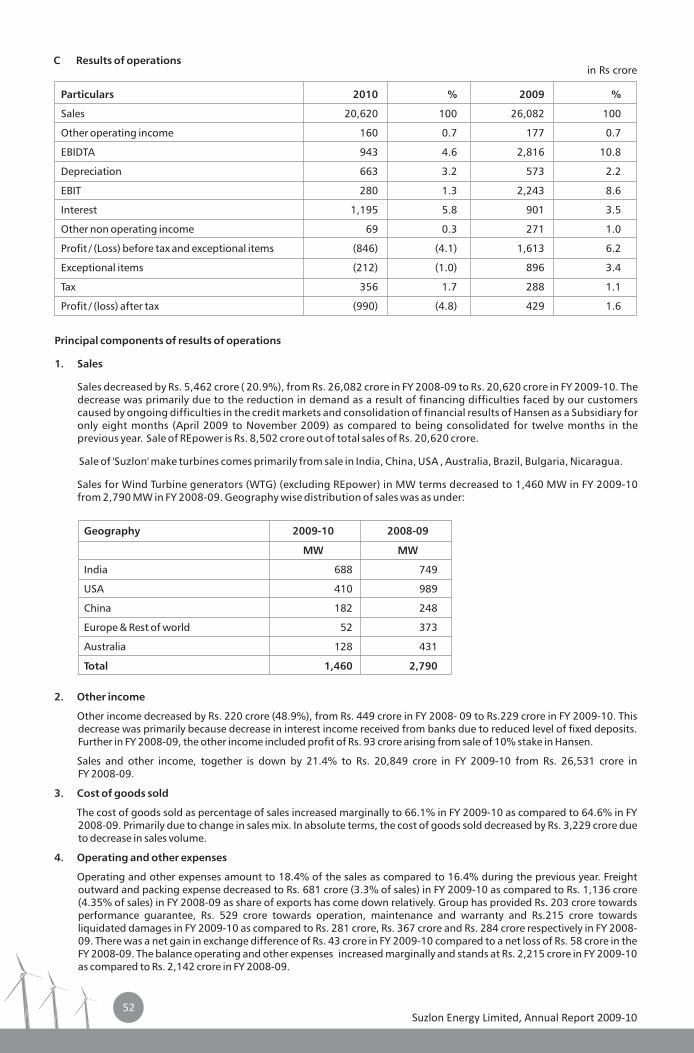
Suzlon Energy Limited, Annual Report 2009-10
Particulars 2010 % 2009 %
Sales 20,620 100 26,082 100
Other operating income 160 0.7 177 0.7
EBIDTA 943 4.6 2,816 10.8
Depreciation 663 3.2 573 2.2
EBIT 280 1.3 2,243 8.6
Interest 1,195 5.8 901 3.5
Other non operating income 69 0.3 271 1.0
Profit / (Loss) before tax and exceptional items (846) (4.1) 1,613 6.2
Exceptional items (212) (1.0) 896 3.4
Tax 356 1.7 288 1.1
Profit / (loss) after tax (990) (4.8) 429 1.6
Geography 2009-10 2008-09
MW MW
India 688 749
USA 410 989
China 182 248
Europe & Rest of world 52 373
Australia 128 431
Total 1,460 2,790
C Results of operations in Rs crore
2. Other income
Other income decreased by Rs. 220 crore (48.9%), from Rs. 449 crore in FY 2008- 09 to Rs.229 crore in FY 2009-10. This decrease was primarily because decrease in interest income received from banks due to reduced level of fixed deposits. Further in FY 2008-09, the other income included profit of Rs. 93 crore arising from sale of 10% stake in Hansen.
Sales and other income, together is down by 21.4% to Rs. 20,849 crore in FY 2009-10 from Rs. 26,531 crore in FY 2008-09.
3. Cost of goods sold
The cost of goods sold as percentage of sales increased marginally to 66.1% in FY 2009-10 as compared to 64.6% in FY 2008-09. Primarily due to change in sales mix. In absolute terms, the cost of goods sold decreased by Rs. 3,229 crore due to decrease in sales volume.
4. Operating and other expenses
Operating and other expenses amount to 18.4% of the sales as compared to 16.4% during the previous year. Freight outward and packing expense decreased to Rs. 681 crore (3.3% of sales) in FY 2009-10 as compared to Rs. 1,136 crore (4.35% of sales) in FY 2008-09 as share of exports has come down relatively. Group has provided Rs. 203 crore towards performance guarantee, Rs. 529 crore towards operation, maintenance and warranty and Rs.215 crore towards liquidated damages in FY 2009-10 as compared to Rs. 281 crore, Rs. 367 crore and Rs. 284 crore respectively in FY 2008-09. There was a net gain in exchange difference of Rs. 43 crore in FY 2009-10 compared to a net loss of Rs. 58 crore in the FY 2008-09. The balance operating and other expenses increased marginally and stands at Rs. 2,215 crore in FY 2009-10 as compared to Rs. 2,142 crore in FY 2008-09.
Principal components of results of operations
1. Sales
Sales decreased by Rs. 5,462 crore ( 20.9%), from Rs. 26,082 crore in FY 2008-09 to Rs. 20,620 crore in FY 2009-10. The decrease was primarily due to the reduction in demand as a result of financing difficulties faced by our customers caused by ongoing difficulties in the credit markets and consolidation of financial results of Hansen as a Subsidiary for only eight months (April 2009 to November 2009) as compared to being consolidated for twelve months in the previous year. Sale of REpower is Rs. 8,502 crore out of total sales of Rs. 20,620 crore.
Sale of 'Suzlon' make turbines comes primarily from sale in India, China, USA , Australia, Brazil, Bulgaria, Nicaragua.
Sales for Wind Turbine generators (WTG) (excluding REpower) in MW terms decreased to 1,460 MW in FY 2009-10 from 2,790 MW in FY 2008-09. Geography wise distribution of sales was as under:
52
5. Employees' remuneration and benefits
Employees' remuneration and benefits cost decreased marginally by Rs. 21 crore (1%) to Rs. 2,145 crore in FY 2009-10 as compared to Rs. 2,166 crore in FY 2008-09, Suzlon maintained overall strength of people intact, taking a view that the knowledge available with the people, is valuable which will be used in the days of market demand revival.
6. Financial charges
Financial charges represent interest and bank charges. Financial charges increased by 38% to Rs. 1,458 crore in FY 2009-10 from Rs. 1,054 crore in FY 2008-09. This was primarily due to short-term debts taken at relatively higher cost due to liquidity crunch in the market, conversion of foreign exchange denominated loans into Indian rupees, and an increase in bank charges due to incurrence of processing fees and related expenses in connection with refinancing of debts in the Fiscal Year 2010.
7. Depreciation / amortisation
The Company provided a sum of Rs. 663 crore and Rs. 573 crore towards depreciation for the years ended March 31, 2010 and March 31, 2009 respectively. Charge on account of depreciation as a percentage of sales amounts to 3.2 % in FY 2009-10 as compared to 2.2% in FY 2008-09. The increase in percentage terms is primarily due to lower sales during the year 2009 -10. The absolute increase in depreciation was due to capitalisation of our Campus and ramp up in capital expenditure.
8. Exceptional items
Exceptional items decreased from Rs. 896 crore in FY 2008-09 to a gain of Rs. 212 crore in FY 2009-10. Figure of current year includes exceptional gain of Rs. 252 crore, as a result of partial sale of stake in Hansen and Rs. 122 crore on account of net gain from buyback and exchange of foreign currency convertible bonds after setting off costs for restructuring and refinancing of financial facilities. These gains have been partially offset by amortization of foreign exchange losses on convertible bonds amounting to Rs.162 crore. Comparatively exceptional loss in FY 2008 - 2009 of Rs. 896 crore constituted of amortization of foreign exchange losses on convertible bonds of Rs. 131 crore, Rs. 354 crore as a result of our mark-to-market losses on foreign exchange forward / option contracts as well as Rs. 411 crore as a result of a blade crack issue in our S88 turbines.
9. Profit
The consolidated EBIDTA amounted to Rs. 943 crore and Rs. 2,816 crore for the FY 2009-10 and FY 2008-09 representing 4.5 % and 10.8% of total sales respectively. EBIDTA has primarily reduced due to lower volume of sales and inelastic nature of some of the overheads costs which did not come down proportionately with relatively lower sales volume.
Profit / (loss) before tax and exceptional items amounted to (Rs. 846 crore) and Rs. 1,613 crore for the FY 2009-10 and FY 2008-09, representing (4.1%) and 6.2% of total sales respectively. The PBT is in negative as EBIDTA for the year has been insufficient to absorb finance cost and depreciation.
Tax expenses increased to Rs. 356 crore in FY 2009-10 from Rs. 288 crore in FY 2008-09. However , a major part of the tax expense for the year is on account of re-assessment of deferred tax assets.
Profit / (loss) after tax amounted to (Rs. 990 crore) and Rs. 429 crore for the financial year FY 2009-10 and FY 2008-09 representing (4.8%) and 1.6% of total sales respectively.
Share of Minority interest decreased to Rs. 9 crore in FY 2009-10, compared to Rs. 195 crore in FY 2008-09 and share in associate's profit after tax increased to Rs. 16 crore in FY 2009-10, compared to Rs. 2 crore in FY 2008-09.
As a result of the foregoing factors, net profit reduced from Rs. 236 crore in FY 2008-09 to loss of Rs. 983 crore in FY 2009-10.
Cautionary Statement
Suzlon has included statements in this discussion, that contain words or phrases such as “will”, “aim”, “will” likely result”, “believe”, “expect”, “will continue”, “anticipate”, “estimate”, “intend”, “plan”, “contemplate”, “seek to”, “future”, “objective”, “goal”, “project”, “should”, “will pursue” and similar expressions or variations of such expressions that are “forward-looking statements”.
All forward-looking statements are subject to risks, uncertainties and assumptions that could cause actual results to differ materially from those contemplated by the relevant forward-looking statement. Important factors that could cause actual results to differ materially from Suzlon's expectations include:-
• Variation in the demand for electricity;
• Changes in the cost of generating electricity from wind energy and changes in wind patterns;
• Changes in or termination of policies of state governments in India that encourage investment in power projects;
• General economic and business conditions in India and other countries;
• Suzlon's ability to successfully implement its strategy, growth and expansion plans and technological initiatives;
• Changes in the value of the rupee and other currencies;
• Potential mergers, acquisitions or restructurings and increased competition;
• Changes in laws and regulations;
• Changes in political conditions;
• Changes in the foreign exchange control regulations; and
• Changes in the laws and regulations that apply to the wind energy industry, including tax laws.
Suzlon Energy Limited, Annual Report 2009-1053
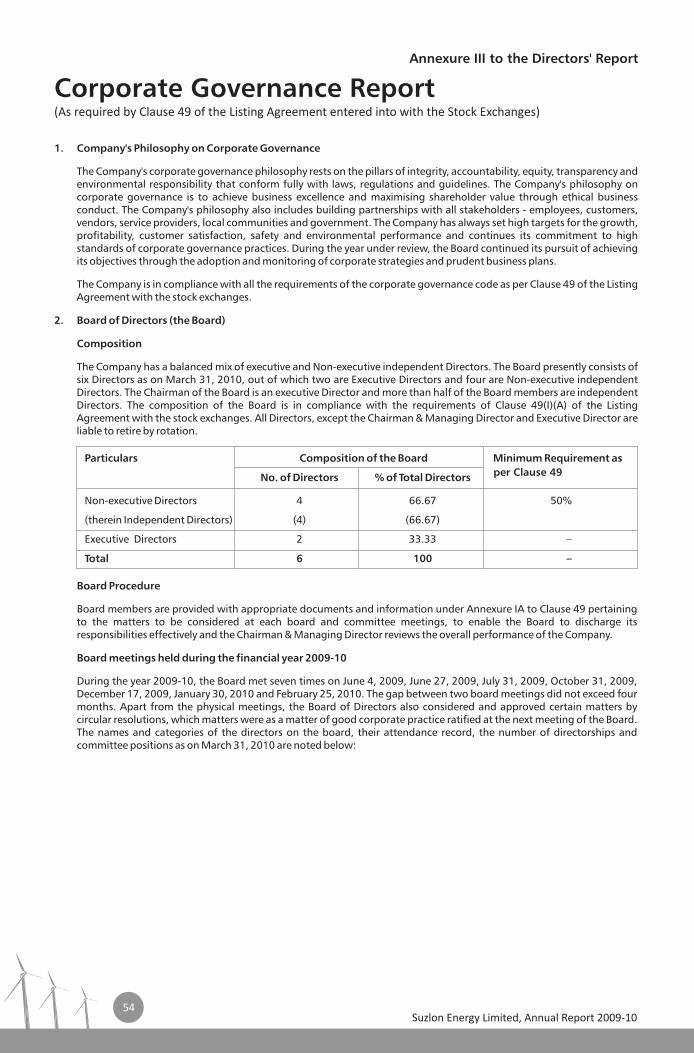
54Suzlon Energy Limited, Annual Report 2009-10
Corporate Governance Report(As required by Clause 49 of the Listing Agreement entered into with the Stock Exchanges)
1. Company's Philosophy on Corporate Governance
The Company's corporate governance philosophy rests on the pillars of integrity, accountability, equity, transparency and environmental responsibility that conform fully with laws, regulations and guidelines. The Company's philosophy on corporate governance is to achieve business excellence and maximising shareholder value through ethical business conduct. The Company's philosophy also includes building partnerships with all stakeholders - employees, customers, vendors, service providers, local communities and government. The Company has always set high targets for the growth, profitability, customer satisfaction, safety and environmental performance and continues its commitment to high standards of corporate governance practices. During the year under review, the Board continued its pursuit of achieving its objectives through the adoption and monitoring of corporate strategies and prudent business plans.
The Company is in compliance with all the requirements of the corporate governance code as per Clause 49 of the Listing Agreement with the stock exchanges.
2. Board of Directors (the Board)
Composition
The Company has a balanced mix of executive and Non-executive independent Directors. The Board presently consists of six Directors as on March 31, 2010, out of which two are Executive Directors and four are Non-executive independent Directors. The Chairman of the Board is an executive Director and more than half of the Board members are independent Directors. The composition of the Board is in compliance with the requirements of Clause 49(I)(A) of the Listing Agreement with the stock exchanges. All Directors, except the Chairman & Managing Director and Executive Director are liable to retire by rotation.
Particulars Composition of the Board Minimum Requirement as
No. of Directors % of Total Directors
Non-executive Directors
(therein Independent Directors) (4) (66.67)
Executive Directors 2 33.33 –
Total 6 100 –
4 66.67 50%
Board Procedure
Board members are provided with appropriate documents and information under Annexure IA to Clause 49 pertaining to the matters to be considered at each board and committee meetings, to enable the Board to discharge its responsibilities effectively and the Chairman & Managing Director reviews the overall performance of the Company.
Board meetings held during the financial year 2009-10
During the year 2009-10, the Board met seven times on June 4, 2009, June 27, 2009, July 31, 2009, October 31, 2009, December 17, 2009, January 30, 2010 and February 25, 2010. The gap between two board meetings did not exceed four months. Apart from the physical meetings, the Board of Directors also considered and approved certain matters by circular resolutions, which matters were as a matter of good corporate practice ratified at the next meeting of the Board. The names and categories of the directors on the board, their attendance record, the number of directorships and committee positions as on March 31, 2010 are noted below:
Annexure III to the Directors' Report
per Clause 49
55Suzlon Energy Limited, Annual Report 2009-10
Mr. Tulsi R. Chairman & 6 Yes 9 8 3 – 2Tanti Managing
Director
Mr. Girish R. Executive 7 Yes 3 3 2 – –Tanti Director
Mr. Ajay Independent 4 No 1 – – – –Relan Director
Mr. Ashish Independent 4 Yes 1 1 1 1 –Dhawan Director
Mr. Pradip Independent 4 No 14 6 12 1 2 Kumar DirectorKhaitan
Mr. V. Independent 7 Yes 1 1 1 – –Raghuraman Director
Name of the
director
Category Attendance at meetings during 2009-10
Total no. of
director-ships as on March 31,
2010
Total no. of membership of the committees of Board
Total no. of chairmanship of the committees of Board
Board (out of 7)
14th AGM on
August 13, 2009
Membership in audit / investors' grievance
committees
Membership in other
committees
Chairmanship in audit / investors' grievance
committees
Chairmanship in other
committees
Notes:
• While considering the total number of directorships, directorships in private companies, foreign companies and Section 25 companies have been excluded.
• As per terms of Clause 49(IV)(G)(ia), it is hereby disclosed that Mr. Tulsi R. Tanti, Chairman & Managing Director, is a brother of Mr. Girish R. Tanti, the Executive Director. Except for the relationship between Mr. Tulsi R.Tanti and Mr. Girish R.Tanti, there is no other inter-se relationship amongst other Directors.
• All the Directors have certified that they are not members of more than ten mandatory committees and do not act as chairman of more than five mandatory committees in terms of the listing agreement across all companies in which they are Directors.
Code of Ethics
The Company has prescribed a Code of Ethics for its Directors and Senior Management. The Code of Ethics of the Company has been posted on its website www.suzlon.com. The declaration from the Chairman & Managing Director stating that as of March 31, 2010, all the board members and the Senior Management personnel have affirmed compliance with the Code of Ethics of the Company has been included in this report.
3. Committees of Board
The Board Committees focus on certain specific areas and make informed decisions within the delegated authority. Each Committee of the Board functions according to its charter that defines its composition, scope, power and role in accordance with the Companies Act, 1956, and the Listing Agreement. Presently, the Board has the following five committees:
I. Mandatory Committees
• Audit Committee
• Investors' Grievance Committee
(i) Audit Committee
Composition, meetings and attendance
The Audit Committee of the Company has been constituted as per the requirements of Clause 49 of the Listing Agreement. The composition of audit committee is in compliance with the requirements of Clause 49(II)(A) of the Listing Agreement. As on date, it consists of four members, all of whom including the Chairman are independent directors. The Chairman & Managing Director, Chief Operating Officer, Chief Financial Officer, representatives of the statutory auditors and senior officials of the Company are invited to attend the meetings of the Audit Committee from time to time. The Company Secretary of the Company acts as the secretary to the Audit Committee. The Chairman of the Audit Committee was present at the 14th Annual General Meeting held on 13th August 2009.
During the Financial Year 2009-10, the Audit Committee met five times on May 27, 2009, June 27, 2009, July 31, 2009, October 31, 2009 and January 30, 2010 and the quorum was present at all the meetings. The gap between two meetings did not exceed four months. The attendance of the members is noted below:
56Suzlon Energy Limited, Annual Report 2009-10
Name of the member Chairman / Member No. of meetings attended
Mr. Ashish Dhawan Chairman 4
Mr. Pradip Kumar Khaitan Member 3
Mr. V. Raghuraman Member 5
*Mr. Ajay Relan Member –
* Mr. Ajay Relan was appointed as Audit Committee member with effect from 27th April, 2010.
Terms of Reference
The broad terms of reference includes the following as is mandated in Clause 49 of Listing Agreement and Section 292A of the Companies Act, 1956:
a. Oversight of the Company’s financial reporting process and the disclosure of its financial information to ensure that the financial statement is correct, sufficient and credible.
b. Recommending to the Board, the appointment, re-appointment and, if required, the replacement or removal of the statutory auditors and the fixation of audit fees.
c. Approval of payment to statutory auditors for any other services rendered by them.
d. Reviewing, with the management, the annual financial statements before submission to the Board for approval, with particular reference to:
• Matters required to be included in the directors' responsibility statement to be included in the Board'sreport in terms of Clause 2AA of Section 217 of the Companies Act, 1956,
• Changes, if any, in accounting policies and practices and reasons for the same,
• Major accounting entries involving estimates based on the exercise of judgement by management,
• Significant adjustments made in the financial statements arising out of the audit findings,
• Compliance with listing and other legal requirements relating to financial statements,
• Disclosure of any related party transactions, and
• Qualifications in the draft audit report.
e. Reviewing, with the management, the quarterly financial statements before submission to the Board for approval.
f. Reviewing, with the management, the statement of uses/application of funds raised through an issue (public issue, rights issue, preferential issue, etc.), the statement of funds utilized for purposes other than those stated in the offer document/prospectus/notice and the report submitted by the monitoring agency monitoring the utilisation of proceeds of a public or rights issue, and making appropriate recommendations to the Board to take up steps in this matter.
g. Reviewing, with the management, performance of statutory and internal auditors, adequacy of the internal control systems.
h. Reviewing the adequacy of internal audit function, if any, including the structure of the internal audit department, staffing and seniority of the official heading the department, reporting structure coverage and frequency of internal audit.
i. Discussion with internal auditors any significant findings and follow-up thereon.
j. Review the findings of any internal investigations by the internal auditors into matters where there is suspected fraud or irregularity or a failure of internal control systems of a material nature and reporting the matter to the Board.
k. Discussion with statutory auditors before the audit commences, about the nature and scope of audit as well as post-audit discussion to ascertain any area of concern.
l. To look into the reasons for substantial defaults in the payment to the depositors, debenture holders, shareholders (in case of non-payment of declared dividends) and creditors.
m. To review the functioning of the whistle blower mechanism, in case the same is existing.
n. Carrying out any other function as is mentioned in the terms of reference of the audit committee.
57Suzlon Energy Limited, Annual Report 2009-10
Name of the member Chairman / Member No. of meetings attended
Mr. Pradip Kumar Khaitan Chairman 2
Mr. Tulsi R.Tanti Member 3
Mr. Girish R.Tanti Member 4
Name of the member Chairman / Member No. of meetings attended
Mr. Ashish Dhawan Member 2
Mr. Pradip Kumar Khaitan Member 2
Mr. V. Raghuraman Member 3
(ii) Investors' Grievance Committee
Composition, meetings and attendance
The Investors' Grievance Committee of the Company consists of three Directors out of which the Chairman is a Non-executive independent Director and other two members are Executive Directors of the Company.
During the Financial Year 2009-10, the Investors' Grievance Committee met four times on June 27, 2009, July 31, 2009, October 31, 2009 and January 30, 2010. The attendance of the members is noted below:
Terms of Reference
The broad terms of reference includes the following:
a. Redressal of shareholder and investor complaints including, but not limiting itself to transfer of shares and issue of duplicate share certificates, non-receipt of balance sheet, non-receipt of declared dividends, etc.,
b. Monitoring transfers, transmissions, dematerialisation, rematerialisation, splitting and consolidation of shares issued by the Company, and
c. Such other acts, deeds, matters and things as the Board of Directors may consider think fit and as may be required for effective and efficient redressal of shareholders and / or investors' grievances.
II Non-mandatory Committees
• Remuneration Committee
• Securities Issue Committee
• ESOP Committee
(i) Remuneration Committee
Composition, meetings and attendance
The Remuneration Committee of the Company consists of three members, all of whom are non-executive independent directors. The Chairman for the Remuneration Committee is decided by the committee members from amongst themselves from time to time.
During the Financial Year 2009-10, the Remuneration Committee met three times on June 27, 2009, October 31, 2009 and January 30, 2010. Apart from the physical meetings, the Remuneration Committee also considered and approved of certain matters by circular resolutions, which matters were as a matter of good corporate practice ratified at the next meeting of the Remuneration Committee. The attendance of the members is noted below:
Terms of Reference
The broad terms of reference includes the following:
a. To determine the remuneration of the Directors of the Company;
b. Ensure effective implementation and operations of various existing and future employee stock option plans of the Company, to do all such acts, deeds, matters and things including, but not limiting itself to:
• Determining the number of options to be granted to each employee, in the aggregate and at the times at which such grants shall be made,
• Determining the eligible employee(s) to whom options be granted,
• Determining the eligibility criteria(s) for grant of options,
• Determining the performance criteria(s), if any, for the eligible employees,
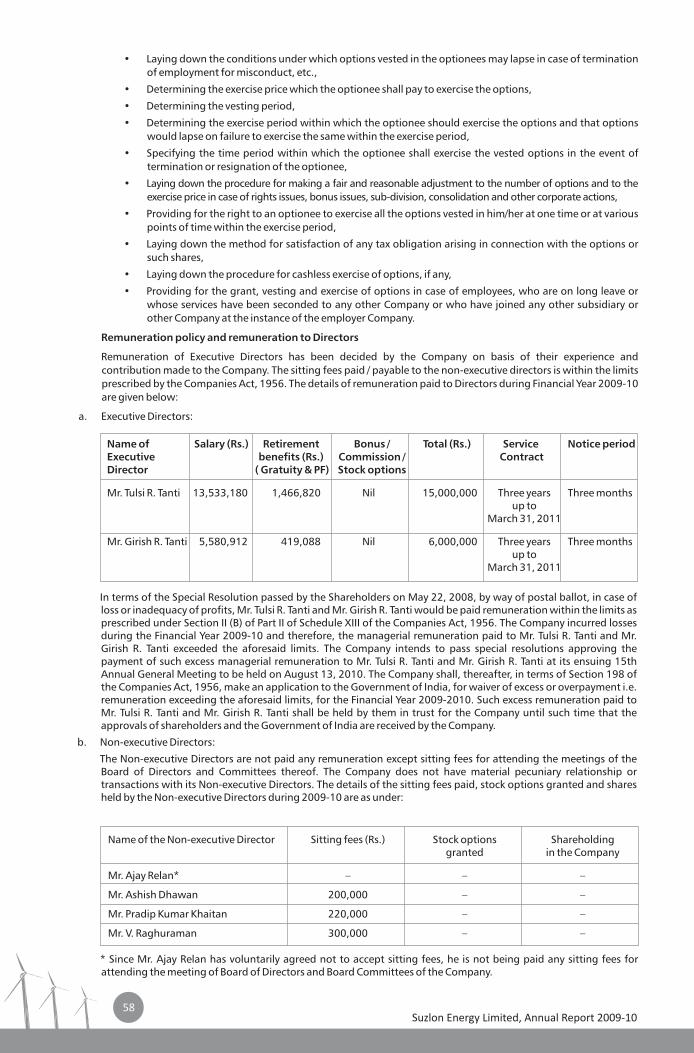
58Suzlon Energy Limited, Annual Report 2009-10
Name of Executive benefits (Rs.) Commission / ContractDirector ( Gratuity & PF) Stock options
Mr. Tulsi R. 13,533,180 1,466,820 Nil 15,000,000 Three years Three monthsup to
March 31, 2011
Mr. Girish R. Tanti 5,580,912 419,088 Nil 6,000,000 Three years Three monthsup to
March 31, 2011
Salary (Rs.) Retirement Bonus / Total (Rs.) Service Notice period
Tanti
Name of the Non-executive Director Sitting fees (Rs.) Stock options Shareholding granted in the Company
Mr. Ajay Relan* – – –
Mr. Ashish Dhawan 200,000 – –
Mr. Pradip Kumar Khaitan 220,000 – –
Mr. V. Raghuraman 300,000 – –
Laying down the conditions under which options vested in the optionees may lapse in case of termination of employment for misconduct, etc.,
• Determining the exercise price which the optionee shall pay to exercise the options,
• Determining the vesting period,
• Determining the exercise period within which the optionee should exercise the options and that options would lapse on failure to exercise the same within the exercise period,
• Specifying the time period within which the optionee shall exercise the vested options in the event of termination or resignation of the optionee,
• Laying down the procedure for making a fair and reasonable adjustment to the number of options and to the exercise price in case of rights issues, bonus issues, sub-division, consolidation and other corporate actions,
• Providing for the right to an optionee to exercise all the options vested in him/her at one time or at various points of time within the exercise period,
• Laying down the method for satisfaction of any tax obligation arising in connection with the options or such shares,
• Laying down the procedure for cashless exercise of options, if any,
• Providing for the grant, vesting and exercise of options in case of employees, who are on long leave or whose services have been seconded to any other Company or who have joined any other subsidiary or other Company at the instance of the employer Company.
Remuneration policy and remuneration to Directors
Remuneration of Executive Directors has been decided by the Company on basis of their experience and contribution made to the Company. The sitting fees paid / payable to the non-executive directors is within the limits prescribed by the Companies Act, 1956. The details of remuneration paid to Directors during Financial Year 2009-10 are given below:
a. Executive Directors:
•
In terms of the Special Resolution passed by the Shareholders on May 22, 2008, by way of postal ballot, in case of loss or inadequacy of profits, Mr. Tulsi R. Tanti and Mr. Girish R. Tanti would be paid remuneration within the limits as prescribed under Section II (B) of Part II of Schedule XIII of the Companies Act, 1956. The Company incurred losses during the Financial Year 2009-10 and therefore, the managerial remuneration paid to Mr. Tulsi R. Tanti and Mr. Girish R. Tanti exceeded the aforesaid limits. The Company intends to pass special resolutions approving the payment of such excess managerial remuneration to Mr. Tulsi R. Tanti and Mr. Girish R. Tanti at its ensuing 15th Annual General Meeting to be held on August 13, 2010. The Company shall, thereafter, in terms of Section 198 of the Companies Act, 1956, make an application to the Government of India, for waiver of excess or overpayment i.e. remuneration exceeding the aforesaid limits, for the Financial Year 2009-2010. Such excess remuneration paid to Mr. Tulsi R. Tanti and Mr. Girish R. Tanti shall be held by them in trust for the Company until such time that the approvals of shareholders and the Government of India are received by the Company.
b. Non-executive Directors:
The Non-executive Directors are not paid any remuneration except sitting fees for attending the meetings of the Board of Directors and Committees thereof. The Company does not have material pecuniary relationship or transactions with its Non-executive Directors. The details of the sitting fees paid, stock options granted and shares held by the Non-executive Directors during 2009-10 are as under:
* Since Mr. Ajay Relan has voluntarily agreed not to accept sitting fees, he is not being paid any sitting fees for attending the meeting of Board of Directors and Board Committees of the Company.
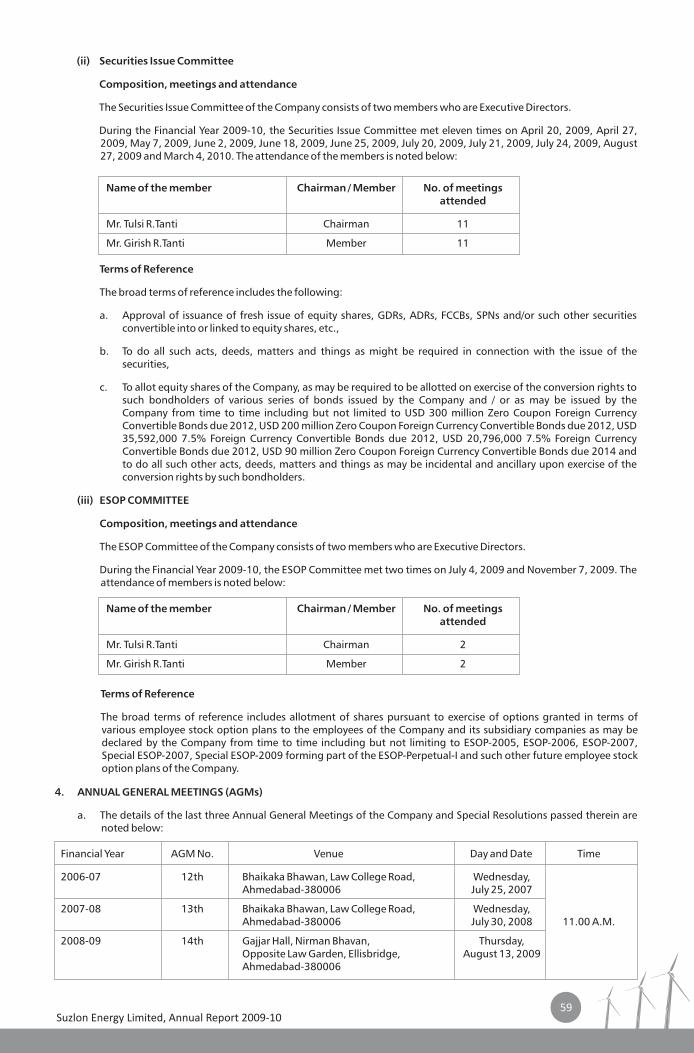
59Suzlon Energy Limited, Annual Report 2009-10
Name of the member Chairman / Member No. of meetings attended
Mr. Tulsi R.Tanti Chairman 11
Mr. Girish R.Tanti Member 11
Name of the member Chairman / Member No. of meetings attended
Mr. Tulsi R.Tanti Chairman 2
Mr. Girish R.Tanti Member 2
4. ANNUAL GENERAL MEETINGS (AGMs)
a. The details of the last three Annual General Meetings of the Company and Special Resolutions passed therein are noted below:
Financial Year AGM No. Venue Day and Date Time
2006-07 12th Bhaikaka Bhawan, Law College Road, Wednesday,Ahmedabad-380006 July 25, 2007
2007-08 13th Bhaikaka Bhawan, Law College Road, Wednesday,Ahmedabad-380006 July 30, 2008 11.00 A.M.
2008-09 14th Gajjar Hall, Nirman Bhavan, Thursday, Opposite Law Garden, Ellisbridge, August 13, 2009Ahmedabad-380006
(ii) Securities Issue Committee
Composition, meetings and attendance
The Securities Issue Committee of the Company consists of two members who are Executive Directors.
During the Financial Year 2009-10, the Securities Issue Committee met eleven times on April 20, 2009, April 27, 2009, May 7, 2009, June 2, 2009, June 18, 2009, June 25, 2009, July 20, 2009, July 21, 2009, July 24, 2009, August 27, 2009 and March 4, 2010. The attendance of the members is noted below:
Terms of Reference
The broad terms of reference includes the following:
a. Approval of issuance of fresh issue of equity shares, GDRs, ADRs, FCCBs, SPNs and/or such other securities convertible into or linked to equity shares, etc.,
b. To do all such acts, deeds, matters and things as might be required in connection with the issue of the securities,
c. To allot equity shares of the Company, as may be required to be allotted on exercise of the conversion rights to such bondholders of various series of bonds issued by the Company and / or as may be issued by the Company from time to time including but not limited to USD 300 million Zero Coupon Foreign Currency Convertible Bonds due 2012, USD 200 million Zero Coupon Foreign Currency Convertible Bonds due 2012, USD 35,592,000 7.5% Foreign Currency Convertible Bonds due 2012, USD 20,796,000 7.5% Foreign Currency Convertible Bonds due 2012, USD 90 million Zero Coupon Foreign Currency Convertible Bonds due 2014 and to do all such other acts, deeds, matters and things as may be incidental and ancillary upon exercise of the conversion rights by such bondholders.
(iii) ESOP COMMITTEE
Composition, meetings and attendance
The ESOP Committee of the Company consists of two members who are Executive Directors.
During the Financial Year 2009-10, the ESOP Committee met two times on July 4, 2009 and November 7, 2009. The attendance of members is noted below:
Terms of Reference
The broad terms of reference includes allotment of shares pursuant to exercise of options granted in terms of various employee stock option plans to the employees of the Company and its subsidiary companies as may be declared by the Company from time to time including but not limiting to ESOP-2005, ESOP-2006, ESOP-2007, Special ESOP-2007, Special ESOP-2009 forming part of the ESOP-Perpetual-I and such other future employee stock option plans of the Company.
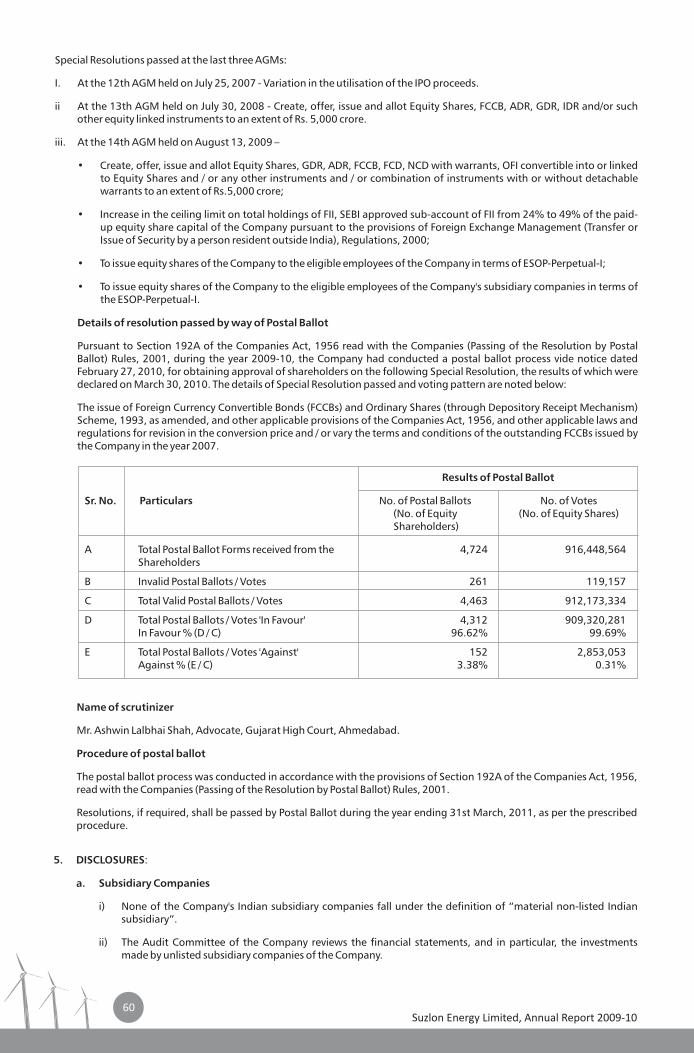
60Suzlon Energy Limited, Annual Report 2009-10
Special Resolutions passed at the last three AGMs:
I. At the 12th AGM held on July 25, 2007 - Variation in the utilisation of the IPO proceeds.
ii At the 13th AGM held on July 30, 2008 - Create, offer, issue and allot Equity Shares, FCCB, ADR, GDR, IDR and/or such other equity linked instruments to an extent of Rs. 5,000 crore.
iii. At the 14th AGM held on August 13, 2009 –
• Create, offer, issue and allot Equity Shares, GDR, ADR, FCCB, FCD, NCD with warrants, OFI convertible into or linked to Equity Shares and / or any other instruments and / or combination of instruments with or without detachable warrants to an extent of Rs.5,000 crore;
• Increase in the ceiling limit on total holdings of FII, SEBI approved sub-account of FII from 24% to 49% of the paid-up equity share capital of the Company pursuant to the provisions of Foreign Exchange Management (Transfer or Issue of Security by a person resident outside India), Regulations, 2000;
• To issue equity shares of the Company to the eligible employees of the Company in terms of ESOP-Perpetual-I;
• To issue equity shares of the Company to the eligible employees of the Company's subsidiary companies in terms of the ESOP-Perpetual-I.
Details of resolution passed by way of Postal Ballot
Pursuant to Section 192A of the Companies Act, 1956 read with the Companies (Passing of the Resolution by Postal Ballot) Rules, 2001, during the year 2009-10, the Company had conducted a postal ballot process vide notice dated February 27, 2010, for obtaining approval of shareholders on the following Special Resolution, the results of which were declared on March 30, 2010. The details of Special Resolution passed and voting pattern are noted below:
The issue of Foreign Currency Convertible Bonds (FCCBs) and Ordinary Shares (through Depository Receipt Mechanism) Scheme, 1993, as amended, and other applicable provisions of the Companies Act, 1956, and other applicable laws and regulations for revision in the conversion price and / or vary the terms and conditions of the outstanding FCCBs issued by the Company in the year 2007.
Results of Postal Ballot
Sr. No. Particulars No. of Postal Ballots No. of Votes(No. of Equity (No. of Equity Shares) Shareholders)
A Total Postal Ballot Forms received from the 4,724 916,448,564Shareholders
B Invalid Postal Ballots / Votes 261 119,157
C Total Valid Postal Ballots / Votes 4,463 912,173,334
D Total Postal Ballots / Votes 'In Favour' 4,312 909,320,281In Favour % (D / C) 96.62% 99.69%
E Total Postal Ballots / Votes 'Against' 152 2,853,053Against % (E / C) 3.38% 0.31%
Name of scrutinizer
Mr. Ashwin Lalbhai Shah, Advocate, Gujarat High Court, Ahmedabad.
Procedure of postal ballot
The postal ballot process was conducted in accordance with the provisions of Section 192A of the Companies Act, 1956, read with the Companies (Passing of the Resolution by Postal Ballot) Rules, 2001.
Resolutions, if required, shall be passed by Postal Ballot during the year ending 31st March, 2011, as per the prescribed procedure.
5. DISCLOSURES:
a. Subsidiary Companies
i) None of the Company's Indian subsidiary companies fall under the definition of “material non-listed Indian subsidiary”.
ii) The Audit Committee of the Company reviews the financial statements, and in particular, the investments made by unlisted subsidiary companies of the Company.
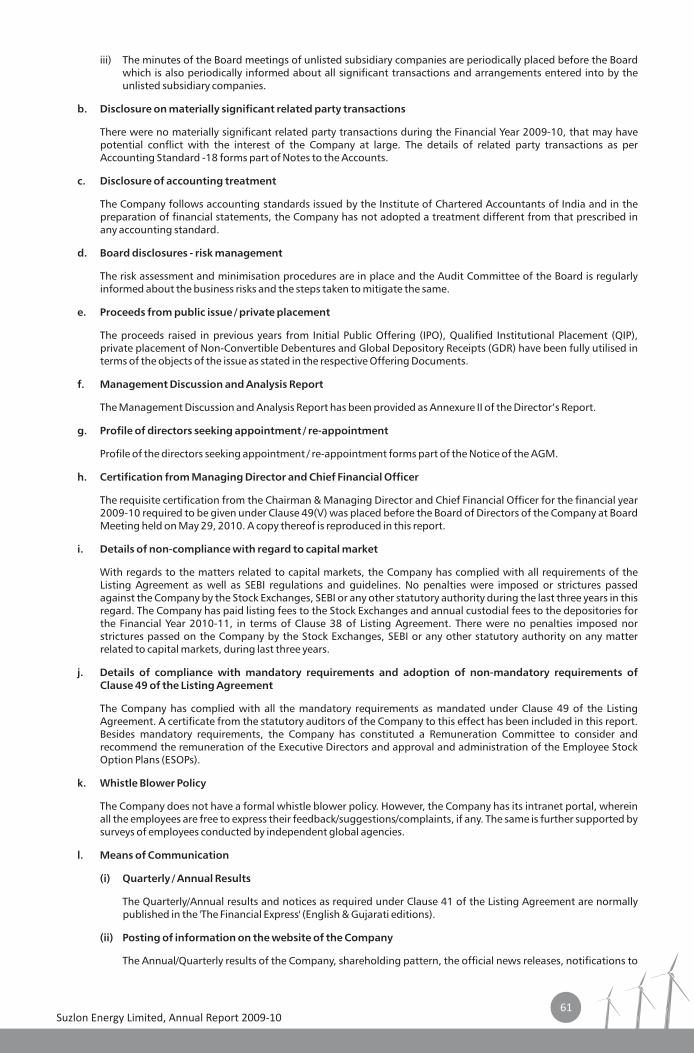
61Suzlon Energy Limited, Annual Report 2009-10
iii) The minutes of the Board meetings of unlisted subsidiary companies are periodically placed before the Board which is also periodically informed about all significant transactions and arrangements entered into by the unlisted subsidiary companies.
b. Disclosure on materially significant related party transactions
There were no materially significant related party transactions during the Financial Year 2009-10, that may have potential conflict with the interest of the Company at large. The details of related party transactions as per Accounting Standard -18 forms part of Notes to the Accounts.
c. Disclosure of accounting treatment
The Company follows accounting standards issued by the Institute of Chartered Accountants of India and in the preparation of financial statements, the Company has not adopted a treatment different from that prescribed in any accounting standard.
d. Board disclosures - risk management
The risk assessment and minimisation procedures are in place and the Audit Committee of the Board is regularly informed about the business risks and the steps taken to mitigate the same.
e. Proceeds from public issue / private placement
The proceeds raised in previous years from Initial Public Offering (IPO), Qualified Institutional Placement (QIP), private placement of Non-Convertible Debentures and Global Depository Receipts (GDR) have been fully utilised in terms of the objects of the issue as stated in the respective Offering Documents.
f. Management Discussion and Analysis Report
The Management Discussion and Analysis Report has been provided as Annexure II of the Director’s Report.
g. Profile of directors seeking appointment / re-appointment
Profile of the directors seeking appointment / re-appointment forms part of the Notice of the AGM.
h. Certification from Managing Director and Chief Financial Officer
The requisite certification from the Chairman & Managing Director and Chief Financial Officer for the financial year 2009-10 required to be given under Clause 49(V) was placed before the Board of Directors of the Company at Board Meeting held on May 29, 2010. A copy thereof is reproduced in this report.
i. Details of non-compliance with regard to capital market
With regards to the matters related to capital markets, the Company has complied with all requirements of the Listing Agreement as well as SEBI regulations and guidelines. No penalties were imposed or strictures passed against the Company by the Stock Exchanges, SEBI or any other statutory authority during the last three years in this regard. The Company has paid listing fees to the Stock Exchanges and annual custodial fees to the depositories for the Financial Year 2010-11, in terms of Clause 38 of Listing Agreement. There were no penalties imposed nor strictures passed on the Company by the Stock Exchanges, SEBI or any other statutory authority on any matter related to capital markets, during last three years.
j. Details of compliance with mandatory requirements and adoption of non-mandatory requirements of Clause 49 of the Listing Agreement
The Company has complied with all the mandatory requirements as mandated under Clause 49 of the Listing Agreement. A certificate from the statutory auditors of the Company to this effect has been included in this report. Besides mandatory requirements, the Company has constituted a Remuneration Committee to consider and recommend the remuneration of the Executive Directors and approval and administration of the Employee Stock Option Plans (ESOPs).
k. Whistle Blower Policy
The Company does not have a formal whistle blower policy. However, the Company has its intranet portal, wherein all the employees are free to express their feedback/suggestions/complaints, if any. The same is further supported by surveys of employees conducted by independent global agencies.
l. Means of Communication
(i) Quarterly / Annual Results
The Quarterly/Annual results and notices as required under Clause 41 of the Listing Agreement are normally published in the 'The Financial Express' (English & Gujarati editions).
(ii) Posting of information on the website of the Company
The Annual/Quarterly results of the Company, shareholding pattern, the official news releases, notifications to
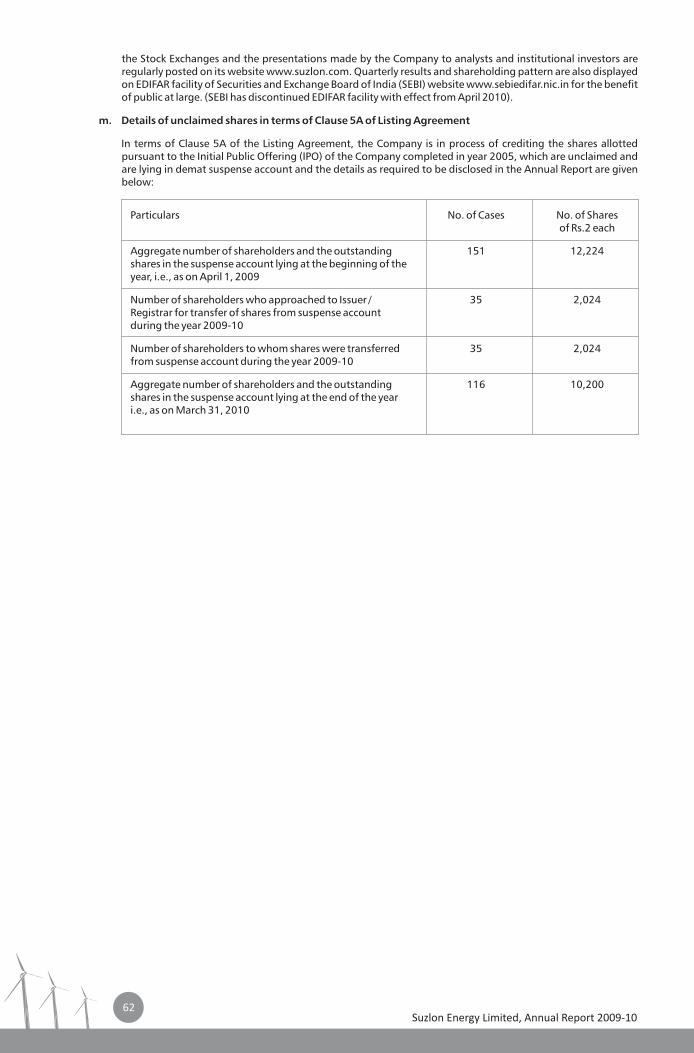
62Suzlon Energy Limited, Annual Report 2009-10
the Stock Exchanges and the presentations made by the Company to analysts and institutional investors are regularly posted on its website www.suzlon.com. Quarterly results and shareholding pattern are also displayed on EDIFAR facility of Securities and Exchange Board of India (SEBI) website www.sebiedifar.nic.in for the benefit of public at large. (SEBI has discontinued EDIFAR facility with effect from April 2010).
m. Details of unclaimed shares in terms of Clause 5A of Listing Agreement
In terms of Clause 5A of the Listing Agreement, the Company is in process of crediting the shares allotted pursuant to the Initial Public Offering (IPO) of the Company completed in year 2005, which are unclaimed and are lying in demat suspense account and the details as required to be disclosed in the Annual Report are given below:
Particulars No. of Cases No. of Sharesof Rs.2 each
Aggregate number of shareholders and the outstanding 151 12,224shares in the suspense account lying at the beginning of the year, i.e., as on April 1, 2009
Number of shareholders who approached to Issuer / 35 2,024Registrar for transfer of shares from suspense account during the year 2009-10
Number of shareholders to whom shares were transferred 35 2,024from suspense account during the year 2009-10
Aggregate number of shareholders and the outstanding 116 10,200shares in the suspense account lying at the end of the year i.e., as on March 31, 2010
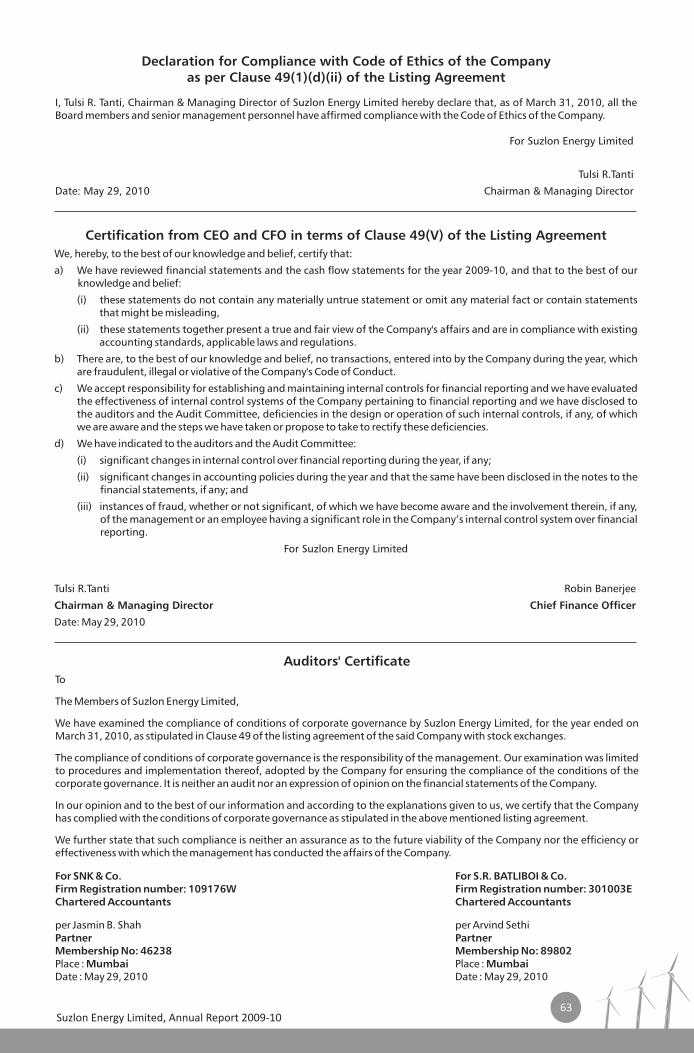
63Suzlon Energy Limited, Annual Report 2009-10
Declaration for Compliance with Code of Ethics of the Company as per Clause 49(1)(d)(ii) of the Listing Agreement
I, Tulsi R. Tanti, Chairman & Managing Director of Suzlon Energy Limited hereby declare that, as of March 31, 2010, all the Board members and senior management personnel have affirmed compliance with the Code of Ethics of the Company.
For Suzlon Energy Limited
Tulsi R.Tanti
Date: May 29, 2010 Chairman & Managing Director
Auditors' Certificate
To
The Members of Suzlon Energy Limited,
We have examined the compliance of conditions of corporate governance by Suzlon Energy Limited, for the year ended on March 31, 2010, as stipulated in Clause 49 of the listing agreement of the said Company with stock exchanges.
The compliance of conditions of corporate governance is the responsibility of the management. Our examination was limited to procedures and implementation thereof, adopted by the Company for ensuring the compliance of the conditions of the corporate governance. It is neither an audit nor an expression of opinion on the financial statements of the Company.
In our opinion and to the best of our information and according to the explanations given to us, we certify that the Company has complied with the conditions of corporate governance as stipulated in the above mentioned listing agreement.
We further state that such compliance is neither an assurance as to the future viability of the Company nor the efficiency or effectiveness with which the management has conducted the affairs of the Company.
For SNK & Co. For S.R. BATLIBOI & Co.Firm Registration number: 109176W Firm Registration number: 301003EChartered Accountants Chartered Accountants
per Jasmin B. Shah per Arvind SethiPartner PartnerMembership No: 46238 Membership No: 89802Place : Mumbai Place : MumbaiDate : May 29, 2010 Date : May 29, 2010
Certification from CEO and CFO in terms of Clause 49(V) of the Listing Agreement
We, hereby, to the best of our knowledge and belief, certify that:
a) We have reviewed financial statements and the cash flow statements for the year 2009-10, and that to the best of our knowledge and belief:
(i) these statements do not contain any materially untrue statement or omit any material fact or contain statements that might be misleading,
(ii) these statements together present a true and fair view of the Company's affairs and are in compliance with existing accounting standards, applicable laws and regulations.
b) There are, to the best of our knowledge and belief, no transactions, entered into by the Company during the year, which are fraudulent, illegal or violative of the Company's Code of Conduct.
c) We accept responsibility for establishing and maintaining internal controls for financial reporting and we have evaluated the effectiveness of internal control systems of the Company pertaining to financial reporting and we have disclosed to the auditors and the Audit Committee, deficiencies in the design or operation of such internal controls, if any, of which we are aware and the steps we have taken or propose to take to rectify these deficiencies.
d) We have indicated to the auditors and the Audit Committee:
(i) significant changes in internal control over financial reporting during the year, if any;
(ii) significant changes in accounting policies during the year and that the same have been disclosed in the notes to the financial statements, if any; and
(iii) instances of fraud, whether or not significant, of which we have become aware and the involvement therein, if any, of the management or an employee having a significant role in the Company’s internal control system over financial reporting.
For Suzlon Energy Limited
Tulsi R.Tanti Robin Banerjee
Chairman & Managing Director Chief Finance Officer
Date: May 29, 2010
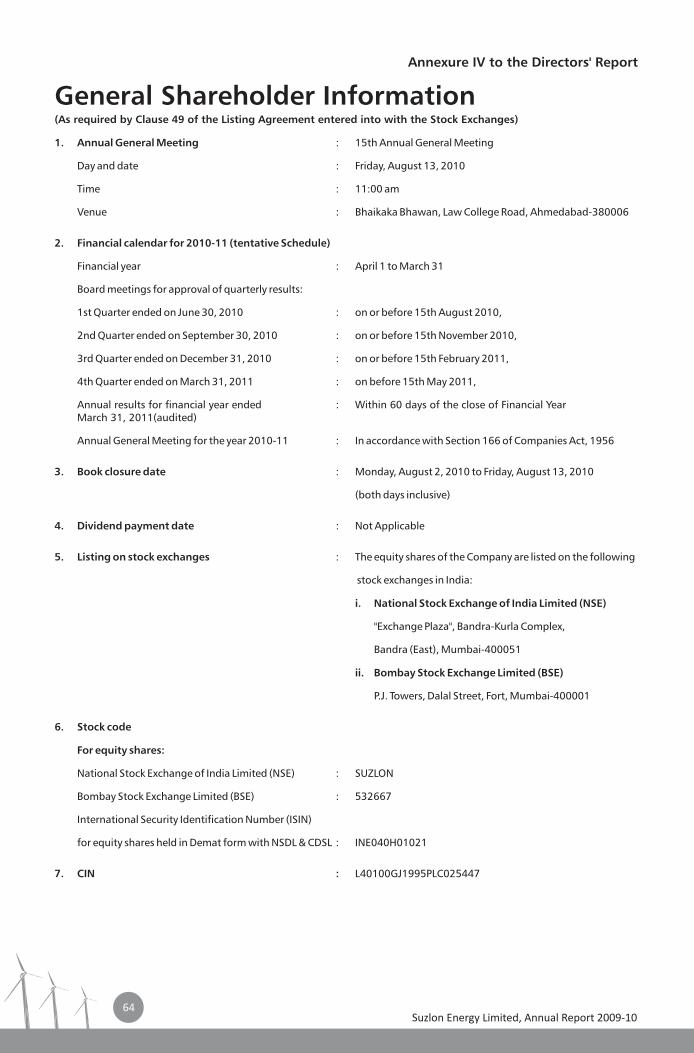
Annexure IV to the Directors' Report
General Shareholder Information(As required by Clause 49 of the Listing Agreement entered into with the Stock Exchanges)
1. Annual General Meeting : 15th Annual General Meeting
Day and date : Friday, August 13, 2010
Time : 11:00 am
Venue : Bhaikaka Bhawan, Law College Road, Ahmedabad-380006
2. Financial calendar for 2010-11 (tentative Schedule)
Financial year : April 1 to March 31
Board meetings for approval of quarterly results:
1st Quarter ended on June 30, 2010 : on or before 15th August 2010,
2nd Quarter ended on September 30, 2010 : on or before 15th November 2010,
3rd Quarter ended on December 31, 2010 : on or before 15th February 2011,
4th Quarter ended on March 31, 2011 : on before 15th May 2011,
Annual results for financial year ended : Within 60 days of the close of Financial YearMarch 31, 2011(audited)
Annual General Meeting for the year 2010-11 : In accordance with Section 166 of Companies Act, 1956
3. Book closure date : Monday, August 2, 2010 to Friday, August 13, 2010
(both days inclusive)
4. Dividend payment date : Not Applicable
5. Listing on stock exchanges : The equity shares of the Company are listed on the following
stock exchanges in India:
i. National Stock Exchange of India Limited (NSE)
"Exchange Plaza", Bandra-Kurla Complex,
Bandra (East), Mumbai-400051
ii. Bombay Stock Exchange Limited (BSE)
P.J. Towers, Dalal Street, Fort, Mumbai-400001
6. Stock code
For equity shares:
National Stock Exchange of India Limited (NSE) : SUZLON
Bombay Stock Exchange Limited (BSE) : 532667
International Security Identification Number (ISIN)
for equity shares held in Demat form with NSDL & CDSL : INE040H01021
7. CIN : L40100GJ1995PLC025447
Suzlon Energy Limited, Annual Report 2009-1064
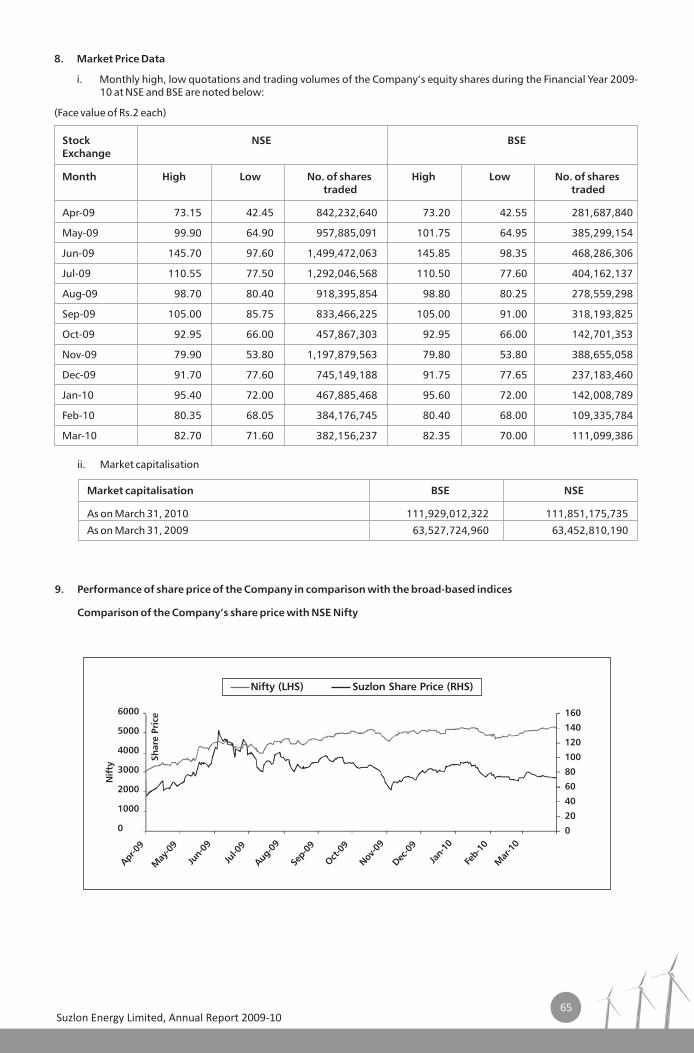
Suzlon Energy Limited, Annual Report 2009-10
Stock Exchange
Month High Low No. of shares High Low No. of shares traded traded
Apr-09 73.15 42.45 842,232,640 73.20 42.55 281,687,840
May-09 99.90 64.90 957,885,091 101.75 64.95 385,299,154
Jun-09 145.70 97.60 1,499,472,063 145.85 98.35 468,286,306
Jul-09 110.55 77.50 1,292,046,568 110.50 77.60 404,162,137
Aug-09 98.70 80.40 918,395,854 98.80 80.25 278,559,298
Sep-09 105.00 85.75 833,466,225 105.00 91.00 318,193,825
Oct-09 92.95 66.00 457,867,303 92.95 66.00 142,701,353
Nov-09 79.90 53.80 1,197,879,563 79.80 53.80 388,655,058
Dec-09 91.70 77.60 745,149,188 91.75 77.65 237,183,460
Jan-10 95.40 72.00 467,885,468 95.60 72.00 142,008,789
Feb-10 80.35 68.05 384,176,745 80.40 68.00 109,335,784
Mar-10 82.70 71.60 382,156,237 82.35 70.00 111,099,386
NSE BSE
ii. Market capitalisation
Market capitalisation BSE NSE
As on March 31, 2010 111,929,012,322 111,851,175,735
As on March 31, 2009 63,527,724,960 63,452,810,190
9. Performance of share price of the Company in comparison with the broad-based indices
Comparison of the Company’s share price with NSE Nifty
Nifty (LHS) Suzlon Share Price (RHS)
6000
5000
4000
3000
2000
1000
0
Apr-0
9
May
-09
Jun-
09
Jul-0
9
Aug-0
9
Sep-
09
Oct
-09
Nov
-09
Dec
-09
Jan-
10
Feb-
10
Mar
-10
Nif
ty
160
140
120
100
80
60
40
20
0
Sh
are
Pri
ce
8. Market Price Data
i. Monthly high, low quotations and trading volumes of the Company’s equity shares during the Financial Year 2009-10 at NSE and BSE are noted below:
(Face value of Rs.2 each)
65
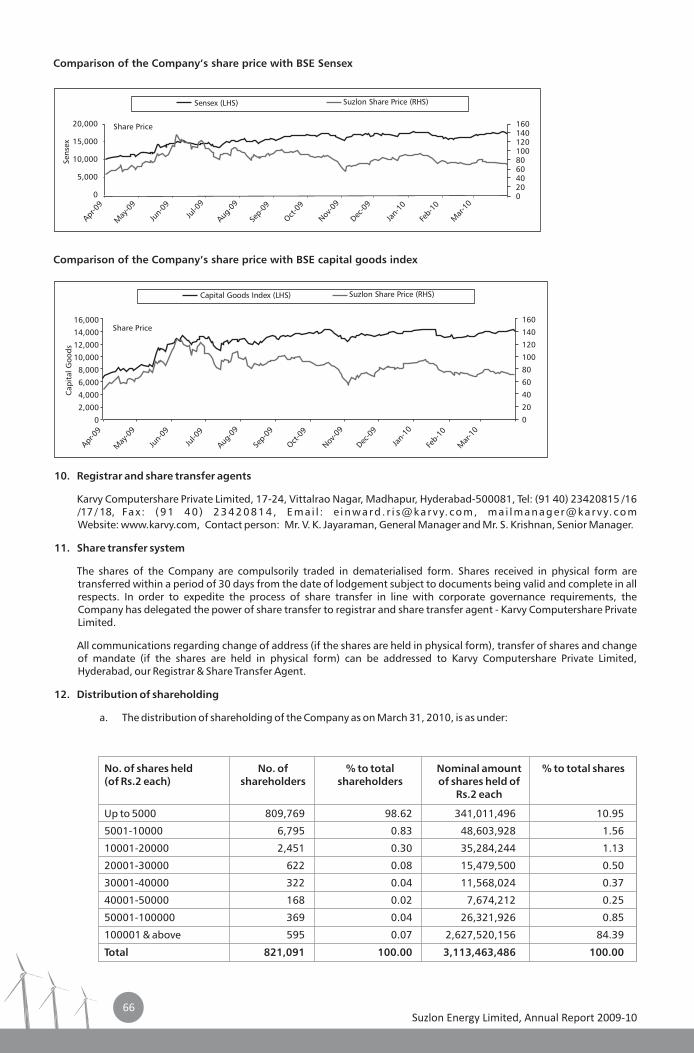
Suzlon Energy Limited, Annual Report 2009-10
Capital Goods Index (LHS) Suzlon Share Price (RHS)
16,000
14,000
12,000
10,000
8,000
6,000
4,000
2,000
0
Apr-0
9
May
-09
Jun-
09
Jul-0
9
Aug-0
9
Sep-
09
Oct-0
9
Nov-0
9
Dec-0
9
Jan-
10
Feb-
10
Mar
-10
Cap
ital
Goo
ds
Share Price160
140
120
100
80
60
40
20
0
Comparison of the Company’s share price with BSE Sensex
Comparison of the Company’s share price with BSE capital goods index
10. Registrar and share transfer agents
Karvy Computershare Private Limited, 17-24, Vittalrao Nagar, Madhapur, Hyderabad-500081, Tel: (91 40) 23420815 /16 /17 / 18, Fax : (91 40 ) 23420814 , Ema i l : e inward . r i s@karvy. com, ma i lmanager@karvy. com Website: www.karvy.com, Contact person: Mr. V. K. Jayaraman, General Manager and Mr. S. Krishnan, Senior Manager.
11. Share transfer system
The shares of the Company are compulsorily traded in dematerialised form. Shares received in physical form are transferred within a period of 30 days from the date of lodgement subject to documents being valid and complete in all respects. In order to expedite the process of share transfer in line with corporate governance requirements, the Company has delegated the power of share transfer to registrar and share transfer agent - Karvy Computershare Private Limited.
All communications regarding change of address (if the shares are held in physical form), transfer of shares and change of mandate (if the shares are held in physical form) can be addressed to Karvy Computershare Private Limited, Hyderabad, our Registrar & Share Transfer Agent.
12. Distribution of shareholding
a. The distribution of shareholding of the Company as on March 31, 2010, is as under:
No. of shares held (of Rs.2 each) shareholders shareholders of shares held of
Rs.2 each
Up to 5000 809,769 98.62 341,011,496 10.95
5001-10000 6,795 0.83 48,603,928 1.56
10001-20000 2,451 0.30 35,284,244 1.13
20001-30000 622 0.08 15,479,500 0.50
30001-40000 322 0.04 11,568,024 0.37
40001-50000 168 0.02 7,674,212 0.25
50001-100000 369 0.04 26,321,926 0.85
100001 & above 595 0.07 2,627,520,156 84.39
Total 821,091 100.00 3,113,463,486 100.00
No. of % to total Nominal amount % to total shares
Sensex (LHS) Suzlon Share Price (RHS)
Apr-0
9
Sens
ex
May
-09
Jun-
09
Jul-0
9
Aug-0
9
Sep-
09
Oct-0
9
Nov-0
9
Dec-0
9
Jan-
10
Feb-
10
Mar
-10
Share Price20,000
15,000
10,000
5,000
0
160140120100806040200
66
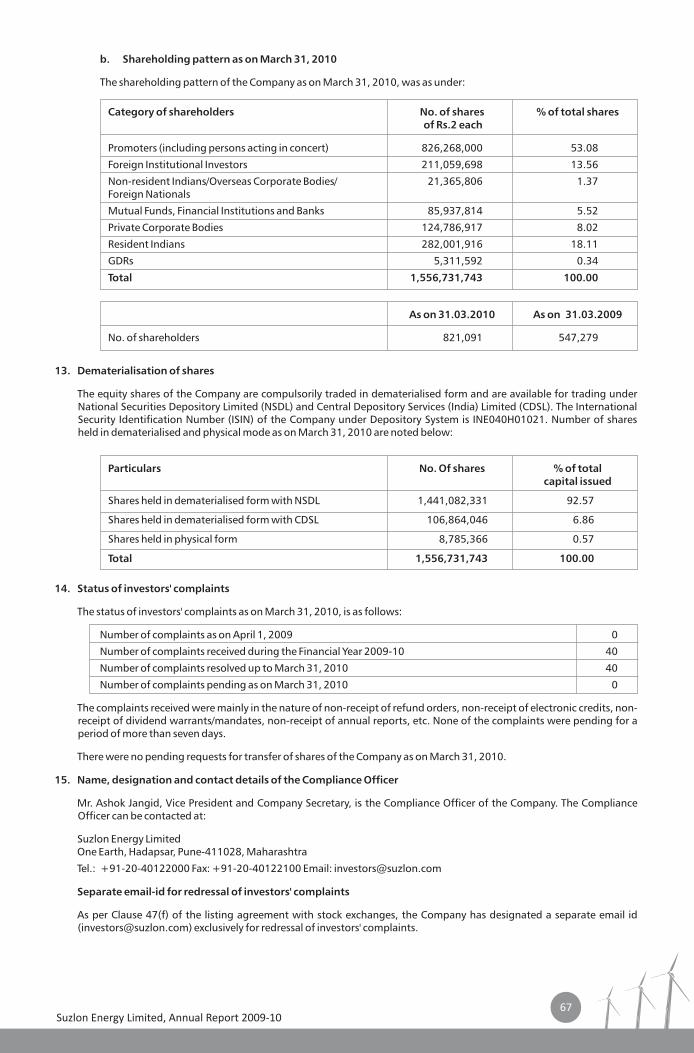
Suzlon Energy Limited, Annual Report 2009-10
Category of shareholders No. of shares of Rs.2 each
Promoters (including persons acting in concert) 826,268,000 53.08
Foreign Institutional Investors 211,059,698 13.56
Non-resident Indians/Overseas Corporate Bodies/ 21,365,806 1.37Foreign Nationals
Mutual Funds, Financial Institutions and Banks 85,937,814 5.52
Private Corporate Bodies 124,786,917 8.02
Resident Indians 282,001,916 18.11
GDRs 5,311,592 0.34
Total 1,556,731,743 100.00
% of total shares
As on 31.03.2010 As on 31.03.2009
No. of shareholders 821,091 547,279
Particulars No. Of shares % of total capital issued
Shares held in dematerialised form with NSDL 1,441,082,331 92.57
Shares held in dematerialised form with CDSL 106,864,046 6.86
Shares held in physical form 8,785,366 0.57
Total 1,556,731,743 100.00
b. Shareholding pattern as on March 31, 2010
The shareholding pattern of the Company as on March 31, 2010, was as under:
13. Dematerialisation of shares
The equity shares of the Company are compulsorily traded in dematerialised form and are available for trading under National Securities Depository Limited (NSDL) and Central Depository Services (India) Limited (CDSL). The International Security Identification Number (ISIN) of the Company under Depository System is INE040H01021. Number of shares held in dematerialised and physical mode as on March 31, 2010 are noted below:
14. Status of investors' complaints
The status of investors' complaints as on March 31, 2010, is as follows:
Number of complaints as on April 1, 2009 0
Number of complaints received during the Financial Year 2009-10 40
Number of complaints resolved up to March 31, 2010 40
Number of complaints pending as on March 31, 2010 0
The complaints received were mainly in the nature of non-receipt of refund orders, non-receipt of electronic credits, non-receipt of dividend warrants/mandates, non-receipt of annual reports, etc. None of the complaints were pending for a period of more than seven days.
There were no pending requests for transfer of shares of the Company as on March 31, 2010.
15. Name, designation and contact details of the Compliance Officer
Mr. Ashok Jangid, Vice President and Company Secretary, is the Compliance Officer of the Company. The Compliance Officer can be contacted at:
Suzlon Energy LimitedOne Earth, Hadapsar, Pune-411028, Maharashtra
Tel.: +91-20-40122000 Fax: +91-20-40122100 Email: [email protected]
Separate email-id for redressal of investors' complaints
As per Clause 47(f) of the listing agreement with stock exchanges, the Company has designated a separate email id ([email protected]) exclusively for redressal of investors' complaints.
67
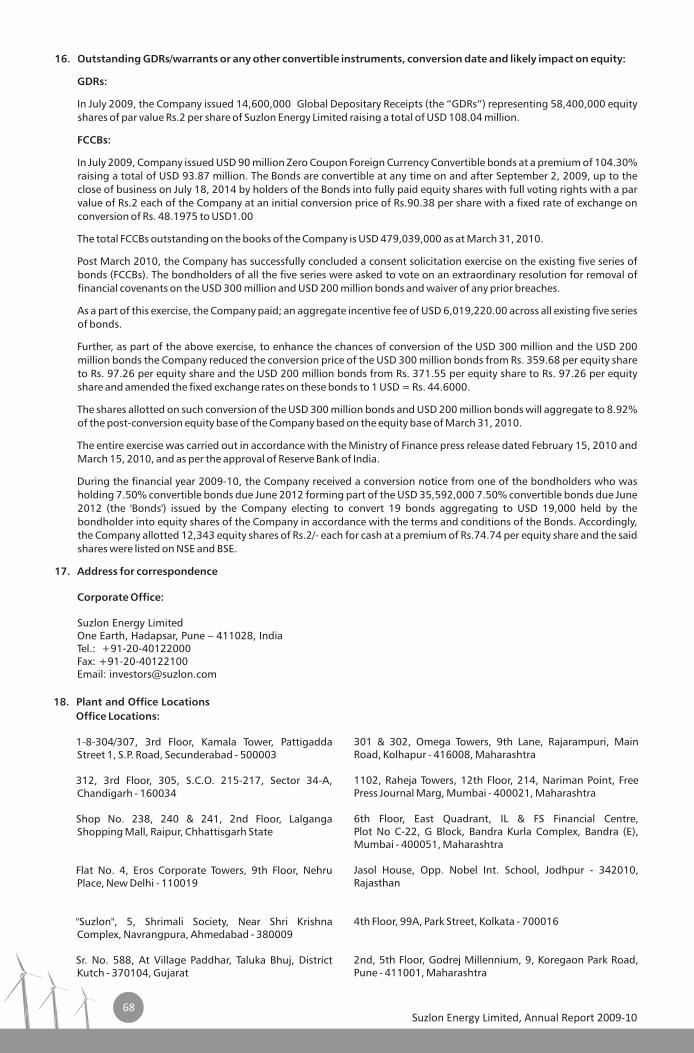
Suzlon Energy Limited, Annual Report 2009-10
16. Outstanding GDRs/warrants or any other convertible instruments, conversion date and likely impact on equity:
GDRs:
In July 2009, the Company issued 14,600,000 Global Depositary Receipts (the “GDRs”) representing 58,400,000 equity shares of par value Rs.2 per share of Suzlon Energy Limited raising a total of USD 108.04 million.
FCCBs:
In July 2009, Company issued USD 90 million Zero Coupon Foreign Currency Convertible bonds at a premium of 104.30% raising a total of USD 93.87 million. The Bonds are convertible at any time on and after September 2, 2009, up to the close of business on July 18, 2014 by holders of the Bonds into fully paid equity shares with full voting rights with a par value of Rs.2 each of the Company at an initial conversion price of Rs.90.38 per share with a fixed rate of exchange on conversion of Rs. 48.1975 to USD1.00
The total FCCBs outstanding on the books of the Company is USD 479,039,000 as at March 31, 2010.
Post March 2010, the Company has successfully concluded a consent solicitation exercise on the existing five series of bonds (FCCBs). The bondholders of all the five series were asked to vote on an extraordinary resolution for removal of financial covenants on the USD 300 million and USD 200 million bonds and waiver of any prior breaches.
As a part of this exercise, the Company paid; an aggregate incentive fee of USD 6,019,220.00 across all existing five series of bonds.
Further, as part of the above exercise, to enhance the chances of conversion of the USD 300 million and the USD 200 million bonds the Company reduced the conversion price of the USD 300 million bonds from Rs. 359.68 per equity share to Rs. 97.26 per equity share and the USD 200 million bonds from Rs. 371.55 per equity share to Rs. 97.26 per equity share and amended the fixed exchange rates on these bonds to 1 USD = Rs. 44.6000.
The shares allotted on such conversion of the USD 300 million bonds and USD 200 million bonds will aggregate to 8.92% of the post-conversion equity base of the Company based on the equity base of March 31, 2010.
The entire exercise was carried out in accordance with the Ministry of Finance press release dated February 15, 2010 and March 15, 2010, and as per the approval of Reserve Bank of India.
During the financial year 2009-10, the Company received a conversion notice from one of the bondholders who was holding 7.50% convertible bonds due June 2012 forming part of the USD 35,592,000 7.50% convertible bonds due June 2012 (the 'Bonds') issued by the Company electing to convert 19 bonds aggregating to USD 19,000 held by the bondholder into equity shares of the Company in accordance with the terms and conditions of the Bonds. Accordingly, the Company allotted 12,343 equity shares of Rs.2/- each for cash at a premium of Rs.74.74 per equity share and the said shares were listed on NSE and BSE.
17. Address for correspondence
Corporate Office:
Suzlon Energy LimitedOne Earth, Hadapsar, Pune – 411028, IndiaTel.: +91-20-40122000Fax: +91-20-40122100Email: [email protected]
68
Office Locations:
1-8-304/307, 3rd Floor, Kamala Tower, Pattigadda Street 1, S.P. Road, Secunderabad - 500003
312, 3rd Floor, 305, S.C.O. 215-217, Sector 34-A, Chandigarh - 160034
Shop No. 238, 240 & 241, 2nd Floor, Lalganga Shopping Mall, Raipur, Chhattisgarh State
Flat No. 4, Eros Corporate Towers, 9th Floor, Nehru Place, New Delhi - 110019
"Suzlon", 5, Shrimali Society, Near Shri Krishna Complex, Navrangpura, Ahmedabad - 380009
Sr. No. 588, At Village Paddhar, Taluka Bhuj, District Kutch - 370104, Gujarat
301 & 302, Omega Towers, 9th Lane, Rajarampuri, Main Road, Kolhapur - 416008, Maharashtra
1102, Raheja Towers, 12th Floor, 214, Nariman Point, Free Press Journal Marg, Mumbai - 400021, Maharashtra
6th Floor, East Quadrant, IL & FS Financial Centre, Plot No C-22, G Block, Bandra Kurla Complex, Bandra (E), Mumbai - 400051, Maharashtra
Jasol House, Opp. Nobel Int. School, Jodhpur - 342010, Rajasthan
4th Floor, 99A, Park Street, Kolkata - 700016
2nd, 5th Floor, Godrej Millennium, 9, Koregaon Park Road, Pune - 411001, Maharashtra
18. Plant and Office Locations
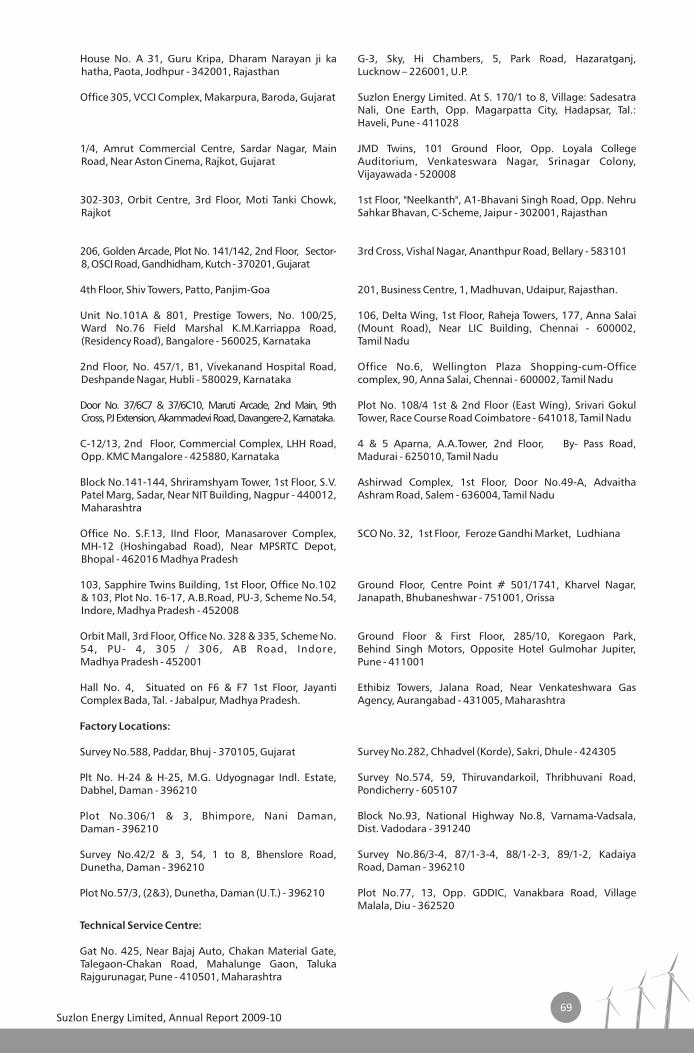
Suzlon Energy Limited, Annual Report 2009-1069
House No. A 31, Guru Kripa, Dharam Narayan ji ka hatha, Paota, Jodhpur - 342001, Rajasthan
Office 305, VCCI Complex, Makarpura, Baroda, Gujarat
1/4, Amrut Commercial Centre, Sardar Nagar, Main Road, Near Aston Cinema, Rajkot, Gujarat
302-303, Orbit Centre, 3rd Floor, Moti Tanki Chowk, Rajkot
206, Golden Arcade, Plot No. 141/142, 2nd Floor, Sector-8, OSCI Road, Gandhidham, Kutch - 370201, Gujarat
4th Floor, Shiv Towers, Patto, Panjim-Goa
Unit No.101A & 801, Prestige Towers, No. 100/25, Ward No.76 Field Marshal K.M.Karriappa Road, (Residency Road), Bangalore - 560025, Karnataka
2nd Floor, No. 457/1, B1, Vivekanand Hospital Road, Deshpande Nagar, Hubli - 580029, Karnataka
Door No. 37/6C7 & 37/6C10, Maruti Arcade, 2nd Main, 9th Cross, PJ Extension, Akammadevi Road, Davangere-2, Karnataka.
C-12/13, 2nd Floor, Commercial Complex, LHH Road, Opp. KMC Mangalore - 425880, Karnataka
Block No.141-144, Shriramshyam Tower, 1st Floor, S.V. Patel Marg, Sadar, Near NIT Building, Nagpur - 440012, Maharashtra
Office No. S.F.13, IInd Floor, Manasarover Complex, MH-12 (Hoshingabad Road), Near MPSRTC Depot, Bhopal - 462016 Madhya Pradesh
103, Sapphire Twins Building, 1st Floor, Office No.102 & 103, Plot No. 16-17, A.B.Road, PU-3, Scheme No.54, Indore, Madhya Pradesh - 452008
Orbit Mall, 3rd Floor, Office No. 328 & 335, Scheme No. 54, PU- 4, 305 / 306, AB Road, Indore, Madhya Pradesh - 452001
Hall No. 4, Situated on F6 & F7 1st Floor, Jayanti Complex Bada, Tal. - Jabalpur, Madhya Pradesh.
Factory Locations:
Survey No.588, Paddar, Bhuj - 370105, Gujarat
Plt No. H-24 & H-25, M.G. Udyognagar Indl. Estate, Dabhel, Daman - 396210
Plot No.306/1 & 3, Bhimpore, Nani Daman,Daman - 396210
Survey No.42/2 & 3, 54, 1 to 8, Bhenslore Road, Dunetha, Daman - 396210
Plot No.57/3, (2&3), Dunetha, Daman (U.T.) - 396210
Technical Service Centre:
Gat No. 425, Near Bajaj Auto, Chakan Material Gate, Talegaon-Chakan Road, Mahalunge Gaon, Taluka Rajgurunagar, Pune - 410501, Maharashtra
G-3, Sky, Hi Chambers, 5, Park Road, Hazaratganj, Lucknow – 226001, U.P.
Suzlon Energy Limited. At S. 170/1 to 8, Village: Sadesatra Nali, One Earth, Opp. Magarpatta City, Hadapsar, Tal.: Haveli, Pune - 411028
JMD Twins, 101 Ground Floor, Opp. Loyala College Auditorium, Venkateswara Nagar, Srinagar Colony, Vijayawada - 520008
1st Floor, "Neelkanth", A1-Bhavani Singh Road, Opp. Nehru Sahkar Bhavan, C-Scheme, Jaipur - 302001, Rajasthan
3rd Cross, Vishal Nagar, Ananthpur Road, Bellary - 583101
201, Business Centre, 1, Madhuvan, Udaipur, Rajasthan.
106, Delta Wing, 1st Floor, Raheja Towers, 177, Anna Salai (Mount Road), Near LIC Building, Chennai - 600002, Tamil Nadu
Office No.6, Wellington Plaza Shopping-cum-Office complex, 90, Anna Salai, Chennai - 600002, Tamil Nadu
Plot No. 108/4 1st & 2nd Floor (East Wing), Srivari Gokul Tower, Race Course Road Coimbatore - 641018, Tamil Nadu
4 & 5 Aparna, A.A.Tower, 2nd Floor, By- Pass Road, Madurai - 625010, Tamil Nadu
Ashirwad Complex, 1st Floor, Door No.49-A, Advaitha Ashram Road, Salem - 636004, Tamil Nadu
SCO No. 32, 1st Floor, Feroze Gandhi Market, Ludhiana
Ground Floor, Centre Point # 501/1741, Kharvel Nagar, Janapath, Bhubaneshwar - 751001, Orissa
Ground Floor & First Floor, 285/10, Koregaon Park,Behind Singh Motors, Opposite Hotel Gulmohar Jupiter, Pune - 411001
Ethibiz Towers, Jalana Road, Near Venkateshwara Gas Agency, Aurangabad - 431005, Maharashtra
Survey No.282, Chhadvel (Korde), Sakri, Dhule - 424305
Survey No.574, 59, Thiruvandarkoil, Thribhuvani Road, Pondicherry - 605107
Block No.93, National Highway No.8, Varnama-Vadsala, Dist. Vadodara - 391240
Survey No.86/3-4, 87/1-3-4, 88/1-2-3, 89/1-2, Kadaiya Road, Daman - 396210
Plot No.77, 13, Opp. GDDIC, Vanakbara Road, Village Malala, Diu - 362520
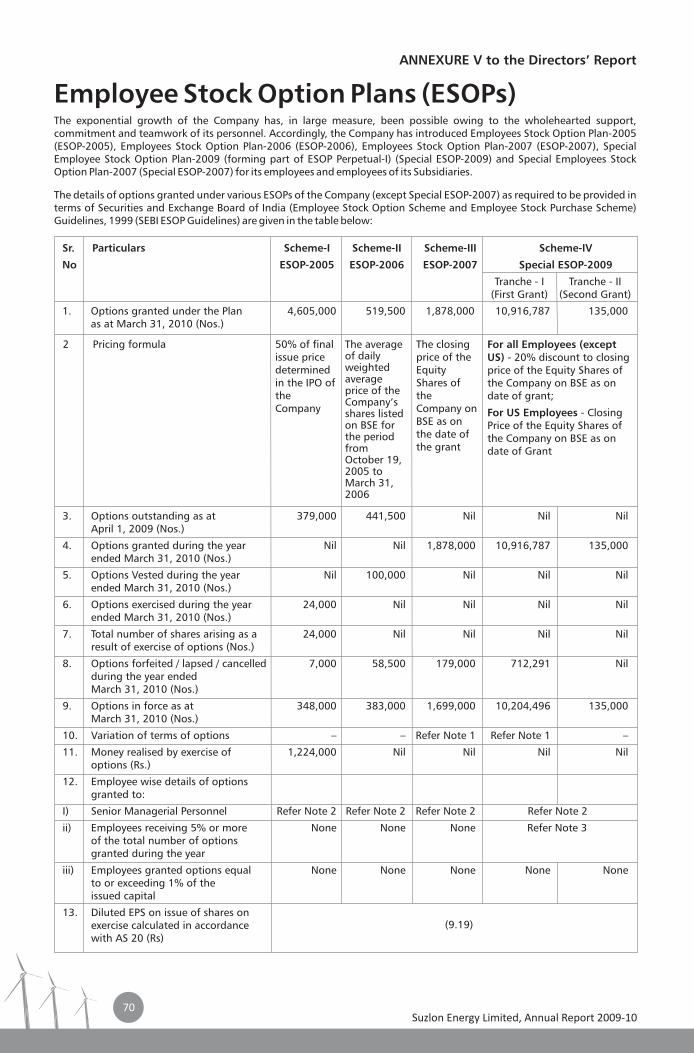
3. Options outstanding as at 379,000 441,500 Nil Nil NilApril 1, 2009 (Nos.)
4. Options granted during the year Nil Nil 1,878,000 10,916,787 135,000ended March 31, 2010 (Nos.)
5. Options Vested during the year Nil 100,000 Nil Nil Nilended March 31, 2010 (Nos.)
6. Options exercised during the year 24,000 Nil Nil Nil Nilended March 31, 2010 (Nos.)
7. Total number of shares arising as a 24,000 Nil Nil Nil Nilresult of exercise of options (Nos.)
8. Options forfeited / lapsed / cancelled 7,000 58,500 179,000 712,291 Nilduring the year ended March 31, 2010 (Nos.)
9. Options in force as at 348,000 383,000 1,699,000 10,204,496 135,000March 31, 2010 (Nos.)
10. Variation of terms of options – – Refer Note 1 Refer Note 1 –
11. Money realised by exercise of 1,224,000 Nil Nil Nil Niloptions (Rs.)
12. Employee wise details of options granted to:
I) Senior Managerial Personnel Refer Note 2 Refer Note 2 Refer Note 2 Refer Note 2
ii) Employees receiving 5% or more None None None Refer Note 3of the total number of options granted during the year
iii) Employees granted options equal None None None None Noneto or exceeding 1% of the issued capital
13. Diluted EPS on issue of shares on exercise calculated in accordance with AS 20 (Rs)
ANNEXURE V to the Directors’ Report
Employee Stock Option Plans (ESOPs)The exponential growth of the Company has, in large measure, been possible owing to the wholehearted support, commitment and teamwork of its personnel. Accordingly, the Company has introduced Employees Stock Option Plan-2005 (ESOP-2005), Employees Stock Option Plan-2006 (ESOP-2006), Employees Stock Option Plan-2007 (ESOP-2007), Special Employee Stock Option Plan-2009 (forming part of ESOP Perpetual-I) (Special ESOP-2009) and Special Employees Stock Option Plan-2007 (Special ESOP-2007) for its employees and employees of its Subsidiaries.
The details of options granted under various ESOPs of the Company (except Special ESOP-2007) as required to be provided in terms of Securities and Exchange Board of India (Employee Stock Option Scheme and Employee Stock Purchase Scheme) Guidelines, 1999 (SEBI ESOP Guidelines) are given in the table below:
Sr. Particulars Scheme-I Scheme-II Scheme-III Scheme-IV
No ESOP-2005 ESOP-2006 ESOP-2007 Special ESOP-2009
Tranche - I Tranche - II(First Grant) (Second Grant)
1. Options granted under the Plan 4,605,000 519,500 1,878,000 10,916,787 135,000as at March 31, 2010 (Nos.)
2 Pricing formula 50% of final issue price determined in the IPO of the Company
The average of daily weighted average price of the Company’s shares listed on BSE for the period from October 19, 2005 to March 31, 2006
The closing price of the Equity Shares of the Company on BSE as on the date of the grant
For all Employees (except US) - 20% discount to closing price of the Equity Shares of the Company on BSE as on date of grant;
For US Employees - Closing Price of the Equity Shares of the Company on BSE as on date of Grant
(9.19)
Suzlon Energy Limited, Annual Report 2009-1070
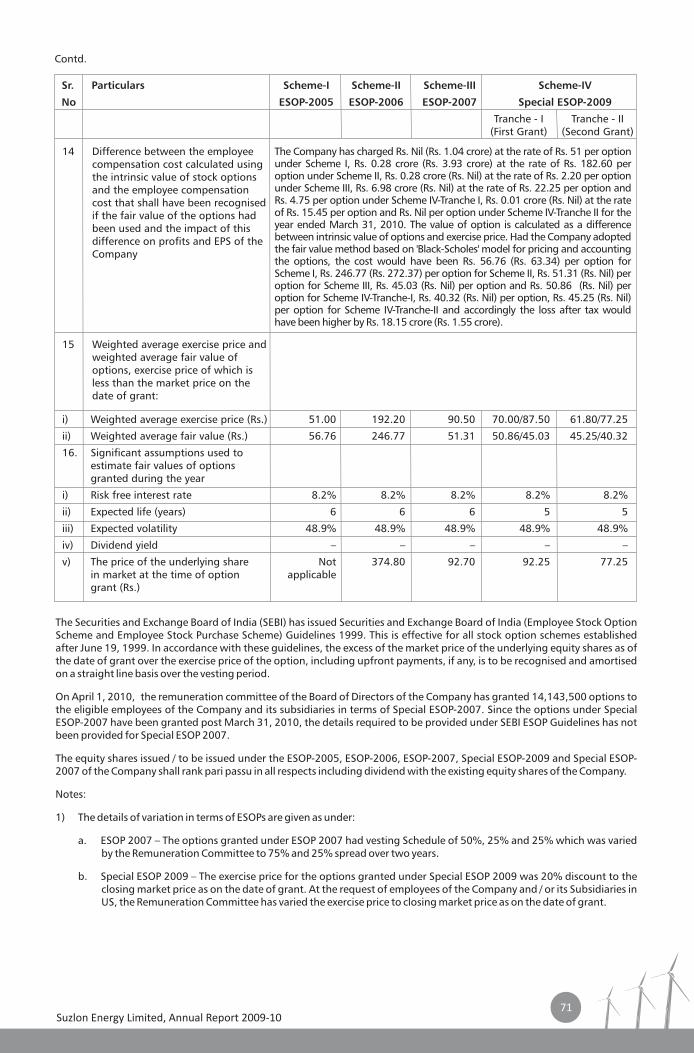
Sr. Particulars Scheme-I Scheme-II Scheme-III Scheme-IV
No ESOP-2005 ESOP-2006 ESOP-2007 Special ESOP-2009
Tranche - I Tranche - II(First Grant) (Second Grant)
Contd.
14 Difference between the employee compensation cost calculated using the intrinsic value of stock options and the employee compensation cost that shall have been recognised if the fair value of the options had been used and the impact of this difference on profits and EPS of the Company
The Company has charged Rs. Nil (Rs. 1.04 crore) at the rate of Rs. 51 per option under Scheme I, Rs. 0.28 crore (Rs. 3.93 crore) at the rate of Rs. 182.60 per option under Scheme II, Rs. 0.28 crore (Rs. Nil) at the rate of Rs. 2.20 per option under Scheme III, Rs. 6.98 crore (Rs. Nil) at the rate of Rs. 22.25 per option and Rs. 4.75 per option under Scheme IV-Tranche I, Rs. 0.01 crore (Rs. Nil) at the rate of Rs. 15.45 per option and Rs. Nil per option under Scheme IV-Tranche II for the year ended March 31, 2010. The value of option is calculated as a difference between intrinsic value of options and exercise price. Had the Company adopted the fair value method based on 'Black-Scholes' model for pricing and accounting the options, the cost would have been Rs. 56.76 (Rs. 63.34) per option for Scheme I, Rs. 246.77 (Rs. 272.37) per option for Scheme II, Rs. 51.31 (Rs. Nil) per option for Scheme III, Rs. 45.03 (Rs. Nil) per option and Rs. 50.86 (Rs. Nil) per option for Scheme IV-Tranche-I, Rs. 40.32 (Rs. Nil) per option, Rs. 45.25 (Rs. Nil) per option for Scheme IV-Tranche-II and accordingly the loss after tax would have been higher by Rs. 18.15 crore (Rs. 1.55 crore).
15 Weighted average exercise price and weighted average fair value of options, exercise price of which is less than the market price on the date of grant:
i) Weighted average exercise price (Rs.) 51.00 192.20 90.50 70.00/87.50 61.80/77.25
ii) Weighted average fair value (Rs.) 56.76 246.77 51.31 50.86/45.03 45.25/40.32
16. Significant assumptions used to estimate fair values of options granted during the year
i) Risk free interest rate 8.2% 8.2% 8.2% 8.2% 8.2%
ii) Expected life (years) 6 6 6 5 5
iii) Expected volatility 48.9% 48.9% 48.9% 48.9% 48.9%
iv) Dividend yield – – – – –
v) The price of the underlying share Not 374.80 92.70 92.25 77.25 in market at the time of option applicablegrant (Rs.)
The Securities and Exchange Board of India (SEBI) has issued Securities and Exchange Board of India (Employee Stock Option Scheme and Employee Stock Purchase Scheme) Guidelines 1999. This is effective for all stock option schemes established after June 19, 1999. In accordance with these guidelines, the excess of the market price of the underlying equity shares as of the date of grant over the exercise price of the option, including upfront payments, if any, is to be recognised and amortised on a straight line basis over the vesting period.
On April 1, 2010, the remuneration committee of the Board of Directors of the Company has granted 14,143,500 options to the eligible employees of the Company and its subsidiaries in terms of Special ESOP-2007. Since the options under Special ESOP-2007 have been granted post March 31, 2010, the details required to be provided under SEBI ESOP Guidelines has not been provided for Special ESOP 2007.
The equity shares issued / to be issued under the ESOP-2005, ESOP-2006, ESOP-2007, Special ESOP-2009 and Special ESOP-2007 of the Company shall rank pari passu in all respects including dividend with the existing equity shares of the Company.
Notes:
1) The details of variation in terms of ESOPs are given as under:
a. ESOP 2007 – The options granted under ESOP 2007 had vesting Schedule of 50%, 25% and 25% which was varied by the Remuneration Committee to 75% and 25% spread over two years.
b. Special ESOP 2009 – The exercise price for the options granted under Special ESOP 2009 was 20% discount to the closing market price as on the date of grant. At the request of employees of the Company and / or its Subsidiaries in US, the Remuneration Committee has varied the exercise price to closing market price as on the date of grant.
Suzlon Energy Limited, Annual Report 2009-1071
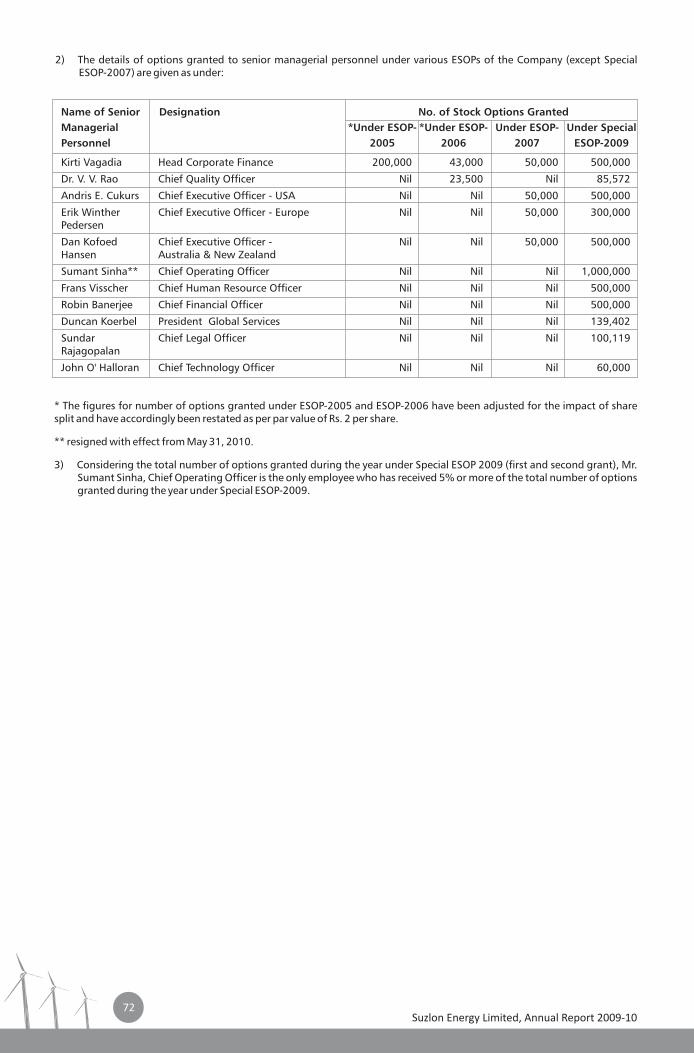
2) The details of options granted to senior managerial personnel under various ESOPs of the Company (except Special ESOP-2007) are given as under:
Name of Senior Designation No. of Stock Options Granted
Managerial *Under ESOP- *Under ESOP- Under ESOP- Under Special
Personnel 2005 2006 2007 ESOP-2009
Kirti Vagadia Head Corporate Finance 200,000 43,000 50,000 500,000
Dr. V. V. Rao Chief Quality Officer Nil 23,500 Nil 85,572
Andris E. Cukurs Chief Executive Officer - USA Nil Nil 50,000 500,000
Erik Winther Chief Executive Officer - Europe Nil Nil 50,000 300,000Pedersen
Dan Kofoed Chief Executive Officer - Nil Nil 50,000 500,000Hansen Australia & New Zealand
Sumant Sinha** Chief Operating Officer Nil Nil Nil 1,000,000
Frans Visscher Chief Human Resource Officer Nil Nil Nil 500,000
Robin Banerjee Chief Financial Officer Nil Nil Nil 500,000
Duncan Koerbel President Global Services Nil Nil Nil 139,402
Sundar Chief Legal Officer Nil Nil Nil 100,119Rajagopalan
John O' Halloran Chief Technology Officer Nil Nil Nil 60,000
* The figures for number of options granted under ESOP-2005 and ESOP-2006 have been adjusted for the impact of share split and have accordingly been restated as per par value of Rs. 2 per share.
** resigned with effect from May 31, 2010.
3) Considering the total number of options granted during the year under Special ESOP 2009 (first and second grant), Mr. Sumant Sinha, Chief Operating Officer is the only employee who has received 5% or more of the total number of options granted during the year under Special ESOP-2009.
Suzlon Energy Limited, Annual Report 2009-1072
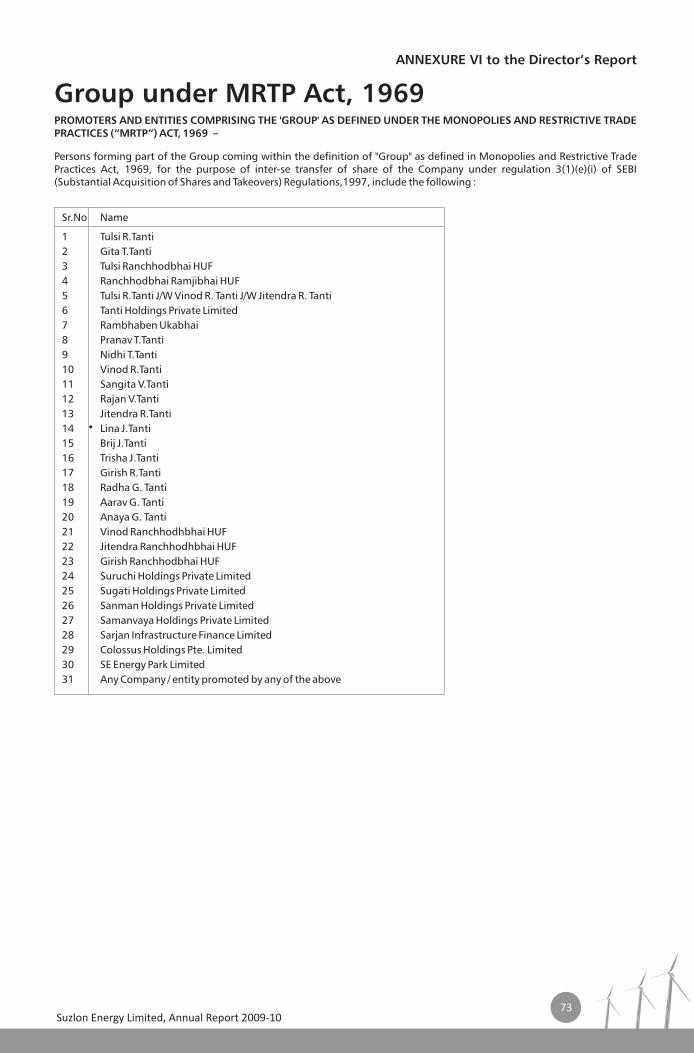
73Suzlon Energy Limited, Annual Report 2009-10
ANNEXURE VI to the Director’s Report
Group under MRTP Act, 1969PROMOTERS AND ENTITIES COMPRISING THE 'GROUP' AS DEFINED UNDER THE MONOPOLIES AND RESTRICTIVE TRADE PRACTICES (“MRTP”) ACT, 1969 –
Persons forming part of the Group coming within the definition of "Group" as defined in Monopolies and Restrictive Trade Practices Act, 1969, for the purpose of inter-se transfer of share of the Company under regulation 3(1)(e)(i) of SEBI (Substantial Acquisition of Shares and Takeovers) Regulations,1997, include the following :
Sr.No Name
1 Tulsi R.Tanti2 Gita T.Tanti3 Tulsi Ranchhodbhai HUF4 Ranchhodbhai Ramjibhai HUF5 Tulsi R.Tanti J/W Vinod R. Tanti J/W Jitendra R. Tanti6 Tanti Holdings Private Limited7 Rambhaben Ukabhai8 Pranav T.Tanti9 Nidhi T.Tanti10 Vinod R.Tanti11 Sangita V.Tanti12 Rajan V.Tanti13 Jitendra R.Tanti14 Lina J.Tanti15 Brij J.Tanti16 Trisha J.Tanti17 Girish R.Tanti18 Radha G. Tanti19 Aarav G. Tanti20 Anaya G. Tanti21 Vinod Ranchhodhbhai HUF22 Jitendra Ranchhodhbhai HUF23 Girish Ranchhodbhai HUF24 Suruchi Holdings Private Limited25 Sugati Holdings Private Limited26 Sanman Holdings Private Limited27 Samanvaya Holdings Private Limited28 Sarjan Infrastructure Finance Limited29 Colossus Holdings Pte. Limited30 SE Energy Park Limited31 Any Company / entity promoted by any of the above
•
Auditors' Report
To
The Members of Suzlon Energy Limited
1. We have audited the attached balance sheet of Suzlon Energy Limited ('the Company') as at March 31, 2010, and also the profit and loss account and the cash flow statement for the year ended on that date annexed thereto. These financial statements are the responsibility of the Company's management. Our responsibility is to express an opinion on these financial statements based on our audit.
2. We conducted our audit in accordance with auditing standards generally accepted in India. Those Standards require that we plan and perform the audit to obtain reasonable assurance about whether the financial statements are free of material misstatement. An audit includes examining, on a test basis, evidence supporting the amounts and disclosures in the financial statements. An audit also includes assessing the accounting principles used and significant estimates made by management, as well as evaluating the overall financial statement presentation. We believe that our audit provides a reasonable basis for our opinion.
3. As required by the Companies (Auditor's Report) Order, 2003 (as amended)('CARO') issued by the Central Government of India in terms of Sub-Section (4A) of Section 227 of the Companies Act, 1956, we enclose in the Annexure a statement on the matters specified in paragraphs 4 and 5 of the said Order.
4. Further to our comments in the Annexure referred to above, we report that:
i. We have obtained all the information and explanations, which to the best of our knowledge and belief were necessary for the purposes of our audit;
ii. In our opinion, proper books of account as required by law have been kept by the Company so far as appears from our examination of those books;
iii. The balance sheet, profit and loss account and cash flow statement dealt with by this report are in agreement with the books of account;
iv. In our opinion, the balance sheet, profit and loss account and cash flow statement dealt with by this report comply with the accounting standards referred to in Sub-Section (3C) of Section 211 of the Companies Act, 1956;
v. On the basis of the written representations received from the directors, as on March 31, 2010, and taken on record by the Board of Directors, we report that none of the directors is disqualified as on March 31, 2010 from being appointed as a director in terms of Clause (g) of Sub-Section (1) of Section 274 of the Companies Act, 1956;
vi. Without qualifying our opinion, we draw attention to Schedule P, Note 8(d) regarding non-provision of proportionate premium on redemption of USD 479.05 million (Rs. 2,150 crores as at March 31, 2010), Foreign Currency Convertible Bonds amounting to Rs. 377.22 crores which has been considered by the Company as a contingent liability. Since the ultimate outcome of the matter cannot be presently ascertained, no provision for the above liability that may result in future, has been made in the accompanying financial statements.
vii. In our opinion and to the best of our information and according to the explanations given to us, the said accounts give the information required by the Companies Act, 1956, in the manner so required and give a true and fair view in conformity with the accounting principles generally accepted in India:
a) in the case of the balance sheet, of the state of affairs of the Company as at March 31, 2010;
b) in the case of the profit and loss account, of the loss for the year ended on that date; and
c) in the case of the cash flow statement, of the cash flows for the year ended on that date.
For SNK & Co. For S. R. Batliboi & Co.Firm Registration number: 109176W Firm Registration number: 301003EChartered Accountants Chartered Accountants
per Jasmin B. Shah per Arvind SethiPartner PartnerMembership No.: 46238 Membership No.: 89802
Place: Mumbai Place: MumbaiDate: May 29, 2010 Date: May 29, 2010
STAND ALONE Financial Statements
74Suzlon Energy Limited, Annual Report 2009-10
Annexure referred to in paragraph 3 of our report of even date
Re: Suzlon Energy Limited
1. (a) The Company has maintained proper records showing full particulars, including quantitative details and situation of fixed assets.
(b) Fixed assets have been physically verified by management during the year in accordance with a regular programme of verification which, in our opinion, is reasonable having regard to the size of the Company and the nature of its assets. As informed, no material discrepancies were noticed on such verification.
(c) There was no substantial disposal of fixed assets during the year.
2. (a) The management has conducted physical verification of inventory at reasonable intervals during the year.
(b) The procedures of physical verification of inventory followed by management are reasonable and adequate in relation to the size of the Company and the nature of its business.
(c) The Company is maintaining proper records of inventory and no material discrepancies were noticed on physical verification.
3. (a) As informed, the Company has not granted any loans, secured or unsecured to companies, firms or other parties covered in the register maintained under Section 301 of the Companies Act, 1956. Accordingly, the provisions of Clause 4(iii) (a) to (d) of the CARO are not applicable.
(b) The Company has taken a loan from a Company covered in the register maintained under Section 301 of the Companies Act, 1956. The maximum amount involved during the year and the year-end balance of the loan taken from such party was Rs. 613.63 crores.
(c) In our opinion and according to the information and explanations given to us, the rate of interest, and other terms and conditions for such loan are prima facie not prejudicial to the interest of the Company.
(d) The loan taken by the Company is a long term loan. According to the information and explanations given to us, no repayment was due in respect of the principal portion till the balance sheet date. The payment of interest has been regular.
4. In our opinion and according to the information and explanations given to us, there is an adequate internal control system commensurate with the size of the Company and the nature of its business, for the purchase of inventory and fixed assets and for the sale of goods. During the course of our audit, no major weakness has been noticed in the internal control system in respect of these areas. During the course of our audit, we have not observed any continuing failure to correct major weakness in internal control system of the Company.
5. (a) According to the information and explanations provided by management, we are of the opinion that the particulars of contracts or arrangements referred to in Section 301 of the Act that need to be entered into the register maintained under Section 301 have been so entered.
(b) In our opinion and according to the information and explanations given to us, the transactions made in pursuance of such contracts or arrangements exceeding value of Rupees five lakhs have been entered into during the financial year at prices which are reasonable having regard to the prevailing market prices at the relevant time.
6. The Company has not accepted any deposits from the public. Accordingly, the provisions of Clause 4(vi) of the CARO are not applicable.
7. In our opinion, the Company has an internal audit system commensurate with the size and the nature of its business.
8. We have broadly reviewed the books of account maintained by the Company pursuant to the rules made by the Central Government for the maintenance of cost records under Section 209(1)(d) of the Companies Act, 1956, and are of the opinion that prima facie, the prescribed accounts and records have been made and maintained in respect of generation of electricity from wind power. We have not, however, made a detailed examination of the records with a view to determining whether they are accurate or complete.
9. (a) Undisputed statutory dues including provident fund, investor education and protection fund, employees' state insurance, income-tax, sales-tax, wealth-tax, service tax, customs duty, excise duty, cess and other material statutory dues have generally been regularly deposited with the appropriate authorities though there has been a delay in some cases. Further, since the Central Government has till date not prescribed the amount of cess payable under Section 441 A of the Companies Act, 1956, we are not in a position to comment upon the regularity or otherwise of the Company in depositing the same.
(b) According to the information and explanations given to us, no undisputed amounts payable in respect of provident fund, investor education and protection fund, employees' state insurance, income-tax, wealth-tax, service tax, sales-tax, customs duty, excise duty, cess and other undisputed statutory dues were outstanding, at the year end, for a period of more than six months from the date they became payable.
(c) According to the information and explanations given to us, there are no dues of income-tax, sales-tax, wealth-tax, service tax, customs duty, excise duty and cess which have not been deposited on account of any dispute.
75Suzlon Energy Limited, Annual Report 2009-10
10. The Company has no accumulated losses at the end of the financial year. It has incurred cash losses in the current and immediately preceding financial year.
11. Based on our audit procedures and as per the information and explanations given by management, the Company has delayed repayment of dues to Financial Institutions, Banks and Debenture holders in respect of Letters of Credit/Buyers' Credit, Term Loan, Working Capital Demand Loan, Short-Term Loan and Interest Liabilities. The following are the details of the delays:
As at year-end, these delays have been rectified and hence no delays exist as at March 31, 2010.
12. According to the information and explanations given to us and based on the documents and records produced to us, the Company has not granted loans and advances on the basis of security by way of pledge of shares, debentures and other securities. Accordingly, the provisions of Clause 4(xii) of the CARO are not applicable.
13. In our opinion, the Company is not a chit fund or a nidhi /mutual benefit fund/society. Accordingly, the provisions of Clause 4(xiii) of the CARO are not applicable.
14. In our opinion, the Company does not deal or trade in shares, securities, debentures and other investments. Accordingly, the provisions of Clause 4(xiv) of the CARO are not applicable.
15. According to the information and explanations given to us, the Company has given guarantee for loans taken by others from banks or financial institutions, the terms and conditions whereof in our opinion are prima-facie not prejudicial to the interests of the Company.
16. In our opinion and according to the information and explanations given to us, on an overall basis, the term loans have been applied for the purposes for which they were obtained.
17. According to the information and explanations given to us and on an overall examination of the balance sheet of the Company, we report that no funds raised on short-term basis have been used for long-term investment.
18. The Company has not made any preferential allotment of shares to parties or companies covered in the register maintained under Section 301 of the Companies Act, 1956. Accordingly, the provisions of Clause 4(xviii) of the CARO are not applicable.
19. No debentures have been issued by the Company during the year. The debentures outstanding at the beginning of the year, have been converted into a Rupee Term Loan during the year. Further, the Company has unsecured Foreign Currency Convertible Bonds outstanding during the year on which no security or charge is required to be created.
20. We have verified that the end use of money raised from issuance of Global Depository Receipts is as disclosed in the notes to the financial statements.
21. Based upon the audit procedures performed for the purpose of reporting the true and fair view of the financial statements and as per the information and explanations given by management, we report that no fraud on or by the Company has been noticed or reported during the course of our audit.
For SNK & Co. For S. R. Batliboi & Co.Firm Registration number: 109176W Firm Registration number: 301003EChartered Accountants Chartered Accountants
per Jasmin B. Shah per Arvind SethiPartner PartnerMembership No.: 46238 Membership No.: 89802
Place: Mumbai Place: MumbaiDate: May 29, 2010 Date: May 29, 2010
Particulars Amount (Rs. Crores) Period of Delays
Letters of Credit/Buyers' Credit 567.88 Up to 90 days
Term Loan 8.19 Up to 36 days
Working Capital Demand Loan 301.52 Up to 125 days
Short-Term Loan 99.69 Up to 12 Days
Interest Liabilities 100.98 Up to 24 days
76Suzlon Energy Limited, Annual Report 2009-10
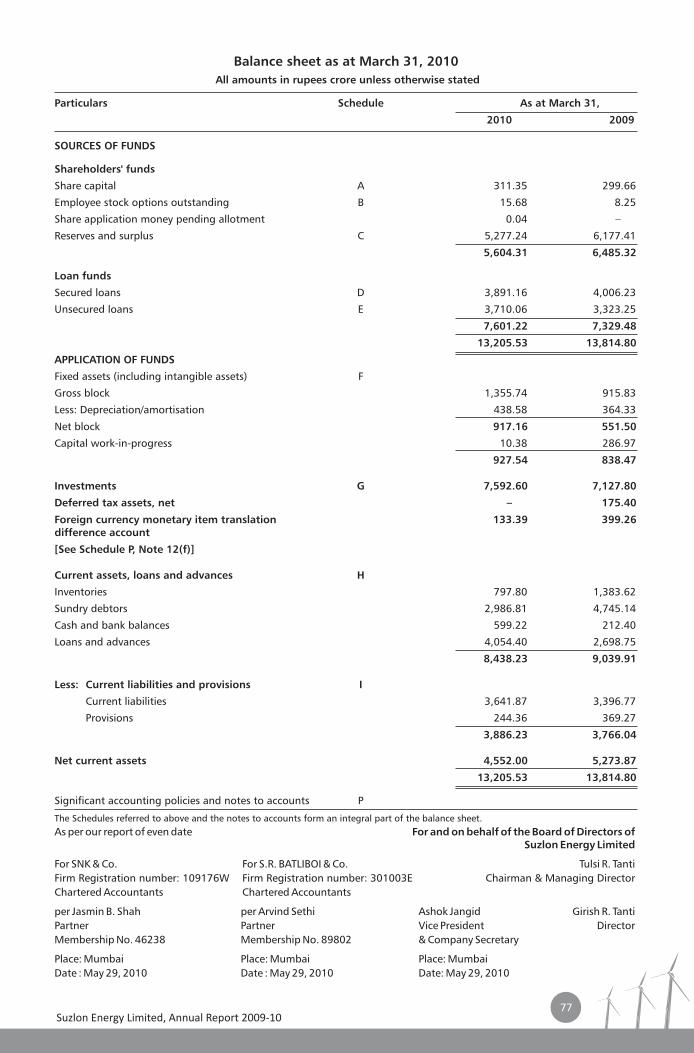
Balance sheet as at March 31, 2010
All amounts in rupees crore unless otherwise stated
Particulars Schedule As at March 31,
2010 2009
SOURCES OF FUNDS
Shareholders' funds
Share capital A 311.35 299.66
Employee stock options outstanding B 15.68 8.25
Share application money pending allotment 0.04 –
Reserves and surplus C 5,277.24 6,177.41
5,604.31 6,485.32
Loan funds
Secured loans D 3,891.16 4,006.23
Unsecured loans E 3,710.06 3,323.25
7,601.22 7,329.48
13,205.53 13,814.80
APPLICATION OF FUNDS
Fixed assets (including intangible assets) F
Gross block 1,355.74 915.83
Less: Depreciation/amortisation 438.58 364.33
Net block 917.16 551.50
Capital work-in-progress 10.38 286.97
927.54 838.47
Investments G 7,592.60 7,127.80
Deferred tax assets, net – 175.40
Foreign currency monetary item translation 133.39 399.26 difference account
[See Schedule P, Note 12(f)]
Current assets, loans and advances H
Inventories 797.80 1,383.62
Sundry debtors 2,986.81 4,745.14
Cash and bank balances 599.22 212.40
Loans and advances 4,054.40 2,698.75
8,438.23 9,039.91
Less: Current liabilities and provisions I
Current liabilities 3,641.87 3,396.77
Provisions 244.36 369.27
3,886.23 3,766.04
Net current assets 4,552.00 5,273.87
13,205.53 13,814.80
Significant accounting policies and notes to accounts P
The Schedules referred to above and the notes to accounts form an integral part of the balance sheet.As per our report of even date For and on behalf of the Board of Directors of
Suzlon Energy Limited
For SNK & Co. For S.R. BATLIBOI & Co. Tulsi R. TantiFirm Registration number: 109176W Firm Registration number: 301003E Chairman & Managing DirectorChartered Accountants Chartered Accountants
per Jasmin B. Shah per Arvind Sethi Ashok Jangid Girish R. TantiPartner Partner Vice President DirectorMembership No. 46238 Membership No. 89802 & Company Secretary
Place: Mumbai Place: Mumbai Place: MumbaiDate : May 29, 2010 Date : May 29, 2010 Date: May 29, 2010
77Suzlon Energy Limited, Annual Report 2009-10
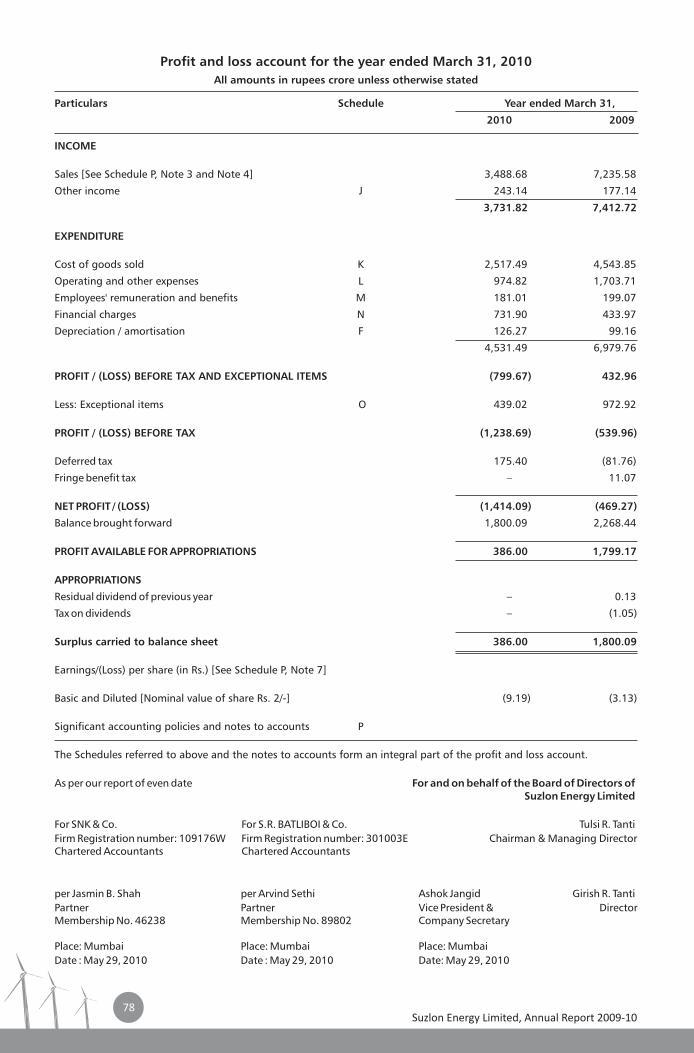
Profit and loss account for the year ended March 31, 2010
All amounts in rupees crore unless otherwise stated
Particulars Schedule Year ended March 31,
2010 2009
INCOME
Sales [See Schedule P, Note 3 and Note 4] 3,488.68 7,235.58
Other income J 243.14 177.14
3,731.82 7,412.72
EXPENDITURE
Cost of goods sold K 2,517.49 4,543.85
Operating and other expenses L 974.82 1,703.71
Employees' remuneration and benefits M 181.01 199.07
Financial charges N 731.90 433.97
Depreciation / amortisation F 126.27 99.16
4,531.49 6,979.76
PROFIT / (LOSS) BEFORE TAX AND EXCEPTIONAL ITEMS (799.67) 432.96
Less: Exceptional items O 439.02 972.92
PROFIT / (LOSS) BEFORE TAX (1,238.69) (539.96)
Deferred tax 175.40 (81.76)
Fringe benefit tax – 11.07
NET PROFIT / (LOSS) (1,414.09) (469.27)
Balance brought forward 1,800.09 2,268.44
PROFIT AVAILABLE FOR APPROPRIATIONS 386.00 1,799.17
APPROPRIATIONS
Residual dividend of previous year – 0.13
Tax on dividends – (1.05)
Surplus carried to balance sheet 386.00 1,800.09
Earnings/(Loss) per share (in Rs.) [See Schedule P, Note 7]
Basic and Diluted [Nominal value of share Rs. 2/-] (9.19) (3.13)
Significant accounting policies and notes to accounts P
The Schedules referred to above and the notes to accounts form an integral part of the profit and loss account.
As per our report of even date For and on behalf of the Board of Directors ofSuzlon Energy Limited
For SNK & Co. For S.R. BATLIBOI & Co. Tulsi R. TantiFirm Registration number: 109176W Firm Registration number: 301003E Chairman & Managing DirectorChartered Accountants Chartered Accountants
per Jasmin B. Shah per Arvind Sethi Ashok Jangid Girish R. TantiPartner Partner Vice President & DirectorMembership No. 46238 Membership No. 89802 Company Secretary
Place: Mumbai Place: Mumbai Place: MumbaiDate : May 29, 2010 Date : May 29, 2010 Date: May 29, 2010
78Suzlon Energy Limited, Annual Report 2009-10
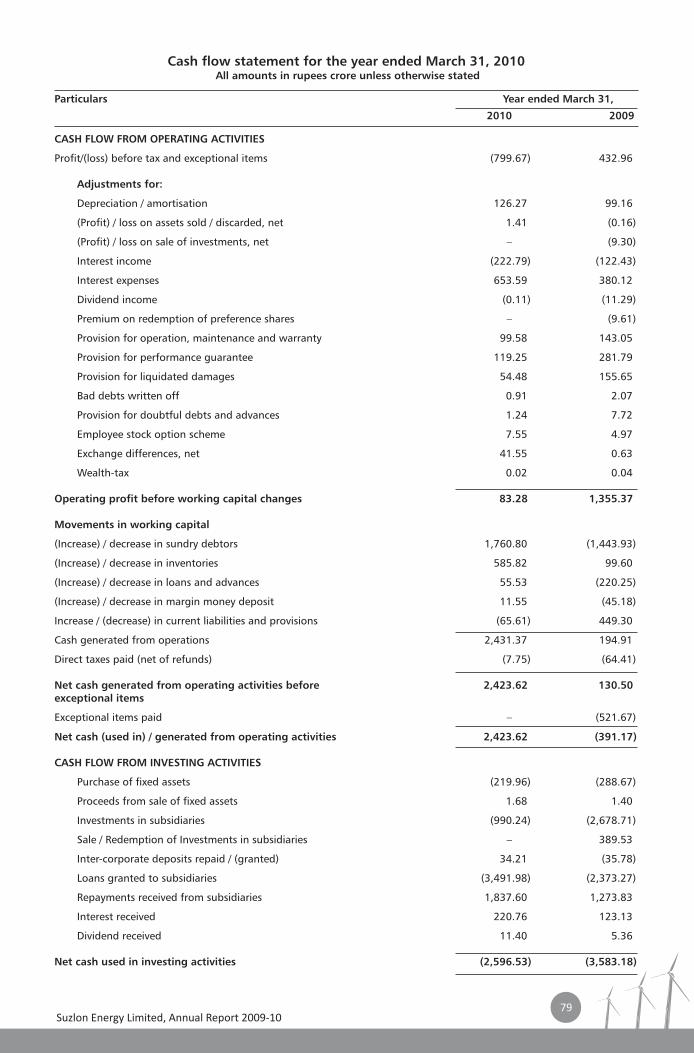
Cash flow statement for the year ended March 31, 2010 All amounts in rupees crore unless otherwise stated
Particulars Year ended March 31,
2010 2009
CASH FLOW FROM OPERATING ACTIVITIES
Profit/(loss) before tax and exceptional items (799.67) 432.96
Adjustments for:
Depreciation / amortisation 126.27 99.16
(Profit) / loss on assets sold / discarded, net 1.41 (0.16)
(Profit) / loss on sale of investments, net – (9.30)
Interest income (222.79) (122.43)
Interest expenses 653.59 380.12
Dividend income (0.11) (11.29)
Premium on redemption of preference shares – (9.61)
Provision for operation, maintenance and warranty 99.58 143.05
Provision for performance guarantee 119.25 281.79
Provision for liquidated damages 54.48 155.65
Bad debts written off 0.91 2.07
Provision for doubtful debts and advances 1.24 7.72
Employee stock option scheme 7.55 4.97
Exchange differences, net 41.55 0.63
Wealth-tax 0.02 0.04
Operating profit before working capital changes 83.28 1,355.37
Movements in working capital
(Increase) / decrease in sundry debtors 1,760.80 (1,443.93)
(Increase) / decrease in inventories 585.82 99.60
(Increase) / decrease in loans and advances 55.53 (220.25)
(Increase) / decrease in margin money deposit 11.55 (45.18)
Increase / (decrease) in current liabilities and provisions (65.61) 449.30
Cash generated from operations 2,431.37 194.91
Direct taxes paid (net of refunds) (7.75) (64.41)
Net cash generated from operating activities before 2,423.62 130.50 exceptional items
Exceptional items paid – (521.67)
Net cash (used in) / generated from operating activities 2,423.62 (391.17)
CASH FLOW FROM INVESTING ACTIVITIES
Purchase of fixed assets (219.96) (288.67)
Proceeds from sale of fixed assets 1.68 1.40
Investments in subsidiaries (990.24) (2,678.71)
Sale / Redemption of Investments in subsidiaries – 389.53
Inter-corporate deposits repaid / (granted) 34.21 (35.78)
Loans granted to subsidiaries (3,491.98) (2,373.27)
Repayments received from subsidiaries 1,837.60 1,273.83
Interest received 220.76 123.13
Dividend received 11.40 5.36
Net cash used in investing activities (2,596.53) (3,583.18)
79Suzlon Energy Limited, Annual Report 2009-10
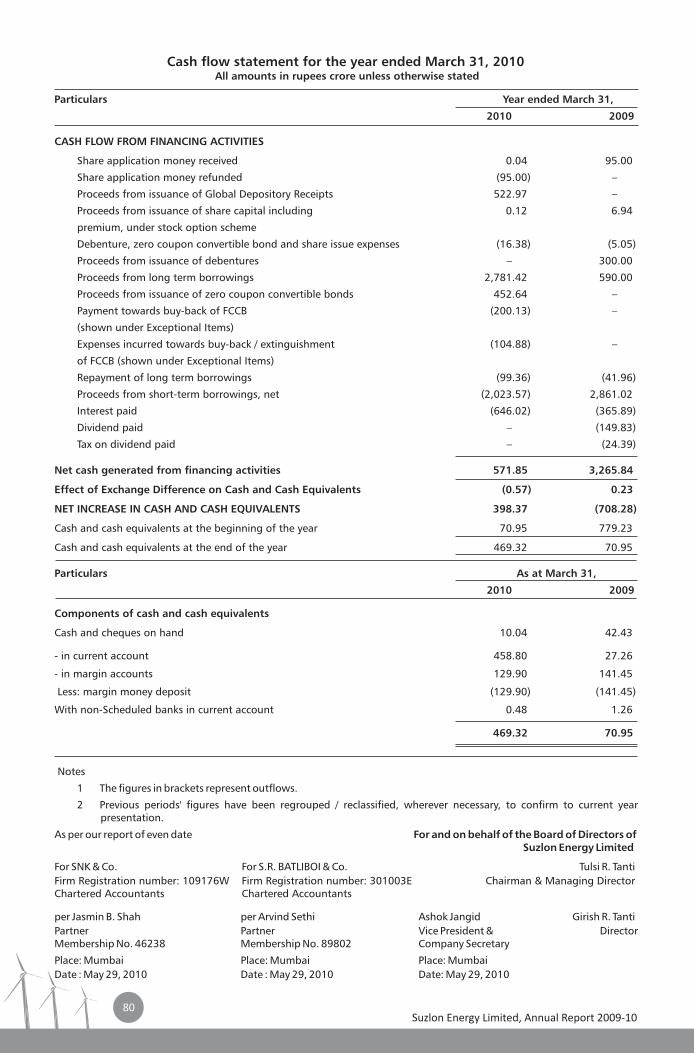
CASH FLOW FROM FINANCING ACTIVITIES
Share application money received 0.04 95.00
Share application money refunded (95.00) –
Proceeds from issuance of Global Depository Receipts 522.97 –
Proceeds from issuance of share capital including 0.12 6.94
premium, under stock option scheme
Debenture, zero coupon convertible bond and share issue expenses (16.38) (5.05)
Proceeds from issuance of debentures – 300.00
Proceeds from long term borrowings 2,781.42 590.00
Proceeds from issuance of zero coupon convertible bonds 452.64 –
Payment towards buy-back of FCCB (200.13) –
(shown under Exceptional Items)
Expenses incurred towards buy-back / extinguishment (104.88) –
of FCCB (shown under Exceptional Items)
Repayment of long term borrowings (99.36) (41.96)
Proceeds from short-term borrowings, net (2,023.57) 2,861.02
Interest paid (646.02) (365.89)
Dividend paid – (149.83)
Tax on dividend paid – (24.39)
Net cash generated from financing activities 571.85 3,265.84
Effect of Exchange Difference on Cash and Cash Equivalents (0.57) 0.23
NET INCREASE IN CASH AND CASH EQUIVALENTS 398.37 (708.28)
Cash and cash equivalents at the beginning of the year 70.95 779.23
Cash and cash equivalents at the end of the year 469.32 70.95
Particulars As at March 31,
2010 2009
Components of cash and cash equivalents
Cash and cheques on hand 10.04 42.43
- in current account 458.80 27.26
- in margin accounts 129.90 141.45
Less: margin money deposit (129.90) (141.45)
With non-Scheduled banks in current account 0.48 1.26
469.32 70.95
Notes
1 The figures in brackets represent outflows.
2 Previous periods' figures have been regrouped / reclassified, wherever necessary, to confirm to current year presentation.
As per our report of even date For and on behalf of the Board of Directors ofSuzlon Energy Limited
For SNK & Co. For S.R. BATLIBOI & Co. Tulsi R. TantiFirm Registration number: 109176W Firm Registration number: 301003E Chairman & Managing DirectorChartered Accountants Chartered Accountants
per Jasmin B. Shah per Arvind Sethi Ashok Jangid Girish R. TantiPartner Partner Vice President & DirectorMembership No. 46238 Membership No. 89802 Company Secretary
Place: Mumbai Place: Mumbai Place: MumbaiDate : May 29, 2010 Date : May 29, 2010 Date: May 29, 2010
Cash flow statement for the year ended March 31, 2010 All amounts in rupees crore unless otherwise stated
Particulars Year ended March 31,
2010 2009
80Suzlon Energy Limited, Annual Report 2009-10
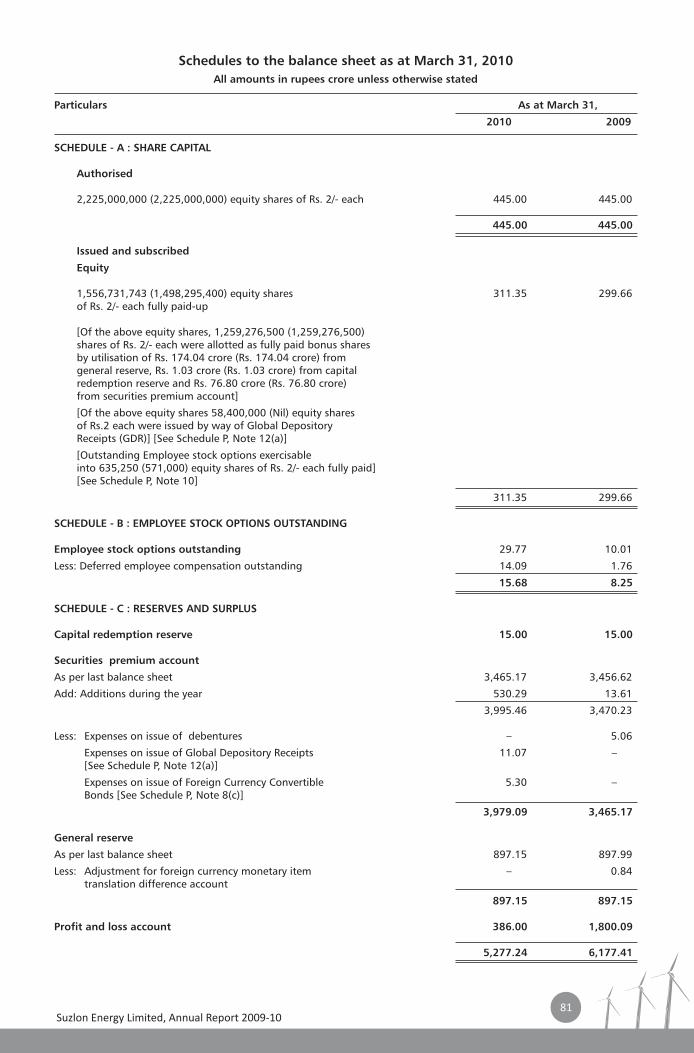
Schedules to the balance sheet as at March 31, 2010
All amounts in rupees crore unless otherwise stated
Particulars As at March 31,
2010 2009
SCHEDULE - A : SHARE CAPITAL
Authorised
2,225,000,000 (2,225,000,000) equity shares of Rs. 2/- each 445.00 445.00
445.00 445.00
Issued and subscribed
Equity
1,556,731,743 (1,498,295,400) equity shares 311.35 299.66 of Rs. 2/- each fully paid-up
[Of the above equity shares, 1,259,276,500 (1,259,276,500) shares of Rs. 2/- each were allotted as fully paid bonus shares by utilisation of Rs. 174.04 crore (Rs. 174.04 crore) from general reserve, Rs. 1.03 crore (Rs. 1.03 crore) from capital redemption reserve and Rs. 76.80 crore (Rs. 76.80 crore) from securities premium account]
[Of the above equity shares 58,400,000 (Nil) equity shares of Rs.2 each were issued by way of Global Depository Receipts (GDR)] [See Schedule P, Note 12(a)]
[Outstanding Employee stock options exercisable into 635,250 (571,000) equity shares of Rs. 2/- each fully paid] [See Schedule P, Note 10]
311.35 299.66
SCHEDULE - B : EMPLOYEE STOCK OPTIONS OUTSTANDING
Employee stock options outstanding 29.77 10.01
Less: Deferred employee compensation outstanding 14.09 1.76
15.68 8.25
SCHEDULE - C : RESERVES AND SURPLUS
Capital redemption reserve 15.00 15.00
Securities premium account
As per last balance sheet 3,465.17 3,456.62
Add: Additions during the year 530.29 13.61
3,995.46 3,470.23
Less: Expenses on issue of debentures – 5.06
Expenses on issue of Global Depository Receipts 11.07 –[See Schedule P, Note 12(a)]
Expenses on issue of Foreign Currency Convertible 5.30 – Bonds [See Schedule P, Note 8(c)]
3,979.09 3,465.17
General reserve
As per last balance sheet 897.15 897.99
Less: Adjustment for foreign currency monetary item – 0.84 translation difference account
897.15 897.15
Profit and loss account 386.00 1,800.09
5,277.24 6,177.41
81Suzlon Energy Limited, Annual Report 2009-10
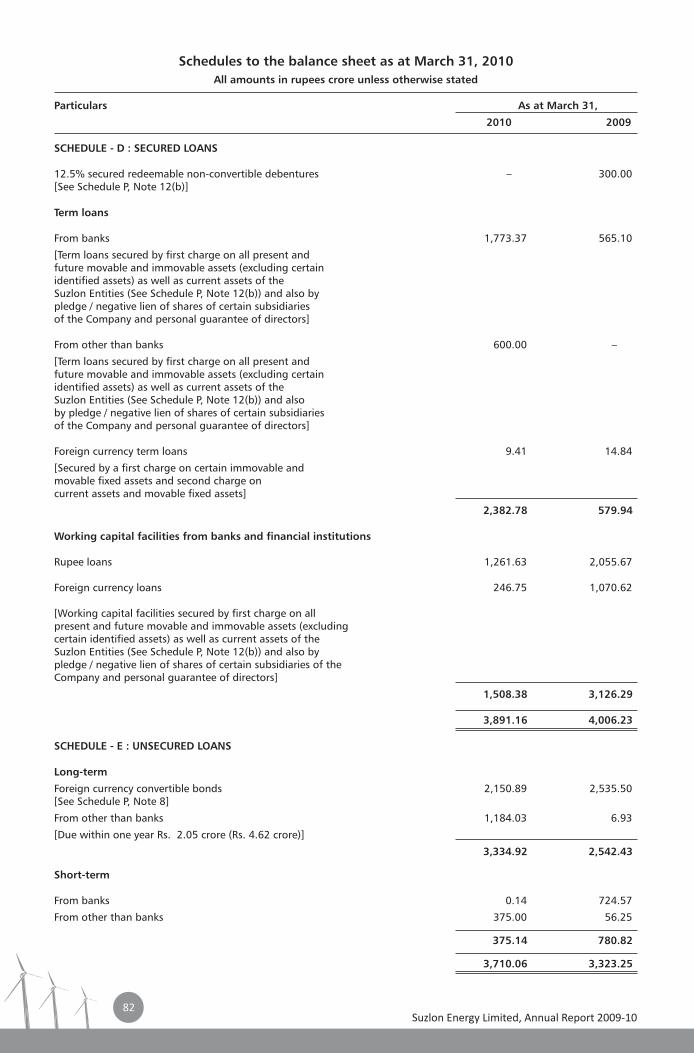
Schedules to the balance sheet as at March 31, 2010
All amounts in rupees crore unless otherwise stated
Particulars As at March 31,
2010 2009
SCHEDULE - D : SECURED LOANS
12.5% secured redeemable non-convertible debentures [See Schedule P, Note 12(b)]
Term loans
From banks 1,773.37 565.10
[Term loans secured by first charge on all present and future movable and immovable assets (excluding certain identified assets) as well as current assets of the Suzlon Entities (See Schedule P, Note 12(b)) and also by pledge / negative lien of shares of certain subsidiaries of the Company and personal guarantee of directors]
From other than banks 600.00 –
[Term loans secured by first charge on all present and future movable and immovable assets (excluding certain identified assets) as well as current assets of the Suzlon Entities (See Schedule P, Note 12(b)) and also by pledge / negative lien of shares of certain subsidiaries of the Company and personal guarantee of directors]
Foreign currency term loans 9.41 14.84
[Secured by a first charge on certain immovable and movable fixed assets and second charge on current assets and movable fixed assets]
2,382.78 579.94
Working capital facilities from banks and financial institutions
Rupee loans 1,261.63 2,055.67
Foreign currency loans 246.75 1,070.62
[Working capital facilities secured by first charge on all present and future movable and immovable assets (excluding certain identified assets) as well as current assets of the Suzlon Entities (See Schedule P, Note 12(b)) and also by pledge / negative lien of shares of certain subsidiaries of the Company and personal guarantee of directors]
1,508.38 3,126.29
3,891.16 4,006.23
SCHEDULE - E : UNSECURED LOANS
Long-term
Foreign currency convertible bonds 2,150.89 2,535.50 [See Schedule P, Note 8]
From other than banks 1,184.03 6.93
[Due within one year Rs. 2.05 crore (Rs. 4.62 crore)]
3,334.92 2,542.43
Short-term
From banks 0.14 724.57
From other than banks 375.00 56.25
375.14 780.82
3,710.06 3,323.25
– 300.00
82Suzlon Energy Limited, Annual Report 2009-10
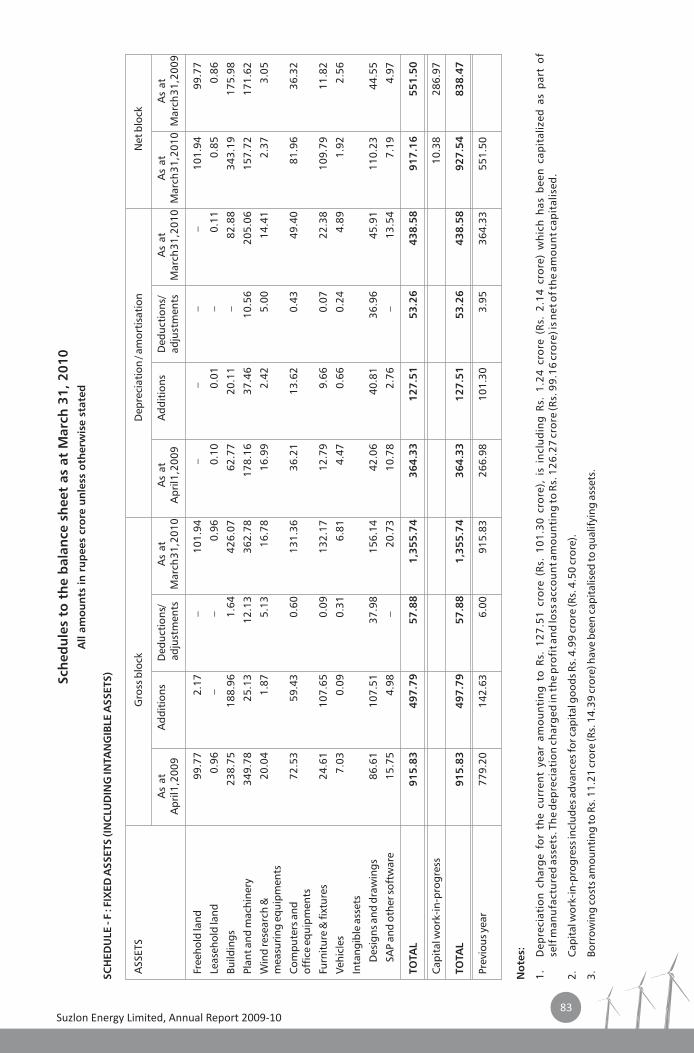
Sch
ed
ule
s to
th
e b
ala
nce
sh
eet
as
at
Marc
h 3
1, 2
01
0
All a
mo
un
ts in
ru
pees
cro
re u
nle
ss o
therw
ise s
tate
d
SC
HED
ULE - F
: FIX
ED
ASSETS (IN
CLU
DIN
G IN
TAN
GIB
LE A
SSETS)
ASS
ETS
Gro
ss b
lock
D
epre
ciat
ion
/ am
orti
sati
on
Net
blo
ck
As
atA
ddit
ions
Ded
ucti
ons/
As
at
As
at
Add
itio
ns
Ded
ucti
ons /
As
at
As
at
As
at
Apr
il 1, 2
009
a
djus
tmen
tsM
arch
31,
201
0 A
pril 1
, 200
9
adju
stm
ents
Mar
ch 3
1, 2
010
Mar
ch 3
1, 2
010
Mar
ch 3
1, 2
009
Free
hold
land
99.
77
2.1
7 –
1
01.9
4 –
–
–
–
1
01.9
4 9
9.77
Leas
ehol
d la
nd 0
.96
–
–
0.9
6 0
.10
0.0
1 –
0
.11
0.8
5 0
.86
Build
ings
238
.75
188
.96
1.6
4 4
26.0
7 6
2.77
2
0.11
–
8
2.88
3
43.1
9 1
75.9
8
Plan
t and
mac
hine
ry 3
49.7
8 2
5.13
1
2.13
3
62.7
8 1
78.1
6 3
7.46
1
0.56
2
05.0
6 1
57.7
2 1
71.6
2
Win
d re
sear
ch &
20
.04
1.8
7 5
.13
16.
78
16.
99
2.4
2 5
.00
14.
41
2.3
7 3
.05
mea
suri
ng e
quip
men
ts
Com
pute
rs a
nd
72.
53
59.
43
0.6
0 1
31.3
6 3
6.21
1
3.62
0
.43
49.
40
81.
96
36.
32
offi
ce e
quip
men
ts
Furn
itur
e &
fixt
ures
24.
61
107
.65
0.0
9 1
32.1
7 1
2.79
9
.66
0.0
7 2
2.38
1
09.7
9 1
1.82
Vehi
cles
7.0
3 0
.09
0.3
1 6
.81
4.4
7 0
.66
0.2
4 4
.89
1.9
2 2
.56
Inta
ngib
le a
sset
s
Des
igns
and
dra
win
gs 8
6.61
1
07.5
1 3
7.98
1
56.1
4 4
2.06
4
0.81
3
6.96
4
5.91
1
10.2
3 4
4.55
SAP
and
othe
r sof
twar
e 1
5.75
4
.98
–
20.
73
10.
78
2.7
6 –
1
3.54
7
.19
4.9
7
TO
TAL
91
5.8
3
49
7.7
9
57
.88
1
,35
5.7
4
36
4.3
3
12
7.5
1
53
.26
4
38
.58
9
17
.16
5
51
.50
Cap
ital
wor
k-in
-pro
gres
s 1
0.38
2
86.9
7
TO
TAL
91
5.8
3
49
7.7
9
57
.88
1
,35
5.7
4
36
4.3
3
12
7.5
1
53
.26
4
38
.58
9
27
.54
8
38
.47
Prev
ious
yea
r 7
79.2
0 1
42.6
3 6
.00
915
.83
266
.98
101
.30
3.9
5 3
64.3
3 5
51.5
0
No
tes:
1.D
epre
ciat
ion
char
ge
for
the
curr
ent
year
am
ou
nti
ng
to R
s. 1
27.5
1 cr
ore
(Rs
. 10
1.30
cro
re),
is
incl
ud
ing
Rs.
1.24
cro
re (
Rs.
2.14
cro
re)
wh
ich
has
bee
n ca
pit
aliz
ed a
s p
art
of
self
man
ufa
ctu
red
asse
ts. T
he
dep
reci
atio
n ch
arg
ed in
the
pro
fit a
nd
loss
acc
ou
nt a
mo
un
tin
g to
Rs.
126
.27
cro
re (R
s. 9
9.16
cro
re) i
s net
of t
he
amo
un
t cap
ital
ised
.
2.C
apit
al w
ork-
in-p
rogr
ess i
nclu
des a
dvan
ces f
or c
apit
al g
oods
Rs.
4.9
9 cr
ore
(Rs.
4.5
0 cr
ore)
.
3.Bo
rrow
ing
cost
s am
ount
ing
to R
s. 1
1.21
cro
re (R
s. 1
4.39
cro
re) h
ave
been
cap
ital
ised
to q
ualif
ying
ass
ets.
83Suzlon Energy Limited, Annual Report 2009-10
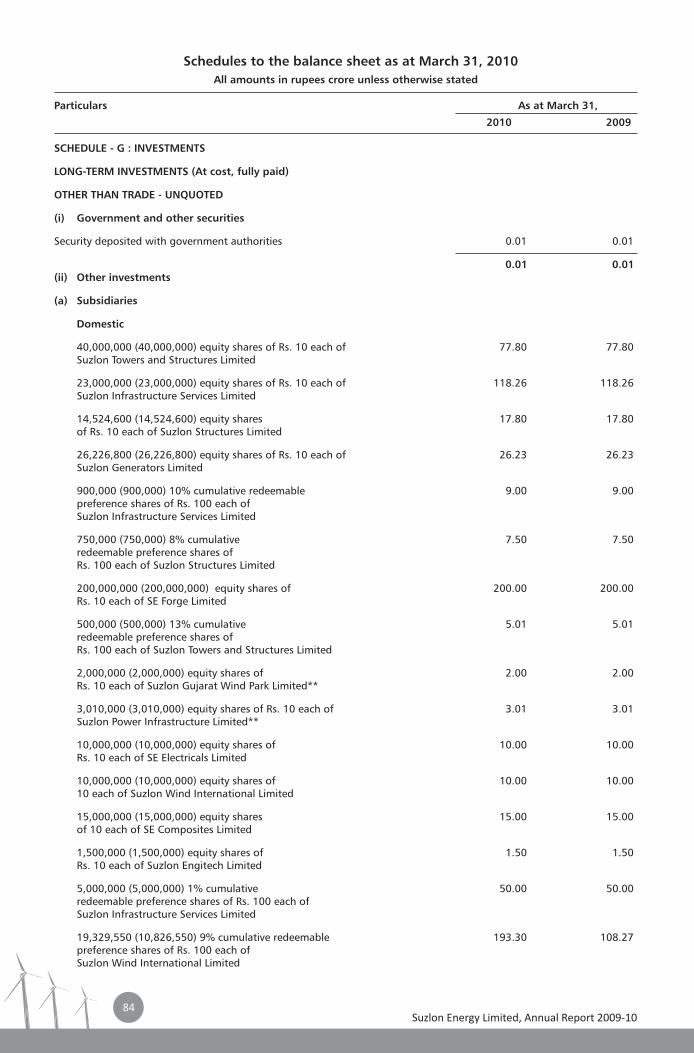
All amounts in rupees crore unless otherwise stated
Particulars As at March 31,
2010 2009
SCHEDULE - G : INVESTMENTS
LONG-TERM INVESTMENTS (At cost, fully paid)
OTHER THAN TRADE - UNQUOTED
(i) Government and other securities
Security deposited with government authorities 0.01 0.01
0.01 0.01 (ii) Other investments
(a) Subsidiaries
Domestic
40,000,000 (40,000,000) equity shares of Rs. 10 each of 77.80 77.80Suzlon Towers and Structures Limited
23,000,000 (23,000,000) equity shares of Rs. 10 each of 118.26 118.26 Suzlon Infrastructure Services Limited
14,524,600 (14,524,600) equity shares 17.80 17.80 of Rs. 10 each of Suzlon Structures Limited
26,226,800 (26,226,800) equity shares of Rs. 10 each of 26.23 26.23 Suzlon Generators Limited
900,000 (900,000) 10% cumulative redeemable 9.00 9.00 preference shares of Rs. 100 each of Suzlon Infrastructure Services Limited
750,000 (750,000) 8% cumulative 7.50 7.50 redeemable preference shares of Rs. 100 each of Suzlon Structures Limited
200,000,000 (200,000,000) equity shares of 200.00 200.00 Rs. 10 each of SE Forge Limited
500,000 (500,000) 13% cumulative 5.01 5.01 redeemable preference shares of Rs. 100 each of Suzlon Towers and Structures Limited
2,000,000 (2,000,000) equity shares of 2.00 2.00 Rs. 10 each of Suzlon Gujarat Wind Park Limited**
3,010,000 (3,010,000) equity shares of Rs. 10 each of 3.01 3.01 Suzlon Power Infrastructure Limited**
10,000,000 (10,000,000) equity shares of 10.00 10.00 Rs. 10 each of SE Electricals Limited
10,000,000 (10,000,000) equity shares of 10.00 10.00 10 each of Suzlon Wind International Limited
15,000,000 (15,000,000) equity shares 15.00 15.00 of 10 each of SE Composites Limited
1,500,000 (1,500,000) equity shares of 1.50 1.50 Rs. 10 each of Suzlon Engitech Limited
5,000,000 (5,000,000) 1% cumulative 50.00 50.00redeemable preference shares of Rs. 100 each of Suzlon Infrastructure Services Limited
19,329,550 (10,826,550) 9% cumulative redeemable 193.30 108.27 preference shares of Rs. 100 each ofSuzlon Wind International Limited
Schedules to the balance sheet as at March 31, 2010
84Suzlon Energy Limited, Annual Report 2009-10
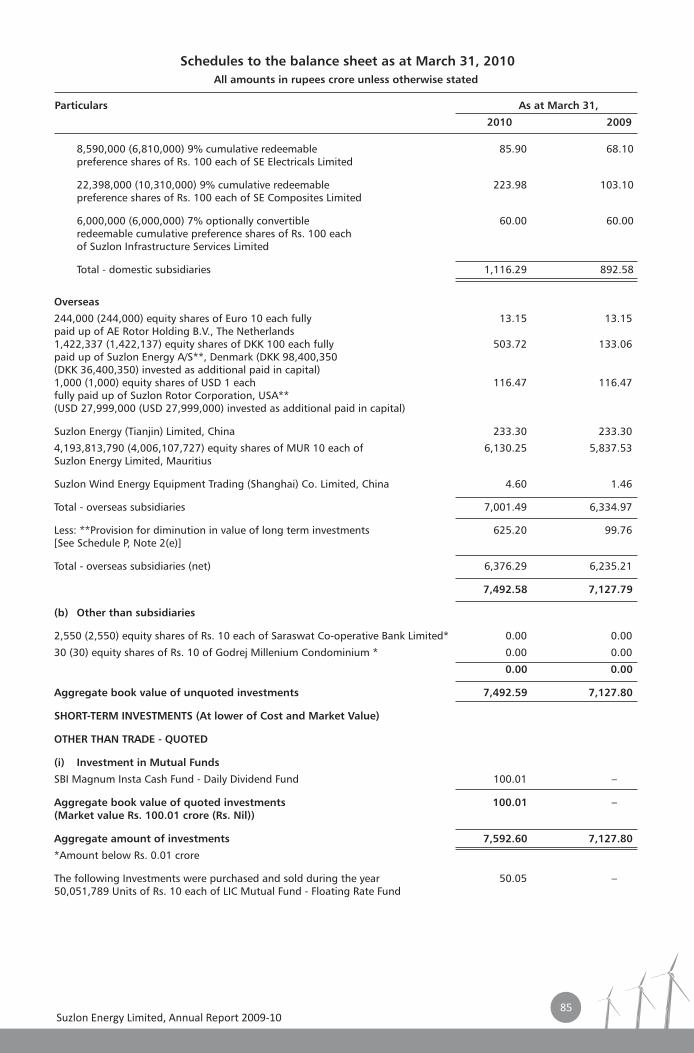
8,590,000 (6,810,000) 9% cumulative redeemable preference shares of Rs. 100 each of SE Electricals Limited
22,398,000 (10,310,000) 9% cumulative redeemable 223.98 103.10 preference shares of Rs. 100 each of SE Composites Limited
6,000,000 (6,000,000) 7% optionally convertible 60.00 60.00 redeemable cumulative preference shares of Rs. 100 each of Suzlon Infrastructure Services Limited
Total - domestic subsidiaries 1,116.29 892.58
Overseas
244,000 (244,000) equity shares of Euro 10 each fully 13.15 13.15 paid up of AE Rotor Holding B.V., The Netherlands1,422,337 (1,422,137) equity shares of DKK 100 each fully 503.72 133.06 paid up of Suzlon Energy A/S**, Denmark (DKK 98,400,350 (DKK 36,400,350) invested as additional paid in capital) 1,000 (1,000) equity shares of USD 1 each 116.47 116.47fully paid up of Suzlon Rotor Corporation, USA**(USD 27,999,000 (USD 27,999,000) invested as additional paid in capital)
Suzlon Energy (Tianjin) Limited, China 233.30 233.30
4,193,813,790 (4,006,107,727) equity shares of MUR 10 each of 6,130.25 5,837.53 Suzlon Energy Limited, Mauritius
Suzlon Wind Energy Equipment Trading (Shanghai) Co. Limited, China 4.60 1.46
Total - overseas subsidiaries 7,001.49 6,334.97
Less: **Provision for diminution in value of long term investments 625.20 99.76 [See Schedule P, Note 2(e)]
Total - overseas subsidiaries (net) 6,376.29 6,235.21
7,492.58 7,127.79
(b) Other than subsidiaries
2,550 (2,550) equity shares of Rs. 10 each of Saraswat Co-operative Bank Limited* 0.00 0.00
30 (30) equity shares of Rs. 10 of Godrej Millenium Condominium * 0.00 0.00
0.00 0.00
Aggregate book value of unquoted investments 7,492.59 7,127.80
SHORT-TERM INVESTMENTS (At lower of Cost and Market Value)
OTHER THAN TRADE - QUOTED
(i) Investment in Mutual Funds
SBI Magnum Insta Cash Fund - Daily Dividend Fund 100.01 –
Aggregate book value of quoted investments 100.01 – (Market value Rs. 100.01 crore (Rs. Nil))
Aggregate amount of investments 7,592.60 7,127.80
*Amount below Rs. 0.01 crore
The following Investments were purchased and sold during the year 50.05 – 50,051,789 Units of Rs. 10 each of LIC Mutual Fund - Floating Rate Fund
85.90 68.10
Schedules to the balance sheet as at March 31, 2010
All amounts in rupees crore unless otherwise stated
Particulars As at March 31,
2010 2009
85Suzlon Energy Limited, Annual Report 2009-10
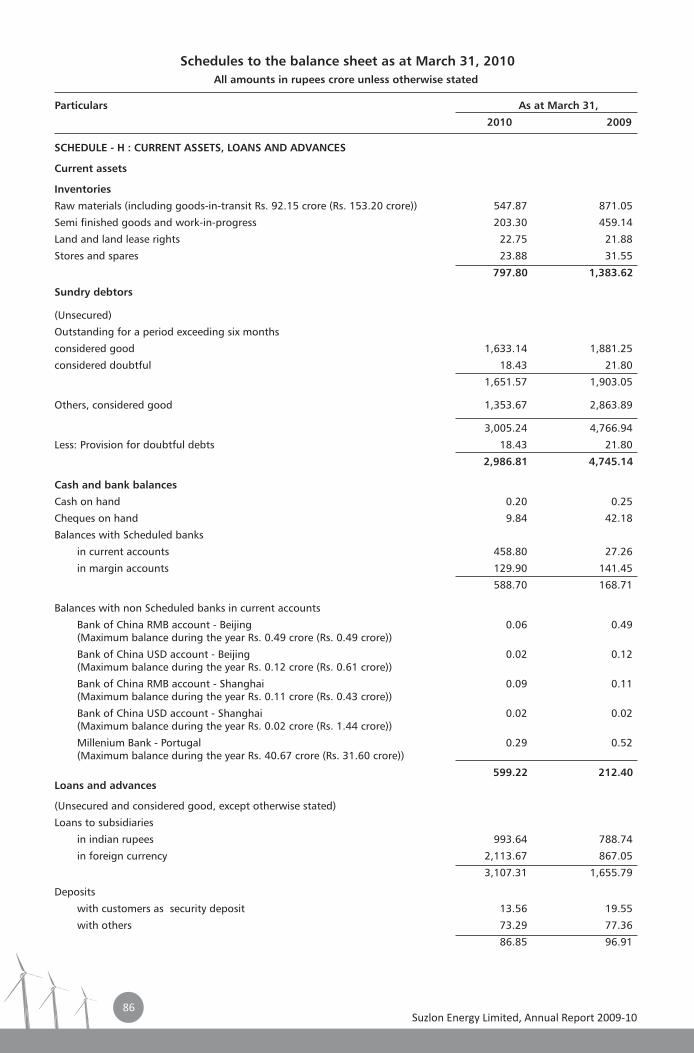
SCHEDULE - H : CURRENT ASSETS, LOANS AND ADVANCES
Current assets
Inventories
Raw materials (including goods-in-transit Rs. 92.15 crore (Rs. 153.20 crore)) 547.87 871.05
Semi finished goods and work-in-progress 203.30 459.14
Land and land lease rights 22.75 21.88
Stores and spares 23.88 31.55
797.80 1,383.62
Sundry debtors
(Unsecured)
Outstanding for a period exceeding six months
considered good 1,633.14 1,881.25
considered doubtful 18.43 21.80
1,651.57 1,903.05
Others, considered good 1,353.67 2,863.89
3,005.24 4,766.94
Less: Provision for doubtful debts 18.43 21.80
2,986.81 4,745.14
Cash and bank balances
Cash on hand 0.20 0.25
Cheques on hand 9.84 42.18
Balances with Scheduled banks
in current accounts 458.80 27.26
in margin accounts 129.90 141.45
588.70 168.71
Balances with non Scheduled banks in current accounts
Bank of China RMB account - Beijing 0.06 0.49 (Maximum balance during the year Rs. 0.49 crore (Rs. 0.49 crore))
Bank of China USD account - Beijing 0.02 0.12 (Maximum balance during the year Rs. 0.12 crore (Rs. 0.61 crore))
Bank of China RMB account - Shanghai 0.09 0.11 (Maximum balance during the year Rs. 0.11 crore (Rs. 0.43 crore))
Bank of China USD account - Shanghai 0.02 0.02 (Maximum balance during the year Rs. 0.02 crore (Rs. 1.44 crore))
Millenium Bank - Portugal 0.29 0.52 (Maximum balance during the year Rs. 40.67 crore (Rs. 31.60 crore))
599.22 212.40 Loans and advances
(Unsecured and considered good, except otherwise stated)
Loans to subsidiaries
in indian rupees 993.64 788.74
in foreign currency 2,113.67 867.05
3,107.31 1,655.79
Deposits
with customers as security deposit 13.56 19.55
with others 73.29 77.36
86.85 96.91
Schedules to the balance sheet as at March 31, 2010
All amounts in rupees crore unless otherwise stated
Particulars As at March 31,
2010 2009
86Suzlon Energy Limited, Annual Report 2009-10
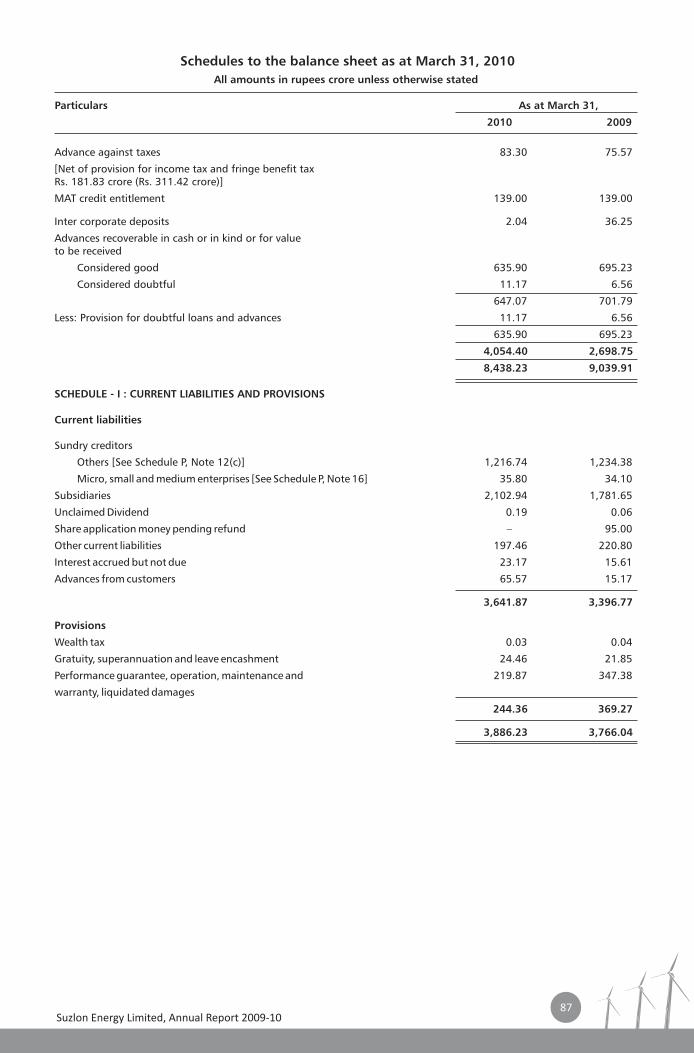
Advance against taxes 83.30 75.57
[Net of provision for income tax and fringe benefit tax Rs. 181.83 crore (Rs. 311.42 crore)]
MAT credit entitlement 139.00 139.00
Inter corporate deposits 2.04 36.25
Advances recoverable in cash or in kind or for value to be received
Considered good 635.90 695.23
Considered doubtful 11.17 6.56
647.07 701.79
Less: Provision for doubtful loans and advances 11.17 6.56
635.90 695.23
4,054.40 2,698.75
8,438.23 9,039.91
SCHEDULE - I : CURRENT LIABILITIES AND PROVISIONS
Current liabilities
Sundry creditors
Others [See Schedule P, Note 12(c)] 1,216.74 1,234.38
Micro, small and medium enterprises [See Schedule P, Note 16] 35.80 34.10
Subsidiaries 2,102.94 1,781.65
Unclaimed Dividend 0.19 0.06
Share application money pending refund – 95.00
Other current liabilities 197.46 220.80
Interest accrued but not due 23.17 15.61
Advances from customers 65.57 15.17
3,641.87 3,396.77
Provisions
Wealth tax 0.03 0.04
Gratuity, superannuation and leave encashment 24.46 21.85
Performance guarantee, operation, maintenance and 219.87 347.38
warranty, liquidated damages
244.36 369.27
3,886.23 3,766.04
Schedules to the balance sheet as at March 31, 2010
All amounts in rupees crore unless otherwise stated
Particulars As at March 31,
2010 2009
87Suzlon Energy Limited, Annual Report 2009-10
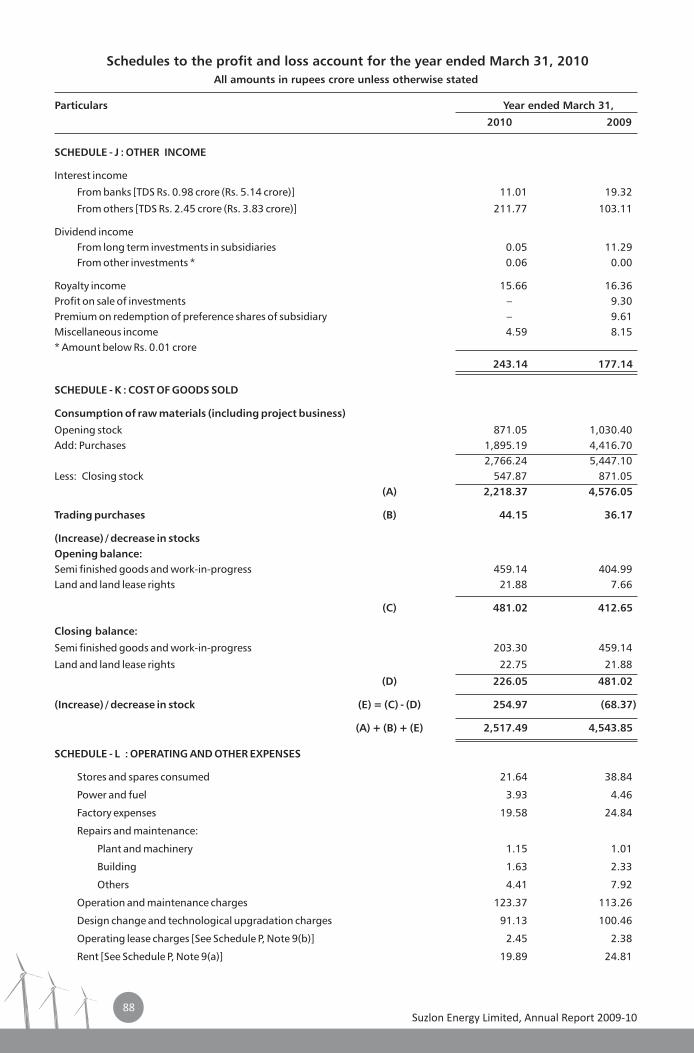
SCHEDULE - J : OTHER INCOME
Interest income
From banks [TDS Rs. 0.98 crore (Rs. 5.14 crore)] 11.01 19.32
From others [TDS Rs. 2.45 crore (Rs. 3.83 crore)] 211.77 103.11
Dividend incomeFrom long term investments in subsidiaries 0.05 11.29 From other investments * 0.06 0.00
Royalty income 15.66 16.36 Profit on sale of investments – 9.30 Premium on redemption of preference shares of subsidiary – 9.61Miscellaneous income 4.59 8.15 * Amount below Rs. 0.01 crore
243.14 177.14
SCHEDULE - K : COST OF GOODS SOLD
Consumption of raw materials (including project business)
Opening stock 871.05 1,030.40 Add: Purchases 1,895.19 4,416.70
2,766.24 5,447.10 Less: Closing stock 547.87 871.05
(A) 2,218.37 4,576.05
Trading purchases (B) 44.15 36.17
(Increase) / decrease in stocks
Opening balance:
Semi finished goods and work-in-progress 459.14 404.99 Land and land lease rights 21.88 7.66
(C) 481.02 412.65
Closing balance:
Semi finished goods and work-in-progress 203.30 459.14
Land and land lease rights 22.75 21.88
(D) 226.05 481.02
(Increase) / decrease in stock (E) = (C) - (D) 254.97 (68.37)
(A) + (B) + (E) 2,517.49 4,543.85
SCHEDULE - L : OPERATING AND OTHER EXPENSES
Stores and spares consumed 21.64 38.84
Power and fuel 3.93 4.46
Factory expenses 19.58 24.84
Repairs and maintenance:
Plant and machinery 1.15 1.01
Building 1.63 2.33
Others 4.41 7.92
Operation and maintenance charges 123.37 113.26
Design change and technological upgradation charges 91.13 100.46
Operating lease charges [See Schedule P, Note 9(b)] 2.45 2.38
Rent [See Schedule P, Note 9(a)] 19.89 24.81
Schedules to the profit and loss account for the year ended March 31, 2010
All amounts in rupees crore unless otherwise stated
Particulars Year ended March 31,
2010 2009
88Suzlon Energy Limited, Annual Report 2009-10
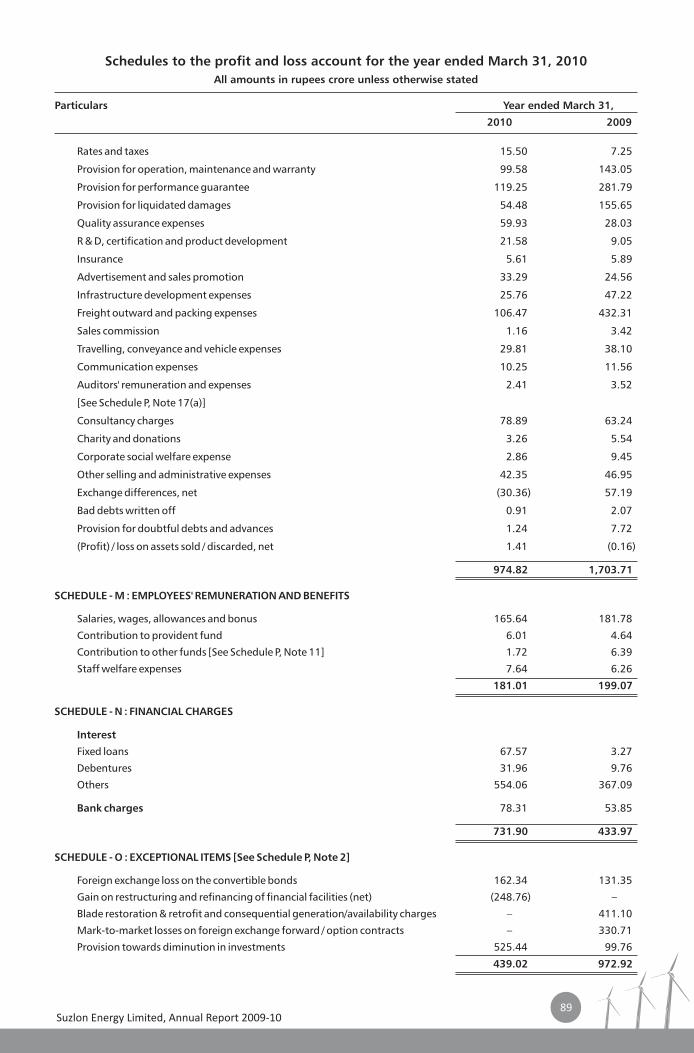
Rates and taxes 15.50 7.25
Provision for operation, maintenance and warranty 99.58 143.05
Provision for performance guarantee 119.25 281.79
Provision for liquidated damages 54.48 155.65
Quality assurance expenses 59.93 28.03
R & D, certification and product development 21.58 9.05
Insurance 5.61 5.89
Advertisement and sales promotion 33.29 24.56
Infrastructure development expenses 25.76 47.22
Freight outward and packing expenses 106.47 432.31
Sales commission 1.16 3.42
Travelling, conveyance and vehicle expenses 29.81 38.10
Communication expenses 10.25 11.56
Auditors' remuneration and expenses 2.41 3.52
[See Schedule P, Note 17(a)]
Consultancy charges 78.89 63.24
Charity and donations 3.26 5.54
Corporate social welfare expense 2.86 9.45
Other selling and administrative expenses 42.35 46.95
Exchange differences, net (30.36) 57.19
Bad debts written off 0.91 2.07
Provision for doubtful debts and advances 1.24 7.72
(Profit) / loss on assets sold / discarded, net 1.41 (0.16)
974.82 1,703.71
SCHEDULE - M : EMPLOYEES' REMUNERATION AND BENEFITS
Salaries, wages, allowances and bonus 165.64 181.78
Contribution to provident fund 6.01 4.64
Contribution to other funds [See Schedule P, Note 11] 1.72 6.39
Staff welfare expenses 7.64 6.26
181.01 199.07
SCHEDULE - N : FINANCIAL CHARGES
Interest
Fixed loans 67.57 3.27
Debentures 31.96 9.76
Others 554.06 367.09
Bank charges 78.31 53.85
731.90 433.97
SCHEDULE - O : EXCEPTIONAL ITEMS [See Schedule P, Note 2]
Foreign exchange loss on the convertible bonds 162.34 131.35
Gain on restructuring and refinancing of financial facilities (net) (248.76) –
Blade restoration & retrofit and consequential generation/availability charges – 411.10
Mark-to-market losses on foreign exchange forward / option contracts – 330.71
Provision towards diminution in investments 525.44 99.76
439.02 972.92
Schedules to the profit and loss account for the year ended March 31, 2010
All amounts in rupees crore unless otherwise stated
Particulars Year ended March 31,
2010 2009
89Suzlon Energy Limited, Annual Report 2009-10
SCHEDULE - P: SIGNIFICANT ACCOUNTING POLICIES AND NOTES TO ACCOUNTS
(All amounts in rupees crore unless otherwise stated)
Nature of operations
Suzlon Energy Limited ('SEL' or 'Suzlon' or the 'Company') is engaged in the manufacture of wind turbine generators ('WTGs') of various capacities and its components.
1. Significant accounting policies
a) Basis of accounting
The financial statements are prepared under the historical cost convention, on accrual basis of accounting to comply in all material respects, with the mandatory accounting standards as notified by the Companies (Accounting Standards) Rules, 2006, as amended ('the Rules') and the relevant provisions of the Companies Act, 1956 ('the Act'). The accounting policies have been consistently applied by the Company; and the accounting policies not referred to otherwise, are in conformity with Indian Generally Accepted Accounting Principles ('Indian GAAP').
b) Use of estimates
The preparation of financial statements in conformity with Indian GAAP requires management to make estimates and assumptions that may affect the reported amounts of assets and liabilities and disclosures relating to contingent liabilities as at the date of the financial statements and the reported amounts of incomes and expenses during the reporting period. Although these estimates are based upon management's best knowledge of current events and actions, actual results could differ from these estimates.
c) Revenue recognition
Revenue comprises sale of WTGs and wind power systems; interest; dividend and royalty. Revenue is recognised to the extent it is probable that the economic benefits will flow to the Company and that the revenue can be reliably measured. Revenue is disclosed, net of discounts, excise duty, sales tax, service tax, VAT or other taxes, as applicable.
Sales
Sale of individual WTGs and wind power systems ("supply only projects") are recognised in the profit and loss account provided that the significant risks and rewards in respect of ownership of goods has been transferred to the buyer as per the terms of the respective sales order, and provided that the income can be measured reliably and is expected to be received.
Fixed price contracts to deliver wind power systems (turnkey contracts and projects involving installation and/or commissioning apart from supply) are recognised in revenue based on the stage of completion of the individual contract using the percentage of completion method, provided the order outcome as well as expected total costs can be reliably estimated. Where the profit from a contract cannot be estimated reliably, revenue is only recognised equalling the expenses incurred to the extent that it is probable that the expenses will be recovered.
Due from customers, if any are measured the selling price of the work performed, based on the stage of completion less the cost of the work already billed to the customer and expected losses. The stage of completion is measured by the proportion that the contract expenses incurred to date bear to the estimated total contract expenses. The value of self-constructed components is recognised in 'Contracts in progress' upon dispatch of the complete set of components which are specifically identified for a customer and are within the scope of supply, as per the terms of the respective sale order for the wind power systems. Where it is probable that total contract expenses will exceed total revenues from a contract, the expected loss is recognised immediately as an expense in the profit and loss account.
Where the selling price of a contract cannot be estimated reliably, the selling price is measured only on the expenses incurred to the extent that it is probable that these expenses will be recovered. Prepayments from customers are recognised as liabilities. A contract in progress for which the selling price of the work performed exceeds interim billings and expected losses is recognised as an asset. Contracts in progress for which interim billings and expected losses exceed the selling price is recognised as a liability. Expenses relating to sales work and the winning of contracts are recognised in the profit and loss account as incurred.
Interest income
Interest income is recognised on a time proportion basis taking into account the amount outstanding and the rate applicable. In case of interest charged to customers, interest is accounted for on availability of documentary evidence that the customer has accepted the liability.
Dividend income
Dividend income from investments is recognised when the right to receive payment is established. Dividend from subsidiary companies declared after the year end till the adoption of accounts by Board of Directors, is accounted during the year as required by Schedule VI to the Act.
Royalty income
Royalty income is recognised on accrual basis in accordance with the terms of the relevant agreements.
90Suzlon Energy Limited, Annual Report 2009-10
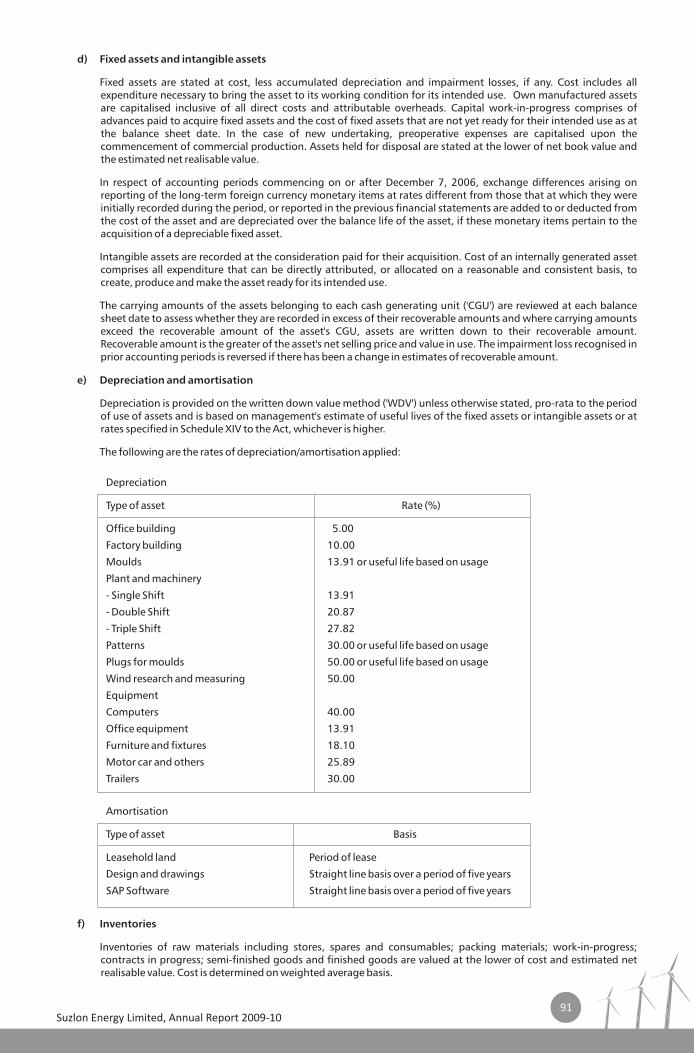
f) Inventories
Inventories of raw materials including stores, spares and consumables; packing materials; work-in-progress; contracts in progress; semi-finished goods and finished goods are valued at the lower of cost and estimated net realisable value. Cost is determined on weighted average basis.
d) Fixed assets and intangible assets
Fixed assets are stated at cost, less accumulated depreciation and impairment losses, if any. Cost includes all expenditure necessary to bring the asset to its working condition for its intended use. Own manufactured assets are capitalised inclusive of all direct costs and attributable overheads. Capital work-in-progress comprises of advances paid to acquire fixed assets and the cost of fixed assets that are not yet ready for their intended use as at the balance sheet date. In the case of new undertaking, preoperative expenses are capitalised upon the commencement of commercial production. Assets held for disposal are stated at the lower of net book value and the estimated net realisable value.
In respect of accounting periods commencing on or after December 7, 2006, exchange differences arising on reporting of the long-term foreign currency monetary items at rates different from those that at which they were initially recorded during the period, or reported in the previous financial statements are added to or deducted from the cost of the asset and are depreciated over the balance life of the asset, if these monetary items pertain to the acquisition of a depreciable fixed asset.
Intangible assets are recorded at the consideration paid for their acquisition. Cost of an internally generated asset comprises all expenditure that can be directly attributed, or allocated on a reasonable and consistent basis, to create, produce and make the asset ready for its intended use.
The carrying amounts of the assets belonging to each cash generating unit ('CGU') are reviewed at each balance sheet date to assess whether they are recorded in excess of their recoverable amounts and where carrying amounts exceed the recoverable amount of the asset's CGU, assets are written down to their recoverable amount. Recoverable amount is the greater of the asset's net selling price and value in use. The impairment loss recognised in prior accounting periods is reversed if there has been a change in estimates of recoverable amount.
e) Depreciation and amortisation
Depreciation is provided on the written down value method ('WDV') unless otherwise stated, pro-rata to the period of use of assets and is based on management's estimate of useful lives of the fixed assets or intangible assets or at rates specified in Schedule XIV to the Act, whichever is higher.
The following are the rates of depreciation/amortisation applied:
Depreciation
Type of asset Rate (%)
Office building 5.00
Factory building 10.00
Moulds 13.91 or useful life based on usage
Plant and machinery
- Single Shift 13.91
- Double Shift 20.87
- Triple Shift 27.82
Patterns 30.00 or useful life based on usage
Plugs for moulds 50.00 or useful life based on usage
Wind research and measuring 50.00
Equipment
Computers 40.00
Office equipment 13.91
Furniture and fixtures 18.10
Motor car and others 25.89
Trailers 30.00
Amortisation
Type of asset Basis
Leasehold land Period of lease
Design and drawings Straight line basis over a period of five years
SAP Software Straight line basis over a period of five years
91Suzlon Energy Limited, Annual Report 2009-10
92
The cost of work-in-progress, semi-finished goods and finished goods includes the cost of material, labour and manufacturing overheads.
Stock of land and land lease rights is valued at lower of cost and estimated net realisable value. Cost is determined on weighted average basis. Net realisable value is determined by management using technical estimates.
g) Investments
Investments that are readily realisable and intended to be held for not more than a year are classified as current investments. All other investments are classified as long term investments. Current investments are carried at lower of cost and fair value, determined on an individual basis. Long-term investments are carried at cost. However, provision is made to recognise a decline, other than temporary, in the value of long-term investments.
h) Foreign currency transactions
Transactions in foreign currencies are recorded at the average exchange rate prevailing in the period during which the transactions occur.
Outstanding balances of foreign currency monetary items are reported using the period end rates. Pursuant to the notification of the Companies (Accounting Standards) Amendment Rules 2009, issued by Ministry of Corporate Affairs on March 31, 2009, amending Accounting Standard – 11 (AS - 11), 'The Effects of Changes in Foreign Exchange Rates (revised 2003), exchange differences in respect of accounting periods commencing on or after December 7, 2006, relating to long term monetary items are dealt with in the following manner:
a) Exchange differences relating to long term foreign currency monetary items, arising during the year, in so far as they relate to the acquisition of a depreciable capital asset are added to/deducted from the cost of the asset and depreciated/recovered over the balance life of the asset.
b) In other cases, such differences are accumulated in the "Foreign Currency Monetary Item Translation Difference Account" and amortised to the profit and loss account over the balance life of the long term monetary item but not beyond March 31, 2011.
All other exchange differences are recognised as income or expense in the profit and loss account.
Non-monetary items carried in terms of historical cost denominated in a foreign currency are reported using the exchange rate at the date of the transaction; and non-monetary items which are carried at fair value or other similar valuation denominated in a foreign currency are reported using the exchange rate that existed, when the values were determined.
Exchange differences arising as a result of the above are recognised as income or expense in the profit and loss account.
Foreign currency transactions entered into by branches, which are integral foreign operations are accounted in the same manner as foreign currency transactions described above. Branch monetary assets and liabilities are restated at the year end rates.
Derivatives
In case of forward contracts, the difference between the forward rate and the exchange rate, being the premium or discount, at the inception of a forward exchange contract is recognised as income/expense over the life of the contract. Exchange differences on such contracts are recognised in the profit and loss account in the reporting period in which the rates change. Any profit or loss arising on cancellation or renewal of forward exchange contract is recognised as income or as expense for the period.
As per the Institute of Chartered Accountants of India ('ICAI') announcement, derivative contracts, other than those covered under AS-11, are marked to market on a portfolio basis and the net loss after considering the offsetting effect on the underlying hedge items is charged to the profit and loss account. Net gains on marked to market basis are not recognised.
i) Borrowing costs
Borrowing costs that are directly attributable to the acquisition, construction or production of qualifying assets are capitalised as part of the cost of such assets. A qualifying asset is one that necessarily takes substantial period of time to get ready for intended use. Costs incurred in raising funds are amortised equally over the period for which the funds are acquired. All other borrowing costs are charged to profit and loss account.
j) Retirement and other employee benefits
Defined contributions to provident fund and employee state insurance are charged to the profit and loss account of the year when the contributions to the respective funds are due. There are no other obligations other than the contribution payable to the respective statutory authorities.
Suzlon Energy Limited, Annual Report 2009-10
Defined contributions to superannuation fund are charged to the profit and loss account on accrual basis.
Retirement benefits in the form of gratuity are considered as defined benefit obligations, and are provided for on the basis of an actuarial valuation, using projected unit credit method, as at each balance sheet date.
Short-term compensated absences are provided based on estimates. Long-term compensated absences are provided for on the basis of an actuarial valuation, using projected unit credit method, as at each balance sheet date.
Actuarial gains/losses are taken to profit and loss account and are not deferred.
k) Provisions, contingent liabilities and contingent assets
A provision is recognised when the Company has a present obligation as a result of past events and it is probable that an outflow of resources will be required to settle the obligation, in respect of which a reliable estimate can be made. Provisions are not discounted to their present value and are determined based on best estimate required to settle the obligation at the balance sheet date. These are reviewed at each balance sheet date and adjusted to reflect the current best estimates.
Contingent liabilities are disclosed by way of notes to accounts unless the possibility of an outflow is remote. Contingent assets are not recognised or disclosed.
l) Taxes on Income
Tax expense for a year comprises of current tax and deferred tax. Current tax is measured at the amount expected to be paid to the tax authorities, after taking into consideration, the applicable deductions and exemptions admissible under the provisions of the Income Tax Act, 1961.
Deferred tax reflects the impact of current year timing differences between taxable income and accounting income for the year and reversal of timing differences of earlier years. Deferred tax is measured based on the tax rates and the tax laws enacted or substantively enacted at the balance sheet date. Deferred tax assets are recognised only to the extent that there is reasonable certainty that sufficient future taxable income will be available against which such deferred tax assets can be realised. If there is unabsorbed depreciation or carry forward of losses under tax laws, all deferred tax assets are recognised only to the extent that there is virtual certainty supported by convincing evidence that sufficient future taxable income will be available against which such deferred tax assets can be realised.
Deferred tax resulting from timing differences which originate during the tax holiday period but are expected to reverse after such tax holiday period is recognised in the year in which the timing differences originate using the tax rates and laws enacted or substantively enacted at the balance sheet date.
At each balance sheet date, the Company reassesses unrecognised deferred tax assets. It recognises unrealised deferred tax assets to the extent it has become reasonably certain or virtually certain, as the case may be, that sufficient taxable income will be available against which the deferred tax can be realised. Further the carrying amounts of deferred tax assets are reviewed at each balance sheet date. The Company writes-down the carrying amount of a deferred tax asset to the extent that it is no longer reasonably certain or virtually certain, as the case may be, that sufficient future taxable income will be available against which deferred tax asset can be realised. Any such write-down is reversed to the extent that it becomes reasonably certain or virtually certain, as the case may be, that sufficient future taxable income will be available.
Minimum alternative tax ('MAT') credit is recognised as an asset only when and to the extent there is convincing evidence that the Company will pay income tax higher than that computed under MAT, during the period that MAT is permitted to be set off under the Income Tax Act, 1961 (specified period). In the year, in which the MAT credit becomes eligible to be recognised as an asset in accordance with the recommendations contained in the Guidance Note issued by the Institute of Chartered Accountants of India (ICAI), the said asset is created by way of a credit to the profit and loss account and shown as MAT credit entitlement. The Company reviews the same at each balance sheet date and writes down the carrying amount of MAT credit entitlement to the extent there is no longer convincing evidence to the effect that the Company will pay income tax higher than MAT during the specified period.
m) Operating leases
Assets acquired on lease where a significant portion of the risks and rewards of ownership are retained by the lessor are classified as operating lease. Lease rentals are charged off to the profit and loss account as incurred.
n) Earnings/(loss) per share
Basic earnings/(loss) per share are calculated by dividing the net profit / (loss) for the period attributable to equity shareholders (after deducting preference dividends and attributable taxes) by the weighted average number of equity shares outstanding during the period. The weighted average number of equity shares outstanding during the period are adjusted for any bonus shares issued during the year and also after the balance sheet date but before the date the financial statements are approved by the board of directors.
93Suzlon Energy Limited, Annual Report 2009-10
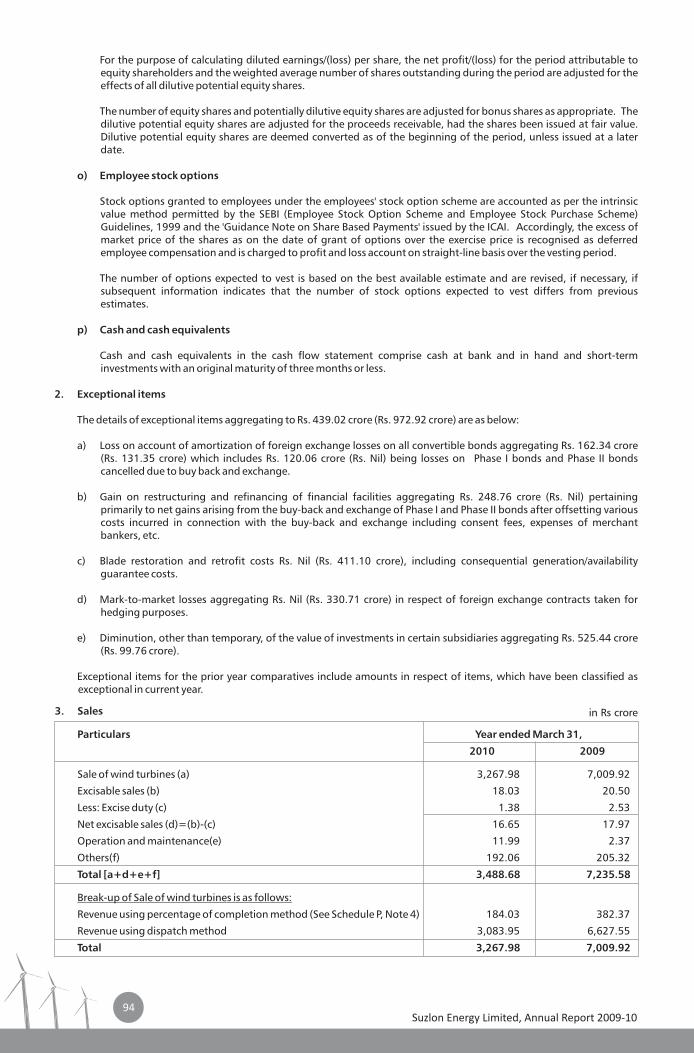
For the purpose of calculating diluted earnings/(loss) per share, the net profit/(loss) for the period attributable to equity shareholders and the weighted average number of shares outstanding during the period are adjusted for the effects of all dilutive potential equity shares.
The number of equity shares and potentially dilutive equity shares are adjusted for bonus shares as appropriate. The dilutive potential equity shares are adjusted for the proceeds receivable, had the shares been issued at fair value. Dilutive potential equity shares are deemed converted as of the beginning of the period, unless issued at a later date.
o) Employee stock options
Stock options granted to employees under the employees' stock option scheme are accounted as per the intrinsic value method permitted by the SEBI (Employee Stock Option Scheme and Employee Stock Purchase Scheme) Guidelines, 1999 and the 'Guidance Note on Share Based Payments' issued by the ICAI. Accordingly, the excess of market price of the shares as on the date of grant of options over the exercise price is recognised as deferred employee compensation and is charged to profit and loss account on straight-line basis over the vesting period.
The number of options expected to vest is based on the best available estimate and are revised, if necessary, if subsequent information indicates that the number of stock options expected to vest differs from previous estimates.
p) Cash and cash equivalents
Cash and cash equivalents in the cash flow statement comprise cash at bank and in hand and short-term investments with an original maturity of three months or less.
2. Exceptional items
The details of exceptional items aggregating to Rs. 439.02 crore (Rs. 972.92 crore) are as below:
a) Loss on account of amortization of foreign exchange losses on all convertible bonds aggregating Rs. 162.34 crore (Rs. 131.35 crore) which includes Rs. 120.06 crore (Rs. Nil) being losses on Phase I bonds and Phase II bonds cancelled due to buy back and exchange.
b) Gain on restructuring and refinancing of financial facilities aggregating Rs. 248.76 crore (Rs. Nil) pertaining primarily to net gains arising from the buy-back and exchange of Phase I and Phase II bonds after offsetting various costs incurred in connection with the buy-back and exchange including consent fees, expenses of merchant bankers, etc.
c) Blade restoration and retrofit costs Rs. Nil (Rs. 411.10 crore), including consequential generation/availability guarantee costs.
d) Mark-to-market losses aggregating Rs. Nil (Rs. 330.71 crore) in respect of foreign exchange contracts taken for hedging purposes.
e) Diminution, other than temporary, of the value of investments in certain subsidiaries aggregating Rs. 525.44 crore (Rs. 99.76 crore).
Exceptional items for the prior year comparatives include amounts in respect of items, which have been classified as exceptional in current year.
3. Sales
Particulars Year ended March 31,
2010 2009
Sale of wind turbines (a) 3,267.98 7,009.92
Excisable sales (b) 18.03 20.50
Less: Excise duty (c) 1.38 2.53
Net excisable sales (d)=(b)-(c) 16.65 17.97
Operation and maintenance(e) 11.99 2.37
Others(f) 192.06 205.32
Total [a+d+e+f] 3,488.68 7,235.58
Break-up of Sale of wind turbines is as follows:
Revenue using percentage of completion method (See Schedule P, Note 4) 184.03 382.37
Revenue using dispatch method 3,083.95 6,627.55
Total 3,267.98 7,009.92
in croreRs
94Suzlon Energy Limited, Annual Report 2009-10
* includes Rs. 189.51 crore classified as exceptional item during the year ended March 31, 2009.
The provision for performance guarantee ('PG') represents the expected outflow of resources against claims for performance shortfall expected in future over the life of the guarantee assured. The period of performance guarantee varies for each customer according to the terms of contract. The key assumptions in arriving at the performance guarantee provisions are wind velocity, plant load factor, grid availability, load shedding, historical data, wind variation factor, etc.
The provision for operation, maintenance and warranty ('O&M')represents the expected liability on account of field failure of parts of WTG and expected expenditure of servicing the WTGs over the period of free operation, maintenance and warranty, which varies according to the terms of each sales order.
Provision for liquidated damages ('LD') represents the expected claims which the Company may need to pay for non fulfilment of certain commitments as per the terms of the sales order. These are determined on a case to case basis considering the dynamics of each sales order and the factors relevant to that sale.
6. Deferred tax assets, net
Particulars As at During the year
March 31, 2009 2009-10 March 31, 2010
Deferred tax assets:
Provision for PG, LD, O&M 65.66 (65.66) –
Provision for doubtful debts 6.51 (6.51) –
Unabsorbed losses and depreciation 97.79 (97.79) –
Share issue expenses 1.07 (1.07) –
Depreciation on fixed assets 4.37 (4.37) –
Total deferred tax assets 175.40 (175.40) –
As at
4. Disclosures pursuant to Accounting Standard-7 (AS-7) 'Construction Contracts'
Particulars Year ended March 31,
2010 2009
Contract revenue recognised during the period 184.03 382.37
Aggregate amount of contract cost incurred and recognised – 125.35profits (less recognised losses) for all contracts in progress up to the reporting date
Amount of customer advances outstanding for contracts in – –progress up to the reporting date
Retention amount due from customers for contract in progress – 71.73up to the reporting date
Due from customers – –
Due to customers – –
5. Provisions
In pursuance of Accounting Standard-29 (AS-29) 'Provisions, contingent liabilities and contingent assets', the provisions required have been incorporated in the books of account in the following manner:
Particulars Performance Operation, Provision for
guarantee maintenance liquidated
and warranty damages
Opening balance 160.89 158.98 27.51
(310.29) (122.25) (19.03)
Additions during the year 119.25 99.58 54.48
*(471.30) (143.05) (155.65)
Utilisation 195.10 159.01 46.71
(620.70) (106.32) (147.17)
Closing balance 85.04 99.55 35.28
(160.89) (158.98) (27.51)
in Rs crore
in Rs crore
in Rs crore
95Suzlon Energy Limited, Annual Report 2009-10
7. Earnings/(loss) per share ('EPS')
All amounts in Rs crore except per share data
Particulars As at March 31
2010 2009
Basic
Net profit/(loss) after tax A (1,414.09) (469.27)
Weighted average number of equity shares B 1,538,477,796 1,497,932,537
Basic earnings/(loss) per share of Rs. 2 each A/B (9.19) (3.13)
Diluted
Net profit/(loss) after tax C (1,414.09) (469.27)
Less: Interest on foreign currency D 17.54 Nilconvertible bonds (net of tax)
Adjusted net loss after tax E=C-D (1,396.55) (469.27)
Weighted average number of equity shares F 1,538,477,796 1,497,932,537
Add: Equity shares for no consideration G 1,066,418 28,507arising on grant of share options
Add: Potential weighted average equity shares H 102,922,093 55,516,717that could arise on conversion of foreign currency convertible bonds
Weighted average number of equity shares I = (F+G+H) 1,642,466,307 1,553,477,761for diluted EPS
Diluted earnings/(loss) per share (Rs) of (9.19) (3.13)face value of Rs. 2 each [see note below]*
*Since the earnings/(loss) per share computation based on diluted weighted average number of shares is anti-dilutive, the basic and diluted earnings/(loss) per share is the same.
8. Foreign currency convertible bonds
a) Initial terms of issue
On June 11, 2007, the Company made an issue of zero coupon convertible bonds aggregating USD 300 million (Rs. 1,223.70 crore) [Phase I bonds]. Further, on October 10, 2007, the Company has made an additional issue of zero coupon convertible bonds aggregating USD 200 million (Rs 786.20 crore) [Phase II bonds].
The key terms of these bonds were as follows:
Particulars Phase I Phase II
Issue size (USD) 300 million 200 million
Face value per bond (in USD) 1,000 1,000
No. of equity shares per bond 113.50 107.30
Initial conversion price per share(Rs) 359.68 371.55
Fixed exchange rate (Rs/USD) 40.83 39.87
Redemption amount as a % of principal amount (%) 145.23 144.88
Maturity date June 12, 2012 October 11, 2012
b) Restructuring of Phase I and Phase II bonds
During the year, the Company has restructured Phase I and Phase II Zero Coupon Convertible Bonds with an approval of the Reserve Bank of India ('RBI') and the bondholders were offered the following options as part of the restructuring;
• Buyback of bonds @ 54.55% of the face value of US $ 1000 per bond.
• Issue of new bonds in place of old bonds at a fixed ratio of 3:5 (60 cents to dollar) bearing a coupon of 7.5 per cent per annum, payable semi-annually. Unless previously redeemed, converted or purchased and cancelled, the Company will redeem each Phase I New Bond at 150.24 per cent of its principal amount and each Phase II New Bond at 157.72 per cent of its principal amount on the relevant maturity date. The conversion price is set at Rs. 76.68 per share. These bonds do not have any financial covenants and are of the same maturity as the old bonds.
• Consent fee of USD15 million to be paid across both the series, for those bondholders who consent to the relaxation of covenants.
96Suzlon Energy Limited, Annual Report 2009-10
As a result of the restructuring, the outstanding position of the foreign currency convertible bonds is as follows;
In the opinion of the management, the likelihood of redemption of these bonds cannot presently be ascertained. Accordingly no provision for any liability has been made in the financial statements and hence the proportionate premium has been shown as a contingent liability. The Company has adequate securities premium to absorb the proportionate premium on redemption as at March 31, 2010.
e) Developments post year end
The Company has convened meetings of each of the Bondholders on April 29, 2010, and following are some of the key developments:
• The conversion price of the Phase I bonds has been changed from Rs. 359.68 per equity share to Rs. 97.26 per equity share and for Phase II bonds from Rs. 371.55 per equity share to Rs. 97.26 per equity share, subject to
Phase March 31, 2010 March 31, 2009
Phase I 221.09 154.73
Phase II 109.98 71.38
Phase I (new) 18.53 –
Phase II (new) 10.98 –
Phase III 16.64 –
Total 377.22 226.11
Particulars Phase I Bonds
(Amount in USD) (Amount in USD) (Amount in USD)
Old bonds exchanged [A] 59,332,000 34,672,000 94,004,000
New Bonds issued in the ratio of 3:5 [B] *35,592,000 20,796,000 *56,388,000
Bonds bought back for cash [C] 29,366,000 43,960,000 73,326,000
Cash paid for buyback [D] 16,019,702 23,980,180 39,999,882
Old bonds outstanding [E] 211,302,000 121,368,000 332,670,000
Value of total bonds outstanding [F]=[B]+[E] 246,894,000 142,164,000 389,058,000
Value of old bonds [G]=[A]+[C]+[E] 300,000,000 200,000,000 500,000,000
Consent fee paid 11,846,947 1,869,863 13,716,810
Maturity date June 12, 2012 October 11, 2012
Redemption amount as a % of principal amount of 150.24 157.72New Bonds (%)
Redemption amount as a % of principal amount of 145.23 144.88Old Bonds carried forward(%)
Phase II Bonds Total
* 19,000 bonds have been converted into equity shares during the year.
c) Issue of new bonds during the year
On July 24, 2009, the Company made an issue of Zero Coupon Convertible Bonds due 2014 for a total amount of USD 93.87 million (approximately Rs. 452.64 crore) at an issue price of 104.30% of the principal amount of USD 90.00 million comprising of 90,000 Zero Coupon Convertible Bonds due 2014 of USD 1,000 each ('Phase III Bonds'), the key term of which are as follows:
a) convertible by the holders at any time on or after September 2, 2009, but prior to close of business on July 18, 2014. Each bond will be converted into 533.2762 fully paid up equity shares with face value of Rs. 2 per share at an initial conversion price of Rs. 90.38 per equity share of Rs. 2 each at a fixed exchange rate conversion of Rs. 48.1975= USD 1.
b) redeemable in whole but not in part at the option of the Company if less than 10 percent of the aggregate principal amount of the Bonds originally issued is outstanding, subject to satisfaction of certain conditions.
c) redeemable on maturity date at 134.198% of its principal amount, if not redeemed or converted earlier.
The Company has incurred Rs. 5.30 crore during the year on account of issue expenses towards the issue of Phase III Bonds which have been adjusted against Securities Premium.
d) Redemption premium
The Phase I, Phase II, Phase I New, Phase II New, and Phase III bonds are redeemable subject to satisfaction of certain conditions mentioned in the offering circular and have hence been designated as monetary liability.
The Company has not provided for the proportionate premium on these bonds aggregating Rs. 377.22 crore (Rs. 226.11 crore) as shown below: in Rs crore
97Suzlon Energy Limited, Annual Report 2009-10
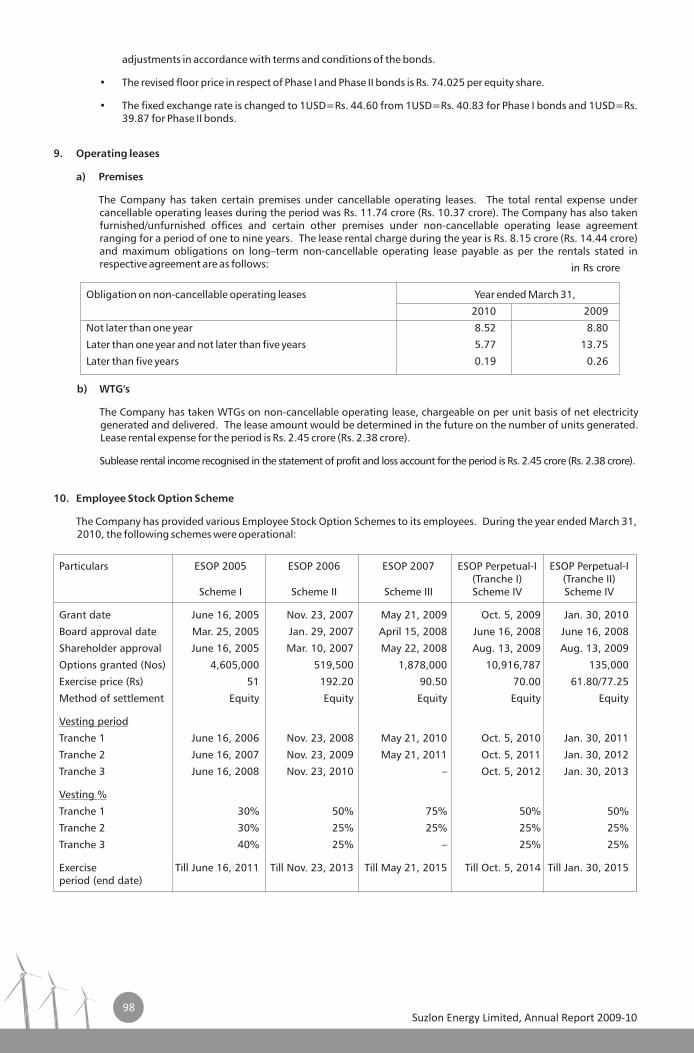
10. Employee Stock Option Scheme
The Company has provided various Employee Stock Option Schemes to its employees. During the year ended March 31, 2010, the following schemes were operational:
Particulars ESOP 2005 ESOP 2006 ESOP 2007 ESOP Perpetual-I (Tranche I) (Tranche II)
Scheme I Scheme II Scheme III Scheme IV Scheme IV
Grant date June 16, 2005 Nov. 23, 2007 May 21, 2009 Oct. 5, 2009 Jan. 30, 2010
Board approval date Mar. 25, 2005 Jan. 29, 2007 April 15, 2008 June 16, 2008 June 16, 2008
Shareholder approval June 16, 2005 Mar. 10, 2007 May 22, 2008 Aug. 13, 2009 Aug. 13, 2009
Options granted (Nos) 4,605,000 519,500 1,878,000 10,916,787 135,000
Exercise price (Rs) 51 192.20 90.50 70.00 61.80/77.25
Method of settlement Equity Equity Equity Equity Equity
Vesting period
Tranche 1 June 16, 2006 Nov. 23, 2008 May 21, 2010 Oct. 5, 2010 Jan. 30, 2011
Tranche 2 June 16, 2007 Nov. 23, 2009 May 21, 2011 Oct. 5, 2011 Jan. 30, 2012
Tranche 3 June 16, 2008 Nov. 23, 2010 – Oct. 5, 2012 Jan. 30, 2013
Vesting %
Tranche 1 30% 50% 75% 50% 50%
Tranche 2 30% 25% 25% 25% 25%
Tranche 3 40% 25% – 25% 25%
Exercise Till June 16, 2011 Till Nov. 23, 2013 Till May 21, 2015 Till Oct. 5, 2014 Till Jan. 30, 2015period (end date)
ESOP Perpetual-I
adjustments in accordance with terms and conditions of the bonds.
• The revised floor price in respect of Phase I and Phase II bonds is Rs. 74.025 per equity share.
• The fixed exchange rate is changed to 1USD=Rs. 44.60 from 1USD=Rs. 40.83 for Phase I bonds and 1USD=Rs. 39.87 for Phase II bonds.
9. Operating leases
a) Premises
The Company has taken certain premises under cancellable operating leases. The total rental expense under cancellable operating leases during the period was Rs. 11.74 crore (Rs. 10.37 crore). The Company has also taken furnished/unfurnished offices and certain other premises under non-cancellable operating lease agreement ranging for a period of one to nine years. The lease rental charge during the year is Rs. 8.15 crore (Rs. 14.44 crore) and maximum obligations on long–term non-cancellable operating lease payable as per the rentals stated in respective agreement are as follows:
Obligation on non-cancellable operating leases Year ended March 31,
2010 2009
Not later than one year 8.52 8.80
Later than one year and not later than five years 5.77 13.75
Later than five years 0.19 0.26
b) WTG's
The Company has taken WTGs on non-cancellable operating lease, chargeable on per unit basis of net electricity generated and delivered. The lease amount would be determined in the future on the number of units generated. Lease rental expense for the period is Rs. 2.45 crore (Rs. 2.38 crore).
Sublease rental income recognised in the statement of profit and loss account for the period is Rs. 2.45 crore (Rs. 2.38 crore).
in Rs crore
98Suzlon Energy Limited, Annual Report 2009-10
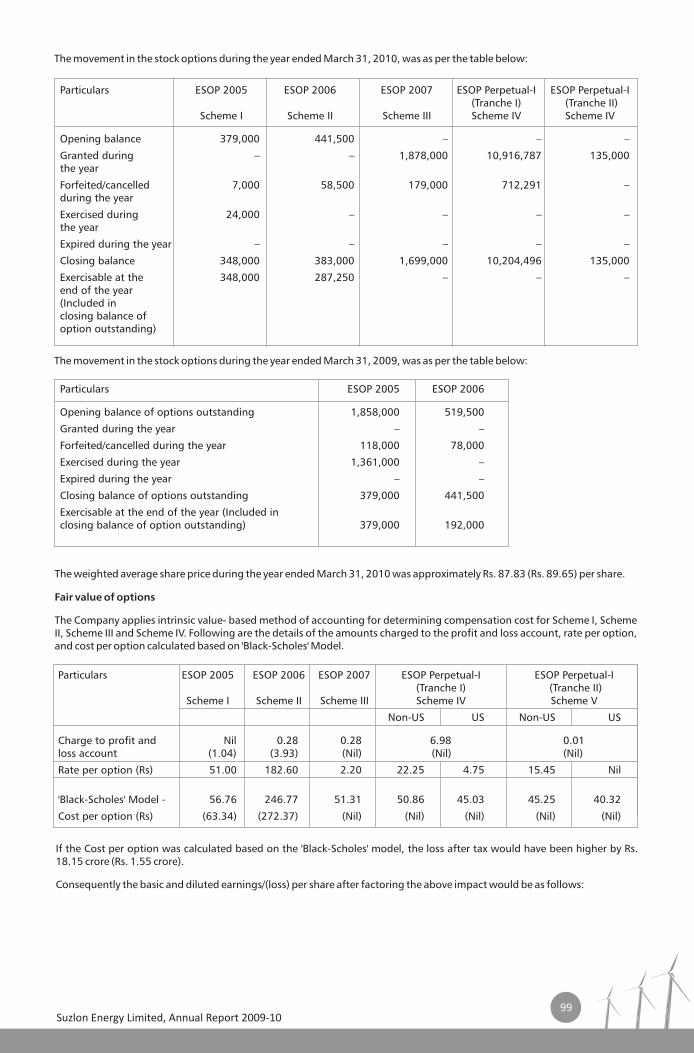
The weighted average share price during the year ended March 31, 2010 was approximately Rs. 87.83 (Rs. 89.65) per share.
Fair value of options
The Company applies intrinsic value- based method of accounting for determining compensation cost for Scheme I, Scheme II, Scheme III and Scheme IV. Following are the details of the amounts charged to the profit and loss account, rate per option, and cost per option calculated based on 'Black-Scholes' Model.
Particulars ESOP 2005 ESOP 2006 ESOP 2007 ESOP Perpetual-I(Tranche I) (Tranche II)
Scheme I Scheme II Scheme III Scheme IV Scheme V
Non-US US Non-US US
Charge to profit and Nil 0.28 0.28 6.98 0.01loss account (1.04) (3.93) (Nil) (Nil) (Nil)
Rate per option (Rs) 51.00 182.60 2.20 22.25 4.75 15.45 Nil
'Black-Scholes' Model - 56.76 246.77 51.31 50.86 45.03 45.25 40.32
Cost per option (Rs) (63.34) (272.37) (Nil) (Nil) (Nil) (Nil) (Nil)
ESOP Perpetual-I
The movement in the stock options during the year ended March 31, 2010, was as per the table below:
Particulars ESOP 2005 ESOP 2006 ESOP 2007 ESOP Perpetual-I ESOP Perpetual-I(Tranche I) (Tranche II)
Scheme I Scheme II Scheme III Scheme IV Scheme IV
Opening balance 379,000 441,500 – – –
Granted during – – 1,878,000 10,916,787 135,000the year
Forfeited/cancelled 7,000 58,500 179,000 712,291 –during the year
Exercised during 24,000 – – – –the year
Expired during the year – – – – –
Closing balance 348,000 383,000 1,699,000 10,204,496 135,000
Exercisable at the 348,000 287,250 – – –end of the year (Included in closing balance of option outstanding)
The movement in the stock options during the year ended March 31, 2009, was as per the table below:
Particulars ESOP 2005 ESOP 2006
Opening balance of options outstanding 1,858,000 519,500
Granted during the year – –
Forfeited/cancelled during the year 118,000 78,000
Exercised during the year 1,361,000 –
Expired during the year – –
Closing balance of options outstanding 379,000 441,500
Exercisable at the end of the year (Included in closing balance of option outstanding) 379,000 192,000
If the Cost per option was calculated based on the 'Black-Scholes' model, the loss after tax would have been higher by Rs. 18.15 crore (Rs. 1.55 crore).
Consequently the basic and diluted earnings/(loss) per share after factoring the above impact would be as follows:
99Suzlon Energy Limited, Annual Report 2009-10
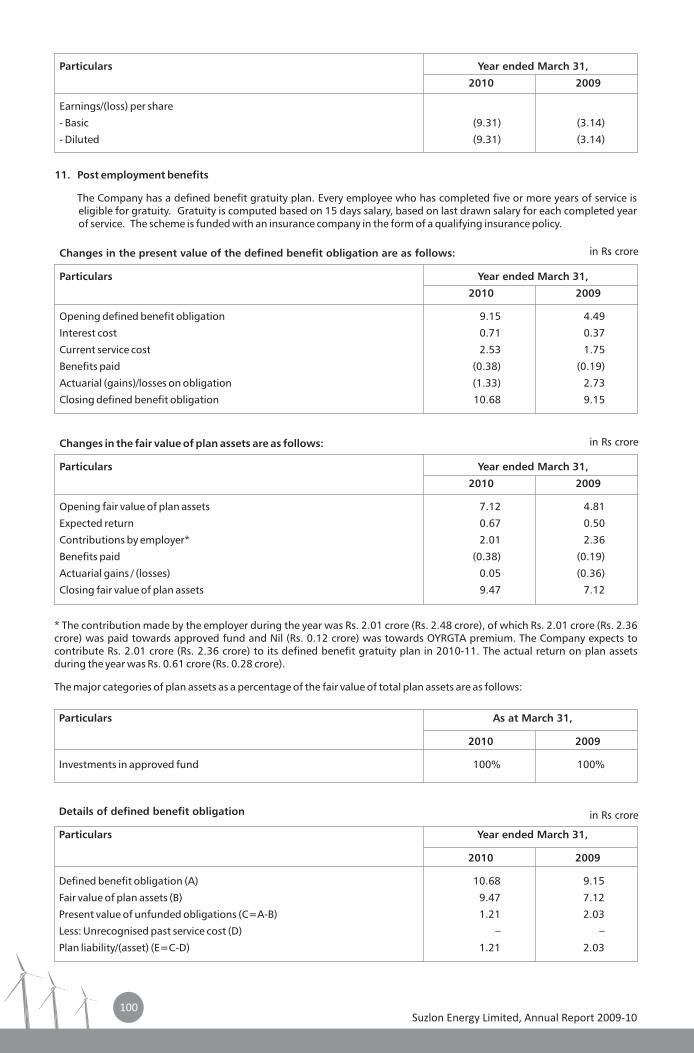
Details of defined benefit obligation
Particulars Year ended March 31,
2010 2009
Defined benefit obligation (A) 10.68 9.15
Fair value of plan assets (B) 9.47 7.12
Present value of unfunded obligations (C=A-B) 1.21 2.03
Less: Unrecognised past service cost (D) – –
Plan liability/(asset) (E=C-D) 1.21 2.03
Particulars As at March 31,
2010 2009
Investments in approved fund 100% 100%
Particulars Year ended March 31,
2010 2009
Earnings/(loss) per share
- Basic (9.31) (3.14)
- Diluted (9.31) (3.14)
11. Post employment benefits
The Company has a defined benefit gratuity plan. Every employee who has completed five or more years of service is eligible for gratuity. Gratuity is computed based on 15 days salary, based on last drawn salary for each completed year of service. The scheme is funded with an insurance company in the form of a qualifying insurance policy.
Changes in the present value of the defined benefit obligation are as follows:
Particulars Year ended March 31,
2010 2009
Opening defined benefit obligation 9.15 4.49
Interest cost 0.71 0.37
Current service cost 2.53 1.75
Benefits paid (0.38) (0.19)
Actuarial (gains)/losses on obligation (1.33) 2.73
Closing defined benefit obligation 10.68 9.15
Changes in the fair value of plan assets are as follows:
Particulars Year ended March 31,
2010 2009
Opening fair value of plan assets 7.12 4.81
Expected return 0.67 0.50
Contributions by employer* 2.01 2.36
Benefits paid (0.38) (0.19)
Actuarial gains / (losses) 0.05 (0.36)
Closing fair value of plan assets 9.47 7.12
* The contribution made by the employer during the year was Rs. 2.01 crore (Rs. 2.48 crore), of which Rs. 2.01 crore (Rs. 2.36 crore) was paid towards approved fund and Nil (Rs. 0.12 crore) was towards OYRGTA premium. The Company expects to contribute Rs. 2.01 crore (Rs. 2.36 crore) to its defined benefit gratuity plan in 2010-11. The actual return on plan assets during the year was Rs. 0.61 crore (Rs. 0.28 crore).
The major categories of plan assets as a percentage of the fair value of total plan assets are as follows:
in Rs crore
in Rs crore
in Rs crore
100Suzlon Energy Limited, Annual Report 2009-10
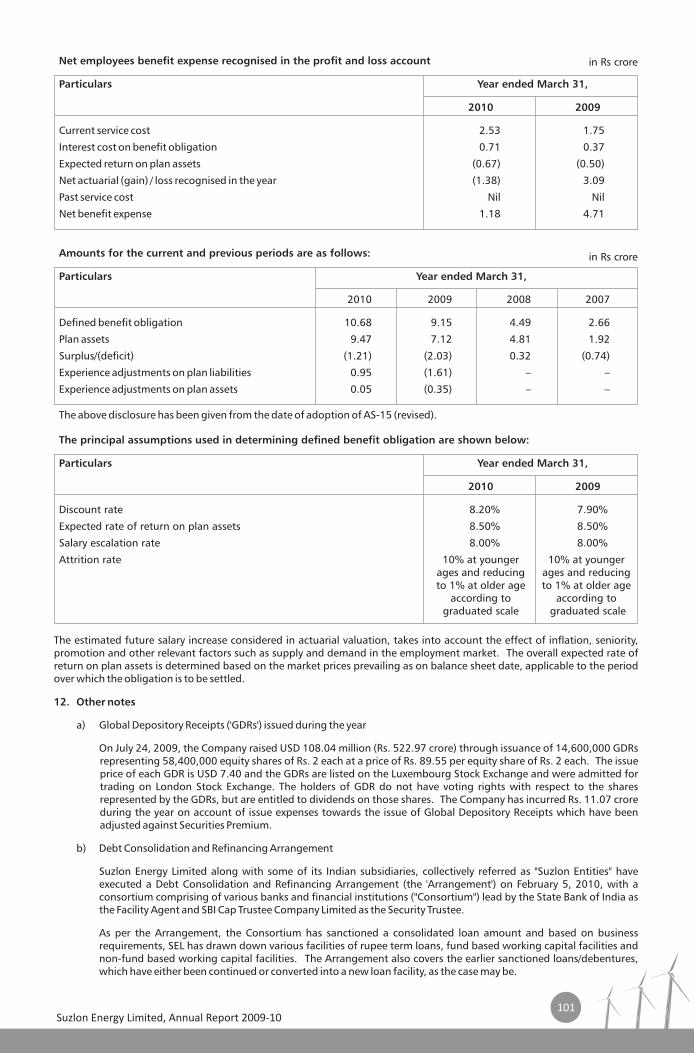
The estimated future salary increase considered in actuarial valuation, takes into account the effect of inflation, seniority, promotion and other relevant factors such as supply and demand in the employment market. The overall expected rate of return on plan assets is determined based on the market prices prevailing as on balance sheet date, applicable to the period over which the obligation is to be settled.
12. Other notes
a) Global Depository Receipts ('GDRs') issued during the year
On July 24, 2009, the Company raised USD 108.04 million (Rs. 522.97 crore) through issuance of 14,600,000 GDRs representing 58,400,000 equity shares of Rs. 2 each at a price of Rs. 89.55 per equity share of Rs. 2 each. The issue price of each GDR is USD 7.40 and the GDRs are listed on the Luxembourg Stock Exchange and were admitted for trading on London Stock Exchange. The holders of GDR do not have voting rights with respect to the shares represented by the GDRs, but are entitled to dividends on those shares. The Company has incurred Rs. 11.07 crore during the year on account of issue expenses towards the issue of Global Depository Receipts which have been adjusted against Securities Premium.
b) Debt Consolidation and Refinancing Arrangement
Suzlon Energy Limited along with some of its Indian subsidiaries, collectively referred as "Suzlon Entities" have executed a Debt Consolidation and Refinancing Arrangement (the 'Arrangement') on February 5, 2010, with a consortium comprising of various banks and financial institutions ("Consortium") lead by the State Bank of India as the Facility Agent and SBI Cap Trustee Company Limited as the Security Trustee.
As per the Arrangement, the Consortium has sanctioned a consolidated loan amount and based on business requirements, SEL has drawn down various facilities of rupee term loans, fund based working capital facilities and non-fund based working capital facilities. The Arrangement also covers the earlier sanctioned loans/debentures, which have either been continued or converted into a new loan facility, as the case may be.
Net employees benefit expense recognised in the profit and loss account
Particulars Year ended March 31,
2010 2009
Current service cost 2.53 1.75
Interest cost on benefit obligation 0.71 0.37
Expected return on plan assets (0.67) (0.50)
Net actuarial (gain) / loss recognised in the year (1.38) 3.09
Past service cost Nil Nil
Net benefit expense 1.18 4.71
Amounts for the current and previous periods are as follows:
Particulars Year ended March 31,
2010 2009 2008 2007
Defined benefit obligation 10.68 9.15 4.49 2.66
Plan assets 9.47 7.12 4.81 1.92
Surplus/(deficit) (1.21) (2.03) 0.32 (0.74)
Experience adjustments on plan liabilities 0.95 (1.61) – –
Experience adjustments on plan assets 0.05 (0.35) – –
The above disclosure has been given from the date of adoption of AS-15 (revised).
The principal assumptions used in determining defined benefit obligation are shown below:
Particulars Year ended March 31,
2010 2009
Discount rate 8.20% 7.90%
Expected rate of return on plan assets 8.50% 8.50%
Salary escalation rate 8.00% 8.00%
Attrition rate 10% at younger 10% at youngerages and reducing ages and reducingto 1% at older age to 1% at older age
according to according tograduated scale graduated scale
in Rs crore
in Rs crore
101Suzlon Energy Limited, Annual Report 2009-10
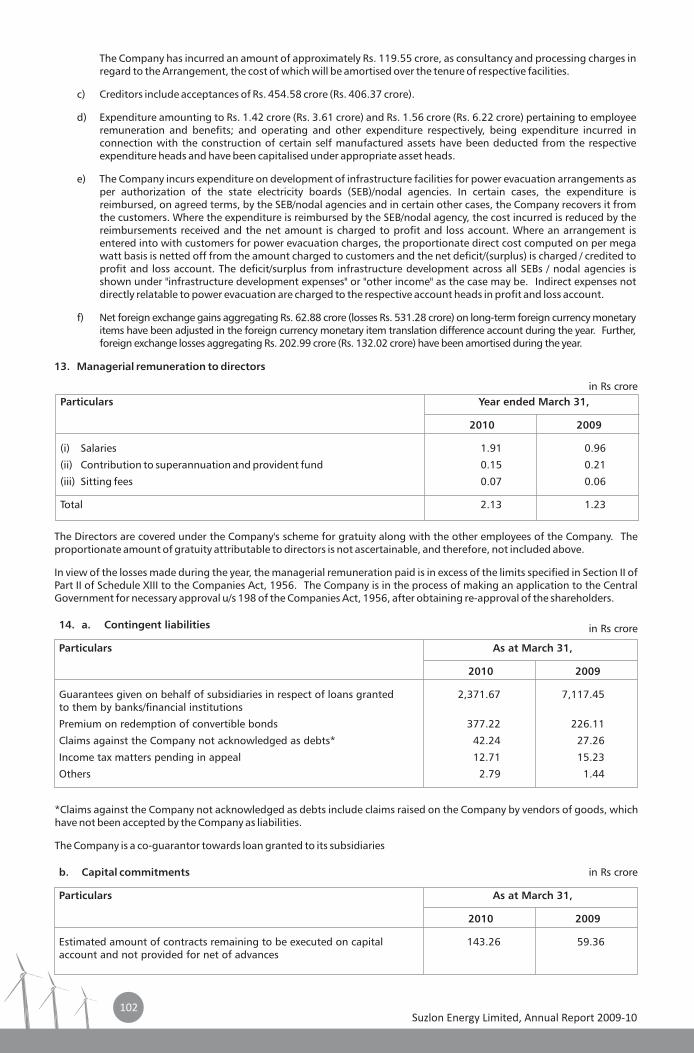
b. Capital commitments
Particulars As at March 31,
2010 2009
Estimated amount of contracts remaining to be executed on capital 143.26 59.36account and not provided for net of advances
The Company has incurred an amount of approximately Rs. 119.55 crore, as consultancy and processing charges in regard to the Arrangement, the cost of which will be amortised over the tenure of respective facilities.
c) Creditors include acceptances of Rs. 454.58 crore (Rs. 406.37 crore).
d) Expenditure amounting to Rs. 1.42 crore (Rs. 3.61 crore) and Rs. 1.56 crore (Rs. 6.22 crore) pertaining to employee remuneration and benefits; and operating and other expenditure respectively, being expenditure incurred in connection with the construction of certain self manufactured assets have been deducted from the respective expenditure heads and have been capitalised under appropriate asset heads.
e) The Company incurs expenditure on development of infrastructure facilities for power evacuation arrangements as per authorization of the state electricity boards (SEB)/nodal agencies. In certain cases, the expenditure is reimbursed, on agreed terms, by the SEB/nodal agencies and in certain other cases, the Company recovers it from the customers. Where the expenditure is reimbursed by the SEB/nodal agency, the cost incurred is reduced by the reimbursements received and the net amount is charged to profit and loss account. Where an arrangement is entered into with customers for power evacuation charges, the proportionate direct cost computed on per mega watt basis is netted off from the amount charged to customers and the net deficit/(surplus) is charged / credited to profit and loss account. The deficit/surplus from infrastructure development across all SEBs / nodal agencies is shown under "infrastructure development expenses" or "other income" as the case may be. Indirect expenses not directly relatable to power evacuation are charged to the respective account heads in profit and loss account.
f) Net foreign exchange gains aggregating Rs. 62.88 crore (losses Rs. 531.28 crore) on long-term foreign currency monetary items have been adjusted in the foreign currency monetary item translation difference account during the year. Further, foreign exchange losses aggregating Rs. 202.99 crore (Rs. 132.02 crore) have been amortised during the year.
13. Managerial remuneration to directors
Particulars Year ended March 31,
2010 2009
(i) Salaries 1.91 0.96
(ii) Contribution to superannuation and provident fund 0.15 0.21
(iii) Sitting fees 0.07 0.06
Total 2.13 1.23
The Directors are covered under the Company's scheme for gratuity along with the other employees of the Company. The proportionate amount of gratuity attributable to directors is not ascertainable, and therefore, not included above.
In view of the losses made during the year, the managerial remuneration paid is in excess of the limits specified in Section II of Part II of Schedule XIII to the Companies Act, 1956. The Company is in the process of making an application to the Central Government for necessary approval u/s 198 of the Companies Act, 1956, after obtaining re-approval of the shareholders.
14. a. Contingent liabilities
Particulars As at March 31,
2010 2009
Guarantees given on behalf of subsidiaries in respect of loans granted 2,371.67 7,117.45to them by banks/financial institutions
Premium on redemption of convertible bonds 377.22 226.11
Claims against the Company not acknowledged as debts* 42.24 27.26
Income tax matters pending in appeal 12.71 15.23
Others 2.79 1.44
*Claims against the Company not acknowledged as debts include claims raised on the Company by vendors of goods, which have not been accepted by the Company as liabilities.
The Company is a co-guarantor towards loan granted to its subsidiaries
in Rs crore
in Rs crore
in Rs crore
102Suzlon Energy Limited, Annual Report 2009-10
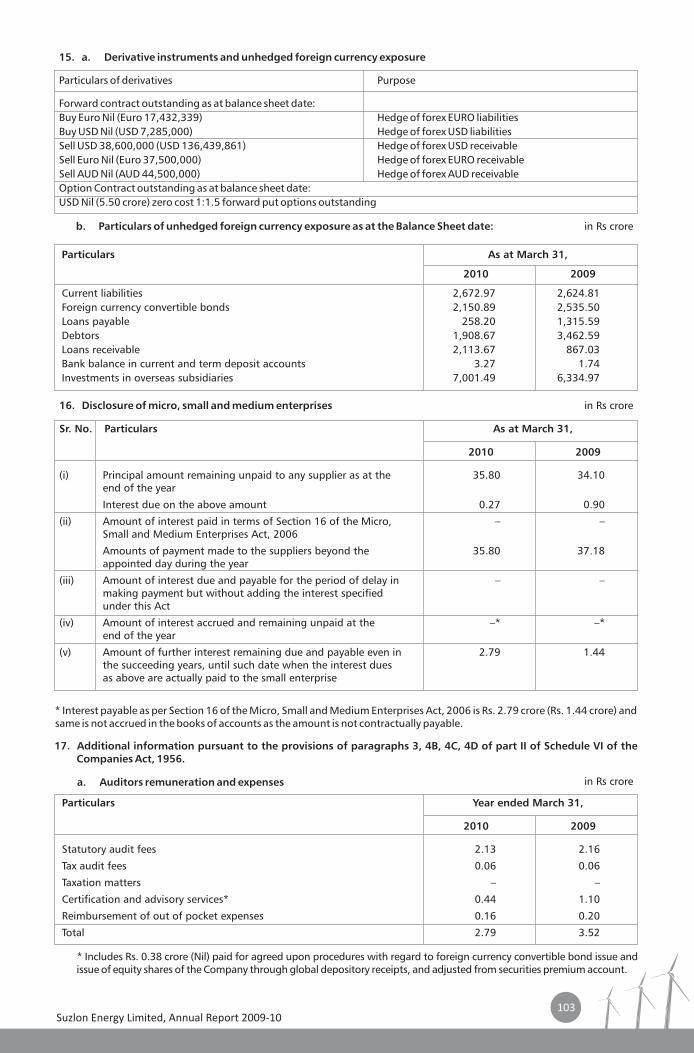
15. a. Derivative instruments and unhedged foreign currency exposure
Particulars of derivatives Purpose
Forward contract outstanding as at balance sheet date:Buy Euro Nil (Euro 17,432,339) Hedge of forex EURO liabilitiesBuy USD Nil (USD 7,285,000) Hedge of forex USD liabilitiesSell USD 38,600,000 (USD 136,439,861) Hedge of forex USD receivableSell Euro Nil (Euro 37,500,000) Hedge of forex EURO receivableSell AUD Nil (AUD 44,500,000) Hedge of forex AUD receivableOption Contract outstanding as at balance sheet date:USD Nil (5.50 crore) zero cost 1:1.5 forward put options outstanding
b. Particulars of unhedged foreign currency exposure as at the Balance Sheet date:
Particulars As at March 31,
2010 2009
Current liabilities 2,672.97 2,624.81Foreign currency convertible bonds 2,150.89 2,535.50Loans payable 258.20 1,315.59Debtors 1,908.67 3,462.59Loans receivable 2,113.67 867.03Bank balance in current and term deposit accounts 3.27 1.74Investments in overseas subsidiaries 7,001.49 6,334.97
16. Disclosure of micro, small and medium enterprises
Sr. No. Particulars As at March 31,
2010 2009
(i) Principal amount remaining unpaid to any supplier as at the 35.80 34.10end of the year
Interest due on the above amount 0.27 0.90
(ii) Amount of interest paid in terms of Section 16 of the Micro, – –Small and Medium Enterprises Act, 2006
Amounts of payment made to the suppliers beyond the 35.80 37.18appointed day during the year
(iii) Amount of interest due and payable for the period of delay in – –making payment but without adding the interest specified under this Act
(iv) Amount of interest accrued and remaining unpaid at the –* –*end of the year
(v) Amount of further interest remaining due and payable even in 2.79 1.44 the succeeding years, until such date when the interest dues as above are actually paid to the small enterprise
* Interest payable as per Section 16 of the Micro, Small and Medium Enterprises Act, 2006 is Rs. 2.79 crore (Rs. 1.44 crore) and same is not accrued in the books of accounts as the amount is not contractually payable.
17. Additional information pursuant to the provisions of paragraphs 3, 4B, 4C, 4D of part II of Schedule VI of the Companies Act, 1956.
a. Auditors remuneration and expenses
Particulars Year ended March 31,
2010 2009
Statutory audit fees 2.13 2.16
Tax audit fees 0.06 0.06
Taxation matters – –
Certification and advisory services* 0.44 1.10
Reimbursement of out of pocket expenses 0.16 0.20
Total 2.79 3.52
* Includes Rs. 0.38 crore (Nil) paid for agreed upon procedures with regard to foreign currency convertible bond issue and issue of equity shares of the Company through global depository receipts, and adjusted from securities premium account.
in Rs crore
in Rs crore
in Rs crore
103Suzlon Energy Limited, Annual Report 2009-10
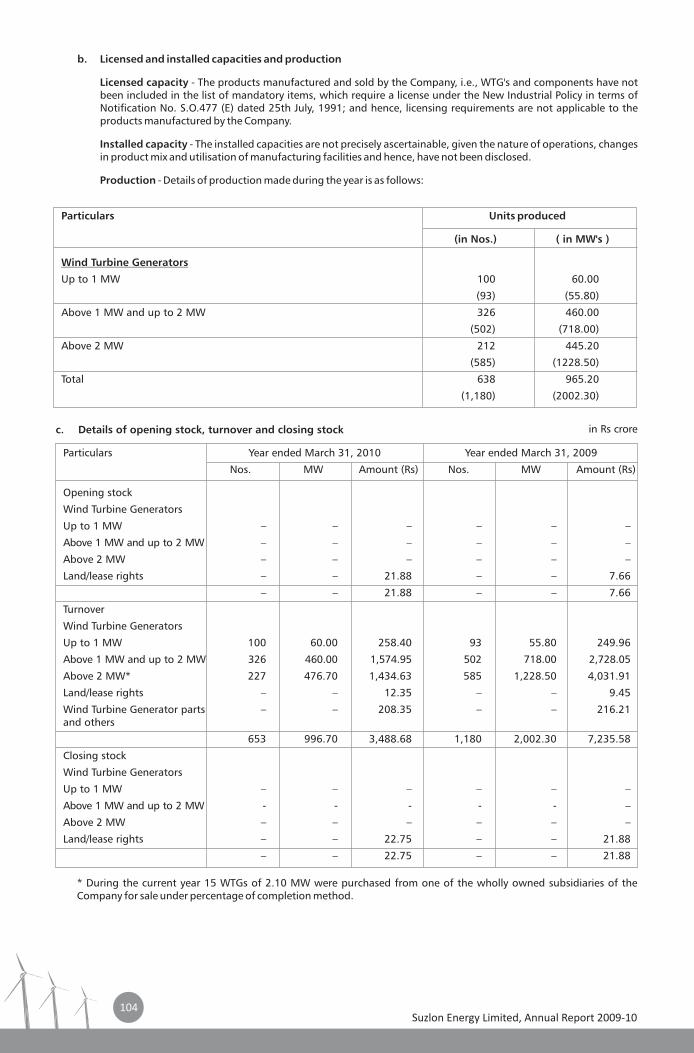
b. Licensed and installed capacities and production
Licensed capacity - The products manufactured and sold by the Company, i.e., WTG's and components have not been included in the list of mandatory items, which require a license under the New Industrial Policy in terms of Notification No. S.O.477 (E) dated 25th July, 1991; and hence, licensing requirements are not applicable to the products manufactured by the Company.
Installed capacity - The installed capacities are not precisely ascertainable, given the nature of operations, changes in product mix and utilisation of manufacturing facilities and hence, have not been disclosed.
Production - Details of production made during the year is as follows:
Particulars Units produced
(in Nos.) ( in MW's )
Wind Turbine Generators
Up to 1 MW 100 60.00
(93) (55.80)
Above 1 MW and up to 2 MW 326 460.00
(502) (718.00)
Above 2 MW 212 445.20
(585) (1228.50)
Total 638 965.20
(1,180) (2002.30)
c. Details of opening stock, turnover and closing stock
Particulars Year ended March 31, 2010 Year ended March 31, 2009
Nos. MW Amount (Rs) Nos. MW Amount (Rs)
Opening stock
Wind Turbine Generators
Up to 1 MW – – – – – –
Above 1 MW and up to 2 MW – – – – – –
Above 2 MW – – – – – –
Land/lease rights – – 21.88 – – 7.66
– – 21.88 – – 7.66
Turnover
Wind Turbine Generators
Up to 1 MW 100 60.00 258.40 93 55.80 249.96
Above 1 MW and up to 2 MW 326 460.00 1,574.95 502 718.00 2,728.05
Above 2 MW* 227 476.70 1,434.63 585 1,228.50 4,031.91
Land/lease rights – – 12.35 – – 9.45
Wind Turbine Generator parts – – 208.35 – – 216.21and others
653 996.70 3,488.68 1,180 2,002.30 7,235.58
Closing stock
Wind Turbine Generators
Up to 1 MW – – – – – –
Above 1 MW and up to 2 MW - - - - - –
Above 2 MW – – – – – –
Land/lease rights – – 22.75 – – 21.88
– – 22.75 – – 21.88
* During the current year 15 WTGs of 2.10 MW were purchased from one of the wholly owned subsidiaries of the Company for sale under percentage of completion method.
in Rs crore
104Suzlon Energy Limited, Annual Report 2009-10
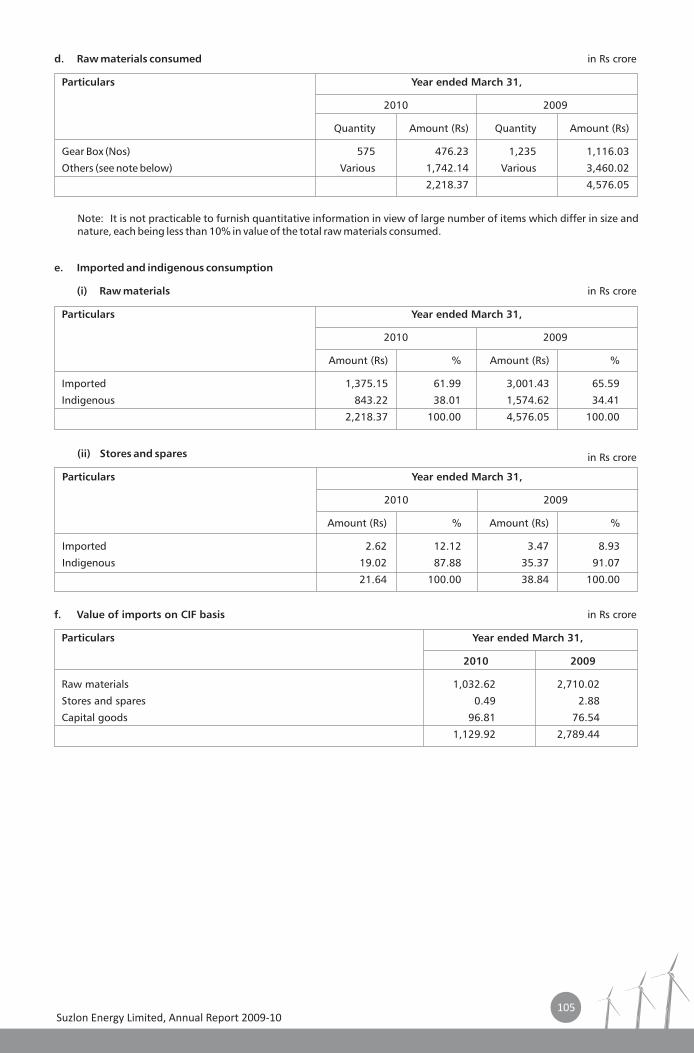
d. Raw materials consumed
Particulars Year ended March 31,
2010 2009
Quantity Amount (Rs) Quantity Amount (Rs)
Gear Box (Nos) 575 476.23 1,235 1,116.03
Others (see note below) Various 1,742.14 Various 3,460.02
2,218.37 4,576.05
Note: It is not practicable to furnish quantitative information in view of large number of items which differ in size and nature, each being less than 10% in value of the total raw materials consumed.
e. Imported and indigenous consumption
(i) Raw materials
Particulars Year ended March 31,
2010 2009
Amount (Rs) % Amount (Rs) %
Imported 1,375.15 61.99 3,001.43 65.59
Indigenous 843.22 38.01 1,574.62 34.41
2,218.37 100.00 4,576.05 100.00
(ii) Stores and spares
Particulars Year ended March 31,
2010 2009
Amount (Rs) % Amount (Rs) %
Imported 2.62 12.12 3.47 8.93
Indigenous 19.02 87.88 35.37 91.07
21.64 100.00 38.84 100.00
f. Value of imports on CIF basis
Particulars Year ended March 31,
2010 2009
Raw materials 1,032.62 2,710.02
Stores and spares 0.49 2.88
Capital goods 96.81 76.54
1,129.92 2,789.44
in Rs crore
in Rs crore
in Rs crore
in Rs crore
105Suzlon Energy Limited, Annual Report 2009-10
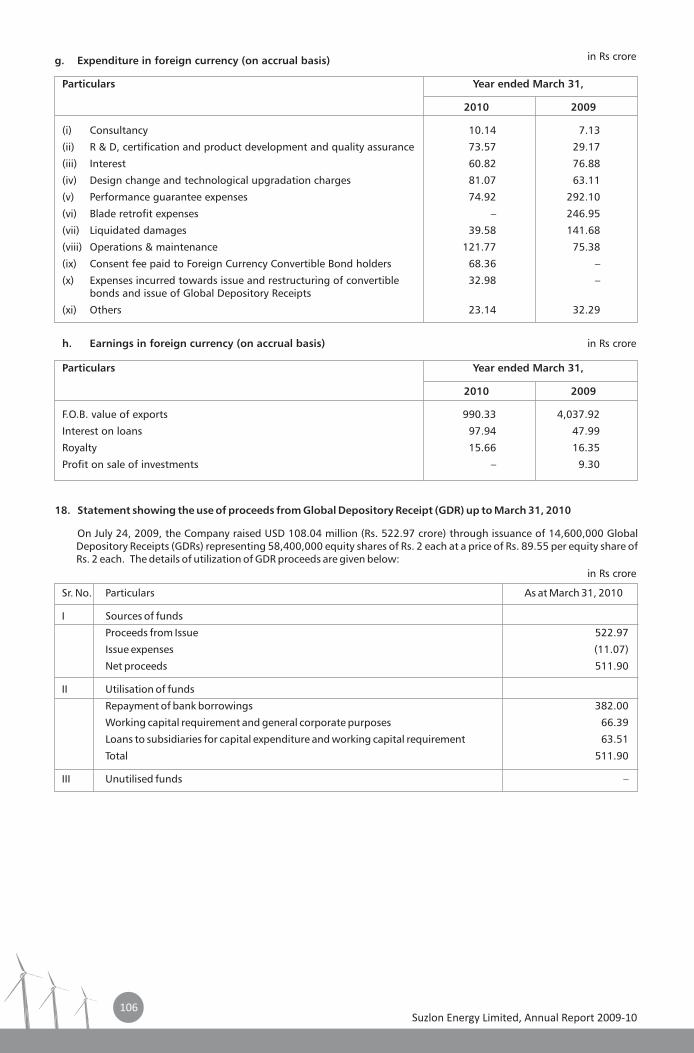
g. Expenditure in foreign currency (on accrual basis)
Particulars Year ended March 31,
2010 2009
(i) Consultancy 10.14 7.13
(ii) R & D, certification and product development and quality assurance 73.57 29.17
(iii) Interest 60.82 76.88
(iv) Design change and technological upgradation charges 81.07 63.11
(v) Performance guarantee expenses 74.92 292.10
(vi) Blade retrofit expenses – 246.95
(vii) Liquidated damages 39.58 141.68
(viii) Operations & maintenance 121.77 75.38
(ix) Consent fee paid to Foreign Currency Convertible Bond holders 68.36 –
(x) Expenses incurred towards issue and restructuring of convertible 32.98 – bonds and issue of Global Depository Receipts
(xi) Others 23.14 32.29
h. Earnings in foreign currency (on accrual basis)
Particulars Year ended March 31,
2010 2009
F.O.B. value of exports 990.33 4,037.92
Interest on loans 97.94 47.99
Royalty 15.66 16.35
Profit on sale of investments – 9.30
Sr. No. Particulars As at March 31, 2010
I Sources of funds
Proceeds from Issue 522.97
Issue expenses (11.07)
Net proceeds 511.90
II Utilisation of funds
Repayment of bank borrowings 382.00
Working capital requirement and general corporate purposes 66.39
Loans to subsidiaries for capital expenditure and working capital requirement 63.51
Total 511.90
III Unutilised funds –
18. Statement showing the use of proceeds from Global Depository Receipt (GDR) up to March 31, 2010
On July 24, 2009, the Company raised USD 108.04 million (Rs. 522.97 crore) through issuance of 14,600,000 Global Depository Receipts (GDRs) representing 58,400,000 equity shares of Rs. 2 each at a price of Rs. 89.55 per equity share of Rs. 2 each. The details of utilization of GDR proceeds are given below:
in Rs crore
in Rs crore
in Rs crore
106Suzlon Energy Limited, Annual Report 2009-10
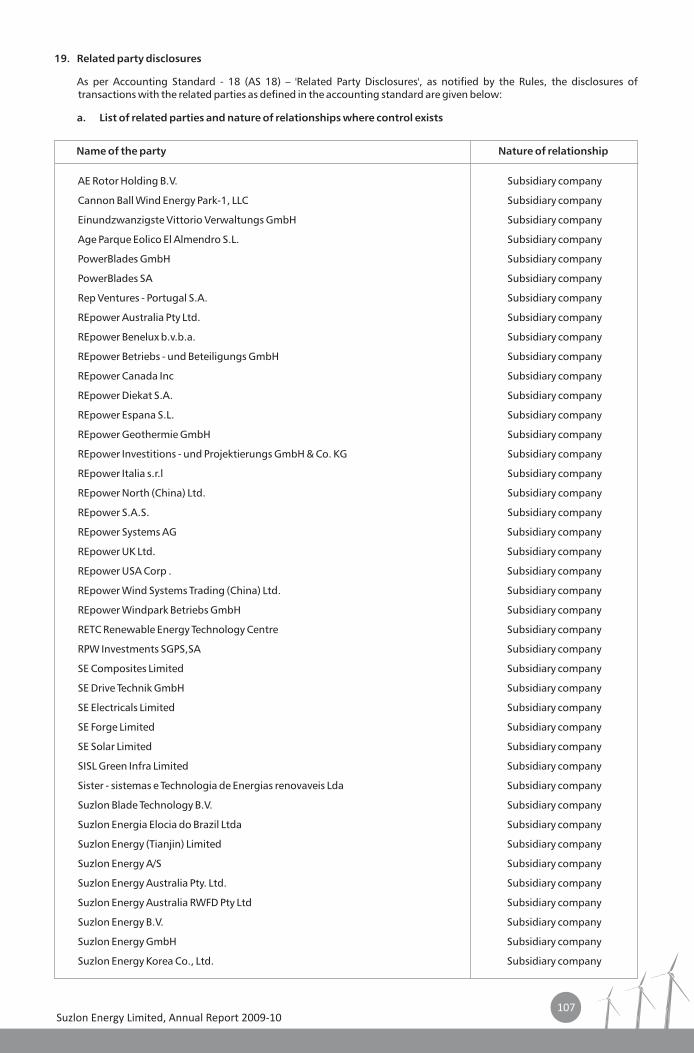
19. Related party disclosures
As per Accounting Standard - 18 (AS 18) – 'Related Party Disclosures', as notified by the Rules, the disclosures of transactions with the related parties as defined in the accounting standard are given below:
a. List of related parties and nature of relationships where control exists
AE Rotor Holding B.V. Subsidiary company
Cannon Ball Wind Energy Park-1, LLC Subsidiary company
Einundzwanzigste Vittorio Verwaltungs GmbH Subsidiary company
Age Parque Eolico El Almendro S.L. Subsidiary company
PowerBlades GmbH Subsidiary company
PowerBlades SA Subsidiary company
Rep Ventures - Portugal S.A. Subsidiary company
REpower Australia Pty Ltd. Subsidiary company
REpower Benelux b.v.b.a. Subsidiary company
REpower Betriebs - und Beteiligungs GmbH Subsidiary company
REpower Canada Inc Subsidiary company
REpower Diekat S.A. Subsidiary company
REpower Espana S.L. Subsidiary company
REpower Geothermie GmbH Subsidiary company
REpower Investitions - und Projektierungs GmbH & Co. KG Subsidiary company
REpower Italia s.r.l Subsidiary company
REpower North (China) Ltd. Subsidiary company
REpower S.A.S. Subsidiary company
REpower Systems AG Subsidiary company
REpower UK Ltd. Subsidiary company
REpower USA Corp . Subsidiary company
REpower Wind Systems Trading (China) Ltd. Subsidiary company
REpower Windpark Betriebs GmbH Subsidiary company
RETC Renewable Energy Technology Centre Subsidiary company
RPW Investments SGPS,SA Subsidiary company
SE Composites Limited Subsidiary company
SE Drive Technik GmbH Subsidiary company
SE Electricals Limited Subsidiary company
SE Forge Limited Subsidiary company
SE Solar Limited Subsidiary company
SISL Green Infra Limited Subsidiary company
Sister - sistemas e Technologia de Energias renovaveis Lda Subsidiary company
Suzlon Blade Technology B.V. Subsidiary company
Suzlon Energia Elocia do Brazil Ltda Subsidiary company
Suzlon Energy (Tianjin) Limited Subsidiary company
Suzlon Energy A/S Subsidiary company
Suzlon Energy Australia Pty. Ltd. Subsidiary company
Suzlon Energy Australia RWFD Pty Ltd Subsidiary company
Suzlon Energy B.V. Subsidiary company
Suzlon Energy GmbH Subsidiary company
Suzlon Energy Korea Co., Ltd. Subsidiary company
Name of the party Nature of relationship
107Suzlon Energy Limited, Annual Report 2009-10
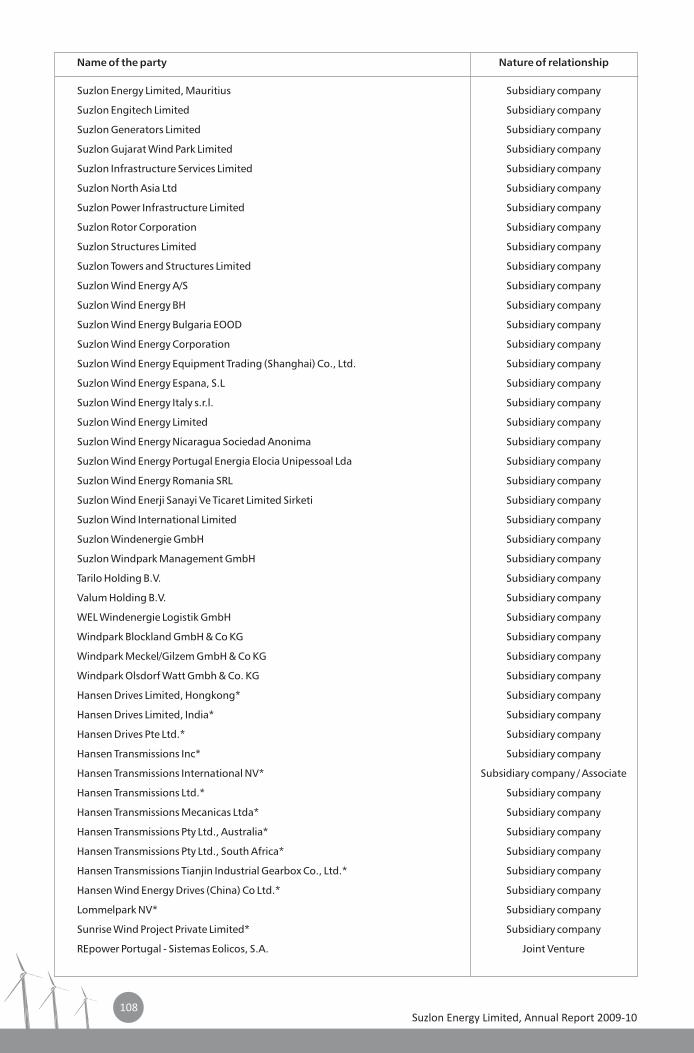
Name of the party Nature of relationship
Suzlon Energy Limited, Mauritius Subsidiary company
Suzlon Engitech Limited Subsidiary company
Suzlon Generators Limited Subsidiary company
Suzlon Gujarat Wind Park Limited Subsidiary company
Suzlon Infrastructure Services Limited Subsidiary company
Suzlon North Asia Ltd Subsidiary company
Suzlon Power Infrastructure Limited Subsidiary company
Suzlon Rotor Corporation Subsidiary company
Suzlon Structures Limited Subsidiary company
Suzlon Towers and Structures Limited Subsidiary company
Suzlon Wind Energy A/S Subsidiary company
Suzlon Wind Energy BH Subsidiary company
Suzlon Wind Energy Bulgaria EOOD Subsidiary company
Suzlon Wind Energy Corporation Subsidiary company
Suzlon Wind Energy Equipment Trading (Shanghai) Co., Ltd. Subsidiary company
Suzlon Wind Energy Espana, S.L Subsidiary company
Suzlon Wind Energy Italy s.r.l. Subsidiary company
Suzlon Wind Energy Limited Subsidiary company
Suzlon Wind Energy Nicaragua Sociedad Anonima Subsidiary company
Suzlon Wind Energy Portugal Energia Elocia Unipessoal Lda Subsidiary company
Suzlon Wind Energy Romania SRL Subsidiary company
Suzlon Wind Enerji Sanayi Ve Ticaret Limited Sirketi Subsidiary company
Suzlon Wind International Limited Subsidiary company
Suzlon Windenergie GmbH Subsidiary company
Suzlon Windpark Management GmbH Subsidiary company
Tarilo Holding B.V. Subsidiary company
Valum Holding B.V. Subsidiary company
WEL Windenergie Logistik GmbH Subsidiary company
Windpark Blockland GmbH & Co KG Subsidiary company
Windpark Meckel/Gilzem GmbH & Co KG Subsidiary company
Windpark Olsdorf Watt Gmbh & Co. KG Subsidiary company
Hansen Drives Limited, Hongkong* Subsidiary company
Hansen Drives Limited, India* Subsidiary company
Hansen Drives Pte Ltd.* Subsidiary company
Hansen Transmissions Inc* Subsidiary company
Hansen Transmissions International NV* Subsidiary company / Associate
Hansen Transmissions Ltd.* Subsidiary company
Hansen Transmissions Mecanicas Ltda* Subsidiary company
Hansen Transmissions Pty Ltd., Australia* Subsidiary company
Hansen Transmissions Pty Ltd., South Africa* Subsidiary company
Hansen Transmissions Tianjin Industrial Gearbox Co., Ltd.* Subsidiary company
Hansen Wind Energy Drives (China) Co Ltd.* Subsidiary company
Lommelpark NV* Subsidiary company
Sunrise Wind Project Private Limited* Subsidiary company
REpower Portugal - Sistemas Eolicos, S.A. Joint Venture
108Suzlon Energy Limited, Annual Report 2009-10
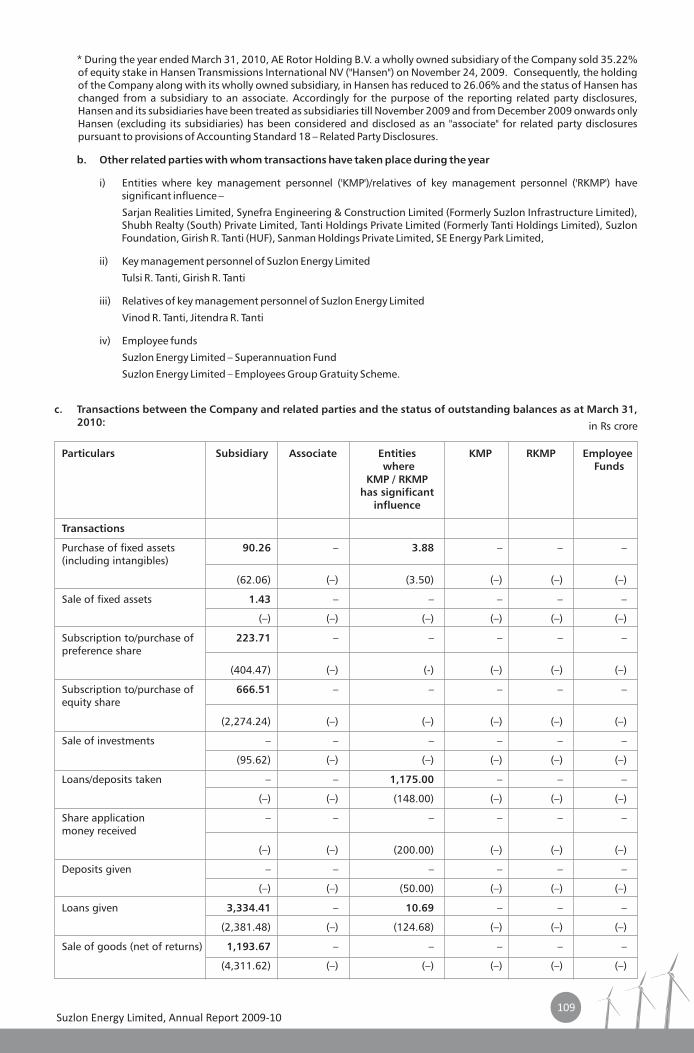
* During the year ended March 31, 2010, AE Rotor Holding B.V. a wholly owned subsidiary of the Company sold 35.22% of equity stake in Hansen Transmissions International NV ("Hansen") on November 24, 2009. Consequently, the holding of the Company along with its wholly owned subsidiary, in Hansen has reduced to 26.06% and the status of Hansen has changed from a subsidiary to an associate. Accordingly for the purpose of the reporting related party disclosures, Hansen and its subsidiaries have been treated as subsidiaries till November 2009 and from December 2009 onwards only Hansen (excluding its subsidiaries) has been considered and disclosed as an "associate" for related party disclosures pursuant to provisions of Accounting Standard 18 – Related Party Disclosures.
b. Other related parties with whom transactions have taken place during the year
i) Entities where key management personnel ('KMP')/relatives of key management personnel ('RKMP') have significant influence –
Sarjan Realities Limited, Synefra Engineering & Construction Limited (Formerly Suzlon Infrastructure Limited), Shubh Realty (South) Private Limited, Tanti Holdings Private Limited (Formerly Tanti Holdings Limited), Suzlon Foundation, Girish R. Tanti (HUF), Sanman Holdings Private Limited, SE Energy Park Limited,
ii) Key management personnel of Suzlon Energy Limited
Tulsi R. Tanti, Girish R. Tanti
iii) Relatives of key management personnel of Suzlon Energy Limited
Vinod R. Tanti, Jitendra R. Tanti
iv) Employee funds
Suzlon Energy Limited – Superannuation Fund
Suzlon Energy Limited – Employees Group Gratuity Scheme.
c. Transactions between the Company and related parties and the status of outstanding balances as at March 31, 2010:
Particulars Subsidiary Associate Entities where Funds
KMP / RKMPhas significant
influence
Transactions
Purchase of fixed assets 90.26 3.88(including intangibles)
(62.06) (–) (3.50) (–) (–) (–)
Sale of fixed assets 1.43 – – – – –
(–) (–) (–) (–) (–) (–)
Subscription to/purchase of 223.71 – – – – –preference share
(404.47) (–) (-) (–) (–) (–)
Subscription to/purchase of 666.51 – – – – –equity share
(2,274.24) (–) (–) (–) (–) (–)
Sale of investments – – – – – –
(95.62) (–) (–) (–) (–) (–)
Loans/deposits taken – – 1,175.00 – – –
(–) (–) (148.00) (–) (–) (–)
Share application – – – – – –money received
(–) (–) (200.00) (–) (–) (–)
Deposits given – – – – – –
(–) (–) (50.00) (–) (–) (–)
Loans given 3,334.41 – 10.69 – – –
(2,381.48) (–) (124.68) (–) (–) (–)
Sale of goods (net of returns) 1,193.67 – – – – –
(4,311.62) (–) (–) (–) (–) (–)
KMP RKMP Employee
– – – –
in Rs crore
109Suzlon Energy Limited, Annual Report 2009-10
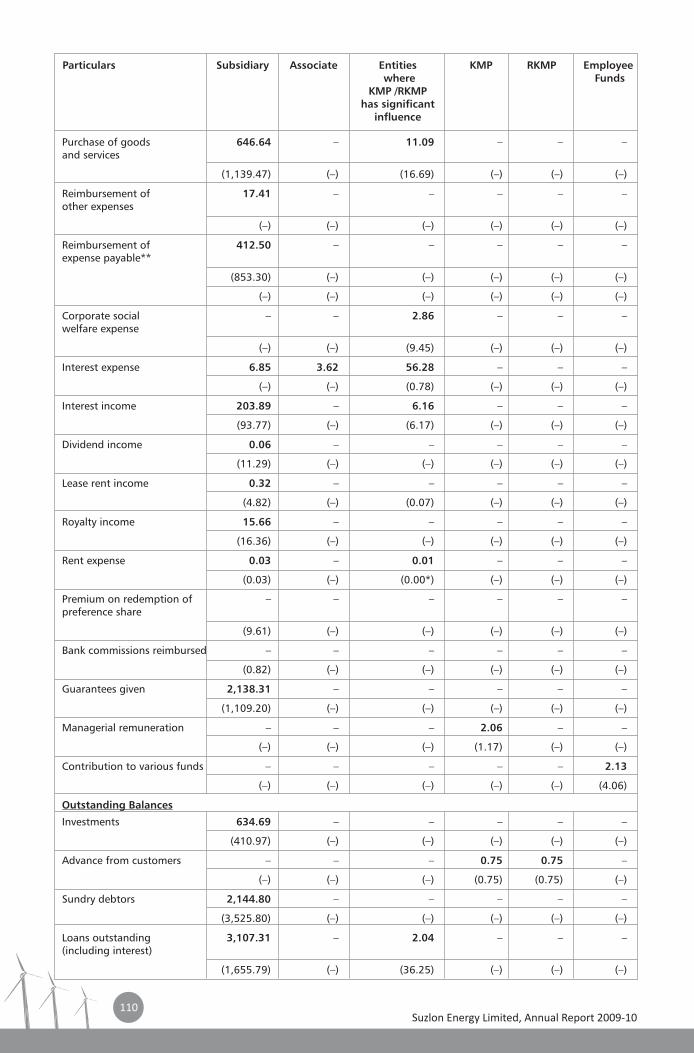
Purchase of goods 646.64 – 11.09 – – –and services
(1,139.47) (–) (16.69) (–) (–) (–)
Reimbursement of 17.41 – – – – –other expenses
(–) (–) (–) (–) (–) (–)
Reimbursement of 412.50 – – – – –expense payable**
(853.30) (–) (–) (–) (–) (–)
(–) (–) (–) (–) (–) (–)
Corporate social – – 2.86 – – –welfare expense
(–) (–) (9.45) (–) (–) (–)
Interest expense 6.85 3.62 56.28 – – –
(–) (–) (0.78) (–) (–) (–)
Interest income 203.89 – 6.16 – – –
(93.77) (–) (6.17) (–) (–) (–)
Dividend income 0.06 – – – – –
(11.29) (–) (–) (–) (–) (–)
Lease rent income 0.32 – – – – –
(4.82) (–) (0.07) (–) (–) (–)
Royalty income 15.66 – – – – –
(16.36) (–) (–) (–) (–) (–)
Rent expense 0.03 – 0.01 – – –
(0.03) (–) (0.00*) (–) (–) (–)
Premium on redemption of – – – – – –preference share
(9.61) (–) (–) (–) (–) (–)
Bank commissions reimbursed – – – – – –
(0.82) (–) (–) (–) (–) (–)
Guarantees given 2,138.31 – – – – –
(1,109.20) (–) (–) (–) (–) (–)
Managerial remuneration – – – 2.06 – –
(–) (–) (–) (1.17) (–) (–)
Contribution to various funds – – – – – 2.13
(–) (–) (–) (–) (–) (4.06)
Outstanding Balances
Investments 634.69 – – – – –
(410.97) (–) (–) (–) (–) (–)
Advance from customers – – – 0.75 0.75 –
(–) (–) (–) (0.75) (0.75) (–)
Sundry debtors 2,144.80 – – – – –
(3,525.80) (–) (–) (–) (–) (–)
Loans outstanding 3,107.31 – 2.04 – – –(including interest)
(1,655.79) (–) (36.25) (–) (–) (–)
Particulars Subsidiary Associate Entities KMP RKMP Employee where Funds
KMP /RKMPhas significant
influence
110Suzlon Energy Limited, Annual Report 2009-10
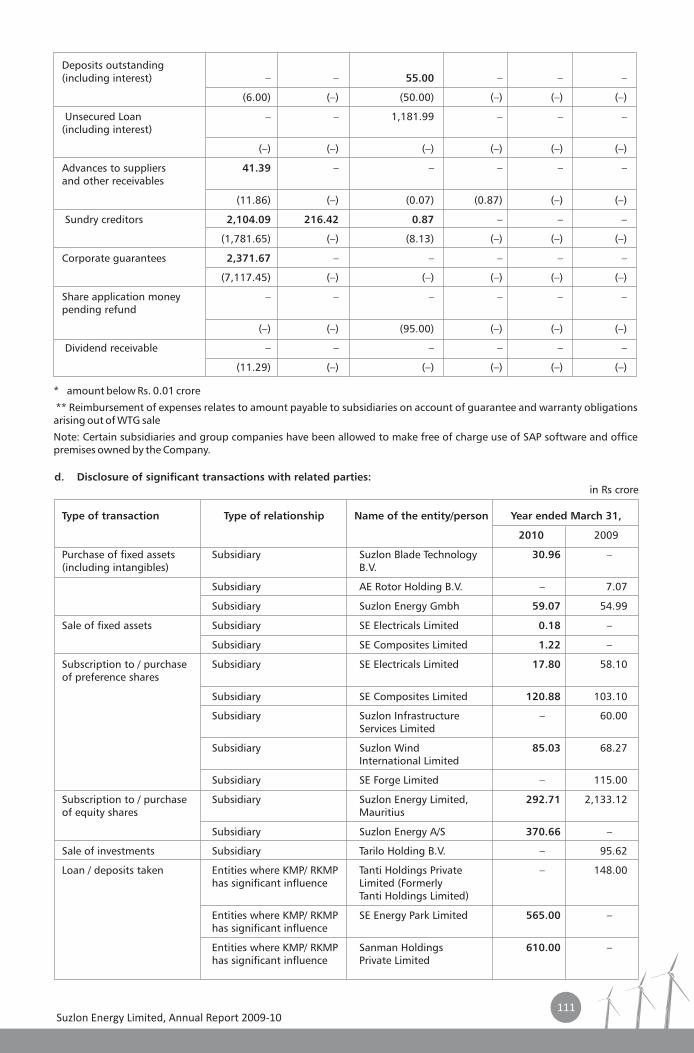
Deposits outstanding (including interest) – – 55.00 – – –
(6.00) (–) (50.00) (–) (–) (–)
Unsecured Loan – – 1,181.99 – – –(including interest)
(–) (–) (–) (–) (–) (–)
Advances to suppliers 41.39 – – – – –and other receivables
(11.86) (–) (0.07) (0.87) (–) (–)
Sundry creditors 2,104.09 216.42 0.87 – – –
(1,781.65) (–) (8.13) (–) (–) (–)
Corporate guarantees 2,371.67 – – – – –
(7,117.45) (–) (–) (–) (–) (–)
Share application money – – – – – –pending refund
(–) (–) (95.00) (–) (–) (–)
Dividend receivable – – – – – –
(11.29) (–) (–) (–) (–) (–)
* amount below Rs. 0.01 crore
** Reimbursement of expenses relates to amount payable to subsidiaries on account of guarantee and warranty obligations arising out of WTG sale
Note: Certain subsidiaries and group companies have been allowed to make free of charge use of SAP software and office premises owned by the Company.
d. Disclosure of significant transactions with related parties:
Type of transaction Type of relationship Name of the entity/person Year ended March 31,
2010 2009
Purchase of fixed assets Subsidiary Suzlon Blade Technology 30.96 –(including intangibles) B.V.
Subsidiary AE Rotor Holding B.V. – 7.07
Subsidiary Suzlon Energy Gmbh 59.07 54.99
Sale of fixed assets Subsidiary SE Electricals Limited 0.18 –
Subsidiary SE Composites Limited 1.22 –
Subscription to / purchase Subsidiary SE Electricals Limited 17.80 58.10of preference shares
Subsidiary SE Composites Limited 120.88 103.10
Subsidiary Suzlon Infrastructure – 60.00Services Limited
Subsidiary Suzlon Wind 85.03 68.27International Limited
Subsidiary SE Forge Limited – 115.00
Subscription to / purchase Subsidiary Suzlon Energy Limited, 292.71 2,133.12of equity shares Mauritius
Subsidiary Suzlon Energy A/S 370.66 –
Sale of investments Subsidiary Tarilo Holding B.V. – 95.62
Loan / deposits taken Entities where KMP/ RKMP Tanti Holdings Private – 148.00has significant influence Limited (Formerly
Tanti Holdings Limited)
Entities where KMP/ RKMP SE Energy Park Limited 565.00 –has significant influence
Entities where KMP/ RKMP Sanman Holdings 610.00 –has significant influence Private Limited
in Rs crore
111Suzlon Energy Limited, Annual Report 2009-10
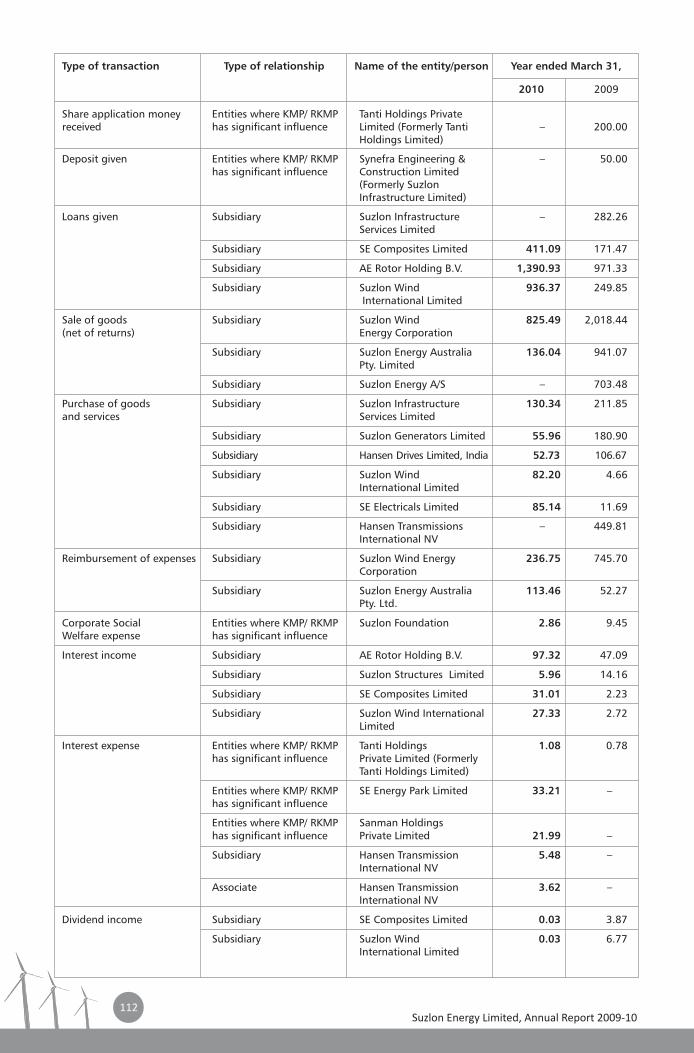
Type of transaction Type of relationship Name of the entity/person Year ended March 31,
2010 2009
Share application money received has significant influence Limited (Formerly Tanti – 200.00
Holdings Limited)
Deposit given Entities where KMP/ RKMP Synefra Engineering & – 50.00has significant influence Construction Limited
(Formerly Suzlon Infrastructure Limited)
Loans given Subsidiary Suzlon Infrastructure – 282.26Services Limited
Subsidiary SE Composites Limited 411.09 171.47
Subsidiary AE Rotor Holding B.V. 1,390.93 971.33
Subsidiary Suzlon Wind 936.37 249.85 International Limited
Sale of goods Subsidiary Suzlon Wind 825.49 2,018.44(net of returns) Energy Corporation
Subsidiary Suzlon Energy Australia 136.04 941.07Pty. Limited
Subsidiary Suzlon Energy A/S – 703.48
Purchase of goods Subsidiary Suzlon Infrastructure 130.34 211.85and services Services Limited
Subsidiary Suzlon Generators Limited 55.96 180.90
Subsidiary Hansen Drives Limited, India 52.73 106.67
Subsidiary Suzlon Wind 82.20 4.66International Limited
Subsidiary SE Electricals Limited 85.14 11.69
Subsidiary Hansen Transmissions – 449.81International NV
Reimbursement of expenses Subsidiary Suzlon Wind Energy 236.75 745.70Corporation
Subsidiary Suzlon Energy Australia 113.46 52.27Pty. Ltd.
Corporate Social Entities where KMP/ RKMP Suzlon Foundation 2.86 9.45Welfare expense has significant influence
Interest income Subsidiary AE Rotor Holding B.V. 97.32 47.09
Subsidiary Suzlon Structures Limited 5.96 14.16
Subsidiary SE Composites Limited 31.01 2.23
Subsidiary Suzlon Wind International 27.33 2.72Limited
Interest expense Entities where KMP/ RKMP Tanti Holdings 1.08 0.78has significant influence Private Limited (Formerly
Tanti Holdings Limited)
Entities where KMP/ RKMP SE Energy Park Limited 33.21 –has significant influence
Entities where KMP/ RKMP Sanman Holdings has significant influence Private Limited 21.99 –
Subsidiary Hansen Transmission 5.48 –International NV
Associate Hansen Transmission 3.62 –International NV
Dividend income Subsidiary SE Composites Limited 0.03 3.87
Subsidiary Suzlon Wind 0.03 6.77International Limited
Entities where KMP/ RKMP Tanti Holdings Private
112Suzlon Energy Limited, Annual Report 2009-10
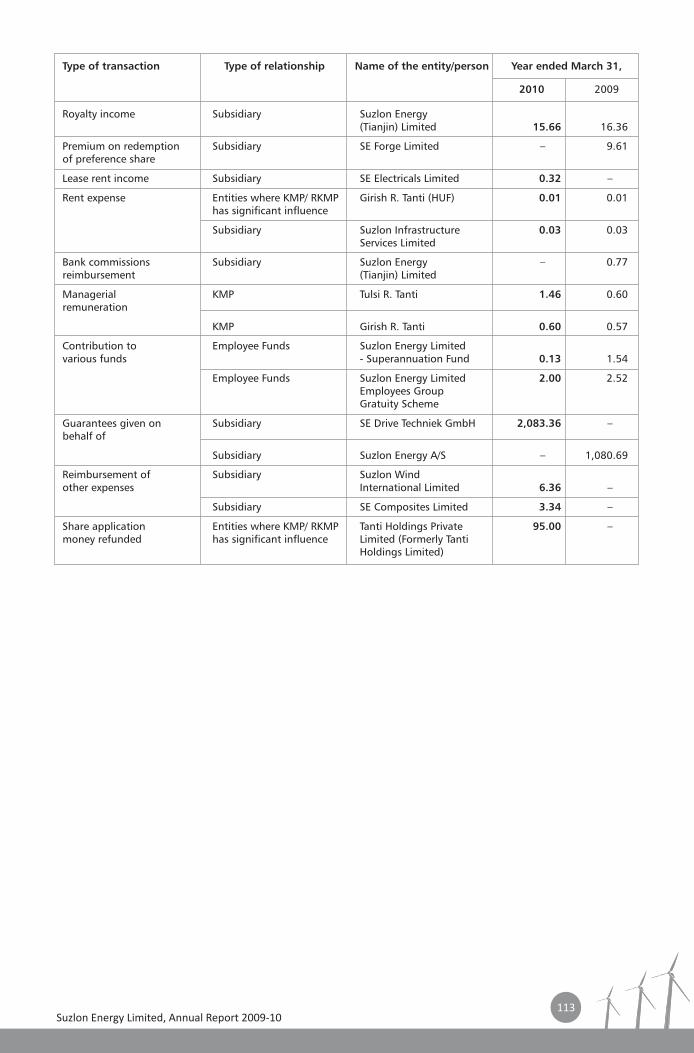
Type of transaction Type of relationship Name of the entity/person Year ended March 31,
2010 2009
Royalty income Subsidiary Suzlon Energy (Tianjin) Limited 15.66 16.36
Premium on redemption Subsidiary SE Forge Limited – 9.61of preference share
Lease rent income Subsidiary SE Electricals Limited 0.32 –
Rent expense Entities where KMP/ RKMP Girish R. Tanti (HUF) 0.01 0.01has significant influence
Subsidiary Suzlon Infrastructure 0.03 0.03Services Limited
Bank commissions Subsidiary Suzlon Energy – 0.77reimbursement (Tianjin) Limited
Managerial KMP Tulsi R. Tanti 1.46 0.60remuneration
KMP Girish R. Tanti 0.60 0.57
Contribution to Employee Funds Suzlon Energy Limited various funds - Superannuation Fund 0.13 1.54
Employee Funds Suzlon Energy Limited 2.00 2.52Employees GroupGratuity Scheme
Guarantees given on Subsidiary SE Drive Techniek GmbH 2,083.36 –behalf of
Subsidiary Suzlon Energy A/S – 1,080.69
Reimbursement of Subsidiary Suzlon Wind other expenses International Limited 6.36 –
Subsidiary SE Composites Limited 3.34 –
Share application Entities where KMP/ RKMP Tanti Holdings Private 95.00 –money refunded has significant influence Limited (Formerly Tanti
Holdings Limited)
113Suzlon Energy Limited, Annual Report 2009-10
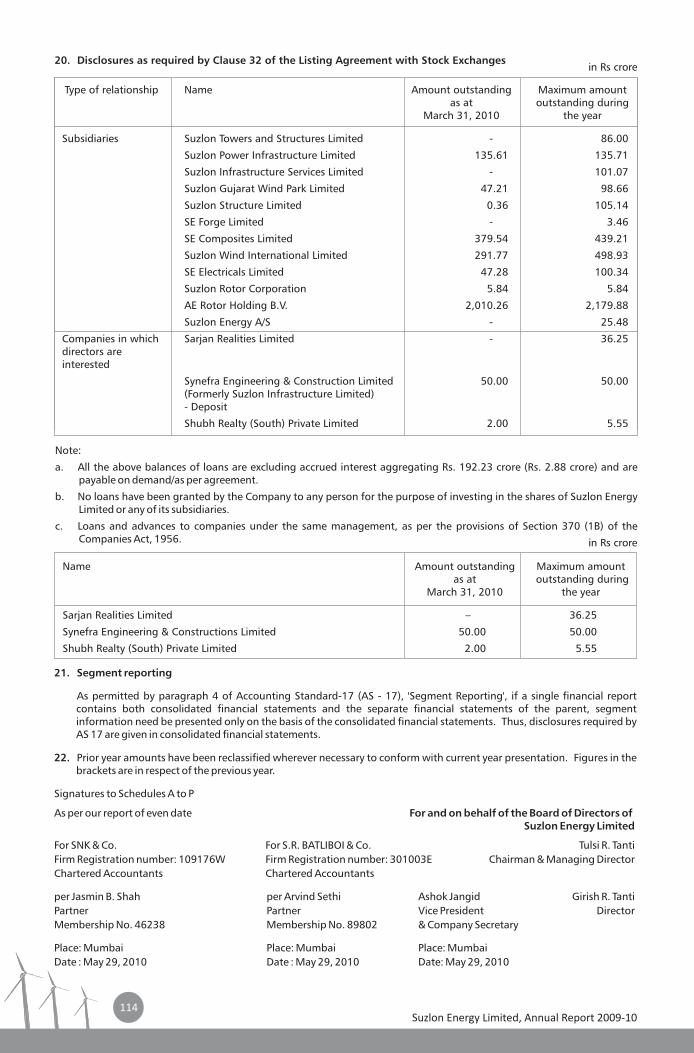
20. Disclosures as required by Clause 32 of the Listing Agreement with Stock Exchanges
Type of relationship Name Amount outstanding as at outstanding during
March 31, 2010 the year
Subsidiaries Suzlon Towers and Structures Limited - 86.00
Suzlon Power Infrastructure Limited 135.61 135.71
Suzlon Infrastructure Services Limited - 101.07
Suzlon Gujarat Wind Park Limited 47.21 98.66
Suzlon Structure Limited 0.36 105.14
SE Forge Limited - 3.46
SE Composites Limited 379.54 439.21
Suzlon Wind International Limited 291.77 498.93
SE Electricals Limited 47.28 100.34
Suzlon Rotor Corporation 5.84 5.84
AE Rotor Holding B.V. 2,010.26 2,179.88
Suzlon Energy A/S - 25.48
Companies in which Sarjan Realities Limited - 36.25directors are interested
Synefra Engineering & Construction Limited 50.00 50.00(Formerly Suzlon Infrastructure Limited) - Deposit
Shubh Realty (South) Private Limited 2.00 5.55
Maximum amount
Note:
a. All the above balances of loans are excluding accrued interest aggregating Rs. 192.23 crore (Rs. 2.88 crore) and are payable on demand/as per agreement.
b. No loans have been granted by the Company to any person for the purpose of investing in the shares of Suzlon Energy Limited or any of its subsidiaries.
c. Loans and advances to companies under the same management, as per the provisions of Section 370 (1B) of the Companies Act, 1956.
Name Amount outstanding as at outstanding during
March 31, 2010 the year
Sarjan Realities Limited – 36.25
Synefra Engineering & Constructions Limited 50.00 50.00
Shubh Realty (South) Private Limited 2.00 5.55
Maximum amount
21. Segment reporting
As permitted by paragraph 4 of Accounting Standard-17 (AS - 17), 'Segment Reporting', if a single financial report contains both consolidated financial statements and the separate financial statements of the parent, segment information need be presented only on the basis of the consolidated financial statements. Thus, disclosures required by AS 17 are given in consolidated financial statements.
22. Prior year amounts have been reclassified wherever necessary to conform with current year presentation. Figures in the brackets are in respect of the previous year.
Signatures to Schedules A to P
As per our report of even date For and on behalf of the Board of Directors ofSuzlon Energy Limited
For SNK & Co. For S.R. BATLIBOI & Co. Tulsi R. TantiFirm Registration number: 109176W Firm Registration number: 301003E Chairman & Managing DirectorChartered Accountants Chartered Accountants
per Jasmin B. Shah per Arvind Sethi Ashok Jangid Girish R. TantiPartner Partner Vice President DirectorMembership No. 46238 Membership No. 89802 & Company Secretary
Place: Mumbai Place: Mumbai Place: MumbaiDate : May 29, 2010 Date : May 29, 2010 Date: May 29, 2010
in Rs crore
in Rs crore
114Suzlon Energy Limited, Annual Report 2009-10
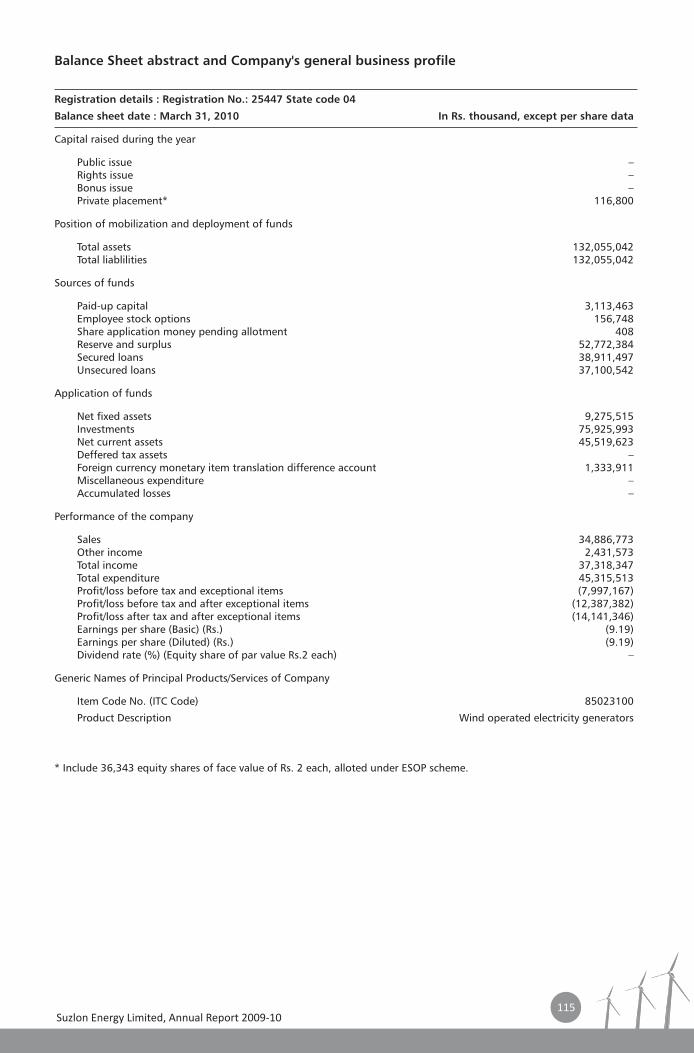
Balance Sheet abstract and Company's general business profile
Registration details : Registration No.: 25447 State code 04
Balance sheet date : March 31, 2010 In Rs. thousand, except per share data
Capital raised during the year
Public issue – Rights issue – Bonus issue – Private placement* 116,800
Position of mobilization and deployment of funds
Total assets 132,055,042 Total liablilities 132,055,042
Sources of funds
Paid-up capital 3,113,463 Employee stock options 156,748 Share application money pending allotment 408 Reserve and surplus 52,772,384 Secured loans 38,911,497 Unsecured loans 37,100,542
Application of funds
Net fixed assets 9,275,515 Investments 75,925,993 Net current assets 45,519,623 Deffered tax assets – Foreign currency monetary item translation difference account 1,333,911 Miscellaneous expenditure – Accumulated losses –
Performance of the company
Sales 34,886,773 Other income 2,431,573 Total income 37,318,347 Total expenditure 45,315,513 Profit/loss before tax and exceptional items (7,997,167)Profit/loss before tax and after exceptional items (12,387,382)Profit/loss after tax and after exceptional items (14,141,346)Earnings per share (Basic) (Rs.) (9.19)Earnings per share (Diluted) (Rs.) (9.19)Dividend rate (%) (Equity share of par value Rs.2 each) –
Generic Names of Principal Products/Services of Company
Item Code No. (ITC Code) 85023100
Product Description Wind operated electricity generators
* Include 36,343 equity shares of face value of Rs. 2 each, alloted under ESOP scheme.
115Suzlon Energy Limited, Annual Report 2009-10
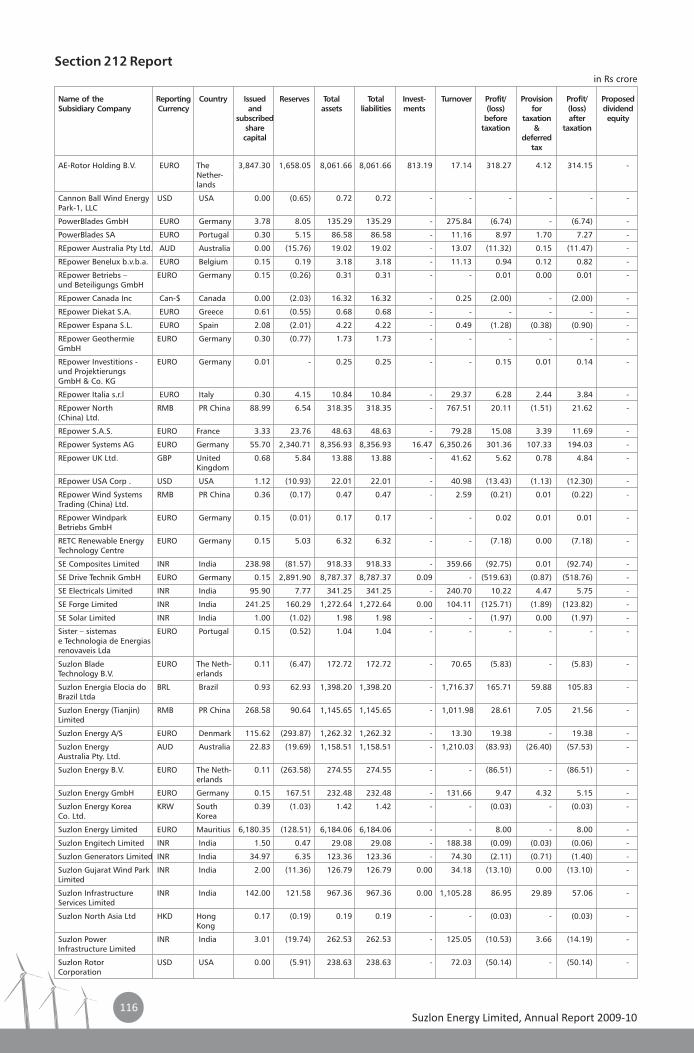
AE-Rotor Holding B.V. EURO The Nether-lands
Cannon Ball Wind Energy USD USA 0.00 (0.65) 0.72 0.72 - - - - - - Park-1, LLC
PowerBlades GmbH EURO Germany 3.78 8.05 135.29 135.29 - 275.84 (6.74) - (6.74) -
PowerBlades SA EURO Portugal 0.30 5.15 86.58 86.58 - 11.16 8.97 1.70 7.27 -
REpower Australia Pty Ltd. AUD Australia 0.00 (15.76) 19.02 19.02 - 13.07 (11.32) 0.15 (11.47) -
REpower Benelux b.v.b.a. EURO Belgium 0.15 0.19 3.18 3.18 - 11.13 0.94 0.12 0.82 -
REpower Betriebs – EURO Germany 0.15 (0.26) 0.31 0.31 - - 0.01 0.00 0.01 - und Beteiligungs GmbH
REpower Canada Inc Can-$ Canada 0.00 (2.03) 16.32 16.32 - 0.25 (2.00) - (2.00) -
REpower Diekat S.A. EURO Greece 0.61 (0.55) 0.68 0.68 - - - - - -
REpower Espana S.L. EURO Spain 2.08 (2.01) 4.22 4.22 - 0.49 (1.28) (0.38) (0.90) -
REpower Geothermie EURO Germany 0.30 (0.77) 1.73 1.73 - - - - - - GmbH
REpower Investitions - EURO Germany 0.01 - 0.25 0.25 - - 0.15 0.01 0.14 - und Projektierungs GmbH & Co. KG
REpower Italia s.r.l EURO Italy 0.30 4.15 10.84 10.84 - 29.37 6.28 2.44 3.84 -
REpower North RMB PR China 88.99 6.54 318.35 318.35 - 767.51 20.11 (1.51) 21.62 - (China) Ltd.
REpower S.A.S. EURO France 3.33 23.76 48.63 48.63 - 79.28 15.08 3.39 11.69 -
REpower Systems AG EURO Germany 55.70 2,340.71 8,356.93 8,356.93 16.47 6,350.26 301.36 107.33 194.03 -
REpower UK Ltd. GBP United 0.68 5.84 13.88 13.88 - 41.62 5.62 0.78 4.84 - Kingdom
REpower USA Corp . USD USA 1.12 (10.93) 22.01 22.01 - 40.98 (13.43) (1.13) (12.30) -
REpower Wind Systems RMB PR China 0.36 (0.17) 0.47 0.47 - 2.59 (0.21) 0.01 (0.22) - Trading (China) Ltd.
REpower Windpark EURO Germany 0.15 (0.01) 0.17 0.17 - - 0.02 0.01 0.01 - Betriebs GmbH
RETC Renewable Energy EURO Germany 0.15 5.03 6.32 6.32 - - (7.18) 0.00 (7.18) - Technology Centre
SE Composites Limited INR India 238.98 (81.57) 918.33 918.33 - 359.66 (92.75) 0.01 (92.74) -
SE Drive Technik GmbH EURO Germany 0.15 2,891.90 8,787.37 8,787.37 0.09 - (519.63) (0.87) (518.76) -
SE Electricals Limited INR India 95.90 7.77 341.25 341.25 - 240.70 10.22 4.47 5.75 -
SE Forge Limited INR India 241.25 160.29 1,272.64 1,272.64 0.00 104.11 (125.71) (1.89) (123.82) -
SE Solar Limited INR India 1.00 (1.02) 1.98 1.98 - - (1.97) 0.00 (1.97) -
Sister – sistemas EURO Portugal 0.15 (0.52) 1.04 1.04 - - - - - - e Technologia de Energias renovaveis Lda
Suzlon Blade EURO The Neth- 0.11 (6.47) 172.72 172.72 - 70.65 (5.83) - (5.83) - Technology B.V. erlands
Suzlon Energia Elocia do BRL Brazil 0.93 62.93 1,398.20 1,398.20 - 1,716.37 165.71 59.88 105.83 - Brazil Ltda
Suzlon Energy (Tianjin) RMB PR China 268.58 90.64 1,145.65 1,145.65 - 1,011.98 28.61 7.05 21.56 - Limited
Suzlon Energy A/S EURO Denmark 115.62 (293.87) 1,262.32 1,262.32 - 13.30 19.38 - 19.38 -
Suzlon Energy AUD Australia 22.83 (19.69) 1,158.51 1,158.51 - 1,210.03 (83.93) (26.40) (57.53) - Australia Pty. Ltd.
Suzlon Energy B.V. EURO The Neth- 0.11 (263.58) 274.55 274.55 - - (86.51) - (86.51) - erlands
Suzlon Energy GmbH EURO Germany 0.15 167.51 232.48 232.48 - 131.66 9.47 4.32 5.15 -
Suzlon Energy Korea KRW South 0.39 (1.03) 1.42 1.42 - - (0.03) - (0.03) - Co. Ltd. Korea
Suzlon Energy Limited EURO Mauritius 6,180.35 (128.51) 6,184.06 6,184.06 - - 8.00 - 8.00 -
Suzlon Engitech Limited INR India 1.50 0.47 29.08 29.08 - 188.38 (0.09) (0.03) (0.06) -
Suzlon Generators Limited INR India 34.97 6.35 123.36 123.36 - 74.30 (2.11) (0.71) (1.40) -
Suzlon Gujarat Wind Park INR India 2.00 (11.36) 126.79 126.79 0.00 34.18 (13.10) 0.00 (13.10) - Limited
Suzlon Infrastructure INR India 142.00 121.58 967.36 967.36 0.00 1,105.28 86.95 29.89 57.06 - Services Limited
Suzlon North Asia Ltd HKD Hong 0.17 (0.19) 0.19 0.19 - - (0.03) - (0.03) - Kong
Suzlon Power INR India 3.01 (19.74) 262.53 262.53 - 125.05 (10.53) 3.66 (14.19) - Infrastructure Limited
Suzlon Rotor USD USA 0.00 (5.91) 238.63 238.63 - 72.03 (50.14) - (50.14) - Corporation
3,847.30 1,658.05 8,061.66 8,061.66 813.19 17.14 318.27 4.12 314.15 -
Name of the Subsidiary Company Currency and assets liabilities ments (loss) for (loss) dividend
subscribed before taxation after equityshare taxation & taxationcapital deferred
tax
Reporting Country Issued Reserves Total Total Invest- Turnover Profit/ Provision Profit/ Proposed
Section 212 Reportin R s crore
Suzlon Energy Limited, Annual Report 2009-10116
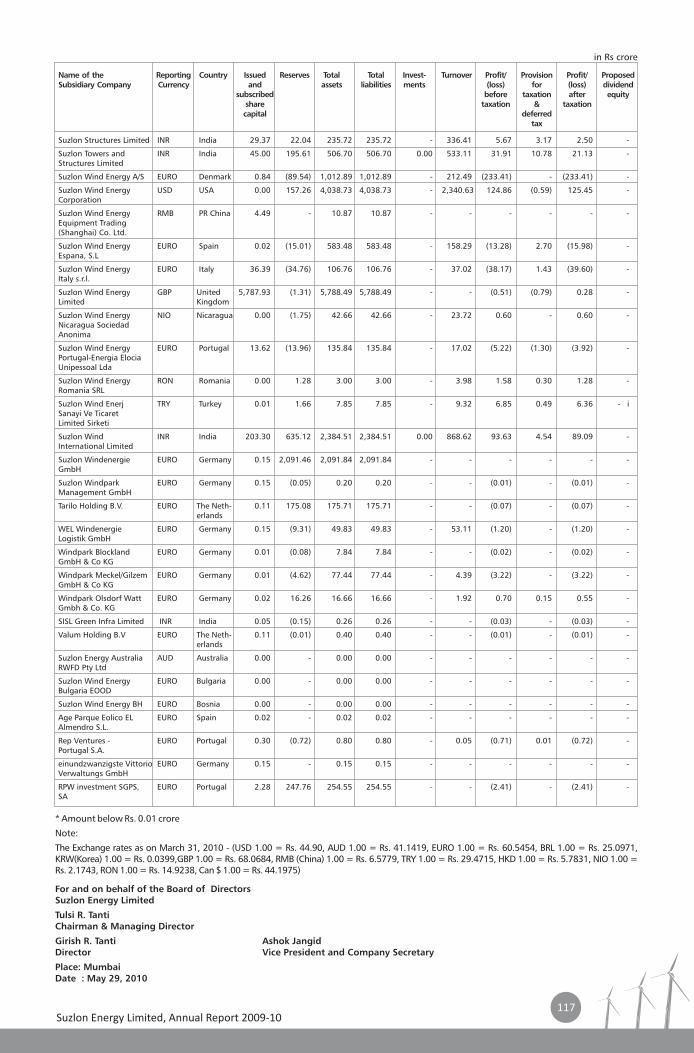
For and on behalf of the Board of DirectorsSuzlon Energy Limited
Tulsi R. TantiChairman & Managing Director
Girish R. Tanti Ashok JangidDirector Vice President and Company Secretary
Place: MumbaiDate : May 29, 2010
Suzlon Structures Limited INR India 29.37 22.04 235.72 235.72 - 336.41 5.67 3.17 2.50 -
Suzlon Towers and INR India 45.00 195.61 506.70 506.70 0.00 533.11 31.91 10.78 21.13 - Structures Limited
Suzlon Wind Energy A/S EURO Denmark 0.84 (89.54) 1,012.89 1,012.89 - 212.49 (233.41) - (233.41) -
Suzlon Wind Energy USD USA 0.00 157.26 4,038.73 4,038.73 - 2,340.63 124.86 (0.59) 125.45 - Corporation
Suzlon Wind Energy RMB PR China 4.49 - 10.87 10.87 - - - - - - Equipment Trading (Shanghai) Co. Ltd.
Suzlon Wind Energy EURO Spain 0.02 (15.01) 583.48 583.48 - 158.29 (13.28) 2.70 (15.98) - Espana, S.L
Suzlon Wind Energy EURO Italy 36.39 (34.76) 106.76 106.76 - 37.02 (38.17) 1.43 (39.60) - Italy s.r.l.
Suzlon Wind Energy GBP United 5,787.93 (1.31) 5,788.49 5,788.49 - - (0.51) (0.79) 0.28 - Limited Kingdom
Suzlon Wind Energy NIO Nicaragua 0.00 (1.75) 42.66 42.66 - 23.72 0.60 - 0.60 - Nicaragua Sociedad Anonima
Suzlon Wind Energy EURO Portugal 13.62 (13.96) 135.84 135.84 - 17.02 (5.22) (1.30) (3.92) - Portugal-Energia Elocia Unipessoal Lda
Suzlon Wind Energy RON Romania 0.00 1.28 3.00 3.00 - 3.98 1.58 0.30 1.28 - Romania SRL
Suzlon Wind Enerj TRY Turkey 0.01 1.66 7.85 7.85 - 9.32 6.85 0.49 6.36 - i Sanayi Ve Ticaret Limited Sirketi
Suzlon Wind INR India 203.30 635.12 2,384.51 2,384.51 0.00 868.62 93.63 4.54 89.09 - International Limited
Suzlon Windenergie EURO Germany 0.15 2,091.46 2,091.84 2,091.84 - - - - - - GmbH
Suzlon Windpark EURO Germany 0.15 (0.05) 0.20 0.20 - - (0.01) - (0.01) - Management GmbH
Tarilo Holding B.V. EURO The Neth- 0.11 175.08 175.71 175.71 - - (0.07) - (0.07) - erlands
WEL Windenergie EURO Germany 0.15 (9.31) 49.83 49.83 - 53.11 (1.20) - (1.20) - Logistik GmbH
Windpark Blockland EURO Germany 0.01 (0.08) 7.84 7.84 - - (0.02) - (0.02) - GmbH & Co KG
Windpark Meckel/Gilzem EURO Germany 0.01 (4.62) 77.44 77.44 - 4.39 (3.22) - (3.22) - GmbH & Co KG
Windpark Olsdorf Watt EURO Germany 0.02 16.26 16.66 16.66 - 1.92 0.70 0.15 0.55 - Gmbh & Co. KG
SISL Green Infra Limited INR India 0.05 (0.15) 0.26 0.26 - - (0.03) - (0.03) -
Valum Holding B.V EURO The Neth- 0.11 (0.01) 0.40 0.40 - - (0.01) - (0.01) - erlands
Suzlon Energy Australia AUD Australia 0.00 - 0.00 0.00 - - - - - - RWFD Pty Ltd
Suzlon Wind Energy EURO Bulgaria 0.00 - 0.00 0.00 - - - - - - Bulgaria EOOD
Suzlon Wind Energy BH EURO Bosnia 0.00 - 0.00 0.00 - - - - - -
Age Parque Eolico EL EURO Spain 0.02 - 0.02 0.02 - - - - - - Almendro S.L.
Rep Ventures - EURO Portugal 0.30 (0.72) 0.80 0.80 - 0.05 (0.71) 0.01 (0.72) - Portugal S.A.
einundzwanzigste Vittorio EURO Germany 0.15 - 0.15 0.15 - - - - - - Verwaltungs GmbH
RPW investment SGPS, EURO Portugal 2.28 247.76 254.55 254.55 - - (2.41) - (2.41) -SA
Name of the Subsidiary Company Currency and assets liabilities ments (loss) for (loss) dividend
subscribed before taxation after equityshare taxation & taxationcapital deferred
tax
Reporting Country Issued Reserves Total Total Invest- Turnover Profit/ Provision Profit/ Proposed
* Amount below Rs. 0.01 crore
Note:
The Exchange rates as on March 31, 2010 - (USD 1.00 = Rs. 44.90, AUD 1.00 = Rs. 41.1419, EURO 1.00 = Rs. 60.5454, BRL 1.00 = Rs. 25.0971, KRW(Korea) 1.00 = Rs. 0.0399,GBP 1.00 = Rs. 68.0684, RMB (China) 1.00 = Rs. 6.5779, TRY 1.00 = Rs. 29.4715, HKD 1.00 = Rs. 5.7831, NIO 1.00 = Rs. 2.1743, RON 1.00 = Rs. 14.9238, Can $ 1.00 = Rs. 44.1975)
in Rs crore
Suzlon Energy Limited, Annual Report 2009-10117

CONSOLIDATED Financial
Statements
119
Auditor's Report on Consolidated Financial Statements
To
The Board of Directors of Suzlon Energy Limited
1. We SNK & Co. and S. R. Batliboi & Co. have audited the attached consolidated balance sheet of Suzlon Energy Limited ('SEL' or the 'Company') and its subsidiaries as described in Schedule Q, Note II (1), its associate as described in Schedule Q, Note II (3) and joint venture as described in Schedule Q, Note II (2) (together referred to as the 'Group') as at March 31, 2010, and also the consolidated profit and loss account and the consolidated cash flow statement for the year ended on that date annexed thereto ("Consolidated Financial Statements"). These Consolidated Financial Statements are the responsibility of SEL's management and have been prepared by management on the basis of separate financial statements and other financial information regarding components. Our responsibility is to express an opinion on these Consolidated Financial Statements based on our audit.
2. We conducted our audit in accordance with the auditing standards generally accepted in India. Those Standards require that we plan and perform the audit to obtain reasonable assurance about whether the financial statements are free of material misstatement. An audit includes examining, on a test basis, evidence supporting the amounts and disclosures in the Consolidated Financial Statements. An audit also includes assessing the accounting principles used and significant estimates made by management, as well as evaluating the overall consolidated financial statement presentation. We believe that our audit provides a reasonable basis for our opinion.
3. We did not audit the financial statements of certain subsidiaries, whose audited financial statements, reflect Group's share of total assets of Rs. 850.42 crore as at March 31, 2010, Group's share of total revenues of Rs. 1,103.52 crore and Group's share of total cash flows of Rs. 54.58 crore for the year then ended. These financial statements and other financial information have been audited solely by SNK & Co. on which, S. R. Batliboi & Co. has placed reliance for the purpose of this report.
4. We did not audit the financial statements of certain subsidiaries, whose audited financial statements, reflect Group's share of total assets of Rs. 1,316.54 crore as at March 31, 2010, Group's share of total revenues of Rs. 2,669.63 crore and Group's share of total cash flows of Rs. (220.97) crore for the year then ended. These financial statements and other financial information have been audited solely by S. R. Batliboi & Co. on which, SNK & Co. has placed reliance for the purpose of this report.
5. We did not audit the financial statements of certain subsidiaries, whose audited financial statements, reflect Group's share of total assets of Rs. 36,196.86 crore as at March 31, 2010, Group's share of the total revenue of Rs. 14,387.18 crore and Group's share of total cash flows amounting to Rs. (457.11) crore for the year then ended. These financial statements and other financial information have been audited by other auditors whose reports have been furnished to us, and our opinion is based solely on the report of other auditors.
These financial statements include the audited financial statements of subsidiaries, having Group's share of total assets of Rs. 32,257.44 crore as at March 31, 2010, Group's share of total revenues of Rs. 5,820.92 crore and Group's share of total cash flows amounting to Rs. (1,060.63) crore for the year then ended, which have been audited by member firms of Ernst & Young Global in the relevant countries and whose reports have been furnished to us, and our opinion is based solely on their reports.
These financial statements audited by member firms of Ernst & Young Global include the audited financial statements of Hansen Transmissions International N.V., having Group's share of total assets of Rs. Nil as at March 31, 2010, Group's share of total revenues of Rs. 2,656.12 crore, Group's share of total cash flows amounting to Rs. ( 853.43) crore and Group's share of profit of Rs. 0.77 crore for the year then ended, which have been audited by member firm of Ernst & Young Global and whose reports have been furnished to us, and our opinion is based solely on their report. Hansen Transmissions International N.V. has been consolidated as a subsidiary till November 30, 2009 and consolidated as an associate under equity method from December 1, 2009 to March 31, 2010.
6. We did not audit the financial statements of certain subsidiaries, whose financial statements, reflect Group's share of total assets of Rs. 198.58 crore as at March 31, 2010, Group's share of total revenues of Rs. 382.86 crore and Group's share of total cash flows amounting to Rs. 43.77 crore for the year then ended. These financial statements and other financial information have been certified by management and our opinion is based solely on these management certified accounts.
7. Without qualifying our opinion, we draw attention to Schedule Q, Note 7(d) regarding non-provision of proportionate premium on redemption of USD 479.04 million (Rs. 2,150 crore as at March 31, 2010) Foreign Currency Convertible Bonds amounting to Rs. 377.22 crore which has been considered by the Group as a contingent liability. Since the ultimate outcome of the matter cannot be presently ascertained, no provision for the above liability that may result in future, has been made in the accompanying financial statements.
8. Without qualifying our opinion, we draw attention to Schedule Q, Note 9 of the consolidated financial statements. The Indian Wind Energy Association ('InWEA) of which the Company is a member has filed a civil appeal in the Supreme Court against an order of the Appellate Tribunal for Electricity in regard to levy of Infrastructure Development Charges by Tamil Nadu State Electricity Board. The ultimate outcome of this matter cannot be presently ascertained due to it being highly technical and legalistic in nature. The Group has obtained a legal opinion which states that the InWEA/Group has a strong case and we have placed reliance on this opinion.
Suzlon Energy Limited, Annual Report 2009-10119
120
9. We report that the consolidated financial statements have been prepared by SEL's management in accordance with the requirements of Accounting Standards (AS) 21, Consolidated Financial Statements, Accounting Standards (AS) 23, Accounting for Investments in Associates in Consolidated Financial Statements and Accounting Standard (AS) 27, Financial Reporting of Interests in Joint Ventures notified pursuant to the Companies (Accounting Standards) Rules, 2006.
10. Based on our audit and on consideration of reports of other auditors on separate financial statements and on the other financial information of the components, and to the best of our information and according to the explanations given to us, we are of the opinion that the attached consolidated financial statements give a true and fair view in conformity with the accounting principles generally accepted in India:
(a) in the case of the consolidated balance sheet, of the state of affairs of the Group as at March 31, 2010;
(b) in the case of the consolidated profit and loss account, of the loss for the year ended on that date; and
(c) in the case of the consolidated cash flow statement, of the cash flows for the year ended on that date.
For SNK & Co For S. R. Batliboi & CoFirm registration number: 109176W Firm registration number: 301003EChartered Accountants Chartered Accountants
per Jasmin B. Shah per Arvind SethiPartner PartnerMembership No. 46238 Membership No. 89802
Place: Mumbai Place: MumbaiDate: May 29, 2010 Date: May 29, 2010
136Suzlon Energy Limited, Annual Report 2009-10
120
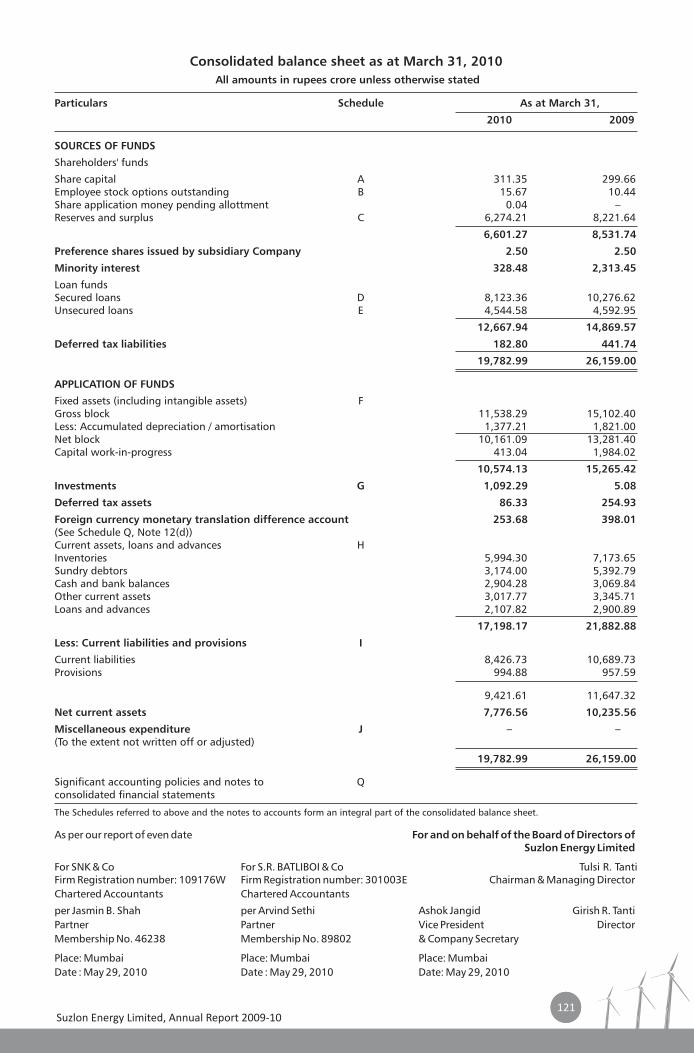
121
Consolidated balance sheet as at March 31, 2010
All amounts in rupees crore unless otherwise stated
Particulars Schedule As at March 31,
2010 2009
SOURCES OF FUNDS
Shareholders' funds
Share capital A 311.35 299.66 Employee stock options outstanding B 15.67 10.44 Share application money pending allottment 0.04 – Reserves and surplus C 6,274.21 8,221.64
6,601.27 8,531.74
Preference shares issued by subsidiary Company 2.50 2.50
Minority interest 328.48 2,313.45
Loan fundsSecured loans D 8,123.36 10,276.62 Unsecured loans E 4,544.58 4,592.95
12,667.94 14,869.57
Deferred tax liabilities 182.80 441.74
19,782.99 26,159.00
APPLICATION OF FUNDS
Fixed assets (including intangible assets) FGross block 11,538.29 15,102.40 Less: Accumulated depreciation / amortisation 1,377.21 1,821.00 Net block 10,161.09 13,281.40 Capital work-in-progress 413.04 1,984.02
10,574.13 15,265.42
Investments G 1,092.29 5.08
Deferred tax assets 86.33 254.93
Foreign currency monetary translation difference account 253.68 398.01 (See Schedule Q, Note 12(d))Current assets, loans and advances HInventories 5,994.30 7,173.65 Sundry debtors 3,174.00 5,392.79 Cash and bank balances 2,904.28 3,069.84 Other current assets 3,017.77 3,345.71 Loans and advances 2,107.82 2,900.89
17,198.17 21,882.88
Less: Current liabilities and provisions I
Current liabilities 8,426.73 10,689.73 Provisions 994.88 957.59
9,421.61 11,647.32
Net current assets 7,776.56 10,235.56
Miscellaneous expenditure J – – (To the extent not written off or adjusted)
19,782.99 26,159.00
Significant accounting policies and notes to Qconsolidated financial statements
The Schedules referred to above and the notes to accounts form an integral part of the consolidated balance sheet.
As per our report of even date For and on behalf of the Board of Directors ofSuzlon Energy Limited
For SNK & Co For S.R. BATLIBOI & Co Tulsi R. TantiFirm Registration number: 109176W Firm Registration number: 301003E Chairman & Managing DirectorChartered Accountants Chartered Accountants
per Jasmin B. Shah per Arvind Sethi Ashok Jangid Girish R. TantiPartner Partner Vice President DirectorMembership No. 46238 Membership No. 89802 & Company Secretary
Place: Mumbai Place: Mumbai Place: MumbaiDate : May 29, 2010 Date : May 29, 2010 Date: May 29, 2010
Suzlon Energy Limited, Annual Report 2009-10121
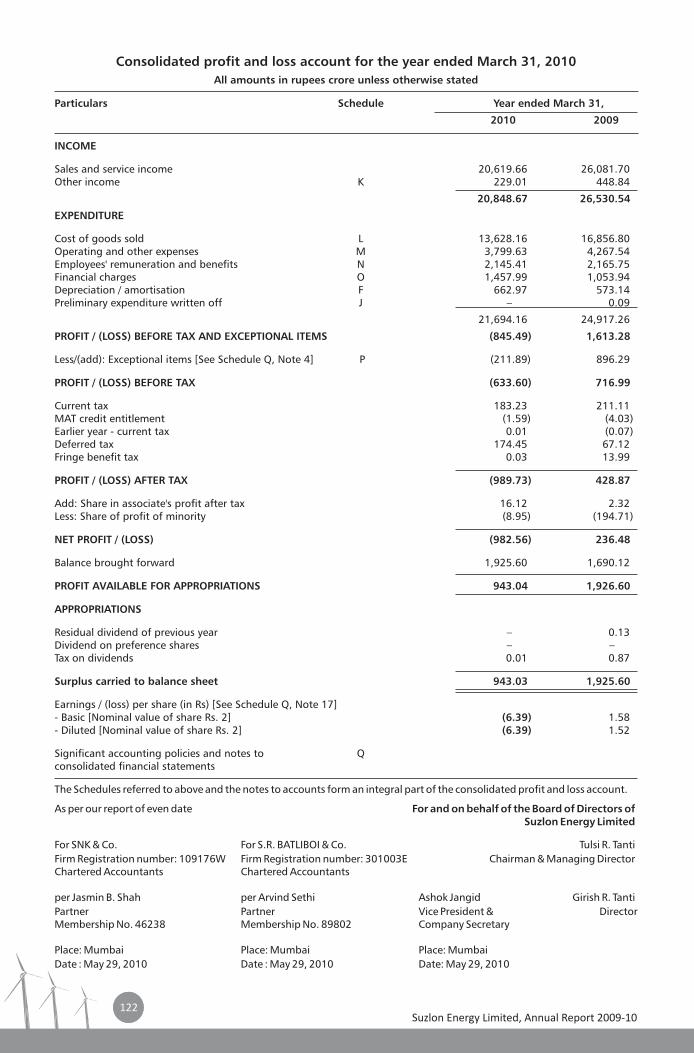
122
Consolidated profit and loss account for the year ended March 31, 2010
All amounts in rupees crore unless otherwise stated
Particulars Schedule Year ended March 31,
2010 2009
INCOME
Sales and service income 20,619.66 26,081.70 Other income K 229.01 448.84
20,848.67 26,530.54
EXPENDITURE
Cost of goods sold L 13,628.16 16,856.80 Operating and other expenses M 3,799.63 4,267.54 Employees' remuneration and benefits N 2,145.41 2,165.75 Financial charges O 1,457.99 1,053.94 Depreciation / amortisation F 662.97 573.14 Preliminary expenditure written off J – 0.09
21,694.16 24,917.26
PROFIT / (LOSS) BEFORE TAX AND EXCEPTIONAL ITEMS (845.49) 1,613.28
Less/(add): Exceptional items [See Schedule Q, Note 4] P (211.89) 896.29
PROFIT / (LOSS) BEFORE TAX (633.60) 716.99
Current tax 183.23 211.11 MAT credit entitlement (1.59) (4.03)Earlier year - current tax 0.01 (0.07)Deferred tax 174.45 67.12 Fringe benefit tax 0.03 13.99
PROFIT / (LOSS) AFTER TAX (989.73) 428.87
Add: Share in associate's profit after tax 16.12 2.32Less: Share of profit of minority (8.95) (194.71)
NET PROFIT / (LOSS) (982.56) 236.48
Balance brought forward 1,925.60 1,690.12
PROFIT AVAILABLE FOR APPROPRIATIONS 943.04 1,926.60
APPROPRIATIONS
Residual dividend of previous year – 0.13 Dividend on preference shares – –Tax on dividends 0.01 0.87
Surplus carried to balance sheet 943.03 1,925.60
Earnings / (loss) per share (in Rs) [See Schedule Q, Note 17]- Basic [Nominal value of share Rs. 2] (6.39) 1.58 - Diluted [Nominal value of share Rs. 2] (6.39) 1.52
Significant accounting policies and notes to Qconsolidated financial statements
The Schedules referred to above and the notes to accounts form an integral part of the consolidated profit and loss account.
As per our report of even date For and on behalf of the Board of Directors ofSuzlon Energy Limited
For SNK & Co. For S.R. BATLIBOI & Co. Tulsi R. TantiFirm Registration number: 109176W Firm Registration number: 301003E Chairman & Managing DirectorChartered Accountants Chartered Accountants
per Jasmin B. Shah per Arvind Sethi Ashok Jangid Girish R. TantiPartner Partner Vice President & DirectorMembership No. 46238 Membership No. 89802 Company Secretary
Place: Mumbai Place: Mumbai Place: MumbaiDate : May 29, 2010 Date : May 29, 2010 Date: May 29, 2010
Suzlon Energy Limited, Annual Report 2009-10122
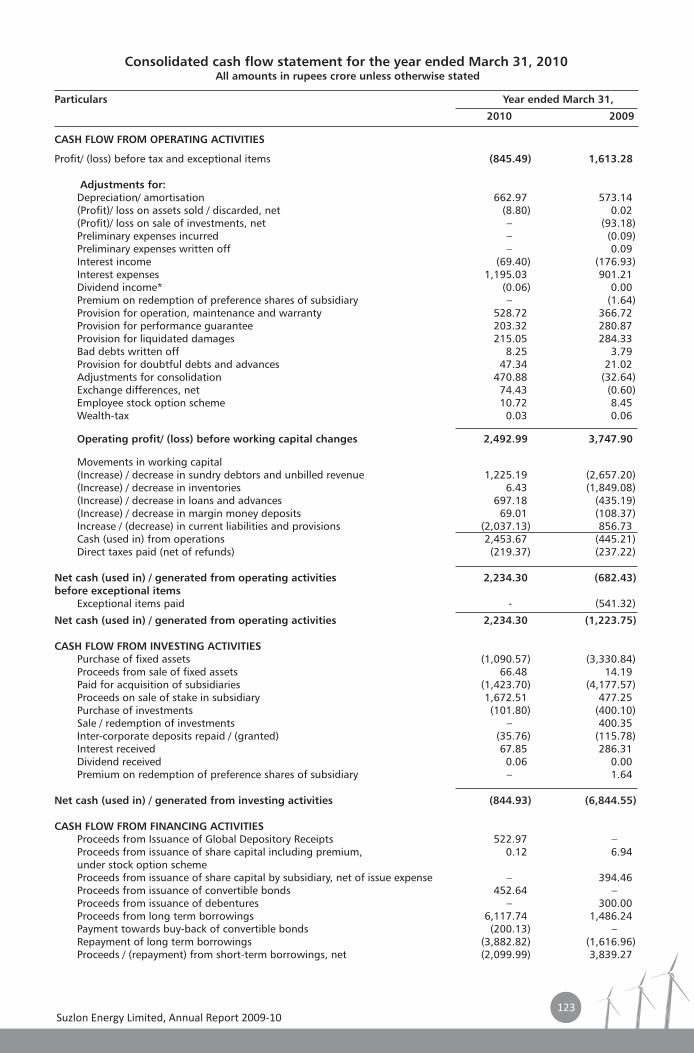
123
Consolidated cash flow statement for the year ended March 31, 2010 All amounts in rupees crore unless otherwise stated
Particulars Year ended March 31,
2010 2009
CASH FLOW FROM OPERATING ACTIVITIES
Profit/ (loss) before tax and exceptional items (845.49) 1,613.28
Adjustments for:Depreciation/ amortisation 662.97 573.14 (Profit)/ loss on assets sold / discarded, net (8.80) 0.02 (Profit)/ loss on sale of investments, net – (93.18)Preliminary expenses incurred – (0.09)Preliminary expenses written off – 0.09 Interest income (69.40) (176.93)Interest expenses 1,195.03 901.21 Dividend income* (0.06) 0.00 Premium on redemption of preference shares of subsidiary – (1.64)Provision for operation, maintenance and warranty 528.72 366.72 Provision for performance guarantee 203.32 280.87 Provision for liquidated damages 215.05 284.33 Bad debts written off 8.25 3.79 Provision for doubtful debts and advances 47.34 21.02 Adjustments for consolidation 470.88 (32.64)Exchange differences, net 74.43 (0.60)Employee stock option scheme 10.72 8.45 Wealth-tax 0.03 0.06
Operating profit/ (loss) before working capital changes 2,492.99 3,747.90
Movements in working capital(Increase) / decrease in sundry debtors and unbilled revenue 1,225.19 (2,657.20)(Increase) / decrease in inventories 6.43 (1,849.08)(Increase) / decrease in loans and advances 697.18 (435.19)(Increase) / decrease in margin money deposits 69.01 (108.37)Increase / (decrease) in current liabilities and provisions (2,037.13) 856.73 Cash (used in) from operations 2,453.67 (445.21)Direct taxes paid (net of refunds) (219.37) (237.22)
Net cash (used in) / generated from operating activities 2,234.30 (682.43)before exceptional items
Exceptional items paid - (541.32)
Net cash (used in) / generated from operating activities 2,234.30 (1,223.75)
CASH FLOW FROM INVESTING ACTIVITIESPurchase of fixed assets (1,090.57) (3,330.84)Proceeds from sale of fixed assets 66.48 14.19 Paid for acquisition of subsidiaries (1,423.70) (4,177.57)Proceeds on sale of stake in subsidiary 1,672.51 477.25 Purchase of investments (101.80) (400.10)Sale / redemption of investments – 400.35 Inter-corporate deposits repaid / (granted) (35.76) (115.78)Interest received 67.85 286.31 Dividend received 0.06 0.00 Premium on redemption of preference shares of subsidiary – 1.64
Net cash (used in) / generated from investing activities (844.93) (6,844.55)
CASH FLOW FROM FINANCING ACTIVITIESProceeds from Issuance of Global Depository Receipts 522.97 – Proceeds from issuance of share capital including premium, 0.12 6.94 under stock option schemeProceeds from issuance of share capital by subsidiary, net of issue expense – 394.46 Proceeds from issuance of convertible bonds 452.64 – Proceeds from issuance of debentures – 300.00 Proceeds from long term borrowings 6,117.74 1,486.24 Payment towards buy-back of convertible bonds (200.13) – Repayment of long term borrowings (3,882.82) (1,616.96)Proceeds / (repayment) from short-term borrowings, net (2,099.99) 3,839.27
Suzlon Energy Limited, Annual Report 2009-10123
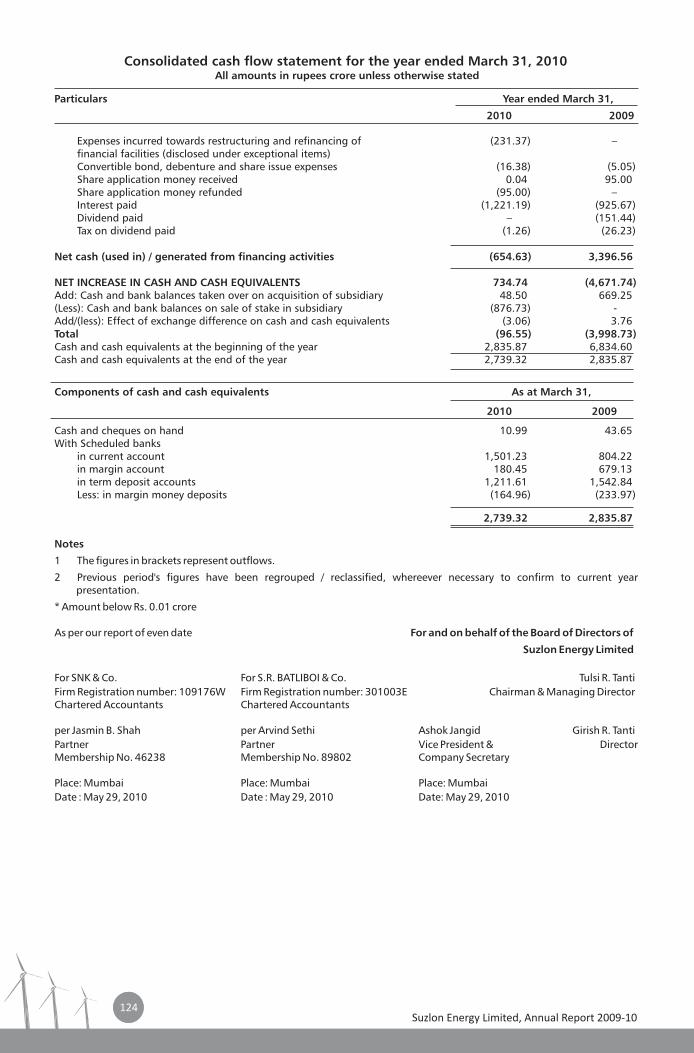
124
Expenses incurred towards restructuring and refinancing of (231.37) – financial facilities (disclosed under exceptional items)Convertible bond, debenture and share issue expenses (16.38) (5.05)Share application money received 0.04 95.00 Share application money refunded (95.00) – Interest paid (1,221.19) (925.67)Dividend paid – (151.44)Tax on dividend paid (1.26) (26.23)
Net cash (used in) / generated from financing activities (654.63) 3,396.56
NET INCREASE IN CASH AND CASH EQUIVALENTS 734.74 (4,671.74)Add: Cash and bank balances taken over on acquisition of subsidiary 48.50 669.25 (Less): Cash and bank balances on sale of stake in subsidiary (876.73) - Add/(less): Effect of exchange difference on cash and cash equivalents (3.06) 3.76 Total (96.55) (3,998.73)Cash and cash equivalents at the beginning of the year 2,835.87 6,834.60 Cash and cash equivalents at the end of the year 2,739.32 2,835.87
Components of cash and cash equivalents As at March 31,
2010 2009
Cash and cheques on hand 10.99 43.65 With Scheduled banks
in current account 1,501.23 804.22 in margin account 180.45 679.13 in term deposit accounts 1,211.61 1,542.84 Less: in margin money deposits (164.96) (233.97)
2,739.32 2,835.87
Notes
1 The figures in brackets represent outflows.
2 Previous period's figures have been regrouped / reclassified, whereever necessary to confirm to current year presentation.
* Amount below Rs. 0.01 crore
As per our report of even date For and on behalf of the Board of Directors of
Suzlon Energy Limited
For SNK & Co. For S.R. BATLIBOI & Co. Tulsi R. TantiFirm Registration number: 109176W Firm Registration number: 301003E Chairman & Managing DirectorChartered Accountants Chartered Accountants
per Jasmin B. Shah per Arvind Sethi Ashok Jangid Girish R. TantiPartner Partner Vice President & DirectorMembership No. 46238 Membership No. 89802 Company Secretary
Place: Mumbai Place: Mumbai Place: MumbaiDate : May 29, 2010 Date : May 29, 2010 Date: May 29, 2010
Consolidated cash flow statement for the year ended March 31, 2010 All amounts in rupees crore unless otherwise stated
Particulars Year ended March 31,
2010 2009
Suzlon Energy Limited, Annual Report 2009-10124
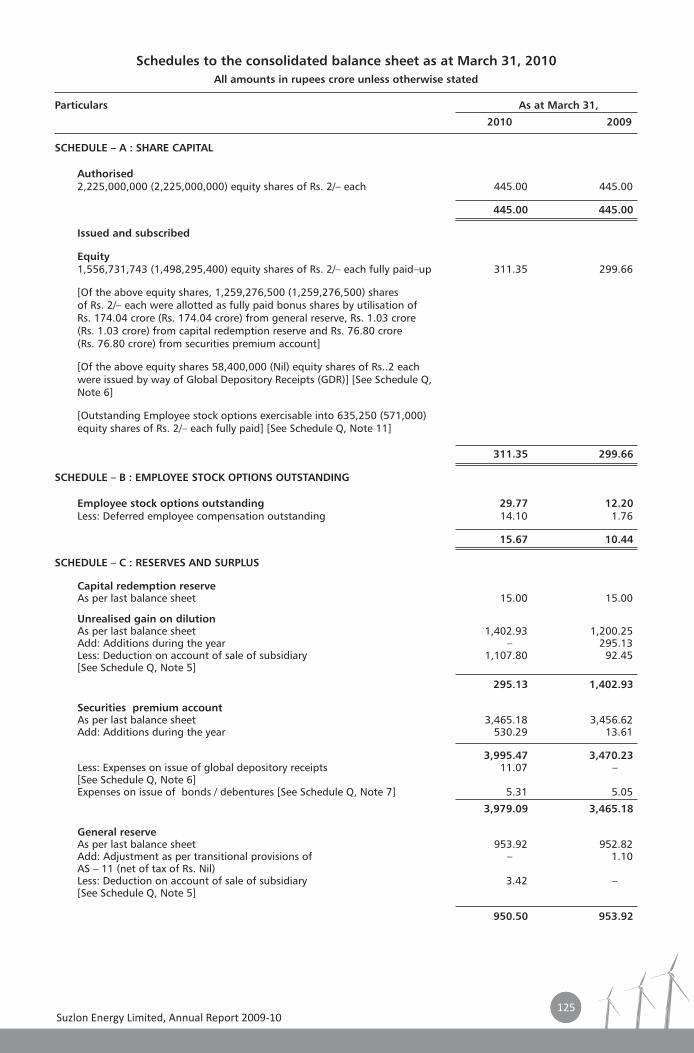
125
Schedules to the consolidated balance sheet as at March 31, 2010
All amounts in rupees crore unless otherwise stated
Particulars As at March 31,
2010 2009
SCHEDULE – A : SHARE CAPITAL
Authorised2,225,000,000 (2,225,000,000) equity shares of Rs. 2/– each 445.00 445.00
445.00 445.00
Issued and subscribed
Equity1,556,731,743 (1,498,295,400) equity shares of Rs. 2/– each fully paid–up 311.35 299.66
[Of the above equity shares, 1,259,276,500 (1,259,276,500) shares of Rs. 2/– each were allotted as fully paid bonus shares by utilisation of Rs. 174.04 crore (Rs. 174.04 crore) from general reserve, Rs. 1.03 crore (Rs. 1.03 crore) from capital redemption reserve and Rs. 76.80 crore (Rs. 76.80 crore) from securities premium account]
[Of the above equity shares 58,400,000 (Nil) equity shares of Rs..2 each were issued by way of Global Depository Receipts (GDR)] [See Schedule Q, Note 6]
[Outstanding Employee stock options exercisable into 635,250 (571,000) equity shares of Rs. 2/– each fully paid] [See Schedule Q, Note 11]
311.35 299.66
SCHEDULE – B : EMPLOYEE STOCK OPTIONS OUTSTANDING
Employee stock options outstanding 29.77 12.20 Less: Deferred employee compensation outstanding 14.10 1.76
15.67 10.44
SCHEDULE – C : RESERVES AND SURPLUS
Capital redemption reserveAs per last balance sheet 15.00 15.00
Unrealised gain on dilution As per last balance sheet 1,402.93 1,200.25 Add: Additions during the year – 295.13 Less: Deduction on account of sale of subsidiary 1,107.80 92.45 [See Schedule Q, Note 5]
295.13 1,402.93
Securities premium accountAs per last balance sheet 3,465.18 3,456.62 Add: Additions during the year 530.29 13.61
3,995.47 3,470.23 Less: Expenses on issue of global depository receipts 11.07 – [See Schedule Q, Note 6]Expenses on issue of bonds / debentures [See Schedule Q, Note 7] 5.31 5.05
3,979.09 3,465.18
General reserveAs per last balance sheet 953.92 952.82 Add: Adjustment as per transitional provisions of – 1.10 AS – 11 (net of tax of Rs. Nil)Less: Deduction on account of sale of subsidiary 3.42 – [See Schedule Q, Note 5]
950.50 953.92
Suzlon Energy Limited, Annual Report 2009-10125
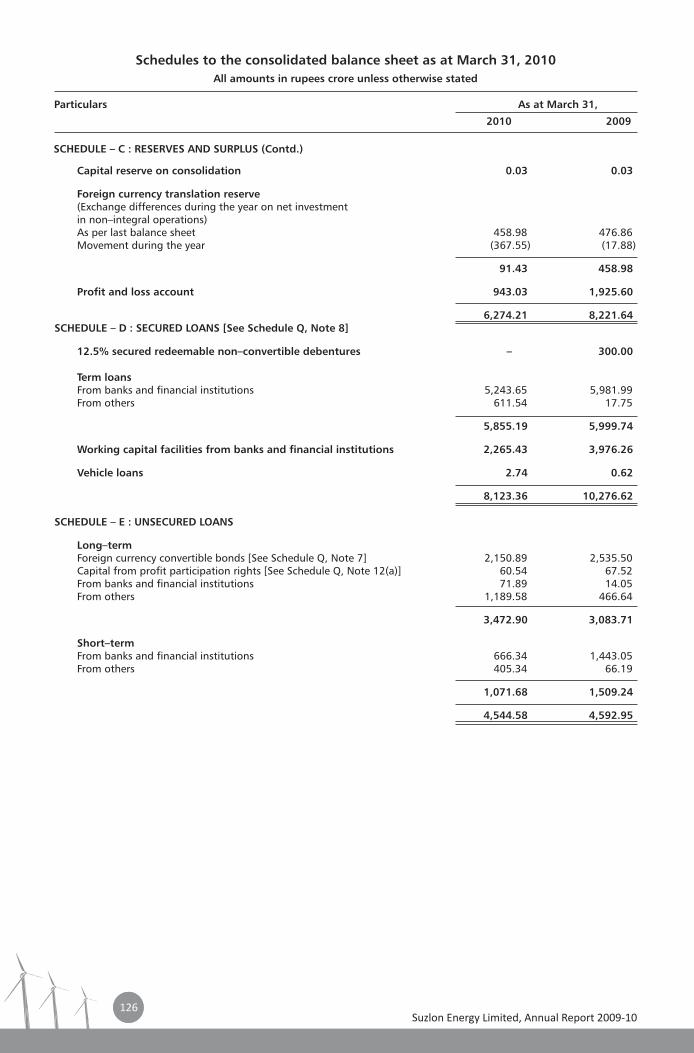
126
Schedules to the consolidated balance sheet as at March 31, 2010
All amounts in rupees crore unless otherwise stated
Particulars As at March 31,
2010 2009
Capital reserve on consolidation 0.03 0.03
Foreign currency translation reserve(Exchange differences during the year on net investment in non–integral operations)As per last balance sheet 458.98 476.86 Movement during the year (367.55) (17.88)
91.43 458.98
Profit and loss account 943.03 1,925.60
6,274.21 8,221.64 SCHEDULE – D : SECURED LOANS [See Schedule Q, Note 8]
12.5% secured redeemable non–convertible debentures – 300.00
Term loansFrom banks and financial institutions 5,243.65 5,981.99 From others 611.54 17.75
5,855.19 5,999.74
Working capital facilities from banks and financial institutions 2,265.43 3,976.26
Vehicle loans 2.74 0.62
8,123.36 10,276.62
SCHEDULE – E : UNSECURED LOANS
Long–termForeign currency convertible bonds [See Schedule Q, Note 7] 2,150.89 2,535.50 Capital from profit participation rights [See Schedule Q, Note 12(a)] 60.54 67.52 From banks and financial institutions 71.89 14.05 From others 1,189.58 466.64
3,472.90 3,083.71
Short–termFrom banks and financial institutions 666.34 1,443.05 From others 405.34 66.19
1,071.68 1,509.24
4,544.58 4,592.95
SCHEDULE – C : RESERVES AND SURPLUS (Contd.)
Suzlon Energy Limited, Annual Report 2009-10126
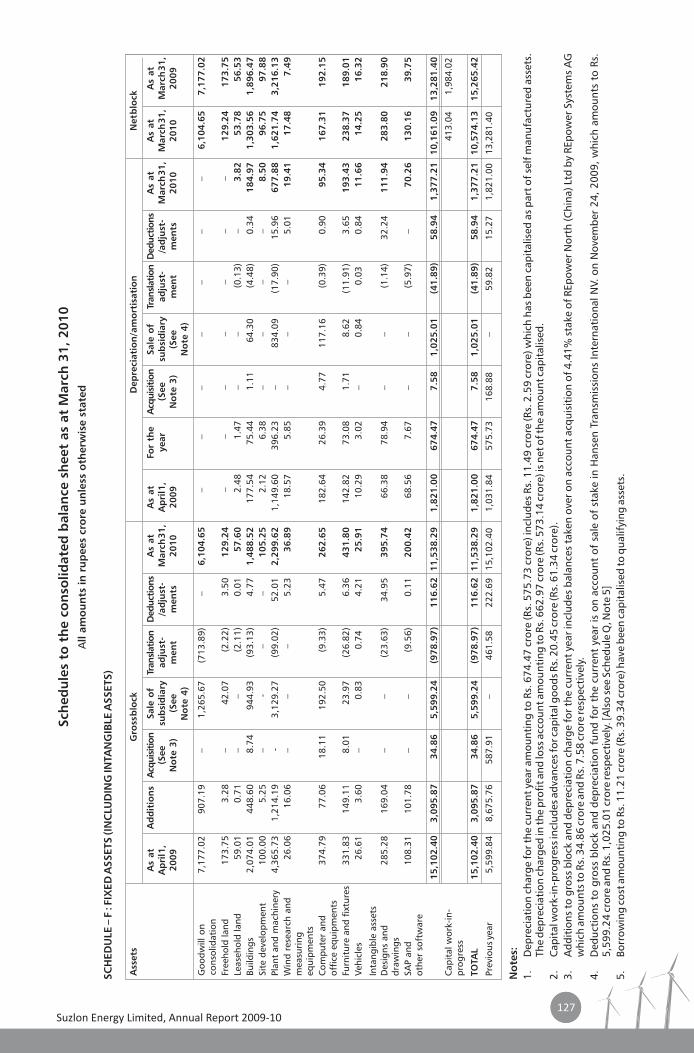
127
Sch
ed
ule
s to
th
e c
on
solid
ate
d b
ala
nce
sh
eet
as
at
Marc
h 3
1,
20
10
All a
mo
un
ts in
ru
pees
cro
re u
nle
ss o
therw
ise s
tate
d
SC
HED
ULE –
F :
FIX
ED
ASSETS (IN
CLU
DIN
G IN
TAN
GIB
LE A
SSETS)
No
tes:
1.D
epre
ciat
ion
char
ge fo
r the
cur
rent
yea
r am
ount
ing
to R
s. 6
74.4
7 cr
ore
(Rs.
575
.73
cror
e) in
clud
es R
s. 1
1.49
cro
re (R
s. 2
.59
cror
e) w
hich
has
bee
n ca
pita
lised
as
part
of s
elf m
anuf
actu
red
asse
ts.
The
depr
ecia
tion
cha
rged
in th
e pr
ofit
and
loss
acc
ount
am
ount
ing
to R
s. 6
62.9
7 cr
ore
(Rs.
573
.14
cror
e) is
net
of t
he a
mou
nt c
apit
alis
ed.
2.
Cap
ital
wor
k-in
-pro
gres
s inc
lude
s adv
ance
s for
cap
ital
goo
ds R
s. 2
0.45
cro
re (R
s. 6
1.34
cro
re).
3.A
ddit
ions
to g
ross
blo
ck a
nd d
epre
ciat
ion
char
ge fo
r the
cur
rent
yea
r inc
lude
s ba
lanc
es ta
ken
over
on
acco
unt a
cqui
siti
on o
f 4.4
1% s
take
of R
Epow
er N
orth
(Chi
na) L
td b
y RE
pow
er S
yste
ms
AG
w
hich
am
ount
s to
Rs. 3
4.86
cro
re a
nd R
s. 7
.58
cror
e re
spec
tive
ly.
4.
Ded
ucti
ons
to g
ross
blo
ck a
nd d
epre
ciat
ion
fund
for
the
cur
rent
yea
r is
on
acco
unt
of s
ale
of s
take
in H
anse
n Tr
ansm
issi
ons
Inte
rnat
iona
l NV.
on
Nov
embe
r 24
, 200
9, w
hich
am
ount
s to
Rs.
5,
599.
24 c
rore
and
Rs.
1,0
25.0
1 cr
ore
resp
ecti
vely
. [A
lso
see
Sche
dule
Q, N
ote
5]5.
Bo
rrow
ing
cost
am
ount
ing
to R
s. 1
1.21
cro
re (R
s. 3
9.34
cro
re) h
ave
been
cap
ital
ised
to q
ualif
ying
ass
ets.
Ass
ets
G
ross
blo
ck
Dep
reci
ati
on
/ am
ort
isati
on
N
et b
lock
A
s a
t A
dd
itio
ns
Acq
uis
itio
nSale
of
Transl
ation
Deduct
ions
As
at
As
at
For
the
Acq
uis
itio
nSale
of
Transl
ation
Deduct
ions
As
at
As
at
As
at
Ap
ril 1
, (S
ee
su
bsi
dia
ryad
just
-/a
dju
st-
Marc
h 3
1,
Ap
ril 1
, year
(See
su
bsi
dia
ryad
just
-/a
dju
st-
Marc
h 3
1,
Marc
h 3
1,
Marc
h 3
1,
20
09
No
te 3
) (S
ee
men
tm
en
ts2
01
02
00
9N
ote
3)
(See
men
tm
en
ts2
01
02
01
02
00
9
No
te 4
)
No
te 4
)
Goo
dwill
on
6,1
04
.65
6,1
04
.65
7
,17
7.0
2 co
nsol
idat
ion
Free
hold
land
173
.75
3.2
8 –
4
2.07
(
2.22
) 3
.50
12
9.2
4
–
–
–
–
–
–
–
12
9.2
4
17
3.7
5
Leas
ehol
d la
nd 5
9.01
0
.71
–
–
(2.
11)
0.0
1 5
7.6
0
2.4
8 1
.47
–
–
(0.
13)
–
3.8
2
53
.78
5
6.5
3
Build
ings
2,07
4.01
4
48.6
0 8
.74
944
.93
(93
.13)
4.7
7 1
,48
8.5
2
177
.54
75.
44
1.1
1 6
4.30
(
4.48
) 0
.34
18
4.9
7
1,3
03
.56
1
,89
6.4
7
Site
dev
elop
men
t 1
00.0
0 5
.25
–
-
–
–
10
5.2
5
2.1
2 6
.38
–
–
–
–
8.5
0
96
.75
9
7.8
8
Plan
t an
d m
achi
nery
4,3
65.7
3 1
,214
.19
-
3,1
29.2
7 (
99.0
2) 5
2.01
2
,29
9.6
2
1,1
49.6
0 3
96.2
3 –
8
34.0
9 (
17.9
0) 1
5.96
6
77
.88
1
,62
1.7
4
3,2
16
.13
W
ind
rese
arch
and
26
.06
16.
06
–
–
–
5.2
3 3
6.8
9
18.
57
5.8
5 –
–
–
5
.01
19
.41
1
7.4
8
7.4
9
mea
suri
ng
equi
pmen
tsC
ompu
ter
and
374.
79
77.
06
18.
11
192
.50
(9.
33)
5.4
7 2
62
.65
1
82.6
4 2
6.39
4
.77
117
.16
(0.
39)
0.9
0 9
5.3
4
16
7.3
1
19
2.1
5
offic
e eq
uipm
ents
Furn
itur
e an
d fix
ture
s 3
31.8
3 1
49.1
1 8
.01
23.
97
(26
.82)
6.3
6 4
31
.80
1
42.8
2 7
3.08
1
.71
8.6
2 (
11.9
1) 3
.65
19
3.4
3
23
8.3
7
18
9.0
1
Vehi
cles
26.
61
3.6
0 –
0
.83
0.7
4 4
.21
25
.91
1
0.29
3
.02
–
0.8
4 0
.03
0.8
4 1
1.6
6
14
.25
1
6.3
2
Inta
ngib
le a
sset
sD
esig
ns a
nd28
5.28
1
69.0
4 –
–
(
23.6
3) 3
4.95
3
95
.74
6
6.38
7
8.94
–
–
(
1.14
) 3
2.24
1
11
.94
2
83
.80
2
18
.90
dr
awin
gsSA
P an
d10
8.31
1
01.7
8 –
–
(
9.56
) 0
.11
20
0.4
2
68.
56
7.6
7 –
–
(
5.97
) –
7
0.2
6
13
0.1
6
39
.75
ot
her
soft
war
e
15
,10
2.4
0
3,0
95
.87
3
4.8
6
5,5
99
.24
(
97
8.9
7)
11
6.6
2
11
,53
8.2
9
1,8
21
.00
6
74
.47
7
.58
1
,02
5.0
1
(4
1.8
9)
58
.94
1
,37
7.2
1
10
,16
1.0
9
13
,28
1.4
0
Cap
ital
wor
k-in
-41
3.04
1
,984
.02
prog
ress
TO
TAL
15
,10
2.4
0
3,0
95
.87
3
4.8
6
5,5
99
.24
(
97
8.9
7)
11
6.6
2
11
,53
8.2
9
1,8
21
.00
6
74
.47
7
.58
1
,02
5.0
1
(4
1.8
9)
58
.94
1
,37
7.2
1
10
,57
4.1
3
15
,26
5.4
2
Prev
ious
yea
r 5,
599.
84
8,6
75.7
6 5
87.9
1 –
4
61.5
8 2
22.6
9 1
5,10
2.40
1
,031
.84
575
.73
168
.88
–
59.
82
15.
27
1,8
21.0
0 1
3,28
1.40
7,1
77.0
2 9
07.1
9 –
1
,265
.67
(713
.89)
–
–
–
–
–
–
–
–
Suzlon Energy Limited, Annual Report 2009-10127
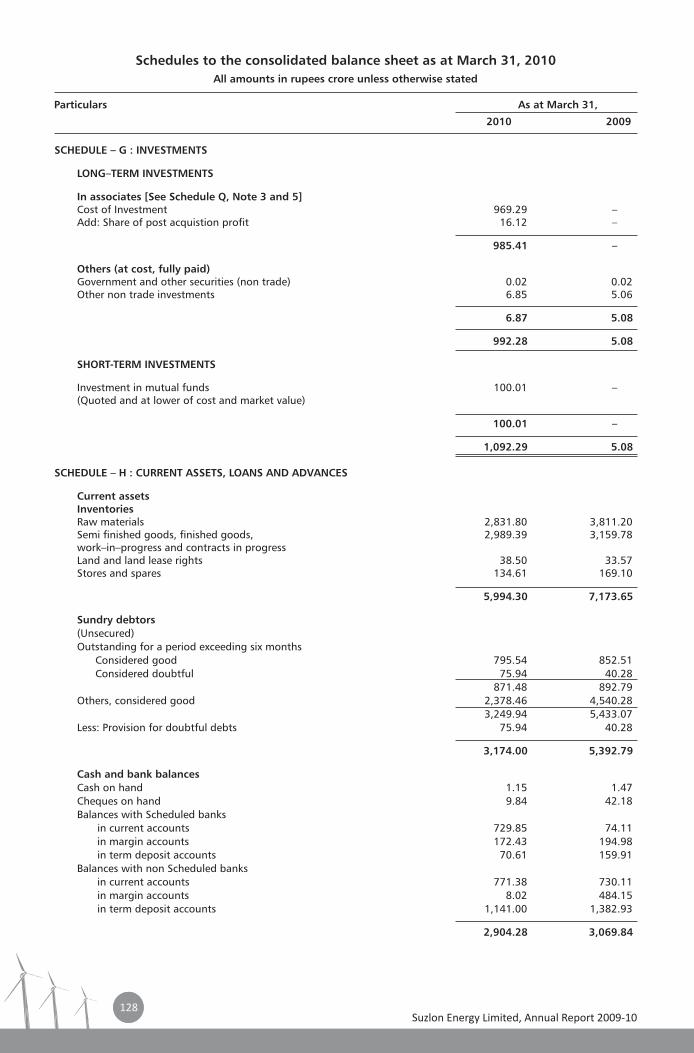
128
SCHEDULE – G : INVESTMENTS
LONG–TERM INVESTMENTS
In associates [See Schedule Q, Note 3 and 5]Cost of Investment 969.29 – Add: Share of post acquistion profit 16.12 –
985.41 –
Others (at cost, fully paid)Government and other securities (non trade) 0.02 0.02 Other non trade investments 6.85 5.06
6.87 5.08
992.28 5.08
SHORT-TERM INVESTMENTS
Investment in mutual funds 100.01 – (Quoted and at lower of cost and market value)
100.01 –
1,092.29 5.08
SCHEDULE – H : CURRENT ASSETS, LOANS AND ADVANCES
Current assetsInventoriesRaw materials 2,831.80 3,811.20 Semi finished goods, finished goods, 2,989.39 3,159.78 work–in–progress and contracts in progressLand and land lease rights 38.50 33.57 Stores and spares 134.61 169.10
5,994.30 7,173.65
Sundry debtors
(Unsecured)Outstanding for a period exceeding six months
Considered good 795.54 852.51 Considered doubtful 75.94 40.28
871.48 892.79 Others, considered good 2,378.46 4,540.28
3,249.94 5,433.07 Less: Provision for doubtful debts 75.94 40.28
3,174.00 5,392.79
Cash and bank balances
Cash on hand 1.15 1.47 Cheques on hand 9.84 42.18 Balances with Scheduled banks
in current accounts 729.85 74.11 in margin accounts 172.43 194.98 in term deposit accounts 70.61 159.91
Balances with non Scheduled banksin current accounts 771.38 730.11in margin accounts 8.02 484.15 in term deposit accounts 1,141.00 1,382.93
2,904.28 3,069.84
Schedules to the consolidated balance sheet as at March 31, 2010
All amounts in rupees crore unless otherwise stated
Particulars As at March 31,
2010 2009
Suzlon Energy Limited, Annual Report 2009-10128
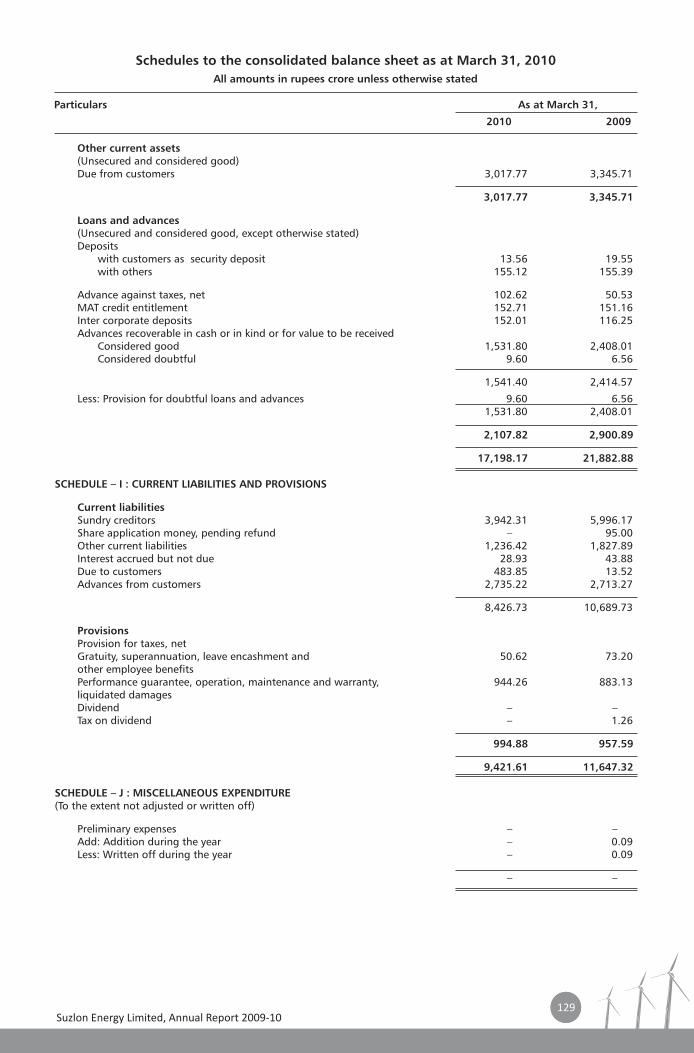
129
Schedules to the consolidated balance sheet as at March 31, 2010
All amounts in rupees crore unless otherwise stated
Particulars As at March 31,
2010 2009
Other current assets(Unsecured and considered good)Due from customers 3,017.77 3,345.71
3,017.77 3,345.71
Loans and advances(Unsecured and considered good, except otherwise stated)Deposits
with customers as security deposit 13.56 19.55 with others 155.12 155.39
Advance against taxes, net 102.62 50.53 MAT credit entitlement 152.71 151.16 Inter corporate deposits 152.01 116.25 Advances recoverable in cash or in kind or for value to be received
Considered good 1,531.80 2,408.01Considered doubtful 9.60 6.56
1,541.40 2,414.57
Less: Provision for doubtful loans and advances 9.60 6.56 1,531.80 2,408.01
2,107.82 2,900.89
17,198.17 21,882.88
SCHEDULE – I : CURRENT LIABILITIES AND PROVISIONS
Current liabilitiesSundry creditors 3,942.31 5,996.17 Share application money, pending refund – 95.00 Other current liabilities 1,236.42 1,827.89 Interest accrued but not due 28.93 43.88 Due to customers 483.85 13.52 Advances from customers 2,735.22 2,713.27
8,426.73 10,689.73
Provisions Provision for taxes, netGratuity, superannuation, leave encashment and 50.62 73.20 other employee benefitsPerformance guarantee, operation, maintenance and warranty, 944.26 883.13 liquidated damagesDividend – – Tax on dividend – 1.26
994.88 957.59
9,421.61 11,647.32
SCHEDULE – J : MISCELLANEOUS EXPENDITURE(To the extent not adjusted or written off)
Preliminary expenses – – Add: Addition during the year – 0.09 Less: Written off during the year – 0.09
– –
Suzlon Energy Limited, Annual Report 2009-10129
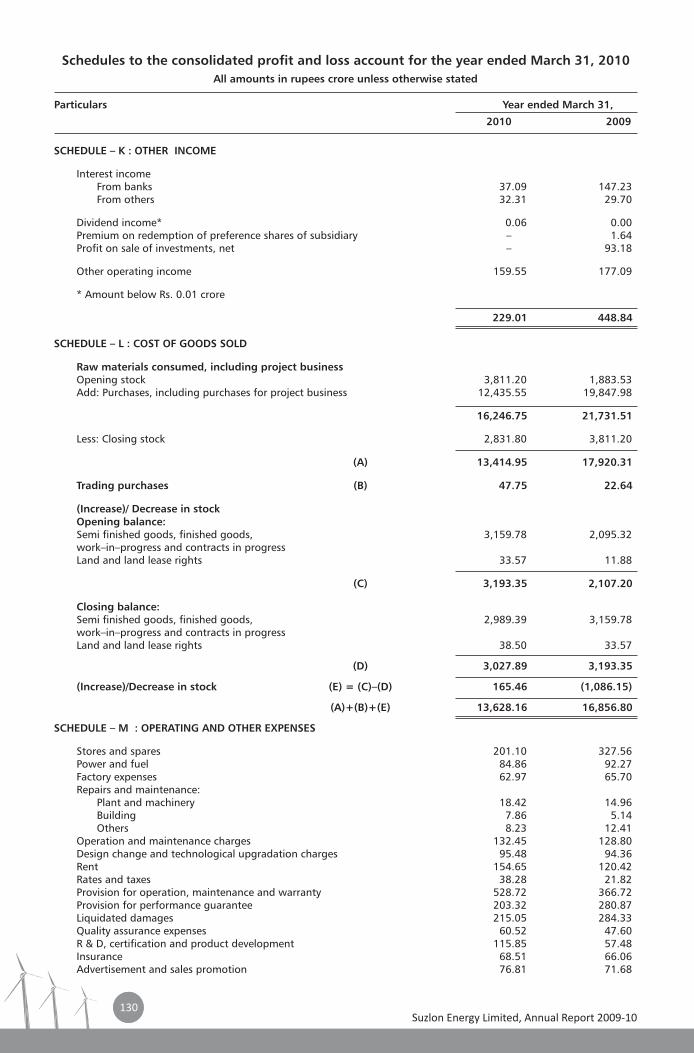
130
Schedules to the consolidated profit and loss account for the year ended March 31, 2010
All amounts in rupees crore unless otherwise stated
Particulars Year ended March 31,
2010 2009
SCHEDULE – K : OTHER INCOME
Interest incomeFrom banks 37.09 147.23 From others 32.31 29.70
Dividend income* 0.06 0.00 Premium on redemption of preference shares of subsidiary – 1.64 Profit on sale of investments, net – 93.18
Other operating income 159.55 177.09
* Amount below Rs. 0.01 crore
229.01 448.84
SCHEDULE – L : COST OF GOODS SOLD
Raw materials consumed, including project businessOpening stock 3,811.20 1,883.53 Add: Purchases, including purchases for project business 12,435.55 19,847.98
16,246.75 21,731.51
Less: Closing stock 2,831.80 3,811.20
(A) 13,414.95 17,920.31
Trading purchases (B) 47.75 22.64
(Increase)/ Decrease in stockOpening balance:Semi finished goods, finished goods, 3,159.78 2,095.32 work–in–progress and contracts in progressLand and land lease rights 33.57 11.88
(C) 3,193.35 2,107.20
Closing balance:Semi finished goods, finished goods, 2,989.39 3,159.78 work–in–progress and contracts in progressLand and land lease rights 38.50 33.57
(D) 3,027.89 3,193.35
(Increase)/Decrease in stock (E) = (C)–(D) 165.46 (1,086.15)
(A)+(B)+(E) 13,628.16 16,856.80
SCHEDULE – M : OPERATING AND OTHER EXPENSES
Stores and spares 201.10 327.56 Power and fuel 84.86 92.27 Factory expenses 62.97 65.70 Repairs and maintenance:
Plant and machinery 18.42 14.96 Building 7.86 5.14 Others 8.23 12.41
Operation and maintenance charges 132.45 128.80 Design change and technological upgradation charges 95.48 94.36 Rent 154.65 120.42 Rates and taxes 38.28 21.82 Provision for operation, maintenance and warranty 528.72 366.72 Provision for performance guarantee 203.32 280.87 Liquidated damages 215.05 284.33 Quality assurance expenses 60.52 47.60 R & D, certification and product development 115.85 57.48 Insurance 68.51 66.06 Advertisement and sales promotion 76.81 71.68
Suzlon Energy Limited, Annual Report 2009-10130
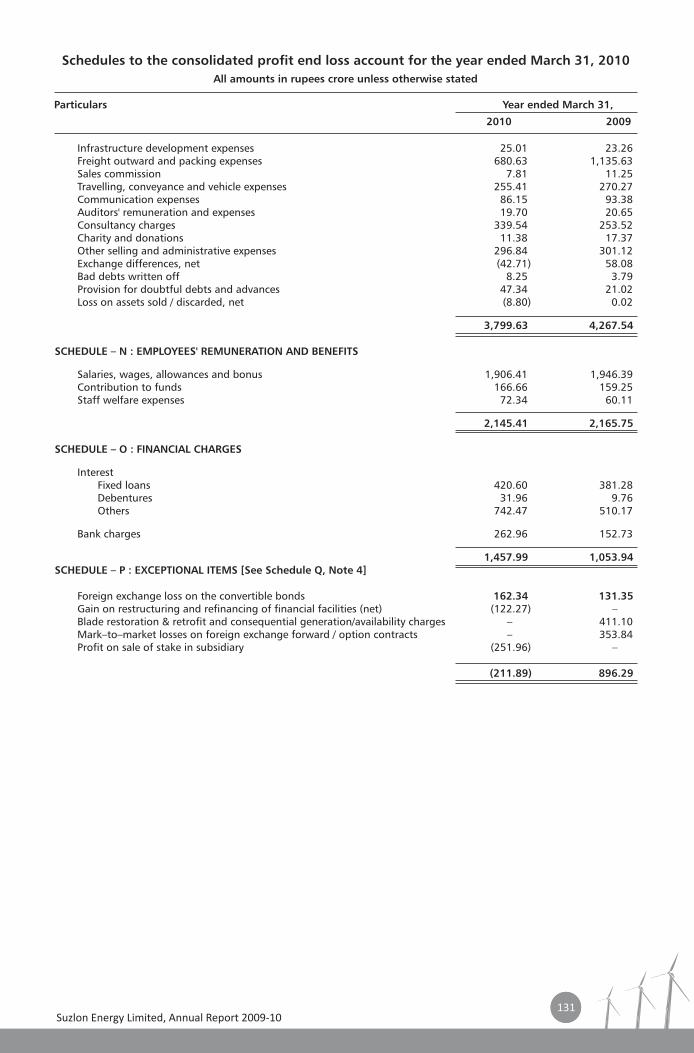
131
Infrastructure development expenses 25.01 23.26 Freight outward and packing expenses 680.63 1,135.63 Sales commission 7.81 11.25 Travelling, conveyance and vehicle expenses 255.41 270.27 Communication expenses 86.15 93.38 Auditors' remuneration and expenses 19.70 20.65 Consultancy charges 339.54 253.52 Charity and donations 11.38 17.37 Other selling and administrative expenses 296.84 301.12 Exchange differences, net (42.71) 58.08 Bad debts written off 8.25 3.79 Provision for doubtful debts and advances 47.34 21.02 Loss on assets sold / discarded, net (8.80) 0.02
3,799.63 4,267.54
SCHEDULE – N : EMPLOYEES' REMUNERATION AND BENEFITS
Salaries, wages, allowances and bonus 1,906.41 1,946.39 Contribution to funds 166.66 159.25 Staff welfare expenses 72.34 60.11
2,145.41 2,165.75
SCHEDULE – O : FINANCIAL CHARGES
InterestFixed loans 420.60 381.28 Debentures 31.96 9.76 Others 742.47 510.17
Bank charges 262.96 152.73
1,457.99 1,053.94 SCHEDULE – P : EXCEPTIONAL ITEMS [See Schedule Q, Note 4]
Foreign exchange loss on the convertible bonds 162.34 131.35 Gain on restructuring and refinancing of financial facilities (net) (122.27) –Blade restoration & retrofit and consequential generation/availability charges – 411.10 Mark–to–market losses on foreign exchange forward / option contracts – 353.84 Profit on sale of stake in subsidiary (251.96) –
(211.89) 896.29
Schedules to the consolidated profit end loss account for the year ended March 31, 2010
All amounts in rupees crore unless otherwise stated
Particulars Year ended March 31,
2010 2009
Suzlon Energy Limited, Annual Report 2009-10131
132
SCHEDULE – Q: SIGNIFICANT ACCOUNTING POLICIES AND NOTES TO THE CONSOLIDATED FINANCIAL STATEMENTS
(All amounts in rupees crore unless otherwise stated)
I SIGNIFICANT ACCOUNTING POLICIES
a) Basis of accounting
The consolidated financial statements comprise the financial statements of Suzlon Energy Limited ('SEL' or 'the Company') and its subsidiaries, associates and joint venture (together referred to as 'Suzlon' or 'the Group'). The consolidated financial statements are prepared under the historical cost convention, on accrual basis of accounting to comply in all material respects, with the mandatory accounting standards as notified by the Companies (Accounting Standards) Rules, 2006, as amended ('the Rules') and the relevant provisions of the Companies Act, 1956 ('the Act'). The accounting policies have been consistently applied by the Group; and the accounting policies not referred to otherwise, are in conformity with Indian Generally Accepted Accounting Principles ('Indian GAAP').
b) Principles of consolidation
The consolidated financial statements of the Group are prepared in accordance with Accounting Standard 21 – 'Consolidated Financial Statements', Accounting Standard 23 – 'Accounting for Investments in Associates in Consolidated Financial Statements' and Accounting Standard 27 – 'Financial Reporting of Interests in Joint Ventures' as notified by the Rules.
The consolidated financial statements are presented, to the extent possible, in the same format as that adopted by the Company for its independent financial statements.
Subsidiaries
Subsidiaries are fully consolidated from the date of acquisition, being the date on which the Group obtains control, and continue to be consolidated until the date that such control ceases.
The financial statements of the Company and its subsidiaries have been combined on a line-by-line basis by adding together the book values of like items of assets, liabilities, income and expenses, after eliminating intra group balances and intra group transactions. The unrealised profits or losses resulting from the intra group transactions and intra group balances have been eliminated.
The excess of the cost to the Company of its investment in the subsidiaries over the Company's portion of equity on the acquisition date is recognised in the financial statements as goodwill and is tested for impairment annually. The excess of Company's portion of equity of the Subsidiary over the cost of investment therein is treated as Capital Reserve. The Company's portion of the equity in the subsidiaries at the date of acquisition is determined after realigning the material accounting policies of the subsidiaries to that of the parent and the charge/(reversal) on account of realignment is adjusted to the accumulated reserves and surplus of the subsidiaries at the date of acquisition.
The consolidated financial statements are prepared using uniform accounting policies for like transactions and events in similar circumstances and necessary adjustments required for deviations, if any to the extent possible, are made in the consolidated financial statements and are presented in the same manner as the Company's standalone financial statements.
Share of minority interest in the net profit is adjusted against the income to arrive at the net income attributable to shareholders. Minority interest's share of net assets is presented separately in the balance sheet.
A change in the ownership interest of a subsidiary, without a loss of control is accounted for as an equity transaction.
If the Group loses control over a subsidiary, it:
a) derecognises the assets (including goodwill) and liabilities of the subsidiary;
b) derecognises the carrying amount of any minority interest;
c) derecognises the cumulative translation differences, recorded in foreign currency translation reserve;
d) recognises the value of the consideration received;
e) recognises the value of any investment retained;
f) recognises any surplus or deficit in profit or losses.
Associates
The Group's investment in its associate is accounted for using the equity method. An associate is an entity in which the Group has significant influence.
Under the equity method, the investment in the associate is carried in the balance sheet at cost plus post acquisition changes in the Group's share of net assets of the associate. Goodwill relating to the associate is included in the carrying amount of the investment and is neither amortised nor individually tested for impairment. The profit and loss account reflects the share of the results of operations of the associate. Unrealised gains and losses resulting from transactions between the Group and the associate are eliminated to the extent of the interest in the associate.
Suzlon Energy Limited, Annual Report 2009-10132
133
After application of the equity method, the Group determines whether it is necessary to recognise an additional impairment loss on the Group's investment in its associates. The Group determines at each reporting date whether there is any objective evidence that the investment in the associate is impaired. If this is the case the Group calculates the amount of impairment as the difference between the recoverable amount of the associate and its carrying value and recognises the amount in the profit and loss account.
Joint Venture
The Group recognises its interest in the joint venture using the proportionate consolidation method as per Accounting Standard 27 – Financial Reporting of Interests in Joint Ventures as notified by the Rules. The Group combines its proportionate share of each of the assets, liabilities, income and expenses of the joint venture with similar items, line by line, in its consolidated financial statements.
c) Use of estimates
The preparation of financial statements in conformity with Indian GAAP requires management to make estimates and assumptions that may affect the reported amounts of assets and liabilities and disclosures relating to contingent liabilities as at the date of the financial statements and the reported amounts of incomes and expenses during the reporting period. Although these estimates are based upon management's best knowledge of current events and actions, actual results could differ from these estimates.
d) Revenue recognition
Revenue is recognised to the extent it is probable that the economic benefits will flow to the Group and that the revenue can be reliably measured. Revenue comprises of sale of goods and services and is disclosed, net of discounts, excise duty, sales tax, service tax, VAT or other taxes, as applicable.
Sales
Revenue from sale of goods is recognised in the profit and loss account when the significant risks and rewards in respect of ownership of goods has been transferred to the buyer as per the terms of the respective sales order, and the income can be measured reliably and is expected to be received.
Fixed price contracts to deliver wind power systems (turnkey and projects involving installation and/or commissioning apart from supply) are recognised in revenue based on the stage of completion of the individual contract using the percentage of completion method, provided the order outcome as well as expected total costs can be reliably estimated. Where the profit from a contract cannot be estimated reliably, revenue is only recognised equalling the expenses incurred to the extent that it is probable that the expenses will be recovered.
Due from customers, if any, are measured at the selling price of the work performed based on the stage of completion less interim billing and expected losses. The stage of completion is measured by the proportion that the contract expenses incurred to date bear to the estimated total contract expenses. The value of self-constructed components is recognised in 'Contracts in progress' upon dispatch of the complete set of components which are specifically identified for a customer and are within the scope of supply, as per the terms of the respective sale order for the wind power systems.. Where it is probable that total contract expenses will exceed total revenues from a contract, the expected loss is recognised immediately as an expense in the profit and loss account.
Where the selling price of a contract cannot be estimated reliably, the selling price is measured only on the expenses incurred to the extent that it is probable that these expenses will be recovered. Prepayments from customers are recognised as liabilities. A contract in progress for which the selling price of the work performed exceeds interim billings and expected losses is recognised as an asset. Contracts in progress for which interim billings and expected losses exceed the selling price are recognised as a liability. Expenses relating to sales work and the winning of contracts are recognised in the income statement as incurred.
Project execution income
Revenue from services relating to project execution is recognised on completion of the respective service, as per the terms of respective sales order.
Power generation income
Power generation income is recognised based on electrical units generated, net of wheeling and transmission loss, as applicable, as disclosed in the power generation reports issued by the concerned authorities.
Service and maintenance income
Revenue from annual service and maintenance contracts is recognised on a proportionate basis during the period in which the service is provided, net of taxes.
Interest income
Interest income is recognised on a time proportion basis taking into account the amount outstanding and the rate applicable. In case of interest charged to customers, interest is accounted for on availability of documentary evidence that the customer has accepted the liability.
Suzlon Energy Limited, Annual Report 2009-10133
134
Dividend income
Dividend income from investments is recognised when the right to receive payment is established.
e) Fixed assets and intangible assets
Fixed assets are stated at cost, less accumulated depreciation and impairment losses, if any. Cost includes all expenditure necessary to bring the asset to its working condition for its intended use. Own manufactured assets are capitalised inclusive of all direct costs and attributable overheads. Capital work-in-progress comprises of advances paid to acquire fixed assets and the cost of fixed assets that are not yet ready for their intended use as at the balance sheet date. In the case of new undertakings, pre-operative expenses are capitalized upon the commencement of commercial production. Assets held for disposal are stated at the lower of net book value and the estimated net realisable value.
In respect of accounting periods commencing on or after December 7, 2006, exchange differences arising on reporting of the long-term foreign currency monetary items at rates different from those that at which they were initially recorded during the period, or reported in the previous financial statements are added to or deducted from the cost of the asset and are depreciated over the balance life of the asset, if these monetary items pertain to the acquisition of a depreciable fixed asset.
Intangible assets are recorded at the consideration paid for their acquisition. Cost of an internally generated asset comprises all expenditure that can be directly attributed, or allocated on a reasonable and consistent basis, to create produce and make the asset ready for its intended use. Development cost incurred on an individual project is carried forward when its future recoverability can reasonably be regarded as assured. Any expenditure carried forward is amortised over the period of expected future sales from the related project, not exceeding five years. The carrying value of development costs is reviewed for impairment annually when the asset is not in use, and otherwise when events and changes in circumstances indicate that the carrying value may not be recoverable.
The carrying amount of the assets belonging to each cash generating unit (CGU) are reviewed at each balance sheet date to assess whether the same are recorded in excess of their recoverable amounts and where carrying amounts exceed the recoverable amount of the assets with CGU, assets are written down to their recoverable amount. The recoverable amount is the greater of the asset's net selling price and value in use. The impairment loss recognised in prior accounting period is reversed if there has been a change in estimates of recoverable amount.
f) Depreciation and amortisation
Depreciation is provided on the written down value method ('WDV') and is based on management's estimate of useful lives of the fixed assets or where applicable, at rates specified by respective statutes, whichever is higher. Intangible assets are amortised on a straight line basis over a period of five years.
Some of the subsidiaries of the Group provide depreciation on Straight-Line Method ('SLM').
g) Inventories
Inventories of raw materials including stores; spares and consumables; packing materials; semi-finished goods; work-in-progress, contracts in progress and finished goods are valued at the lower of cost and estimated net realisable value. Cost is determined on weighted average basis.
The cost of work-in-progress, project work-in-progress, semi-finished goods and finished goods includes the cost of material, labour and manufacturing overheads.
Stock of land and land lease rights is valued at lower of cost and estimated net realisable value. Cost is determined on weighted average basis. Net realisable value is determined by management using technical estimates.
h) Investments
Investments that are readily realisable and intended to be held for not more than a year are classified as current investments. All other investments are classified as long term investments. Current investments are carried at the lower of cost and fair value, determined on an individual basis.
Long-term investments other than in associates are carried at cost. However, provision is made to recognise a decline, other than temporary, in the value of long term investments. Investments in associates are accounted for using the equity method.
i) Foreign currency transactions
Transactions in foreign currencies are recorded at the average exchange rate prevailing in the period during which the transactions occur.
Outstanding balances of, foreign currency monetary items are reported using the period end rates.
Pursuant to the notification of the Companies (Accounting Standards) Amendment Rules 2009 issued by Ministry of Corporate Affairs on March 31, 2009, amending Accounting Standard – 11 (AS - 11) The Effects of Changes in Foreign Exchange Rates (revised 2003), exchange differences in respect of accounting periods commencing on or after December 7, 2006, relating to long term monetary items are dealt with in the following manner:
Suzlon Energy Limited, Annual Report 2009-10134
135
a) Exchange differences relating to long-term foreign currency monetary items, arising during the year, in so far as they relate to the acquisition of a depreciable capital asset are added to / deducted from the cost of the asset and depreciated/recovered over the balance life of the asset.
b) In other cases, such differences are accumulated in the “Foreign Currency Monetary Item Translation Difference Account” and amortised to the profit and loss account over the balance life of the long-term monetary item but not beyond March 31, 2011.
All other exchange differences are recognised as income or expense in the profit and loss account.
Non-monetary items carried in terms of historical cost denominated in a foreign currency are reported using the exchange rate at the date of the transaction; and non-monetary items which are carried at fair value or other similar valuation denominated in a foreign currency are reported using the exchange rate that existed, when the values were determined.
Exchange differences arising as a result of the above are recognised as income or expense in the profit and loss account.
Derivatives
In case of forward contracts, the difference between the forward rate and the exchange rate, being the premium or discount, at the inception of a forward exchange contract is recognised as income/expense over the life of the contract. Exchange differences on such contracts are recognised in the profit and loss account in the reporting period in which the rates change. Any profit or loss arising on cancellation or renewal of forward exchange contract is recognised as income or as expense for the period.
As per the Institute of Chartered Accountants of India ('ICAI') announcement, accounting for derivative contracts, other than those covered under AS-11, are marked to market on a portfolio basis and the net loss after considering the offsetting effect on the underlying hedge items is charged to the profit and loss account. Net gains on marked to market basis are not recognised.
Foreign operations
The financial statements of integral foreign operations are translated as if the transactions of the foreign operations have been those of the Company itself.
In translating the financial statements of a non-integral foreign operation, the assets and liabilities, both monetary and non-monetary, are translated at the closing rate; income and expense items are translated at average exchange rates prevailing during the year and all resulting exchange differences are accumulated in a foreign currency translation reserve until the disposal of the net investment in the non-integral foreign operation.
On the disposal of a non-integral foreign operation, the cumulative amount of the exchange differences which have been deferred and which relate to that operation are recognised as income or as expenses in the same period in which the gain or loss on disposal is recognised.
When there is a change in the classification of a foreign operation, the translation procedures applicable to the revised classification are applied from the date of the change in classification.
j) Borrowing costs
Borrowing costs that are directly attributable to the acquisition, construction or production of qualifying assets are capitalised as part of the cost of such assets. A qualifying asset is one that necessarily takes substantial period of time to get ready for intended use. Costs incurred in raising funds are amortised equally over the period for which the funds are acquired. All other borrowing costs are charged to profit and loss account.
k) Retirement and other employee benefits
Employee benefits in the nature of defined contributions are charged to the profit and loss account of the year when the contributions to the respective funds are due. There are no other obligations other than the contribution payable to the respective statutory authorities.
Retirement benefits in the form of gratuity and pension are defined benefit obligations, and are provided for on the basis of an actuarial valuation, using projected unit credit method as at each balance sheet date.
Short-term compensated absences are provided based on estimates. Long-term compensated absences are provided based for on the basis of an actuarial valuation, using projected unit credit method, as at each balance sheet date.
Actuarial gains/losses are taken to profit and loss account and are not deferred.
l) Provisions, contingent liabilities and contingent assets
A provision is recognised when the Group has a present obligation as a result of past events and it is probable that an outflow of resources will be required to settle the obligation, in respect of which a reliable estimate can be made. Provisions are not discounted to their present value and are determined based on the best estimate required to settle the obligation at the balance sheet date. These are reviewed at each balance sheet date and adjusted to reflect the current best estimates.
Suzlon Energy Limited, Annual Report 2009-10135
136
Contingent liabilities are disclosed by way of notes to accounts unless the possibility of an outflow is remote.
Contingent assets are not recognised or disclosed.
m) Taxes on income
Tax expense for a year comprises of current tax and deferred tax.
Current tax is measured at the amount expected to be paid to the tax authorities, after taking into consideration the applicable deductions and exemptions admissible under the applicable tax laws.
Deferred tax reflects the impact of current year timing differences between taxable income and accounting income for the year and reversal of timing difference of earlier years. Deferred tax is measured based on the tax rates and the tax laws enacted or substantively enacted at the balance sheet date. Deferred tax assets and deferred tax liabilities across various companies of operation are not set off against each other as the Group does not have a legal right to do so. All deferred tax assets are recognised only to the extent that there is reasonable certainty that sufficient future taxable income will be available against which such deferred tax assets can be realised. If there is unabsorbed depreciation or carry forward of losses under tax laws, all deferred tax assets are recognised only to the extent that there is virtual certainty supported by convincing evidence that sufficient future taxable income will be available against which such deferred tax assets can be realised.
Deferred tax resulting from timing differences which originate during the tax holiday period but are expected to reverse after such tax holiday period is recognised in the year in which the timing differences originate using the tax rates and laws enacted or substantively enacted at the balance sheet date.
At each balance sheet date, the Company reassesses unrecognised deferred tax assets. It recognises unrealised deferred tax assets to the extent it has become reasonably certain or virtually certain, as the case may be, that sufficient taxable income will be available against which the deferred tax can be realised.
The carrying amounts of deferred tax assets are reviewed at each balance sheet date. The Company writes-down the carrying amount of a deferred tax asset to the extent that it is no longer reasonably certain or virtually certain, as the case may be, that sufficient future taxable income will be available against which deferred tax asset can be realised. Any such write-down is reversed to the extent that it becomes reasonably certain or virtually certain, as the case may be, that sufficient future taxable income will be available.
Minimum alternative tax (MAT) credit, by whatever name known is recognised as an asset only when and to the extent there is convincing evidence that the Group will pay income tax higher than that computed under MAT, during the period under which MAT is permitted to be set off under the applicable tax laws. In the year, in which the MAT credit becomes eligible to be recognised as an asset, the said asset is created by way of a credit to the profit and loss account and shown as MAT credit entitlement. The Group reviews the same at each balance sheet date and writes down the carrying amount of MAT credit entitlement to the extent there is no longer convincing evidence to the effect that the Group will pay income tax higher than MAT during the specified period.
n) Operating leases
Assets acquired on lease, where a significant portion of the risks and rewards of ownership are retained by the lessor are classified as operating leases. Lease rentals are charged off to the profit and loss account as incurred.
o) Earnings per share
Basic earnings per share are calculated by dividing the net profit for the period attributable to equity shareholders (after deducting preference dividends and attributable taxes) by the weighted average number of equity shares outstanding during the period. The weighted average number of equity shares outstanding during the period are adjusted for any bonus shares issued during the year and also after the balance sheet date but before the date the financial statements are approved by the Board of Directors.
For the purpose of calculating diluted earnings per share, the net profit for the period attributable to equity shareholders and the weighted average number of shares outstanding during the period are adjusted for the effects of all dilutive potential equity shares.
The number of equity shares and potentially dilutive equity shares are adjusted for bonus shares as appropriate. The dilutive potential equity shares are adjusted for the proceeds receivable, had the shares been issued at fair value. Dilutive potential equity shares are deemed converted as of the beginning of the period, unless issued at a later date.
p) Employee Stock Options
Stock options granted to employees under the employees' stock option scheme are accounted as per the intrinsic value method permitted by the SEBI (Employee Stock Option Scheme and Employee Stock Purchase Scheme) Guidelines, 1999, and the “Guidance Note on Share Based Payments” issued by the ICAI. Accordingly, the excess of the market price of the shares as on the date of the grant of options over the exercise price is recognised as deferred employee compensation and is charged to profit and loss account on straight-line basis over the vesting period.
The number of options expected to vest is based on the best available estimate and are revised, if necessary, if subsequent information indicates that the number of stock options expected to vest differs from previous estimates.
Suzlon Energy Limited, Annual Report 2009-10136
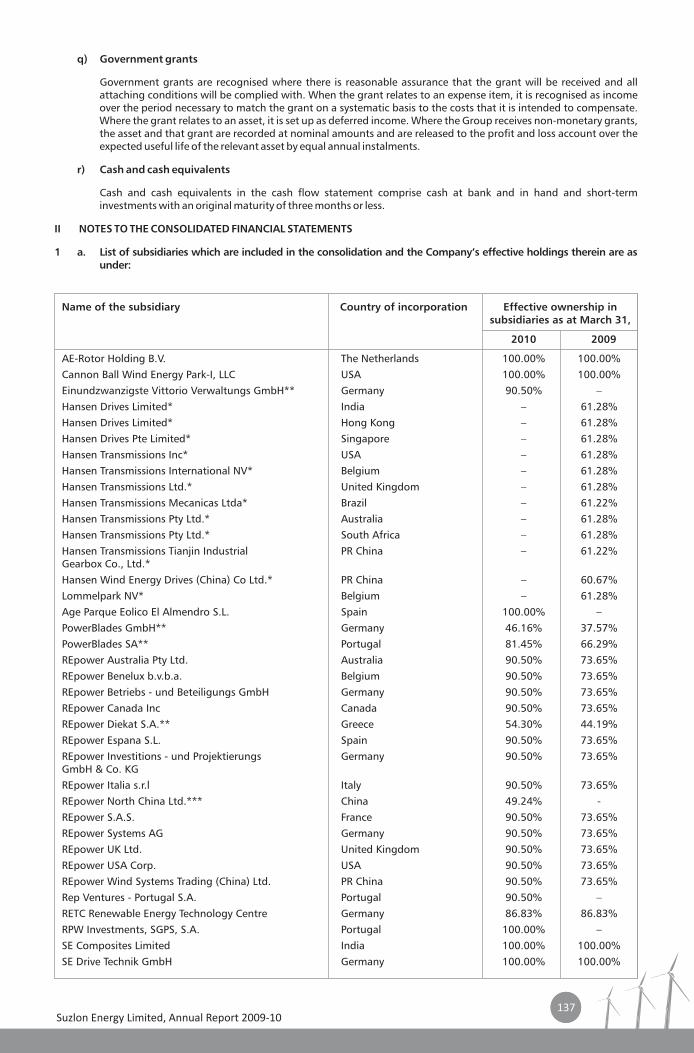
137
q) Government grants
Government grants are recognised where there is reasonable assurance that the grant will be received and all attaching conditions will be complied with. When the grant relates to an expense item, it is recognised as income over the period necessary to match the grant on a systematic basis to the costs that it is intended to compensate. Where the grant relates to an asset, it is set up as deferred income. Where the Group receives non-monetary grants, the asset and that grant are recorded at nominal amounts and are released to the profit and loss account over the expected useful life of the relevant asset by equal annual instalments.
r) Cash and cash equivalents
Cash and cash equivalents in the cash flow statement comprise cash at bank and in hand and short-term investments with an original maturity of three months or less.
II NOTES TO THE CONSOLIDATED FINANCIAL STATEMENTS
1 a. List of subsidiaries which are included in the consolidation and the Company’s effective holdings therein are as under:
Name of the subsidiary Country of incorporation Effective ownership insubsidiaries as at March 31,
2010 2009
AE-Rotor Holding B.V. The Netherlands 100.00% 100.00%Cannon Ball Wind Energy Park-I, LLC USA 100.00% 100.00%Einundzwanzigste Vittorio Verwaltungs GmbH** Germany 90.50% –Hansen Drives Limited* India – 61.28%Hansen Drives Limited* Hong Kong – 61.28%Hansen Drives Pte Limited* Singapore – 61.28%Hansen Transmissions Inc* USA – 61.28%Hansen Transmissions International NV* Belgium – 61.28%Hansen Transmissions Ltd.* United Kingdom – 61.28%Hansen Transmissions Mecanicas Ltda* Brazil – 61.22%Hansen Transmissions Pty Ltd.* Australia – 61.28%Hansen Transmissions Pty Ltd.* South Africa – 61.28%Hansen Transmissions Tianjin Industrial PR China – 61.22%Gearbox Co., Ltd.*Hansen Wind Energy Drives (China) Co Ltd.* PR China – 60.67%Lommelpark NV* Belgium – 61.28%Age Parque Eolico El Almendro S.L. Spain 100.00% –PowerBlades GmbH** Germany 46.16% 37.57%PowerBlades SA** Portugal 81.45% 66.29%REpower Australia Pty Ltd. Australia 90.50% 73.65%REpower Benelux b.v.b.a. Belgium 90.50% 73.65%REpower Betriebs - und Beteiligungs GmbH Germany 90.50% 73.65%REpower Canada Inc Canada 90.50% 73.65%REpower Diekat S.A.** Greece 54.30% 44.19%REpower Espana S.L. Spain 90.50% 73.65%REpower Investitions - und Projektierungs Germany 90.50% 73.65%GmbH & Co. KGREpower Italia s.r.l Italy 90.50% 73.65%REpower North China Ltd.*** China 49.24% -REpower S.A.S. France 90.50% 73.65%REpower Systems AG Germany 90.50% 73.65%REpower UK Ltd. United Kingdom 90.50% 73.65%REpower USA Corp. USA 90.50% 73.65%REpower Wind Systems Trading (China) Ltd. PR China 90.50% 73.65%Rep Ventures - Portugal S.A. Portugal 90.50% –RETC Renewable Energy Technology Centre Germany 86.83% 86.83%RPW Investments, SGPS, S.A. Portugal 100.00% –SE Composites Limited India 100.00% 100.00%SE Drive Technik GmbH Germany 100.00% 100.00%
Suzlon Energy Limited, Annual Report 2009-10137
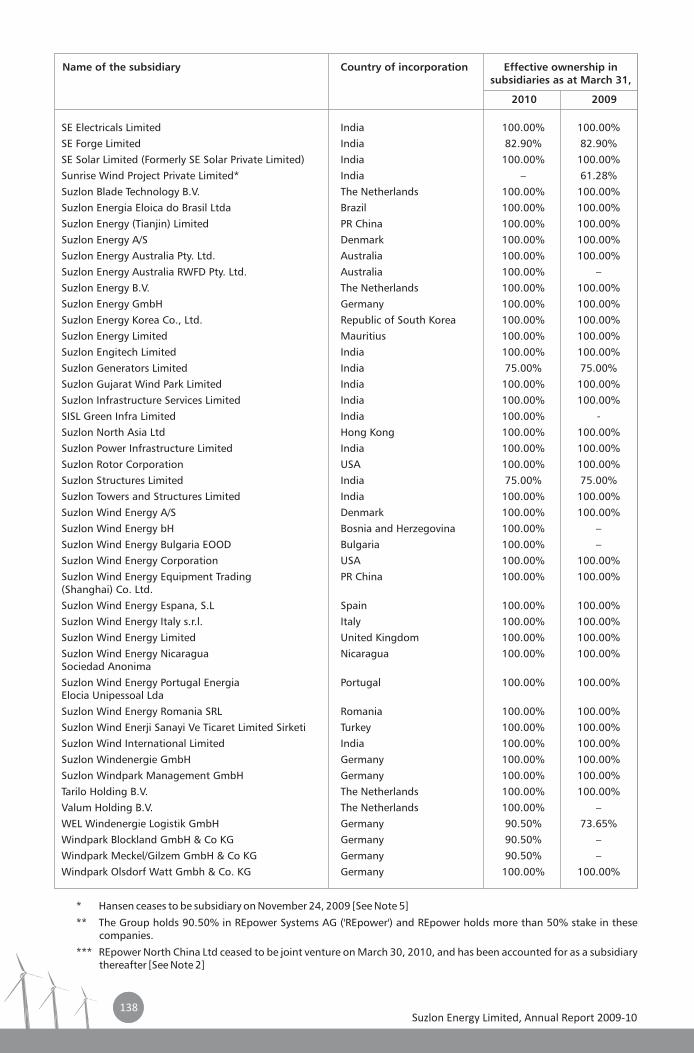
138
SE Electricals Limited India 100.00% 100.00%SE Forge Limited India 82.90% 82.90%SE Solar Limited (Formerly SE Solar Private Limited) India 100.00% 100.00%Sunrise Wind Project Private Limited* India – 61.28%Suzlon Blade Technology B.V. The Netherlands 100.00% 100.00%Suzlon Energia Eloica do Brasil Ltda Brazil 100.00% 100.00%Suzlon Energy (Tianjin) Limited PR China 100.00% 100.00%Suzlon Energy A/S Denmark 100.00% 100.00%Suzlon Energy Australia Pty. Ltd. Australia 100.00% 100.00%Suzlon Energy Australia RWFD Pty. Ltd. Australia 100.00% –Suzlon Energy B.V. The Netherlands 100.00% 100.00%Suzlon Energy GmbH Germany 100.00% 100.00%Suzlon Energy Korea Co., Ltd. Republic of South Korea 100.00% 100.00%Suzlon Energy Limited Mauritius 100.00% 100.00%Suzlon Engitech Limited India 100.00% 100.00%Suzlon Generators Limited India 75.00% 75.00%Suzlon Gujarat Wind Park Limited India 100.00% 100.00%Suzlon Infrastructure Services Limited India 100.00% 100.00%SISL Green Infra Limited India 100.00% -Suzlon North Asia Ltd Hong Kong 100.00% 100.00%Suzlon Power Infrastructure Limited India 100.00% 100.00%Suzlon Rotor Corporation USA 100.00% 100.00%Suzlon Structures Limited India 75.00% 75.00%Suzlon Towers and Structures Limited India 100.00% 100.00%Suzlon Wind Energy A/S Denmark 100.00% 100.00%Suzlon Wind Energy bH Bosnia and Herzegovina 100.00% –Suzlon Wind Energy Bulgaria EOOD Bulgaria 100.00% –Suzlon Wind Energy Corporation USA 100.00% 100.00%Suzlon Wind Energy Equipment Trading PR China 100.00% 100.00%(Shanghai) Co. Ltd.Suzlon Wind Energy Espana, S.L Spain 100.00% 100.00%Suzlon Wind Energy Italy s.r.l. Italy 100.00% 100.00%Suzlon Wind Energy Limited United Kingdom 100.00% 100.00%Suzlon Wind Energy Nicaragua Nicaragua 100.00% 100.00%Sociedad AnonimaSuzlon Wind Energy Portugal Energia Portugal 100.00% 100.00%Elocia Unipessoal LdaSuzlon Wind Energy Romania SRL Romania 100.00% 100.00%Suzlon Wind Enerji Sanayi Ve Ticaret Limited Sirketi Turkey 100.00% 100.00%Suzlon Wind International Limited India 100.00% 100.00%Suzlon Windenergie GmbH Germany 100.00% 100.00%Suzlon Windpark Management GmbH Germany 100.00% 100.00%Tarilo Holding B.V. The Netherlands 100.00% 100.00%Valum Holding B.V. The Netherlands 100.00% –WEL Windenergie Logistik GmbH Germany 90.50% 73.65%Windpark Blockland GmbH & Co KG Germany 90.50% –Windpark Meckel/Gilzem GmbH & Co KG Germany 90.50% –Windpark Olsdorf Watt Gmbh & Co. KG Germany 100.00% 100.00%
Name of the subsidiary Country of incorporation Effective ownership insubsidiaries as at March 31,
2010 2009
* Hansen ceases to be subsidiary on November 24, 2009 [See Note 5]
** The Group holds 90.50% in REpower Systems AG ('REpower') and REpower holds more than 50% stake in these companies.
*** REpower North China Ltd ceased to be joint venture on March 30, 2010, and has been accounted for as a subsidiary thereafter [See Note 2]
Suzlon Energy Limited, Annual Report 2009-10138
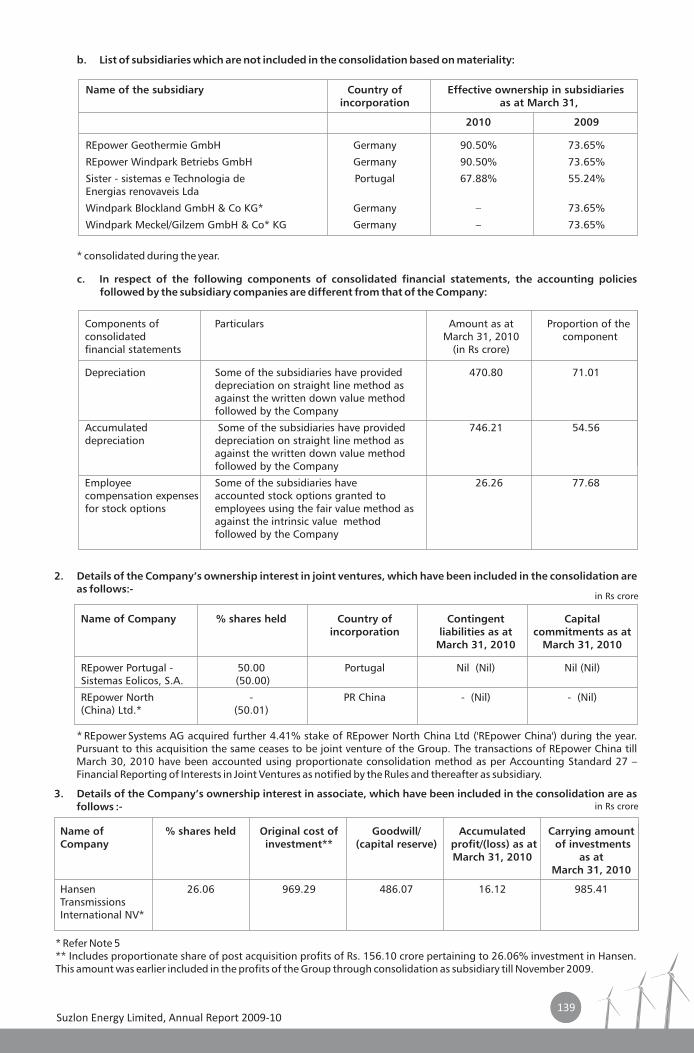
139
b. List of subsidiaries which are not included in the consolidation based on materiality:
Name of the subsidiary Country of incorporation as at March 31,
2010 2009
REpower Geothermie GmbH Germany 90.50% 73.65%
REpower Windpark Betriebs GmbH Germany 90.50% 73.65%
Sister - sistemas e Technologia de Portugal 67.88% 55.24%Energias renovaveis Lda
Windpark Blockland GmbH & Co KG* Germany – 73.65%
Windpark Meckel/Gilzem GmbH & Co* KG Germany – 73.65%
Effective ownership in subsidiaries
* consolidated during the year.
c. In respect of the following components of consolidated financial statements, the accounting policies followed by the subsidiary companies are different from that of the Company:
Components of consolidated March 31, 2010 componentfinancial statements (in Rs crore)
Depreciation Some of the subsidiaries have provided 470.80 71.01depreciation on straight line method as against the written down value method followed by the Company
Accumulated Some of the subsidiaries have provided 746.21 54.56depreciation depreciation on straight line method as
against the written down value method followed by the Company
Employee Some of the subsidiaries have 26.26 77.68compensation expenses accounted stock options granted to for stock options employees using the fair value method as
against the intrinsic value method followed by the Company
Particulars Amount as at Proportion of the
2. Details of the Company’s ownership interest in joint ventures, which have been included in the consolidation are as follows:-
Name of Company % shares held Country ofincorporation liabilities as at commitments as at
March 31, 2010 March 31, 2010
REpower Portugal - Sistemas Eolicos, S.A. (50.00)
REpower North - PR China - (Nil) - (Nil)(China) Ltd.* (50.01)
Contingent Capital
50.00 Portugal Nil (Nil) Nil (Nil)
* REpower Systems AG acquired further 4.41% stake of REpower North China Ltd ('REpower China') during the year. Pursuant to this acquisition the same ceases to be joint venture of the Group. The transactions of REpower China till March 30, 2010 have been accounted using proportionate consolidation method as per Accounting Standard 27 – Financial Reporting of Interests in Joint Ventures as notified by the Rules and thereafter as subsidiary.
3. Details of the Company’s ownership interest in associate, which have been included in the consolidation are as follows :-
Name of % shares held Original cost of Company investment** (capital reserve) profit/(loss) as at of investments
March 31, 2010 as atMarch 31, 2010
Hansen Transmissions International NV*
Goodwill/ Accumulated Carrying amount
26.06 969.29 486.07 16.12 985.41
* Refer Note 5** Includes proportionate share of post acquisition profits of Rs. 156.10 crore pertaining to 26.06% investment in Hansen. This amount was earlier included in the profits of the Group through consolidation as subsidiary till November 2009.
in R s crore
in R s crore
Suzlon Energy Limited, Annual Report 2009-10139
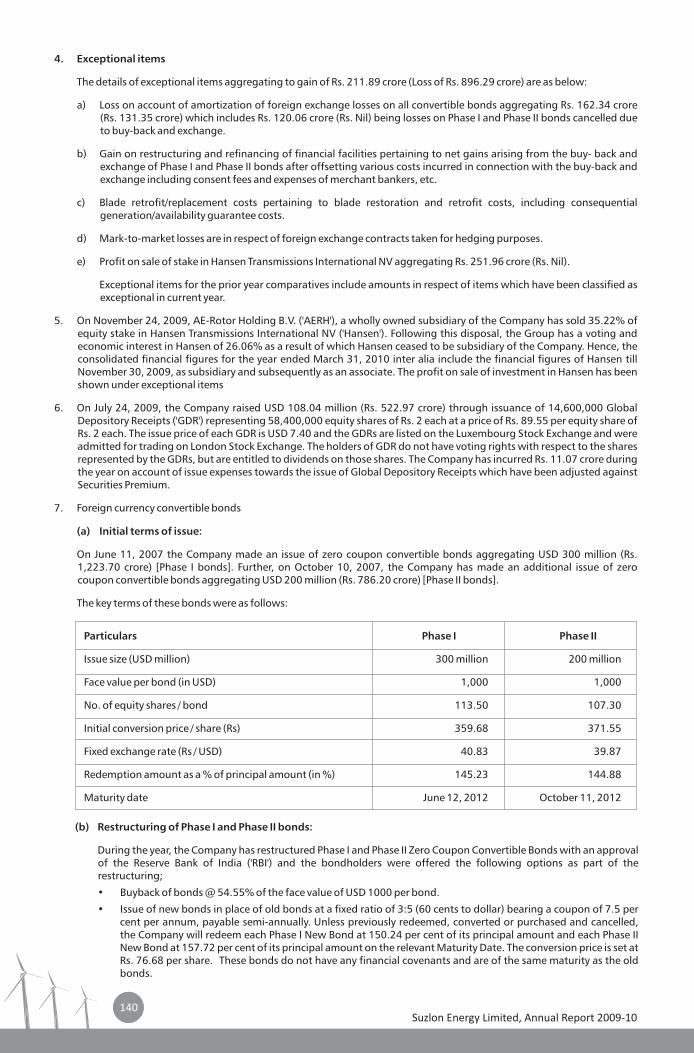
140
4. Exceptional items
The details of exceptional items aggregating to gain of Rs. 211.89 crore (Loss of Rs. 896.29 crore) are as below:
a) Loss on account of amortization of foreign exchange losses on all convertible bonds aggregating Rs. 162.34 crore (Rs. 131.35 crore) which includes Rs. 120.06 crore (Rs. Nil) being losses on Phase I and Phase II bonds cancelled due to buy-back and exchange.
b) Gain on restructuring and refinancing of financial facilities pertaining to net gains arising from the buy- back and exchange of Phase I and Phase II bonds after offsetting various costs incurred in connection with the buy-back and exchange including consent fees and expenses of merchant bankers, etc.
c) Blade retrofit/replacement costs pertaining to blade restoration and retrofit costs, including consequential generation/availability guarantee costs.
d) Mark-to-market losses are in respect of foreign exchange contracts taken for hedging purposes.
e) Profit on sale of stake in Hansen Transmissions International NV aggregating Rs. 251.96 crore (Rs. Nil).
Exceptional items for the prior year comparatives include amounts in respect of items which have been classified as exceptional in current year.
5. On November 24, 2009, AE-Rotor Holding B.V. ('AERH'), a wholly owned subsidiary of the Company has sold 35.22% of equity stake in Hansen Transmissions International NV ('Hansen'). Following this disposal, the Group has a voting and economic interest in Hansen of 26.06% as a result of which Hansen ceased to be subsidiary of the Company. Hence, the consolidated financial figures for the year ended March 31, 2010 inter alia include the financial figures of Hansen till November 30, 2009, as subsidiary and subsequently as an associate. The profit on sale of investment in Hansen has been shown under exceptional items
6. On July 24, 2009, the Company raised USD 108.04 million (Rs. 522.97 crore) through issuance of 14,600,000 Global Depository Receipts ('GDR') representing 58,400,000 equity shares of Rs. 2 each at a price of Rs. 89.55 per equity share of Rs. 2 each. The issue price of each GDR is USD 7.40 and the GDRs are listed on the Luxembourg Stock Exchange and were admitted for trading on London Stock Exchange. The holders of GDR do not have voting rights with respect to the shares represented by the GDRs, but are entitled to dividends on those shares. The Company has incurred Rs. 11.07 crore during the year on account of issue expenses towards the issue of Global Depository Receipts which have been adjusted against Securities Premium.
7. Foreign currency convertible bonds
(a) Initial terms of issue:
On June 11, 2007 the Company made an issue of zero coupon convertible bonds aggregating USD 300 million (Rs. 1,223.70 crore) [Phase I bonds]. Further, on October 10, 2007, the Company has made an additional issue of zero coupon convertible bonds aggregating USD 200 million (Rs. 786.20 crore) [Phase II bonds].
The key terms of these bonds were as follows:
Particulars Phase I Phase II
Issue size (USD million) 300 million 200 million
Face value per bond (in USD) 1,000 1,000
No. of equity shares / bond 113.50 107.30
Initial conversion price / share (Rs) 359.68 371.55
Fixed exchange rate (Rs / USD) 40.83 39.87
Redemption amount as a % of principal amount (in %) 145.23 144.88
Maturity date June 12, 2012 October 11, 2012
(b) Restructuring of Phase I and Phase II bonds:
During the year, the Company has restructured Phase I and Phase II Zero Coupon Convertible Bonds with an approval of the Reserve Bank of India ('RBI') and the bondholders were offered the following options as part of the restructuring;
• Buyback of bonds @ 54.55% of the face value of USD 1000 per bond.
• Issue of new bonds in place of old bonds at a fixed ratio of 3:5 (60 cents to dollar) bearing a coupon of 7.5 per cent per annum, payable semi-annually. Unless previously redeemed, converted or purchased and cancelled, the Company will redeem each Phase I New Bond at 150.24 per cent of its principal amount and each Phase II New Bond at 157.72 per cent of its principal amount on the relevant Maturity Date. The conversion price is set at Rs. 76.68 per share. These bonds do not have any financial covenants and are of the same maturity as the old bonds.
Suzlon Energy Limited, Annual Report 2009-10140
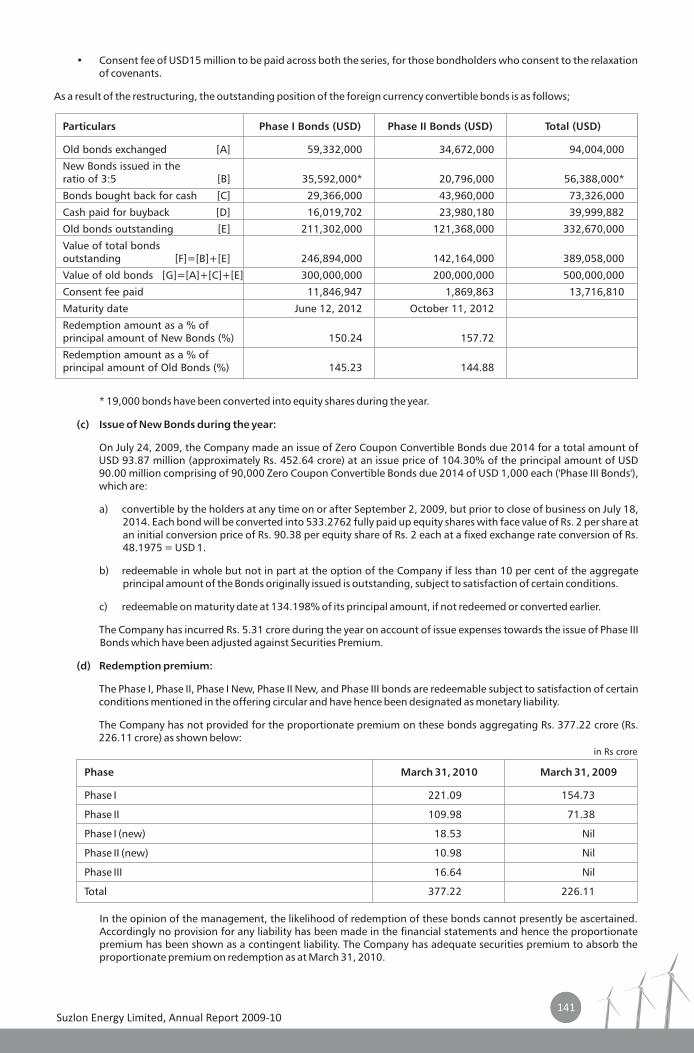
141
Consent fee of USD15 million to be paid across both the series, for those bondholders who consent to the relaxation of covenants.
As a result of the restructuring, the outstanding position of the foreign currency convertible bonds is as follows;
•
Particulars Phase I Bonds (USD) Phase II Bonds (USD) Total (USD)
Old bonds exchanged [A] 59,332,000 34,672,000 94,004,000
New Bonds issued in the ratio of 3:5 [B] 35,592,000* 20,796,000 56,388,000*
Bonds bought back for cash [C] 29,366,000 43,960,000 73,326,000
Cash paid for buyback [D] 16,019,702 23,980,180 39,999,882
Old bonds outstanding [E] 211,302,000 121,368,000 332,670,000
Value of total bonds outstanding [F]=[B]+[E] 246,894,000 142,164,000 389,058,000
Value of old bonds [G]=[A]+[C]+[E] 300,000,000 200,000,000 500,000,000
Consent fee paid 11,846,947 1,869,863 13,716,810
Maturity date June 12, 2012 October 11, 2012
Redemption amount as a % of principal amount of New Bonds (%) 150.24 157.72
Redemption amount as a % of principal amount of Old Bonds (%) 145.23 144.88
* 19,000 bonds have been converted into equity shares during the year.
(c) Issue of New Bonds during the year:
On July 24, 2009, the Company made an issue of Zero Coupon Convertible Bonds due 2014 for a total amount of USD 93.87 million (approximately Rs. 452.64 crore) at an issue price of 104.30% of the principal amount of USD 90.00 million comprising of 90,000 Zero Coupon Convertible Bonds due 2014 of USD 1,000 each ('Phase III Bonds'), which are:
a) convertible by the holders at any time on or after September 2, 2009, but prior to close of business on July 18, 2014. Each bond will be converted into 533.2762 fully paid up equity shares with face value of Rs. 2 per share at an initial conversion price of Rs. 90.38 per equity share of Rs. 2 each at a fixed exchange rate conversion of Rs. 48.1975 = USD 1.
b) redeemable in whole but not in part at the option of the Company if less than 10 per cent of the aggregate principal amount of the Bonds originally issued is outstanding, subject to satisfaction of certain conditions.
c) redeemable on maturity date at 134.198% of its principal amount, if not redeemed or converted earlier.
The Company has incurred Rs. 5.31 crore during the year on account of issue expenses towards the issue of Phase III Bonds which have been adjusted against Securities Premium.
(d) Redemption premium:
The Phase I, Phase II, Phase I New, Phase II New, and Phase III bonds are redeemable subject to satisfaction of certain conditions mentioned in the offering circular and have hence been designated as monetary liability.
The Company has not provided for the proportionate premium on these bonds aggregating Rs. 377.22 crore (Rs. 226.11 crore) as shown below:
Phase March 31, 2010 March 31, 2009
Phase I 221.09 154.73
Phase II 109.98 71.38
Phase I (new) 18.53 Nil
Phase II (new) 10.98 Nil
Phase III 16.64 Nil
Total 377.22 226.11
In the opinion of the management, the likelihood of redemption of these bonds cannot presently be ascertained. Accordingly no provision for any liability has been made in the financial statements and hence the proportionate premium has been shown as a contingent liability. The Company has adequate securities premium to absorb the proportionate premium on redemption as at March 31, 2010.
in R s crore
Suzlon Energy Limited, Annual Report 2009-10141
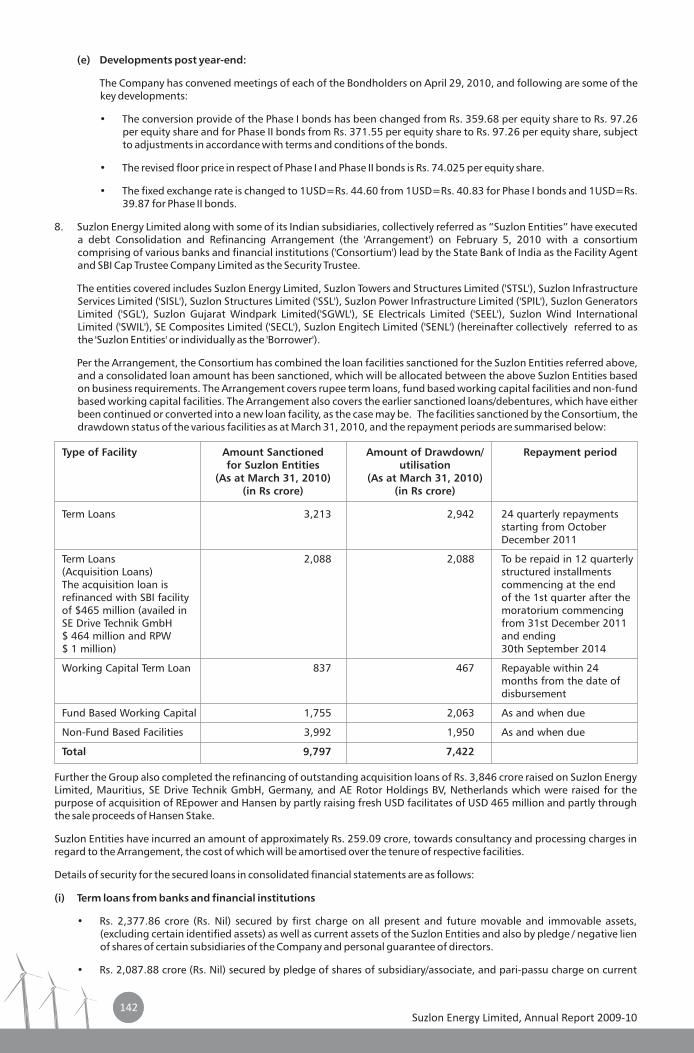
142
(e) Developments post year-end:
The Company has convened meetings of each of the Bondholders on April 29, 2010, and following are some of the key developments:
• The conversion provide of the Phase I bonds has been changed from Rs. 359.68 per equity share to Rs. 97.26 per equity share and for Phase II bonds from Rs. 371.55 per equity share to Rs. 97.26 per equity share, subject to adjustments in accordance with terms and conditions of the bonds.
• The revised floor price in respect of Phase I and Phase II bonds is Rs. 74.025 per equity share.
• The fixed exchange rate is changed to 1USD=Rs. 44.60 from 1USD=Rs. 40.83 for Phase I bonds and 1USD=Rs. 39.87 for Phase II bonds.
8. Suzlon Energy Limited along with some of its Indian subsidiaries, collectively referred as “Suzlon Entities” have executed a debt Consolidation and Refinancing Arrangement (the 'Arrangement') on February 5, 2010 with a consortium comprising of various banks and financial institutions ('Consortium') lead by the State Bank of India as the Facility Agent and SBI Cap Trustee Company Limited as the Security Trustee.
The entities covered includes Suzlon Energy Limited, Suzlon Towers and Structures Limited ('STSL'), Suzlon Infrastructure Services Limited ('SISL'), Suzlon Structures Limited ('SSL'), Suzlon Power Infrastructure Limited ('SPIL'), Suzlon Generators Limited ('SGL'), Suzlon Gujarat Windpark Limited('SGWL'), SE Electricals Limited ('SEEL'), Suzlon Wind International Limited ('SWIL'), SE Composites Limited ('SECL'), Suzlon Engitech Limited ('SENL') (hereinafter collectively referred to as the 'Suzlon Entities' or individually as the 'Borrower').
Per the Arrangement, the Consortium has combined the loan facilities sanctioned for the Suzlon Entities referred above, and a consolidated loan amount has been sanctioned, which will be allocated between the above Suzlon Entities based on business requirements. The Arrangement covers rupee term loans, fund based working capital facilities and non-fund based working capital facilities. The Arrangement also covers the earlier sanctioned loans/debentures, which have either been continued or converted into a new loan facility, as the case may be. The facilities sanctioned by the Consortium, the drawdown status of the various facilities as at March 31, 2010, and the repayment periods are summarised below:
Type of Facility Amount Sanctionedfor Suzlon Entities utilisation
(As at March 31, 2010) (As at March 31, 2010)(in Rs crore) (in Rs crore)
Term Loans 3,213 2,942 24 quarterly repaymentsstarting from October December 2011
Term Loans 2,088 2,088 To be repaid in 12 quarterly (Acquisition Loans) structured installments The acquisition loan is commencing at the endrefinanced with SBI facility of the 1st quarter after theof $465 million (availed in moratorium commencingSE Drive Technik GmbH from 31st December 2011 $ 464 million and RPW and ending $ 1 million) 30th September 2014
Working Capital Term Loan 837 467 Repayable within 24months from the date ofdisbursement
Fund Based Working Capital 1,755 2,063 As and when due
Non-Fund Based Facilities 3,992 1,950 As and when due
Total 9,797 7,422
Amount of Drawdown/ Repayment period
Further the Group also completed the refinancing of outstanding acquisition loans of Rs. 3,846 crore raised on Suzlon Energy Limited, Mauritius, SE Drive Technik GmbH, Germany, and AE Rotor Holdings BV, Netherlands which were raised for the purpose of acquisition of REpower and Hansen by partly raising fresh USD facilitates of USD 465 million and partly through the sale proceeds of Hansen Stake.
Suzlon Entities have incurred an amount of approximately Rs. 259.09 crore, towards consultancy and processing charges in regard to the Arrangement, the cost of which will be amortised over the tenure of respective facilities.
Details of security for the secured loans in consolidated financial statements are as follows:
(i) Term loans from banks and financial institutions
• Rs. 2,377.86 crore (Rs. Nil) secured by first charge on all present and future movable and immovable assets, (excluding certain identified assets) as well as current assets of the Suzlon Entities and also by pledge / negative lien of shares of certain subsidiaries of the Company and personal guarantee of directors.
• Rs. 2,087.88 crore (Rs. Nil) secured by pledge of shares of subsidiary/associate, and pari-passu charge on current
Suzlon Energy Limited, Annual Report 2009-10142
143
and future movable and immovable assets of the Suzlon entities, and corporate guarantee of the Suzlon entities.
• Rs. 1.70 crore (Rs. Nil) secured by way of first charge on WTG Assets and land and all receivables out of the income generated from WTG assets and personal guarantee of directors and corporate guarantee of the Company.
• Rs. Nil (Rs. 3,401.99 crore) secured against pledge/ negative lien on shares of certain subsidiaries and corporate guarantee of the Company.
• Rs. Nil (Rs. 1,316.65 crore) secured by way of first rank mortgage and floating charge on assets.
• Rs. Nil (Rs. 564.31 crore) secured by way of first charge on certain immovable and movable fixed assets and second charge on current assets.
• Rs. Nil (Rs. 400.00 crore) secured by way of first charge on certain immovable and movable fixed assets, second charge on current assets, first mortgage and charge on fixed asset of subsidiary and pledge of share of subsidiary.
• Rs. 263.29 crore (Rs. 94.36 crore) secured by way of charge on land and assignments of electricity proceeds.
• Rs. Nil (Rs. 80.65 crore) secured by charge on movable properties and receivables of the power generated from windmill.
• Rs. 18.13 crore (Rs. 59.00 crore) secured by way of mortgage of plant and machinery and other fixed assets, hypothecation on current assets and corporate guarantee of the Company.
• Rs. 416.64 crore (Rs. 26.17 crore) secured by way of first charge on all plant and machinery and other fixed assets and second charge on all current assets and corporate guarantee of a Group Company.
• Rs. Nil (Rs. 17.75 crore) secured by hypothecation of plant and machinery and other fixed assets.
• Rs. Nil (Rs. 11.17 crore) secured by way of first charge on certain immovable and movable fixed assets and second charge on current assets, personal guarantee of directors and corporate guarantee of the Company.
• Rs. Nil (Rs. 5.08 crore) secured by way of first charge on windmills, land, personal guarantee of directors and corporate guarantee of the Company.
• Rs. 42.97 crore (Rs. 4.86 crore) secured by way of first charge on specific plant and machinery, land, second charge on windmills and corporate guarantee of the Company.
• Rs. 35.18 crore (Rs. Nil) secured against first charge on land, building and equipments, inventory, receivables and other current assets and Corporate guarantee of the Company.
(ii) Term loans from others
• Rs. 600.00 crore (Rs. Nil) secured by first charge on all present and future movable and immovable assets, (excluding certain identified assets) as well as current assets of the Suzlon Entities and also by pledge / negative lien of shares of certain subsidiaries of the Company and personal guarantee of directors.
• Rs. 9.41 crore (Rs. 14.83 crore) secured by way of first charge on certain immovable and movable fixed assets, second charge on current assets and movable fixed assets.
• Rs. 2.13 crore (Rs. 2.92 crore) secured by charge on certain windmills, receivables of the power generation from windmills and mortgage of land.
(iii) Working capital facilities from banks and financial institutions
• Rs. 2,085.08 crore (Rs. Nil) secured by first charge on all present and future movable and immovable assets, (excluding certain identified assets) as well as current assets of the Suzlon Entities and also by pledge / negative lien of shares of certain subsidiaries of the Company and personal guarantee of directors.
• Rs. 144.01 crore (Rs. 3,898.82 crore) secured by hypothecation of inventories, book debts and other current assets, both present and future and first and second charge on certain immovable and movable fixed assets.
• Rs. 13.03 crore (Nil) secured against first charge on land, building and equipments, inventory, receivables and other current assets and Corporate guarantee of the Company.
• Rs. Nil crore (Rs. 49.04 crore) secured by hypothecation of inventories, book debts and other current assets, both present and future, second charge on certain immovable fixed assets and personal guarantee of the director.
• Rs. Nil crore (Rs. 15.20 crore) secured by lien on inventories, book debts, all deposit accounts, certain fixed assets and corporate guarantee of the Company.
• Rs. 23.31 crore (Rs. 13.20 crore) secured by hypothecation of all current assets, second charge on fixed assets and corporate guarantee of the Company.
(iv) Vehicle loan
• Rs. 2.74 crore (Rs. 0.62 crore) secured against vehicle under hire purchase contract.
Suzlon Energy Limited, Annual Report 2009-10143
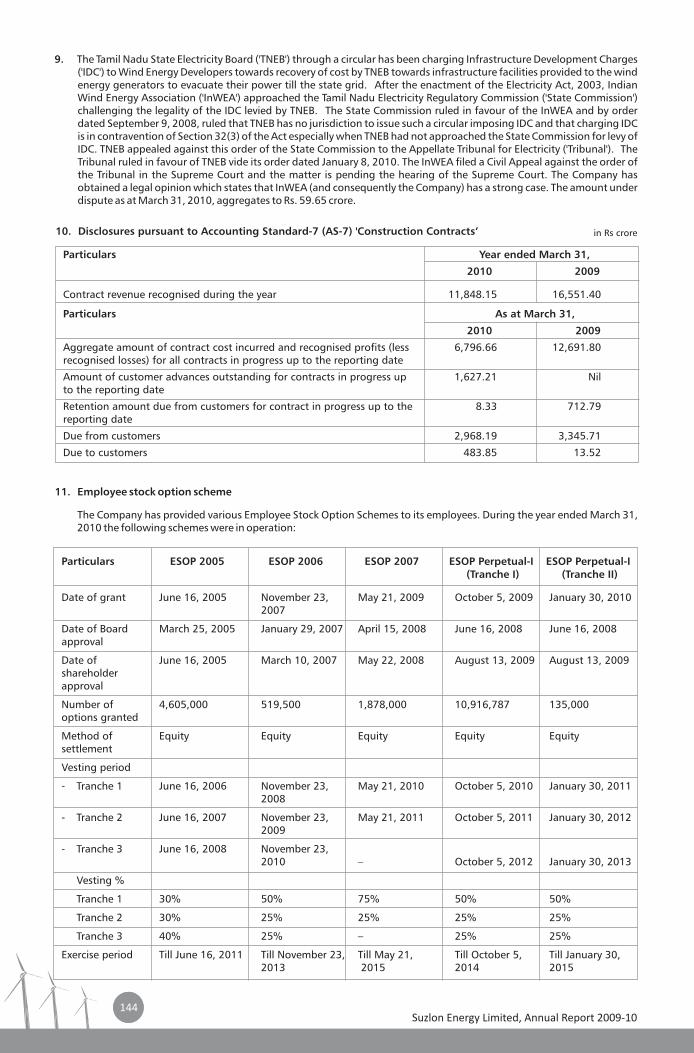
144
9. The Tamil Nadu State Electricity Board ('TNEB') through a circular has been charging Infrastructure Development Charges ('IDC') to Wind Energy Developers towards recovery of cost by TNEB towards infrastructure facilities provided to the wind energy generators to evacuate their power till the state grid. After the enactment of the Electricity Act, 2003, Indian Wind Energy Association ('InWEA') approached the Tamil Nadu Electricity Regulatory Commission ('State Commission') challenging the legality of the IDC levied by TNEB. The State Commission ruled in favour of the InWEA and by order dated September 9, 2008, ruled that TNEB has no jurisdiction to issue such a circular imposing IDC and that charging IDC is in contravention of Section 32(3) of the Act especially when TNEB had not approached the State Commission for levy of IDC. TNEB appealed against this order of the State Commission to the Appellate Tribunal for Electricity ('Tribunal'). The Tribunal ruled in favour of TNEB vide its order dated January 8, 2010. The InWEA filed a Civil Appeal against the order of the Tribunal in the Supreme Court and the matter is pending the hearing of the Supreme Court. The Company has obtained a legal opinion which states that InWEA (and consequently the Company) has a strong case. The amount under dispute as at March 31, 2010, aggregates to Rs. 59.65 crore.
10. Disclosures pursuant to Accounting Standard-7 (AS-7) 'Construction Contracts’
Particulars Year ended March 31,
2010 2009
Contract revenue recognised during the year 11,848.15 16,551.40
Particulars As at March 31,
2010 2009
Aggregate amount of contract cost incurred and recognised profits (less 6,796.66 12,691.80recognised losses) for all contracts in progress up to the reporting date
Amount of customer advances outstanding for contracts in progress up 1,627.21 Nilto the reporting date
Retention amount due from customers for contract in progress up to the 8.33 712.79reporting date
Due from customers 2,968.19 3,345.71
Due to customers 483.85 13.52
11. Employee stock option scheme
The Company has provided various Employee Stock Option Schemes to its employees. During the year ended March 31, 2010 the following schemes were in operation:
Particulars ESOP 2005 ESOP 2006 ESOP 2007 ESOP Perpetual-I (Tranche I) (Tranche II)
Date of grant June 16, 2005 November 23, 2007
Date of Board March 25, 2005 January 29, 2007 April 15, 2008 June 16, 2008 June 16, 2008approval
Date of June 16, 2005 March 10, 2007 May 22, 2008 August 13, 2009 August 13, 2009shareholderapproval
Number of 4,605,000 519,500 1,878,000 10,916,787 135,000options granted
Method of Equity Equity Equity Equity Equitysettlement
Vesting period
- Tranche 1 June 16, 2006 November 23, May 21, 2010 October 5, 2010 January 30, 20112008
- Tranche 2 June 16, 2007 November 23, May 21, 2011 October 5, 2011 January 30, 20122009
- Tranche 3 June 16, 2008 November 23, 2010 – October 5, 2012 January 30, 2013
Vesting %
Tranche 1 30% 50% 75% 50% 50%
Tranche 2 30% 25% 25% 25% 25%
Tranche 3 40% 25% – 25% 25%
Exercise period Till June 16, 2011 Till November 23, Till May 21, Till October 5, Till January 30,2013 2015 2014 2015
ESOP Perpetual-I
May 21, 2009 October 5, 2009 January 30, 2010
in R s crore
Suzlon Energy Limited, Annual Report 2009-10144
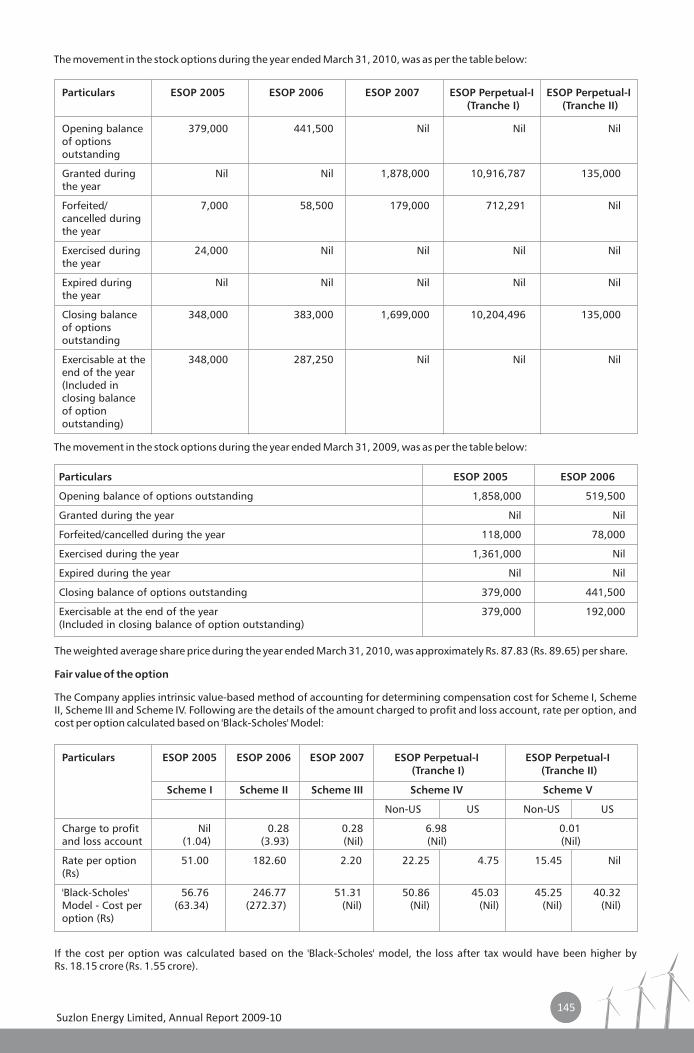
145
Particulars ESOP 2005 ESOP 2006 ESOP 2007 ESOP Perpetual-I (Tranche I) (Tranche II)
Scheme I Scheme II Scheme III Scheme IV Scheme V
Non-US US Non-US US
Charge to profit Nil 0.28 0.28 6.98 0.01and loss account (1.04) (3.93) (Nil) (Nil) (Nil)
Rate per option 51.00 182.60 2.20 22.25 4.75 15.45 Nil(Rs)
'Black-Scholes' 56.76 246.77 51.31 50.86 45.03 45.25 40.32Model - Cost per (63.34) (272.37) (Nil) (Nil) (Nil) (Nil) (Nil)option (Rs)
ESOP Perpetual-I
The movement in the stock options during the year ended March 31, 2010, was as per the table below:
Particulars ESOP 2005 ESOP 2006 ESOP 2007 ESOP Perpetual-I (Tranche I) (Tranche II)
Opening balance 379,000 441,500 Nil Nil Nilof options outstanding
Granted during Nil Nil 1,878,000 10,916,787 135,000the year
Forfeited/ 7,000 58,500 179,000 712,291 Nilcancelled during the year
Exercised during 24,000 Nil Nil Nil Nilthe year
Expired during Nil Nil Nil Nil Nilthe year
Closing balance 348,000 383,000 1,699,000 10,204,496 135,000of options outstanding
Exercisable at the 348,000 287,250 Nil Nil Nilend of the year (Included in closing balance of option outstanding)
ESOP Perpetual-I
The movement in the stock options during the year ended March 31, 2009, was as per the table below:
Particulars ESOP 2005 ESOP 2006
Opening balance of options outstanding 1,858,000 519,500
Granted during the year Nil Nil
Forfeited/cancelled during the year 118,000 78,000
Exercised during the year 1,361,000 Nil
Expired during the year Nil Nil
Closing balance of options outstanding 379,000 441,500
Exercisable at the end of the year 379,000 192,000(Included in closing balance of option outstanding)
The weighted average share price during the year ended March 31, 2010, was approximately Rs. 87.83 (Rs. 89.65) per share.
Fair value of the option
The Company applies intrinsic value-based method of accounting for determining compensation cost for Scheme I, Scheme II, Scheme III and Scheme IV. Following are the details of the amount charged to profit and loss account, rate per option, and cost per option calculated based on 'Black-Scholes' Model:
If the cost per option was calculated based on the 'Black-Scholes' model, the loss after tax would have been higher by Rs. 18.15 crore (Rs. 1.55 crore).
Suzlon Energy Limited, Annual Report 2009-10145
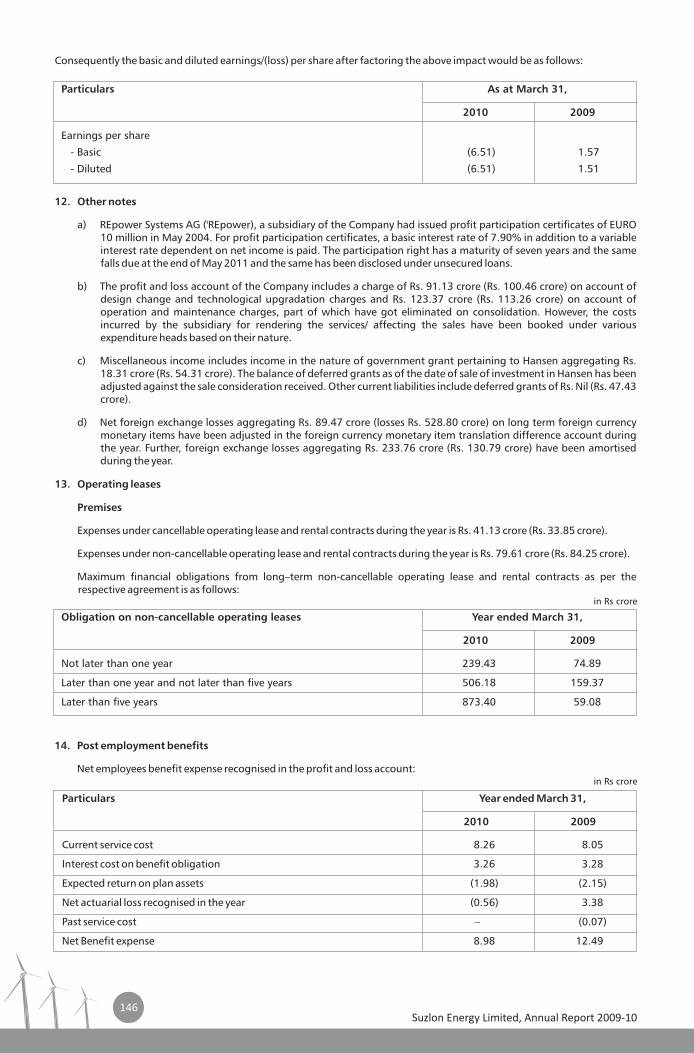
146
Consequently the basic and diluted earnings/(loss) per share after factoring the above impact would be as follows:
Particulars As at March 31,
2010 2009
Earnings per share
- Basic (6.51) 1.57
- Diluted (6.51) 1.51
12. Other notes
a) REpower Systems AG ('REpower), a subsidiary of the Company had issued profit participation certificates of EURO 10 million in May 2004. For profit participation certificates, a basic interest rate of 7.90% in addition to a variable interest rate dependent on net income is paid. The participation right has a maturity of seven years and the same falls due at the end of May 2011 and the same has been disclosed under unsecured loans.
b) The profit and loss account of the Company includes a charge of Rs. 91.13 crore (Rs. 100.46 crore) on account of design change and technological upgradation charges and Rs. 123.37 crore (Rs. 113.26 crore) on account of operation and maintenance charges, part of which have got eliminated on consolidation. However, the costs incurred by the subsidiary for rendering the services/ affecting the sales have been booked under various expenditure heads based on their nature.
c) Miscellaneous income includes income in the nature of government grant pertaining to Hansen aggregating Rs. 18.31 crore (Rs. 54.31 crore). The balance of deferred grants as of the date of sale of investment in Hansen has been adjusted against the sale consideration received. Other current liabilities include deferred grants of Rs. Nil (Rs. 47.43 crore).
d) Net foreign exchange losses aggregating Rs. 89.47 crore (losses Rs. 528.80 crore) on long term foreign currency monetary items have been adjusted in the foreign currency monetary item translation difference account during the year. Further, foreign exchange losses aggregating Rs. 233.76 crore (Rs. 130.79 crore) have been amortised during the year.
13. Operating leases
Premises
Expenses under cancellable operating lease and rental contracts during the year is Rs. 41.13 crore (Rs. 33.85 crore).
Expenses under non-cancellable operating lease and rental contracts during the year is Rs. 79.61 crore (Rs. 84.25 crore).
Maximum financial obligations from long–term non-cancellable operating lease and rental contracts as per the respective agreement is as follows:
Obligation on non-cancellable operating leases Year ended March 31,
2010 2009
Not later than one year 239.43 74.89
Later than one year and not later than five years 506.18 159.37
Later than five years 873.40 59.08
14. Post employment benefits
Net employees benefit expense recognised in the profit and loss account:
Particulars Year ended March 31,
2010 2009
Current service cost 8.26 8.05
Interest cost on benefit obligation 3.26 3.28
Expected return on plan assets (1.98) (2.15)
Net actuarial loss recognised in the year (0.56) 3.38
Past service cost – (0.07)
Net Benefit expense 8.98 12.49
in R s crore
in R s crore
Suzlon Energy Limited, Annual Report 2009-10146
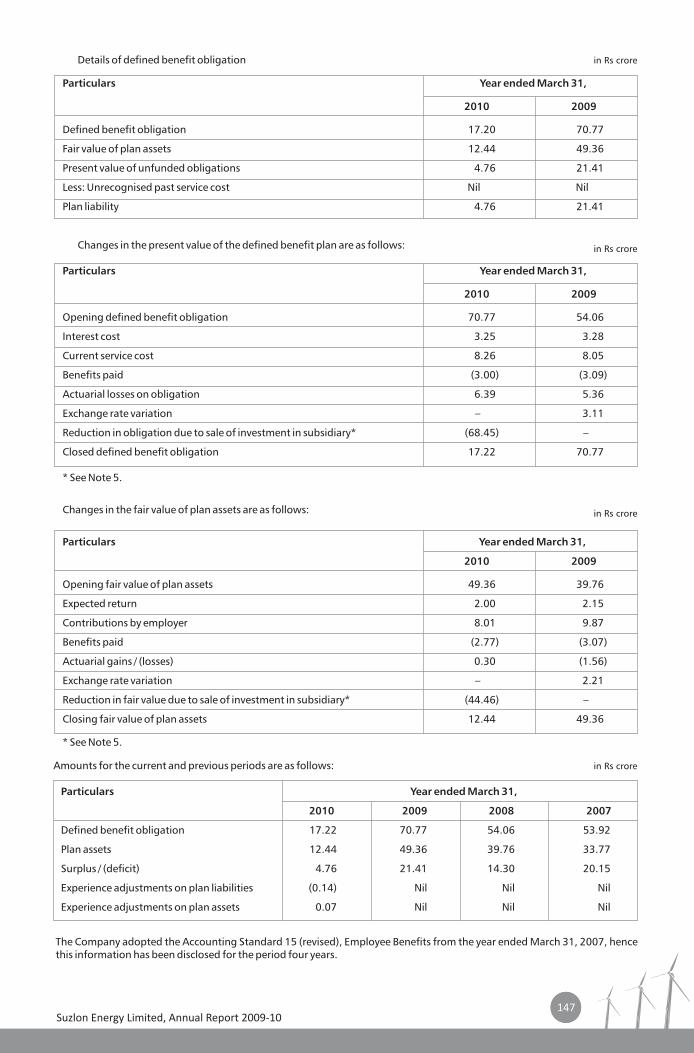
147
Details of defined benefit obligation
Particulars Year ended March 31,
2010 2009
Defined benefit obligation 17.20 70.77
Fair value of plan assets 12.44 49.36
Present value of unfunded obligations 4.76 21.41
Less: Unrecognised past service cost Nil Nil
Plan liability 4.76 21.41
Changes in the present value of the defined benefit plan are as follows:
Particulars Year ended March 31,
2010 2009
Opening defined benefit obligation 70.77 54.06
Interest cost 3.25 3.28
Current service cost 8.26 8.05
Benefits paid (3.00) (3.09)
Actuarial losses on obligation 6.39 5.36
Exchange rate variation – 3.11
Reduction in obligation due to sale of investment in subsidiary* (68.45) –
Closed defined benefit obligation 17.22 70.77
* See Note 5.
Changes in the fair value of plan assets are as follows:
Particulars Year ended March 31,
2010 2009
Opening fair value of plan assets 49.36 39.76
Expected return 2.00 2.15
Contributions by employer 8.01 9.87
Benefits paid (2.77) (3.07)
Actuarial gains / (losses) 0.30 (1.56)
Exchange rate variation – 2.21
Reduction in fair value due to sale of investment in subsidiary* (44.46) –
Closing fair value of plan assets 12.44 49.36
* See Note 5.
Amounts for the current and previous periods are as follows:
Particulars Year ended March 31,
2010 2009 2008 2007
Defined benefit obligation 17.22 70.77 54.06 53.92
Plan assets 12.44 49.36 39.76 33.77
Surplus / (deficit) 4.76 21.41 14.30 20.15
Experience adjustments on plan liabilities (0.14) Nil Nil Nil
Experience adjustments on plan assets 0.07 Nil Nil Nil
The Company adopted the Accounting Standard 15 (revised), Employee Benefits from the year ended March 31, 2007, hence this information has been disclosed for the period four years.
in R s crore
in R s crore
in R s crore
in R s crore
Suzlon Energy Limited, Annual Report 2009-10147
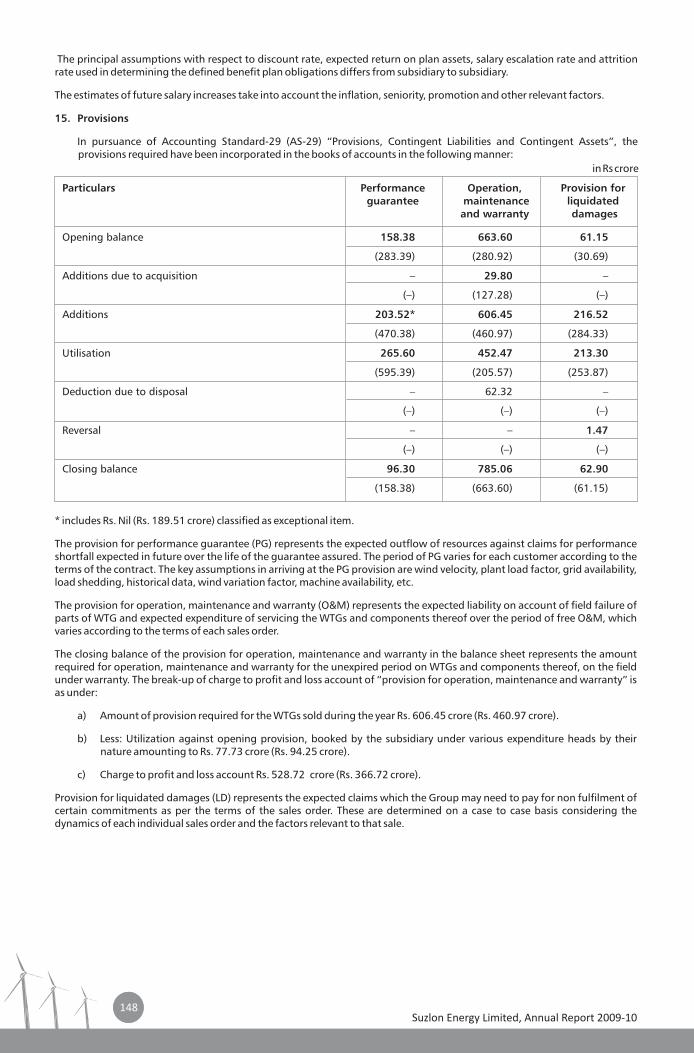
148
The principal assumptions with respect to discount rate, expected return on plan assets, salary escalation rate and attrition rate used in determining the defined benefit plan obligations differs from subsidiary to subsidiary.
The estimates of future salary increases take into account the inflation, seniority, promotion and other relevant factors.
15. Provisions
In pursuance of Accounting Standard-29 (AS-29) “Provisions, Contingent Liabilities and Contingent Assets”, the provisions required have been incorporated in the books of accounts in the following manner:
Particulars Performance guarantee maintenance liquidated
and warranty damages
Opening balance 158.38 663.60 61.15
(283.39) (280.92) (30.69)
Additions due to acquisition – 29.80 –
(–) (127.28) (–)
Additions 203.52* 606.45 216.52
(470.38) (460.97) (284.33)
Utilisation 265.60 452.47 213.30
(595.39) (205.57) (253.87)
Deduction due to disposal – 62.32 –
(–) (–) (–)
Reversal – – 1.47
(–) (–) (–)
Closing balance 96.30 785.06 62.90
(158.38) (663.60) (61.15)
Operation, Provision for
* includes Rs. Nil (Rs. 189.51 crore) classified as exceptional item.
The provision for performance guarantee (PG) represents the expected outflow of resources against claims for performance shortfall expected in future over the life of the guarantee assured. The period of PG varies for each customer according to the terms of the contract. The key assumptions in arriving at the PG provision are wind velocity, plant load factor, grid availability, load shedding, historical data, wind variation factor, machine availability, etc.
The provision for operation, maintenance and warranty (O&M) represents the expected liability on account of field failure of parts of WTG and expected expenditure of servicing the WTGs and components thereof over the period of free O&M, which varies according to the terms of each sales order.
The closing balance of the provision for operation, maintenance and warranty in the balance sheet represents the amount required for operation, maintenance and warranty for the unexpired period on WTGs and components thereof, on the field under warranty. The break-up of charge to profit and loss account of “provision for operation, maintenance and warranty” is as under:
a) Amount of provision required for the WTGs sold during the year Rs. 606.45 crore (Rs. 460.97 crore).
b) Less: Utilization against opening provision, booked by the subsidiary under various expenditure heads by their nature amounting to Rs. 77.73 crore (Rs. 94.25 crore).
c) Charge to profit and loss account Rs. 528.72 crore (Rs. 366.72 crore).
Provision for liquidated damages (LD) represents the expected claims which the Group may need to pay for non fulfilment of certain commitments as per the terms of the sales order. These are determined on a case to case basis considering the dynamics of each individual sales order and the factors relevant to that sale.
in Rs crore
Suzlon Energy Limited, Annual Report 2009-10148
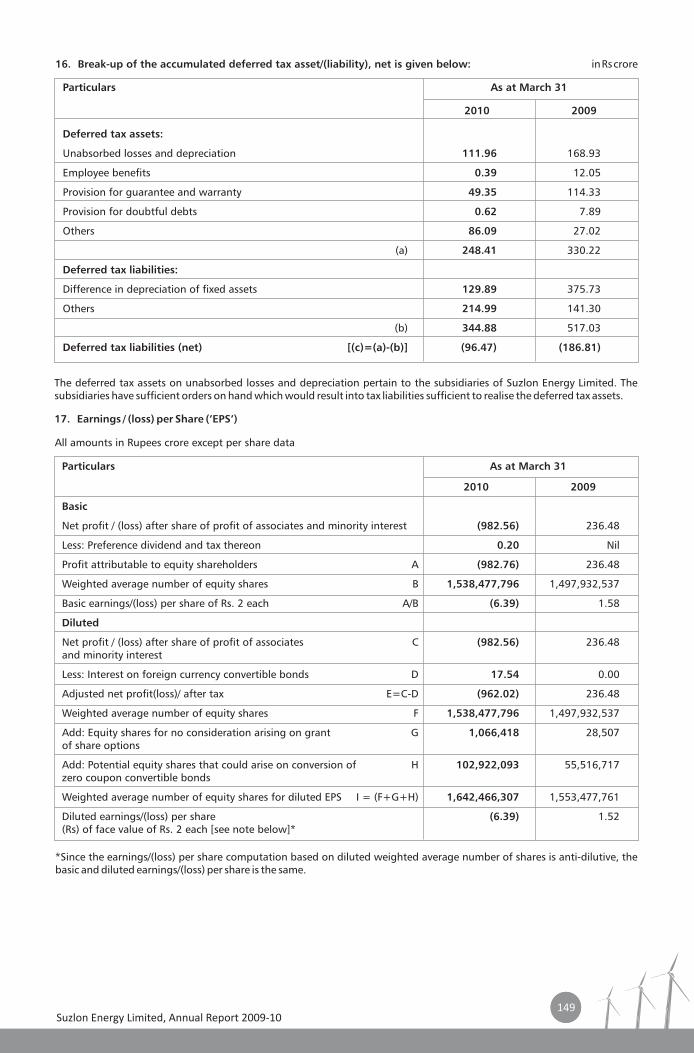
149
16. Break-up of the accumulated deferred tax asset/(liability), net is given below:
Particulars As at March 31
2010 2009
Deferred tax assets:
Unabsorbed losses and depreciation 111.96 168.93
Employee benefits 0.39 12.05
Provision for guarantee and warranty 49.35 114.33
Provision for doubtful debts 0.62 7.89
Others 86.09 27.02
(a) 248.41 330.22
Deferred tax liabilities:
Difference in depreciation of fixed assets 129.89 375.73
Others 214.99 141.30
(b) 344.88 517.03
Deferred tax liabilities (net) [(c)=(a)-(b)] (96.47) (186.81)
The deferred tax assets on unabsorbed losses and depreciation pertain to the subsidiaries of Suzlon Energy Limited. The subsidiaries have sufficient orders on hand which would result into tax liabilities sufficient to realise the deferred tax assets.
17. Earnings / (loss) per Share (’EPS’)
Particulars As at March 31
2010 2009
Basic
Net profit / (loss) after share of profit of associates and minority interest (982.56) 236.48
Less: Preference dividend and tax thereon 0.20 Nil
Profit attributable to equity shareholders A (982.76) 236.48
Weighted average number of equity shares B 1,538,477,796 1,497,932,537
Basic earnings/(loss) per share of Rs. 2 each A/B (6.39) 1.58
Diluted
Net profit / (loss) after share of profit of associates C (982.56) 236.48and minority interest
Less: Interest on foreign currency convertible bonds D 17.54 0.00
Adjusted net profit(loss)/ after tax E=C-D (962.02) 236.48
Weighted average number of equity shares F 1,538,477,796 1,497,932,537
Add: Equity shares for no consideration arising on grant G 1,066,418 28,507of share options
Add: Potential equity shares that could arise on conversion of H 102,922,093 55,516,717zero coupon convertible bonds
Weighted average number of equity shares for diluted EPS I = (F+G+H) 1,642,466,307 1,553,477,761
Diluted earnings/(loss) per share (6.39) 1.52(Rs) of face value of Rs. 2 each [see note below]*
*Since the earnings/(loss) per share computation based on diluted weighted average number of shares is anti-dilutive, the basic and diluted earnings/(loss) per share is the same.
All amounts in Rupees crore except per share data
in Rs crore
Suzlon Energy Limited, Annual Report 2009-10149
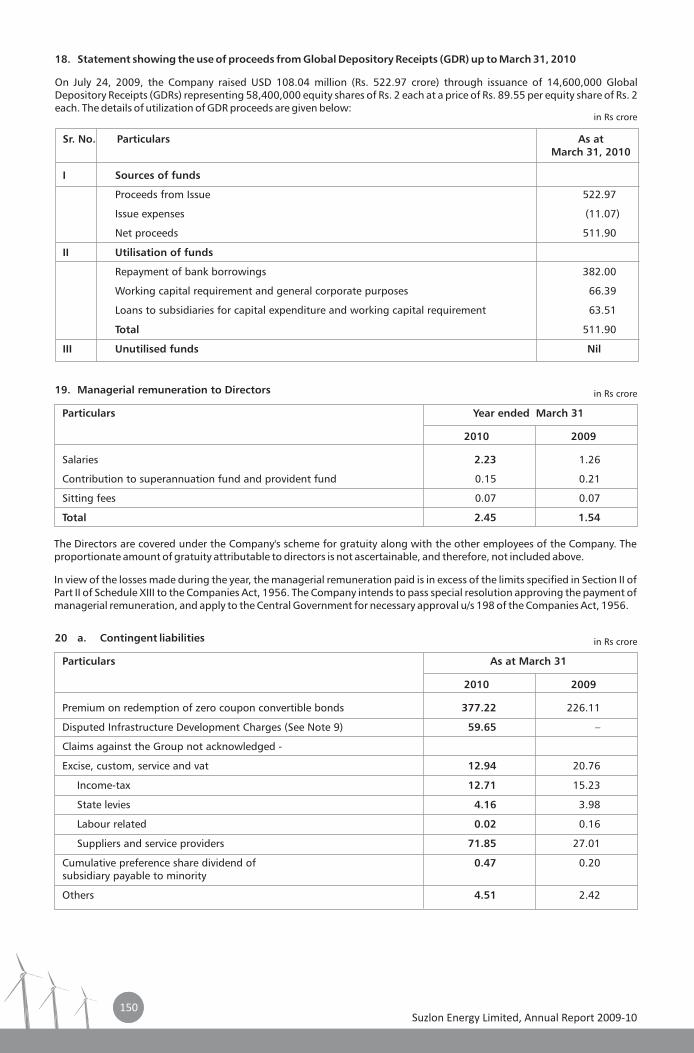
150
Sr. No. Particulars As at March 31, 2010
I Sources of funds
Proceeds from Issue 522.97
Issue expenses (11.07)
Net proceeds 511.90
II Utilisation of funds
Repayment of bank borrowings 382.00
Working capital requirement and general corporate purposes 66.39
Loans to subsidiaries for capital expenditure and working capital requirement 63.51
Total 511.90
III Unutilised funds Nil
18. Statement showing the use of proceeds from Global Depository Receipts (GDR) up to March 31, 2010
On July 24, 2009, the Company raised USD 108.04 million (Rs. 522.97 crore) through issuance of 14,600,000 Global Depository Receipts (GDRs) representing 58,400,000 equity shares of Rs. 2 each at a price of Rs. 89.55 per equity share of Rs. 2 each. The details of utilization of GDR proceeds are given below:
19. Managerial remuneration to Directors
Particulars Year ended March 31
2010 2009
Salaries 2.23 1.26
Contribution to superannuation fund and provident fund 0.15 0.21
Sitting fees 0.07 0.07
Total 2.45 1.54
The Directors are covered under the Company's scheme for gratuity along with the other employees of the Company. The proportionate amount of gratuity attributable to directors is not ascertainable, and therefore, not included above.
In view of the losses made during the year, the managerial remuneration paid is in excess of the limits specified in Section II of Part II of Schedule XIII to the Companies Act, 1956. The Company intends to pass special resolution approving the payment of managerial remuneration, and apply to the Central Government for necessary approval u/s 198 of the Companies Act, 1956.
20 a. Contingent liabilities
Particulars As at March 31
2010 2009
Premium on redemption of zero coupon convertible bonds 377.22 226.11
Disputed Infrastructure Development Charges (See Note 9) 59.65 –
Claims against the Group not acknowledged -
Excise, custom, service and vat 12.94 20.76
Income-tax 12.71 15.23
State levies 4.16 3.98
Labour related 0.02 0.16
Suppliers and service providers 71.85 27.01
Cumulative preference share dividend of 0.47 0.20subsidiary payable to minority
Others 4.51 2.42
in R s crore
in R s crore
in R s crore
Suzlon Energy Limited, Annual Report 2009-10150
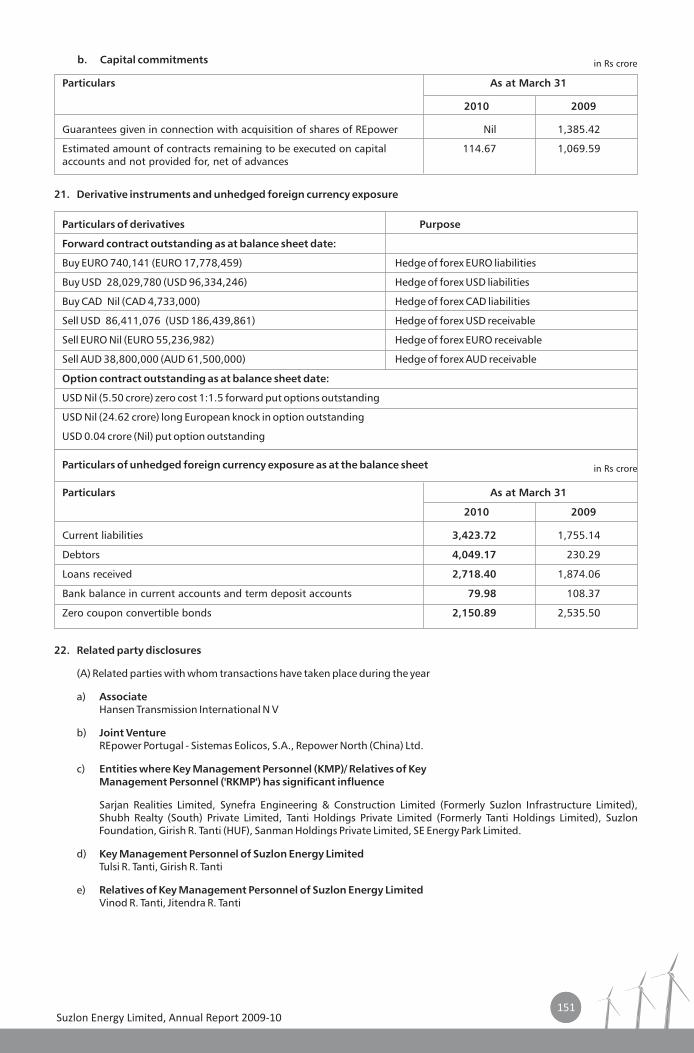
151
b. Capital commitments
Particulars As at March 31
2010 2009
Guarantees given in connection with acquisition of shares of REpower Nil 1,385.42
Estimated amount of contracts remaining to be executed on capital 114.67 1,069.59accounts and not provided for, net of advances
21. Derivative instruments and unhedged foreign currency exposure
Particulars of derivatives Purpose
Forward contract outstanding as at balance sheet date:
Buy EURO 740,141 (EURO 17,778,459) Hedge of forex EURO liabilities
Buy USD 28,029,780 (USD 96,334,246) Hedge of forex USD liabilities
Buy CAD Nil (CAD 4,733,000) Hedge of forex CAD liabilities
Sell USD 86,411,076 (USD 186,439,861) Hedge of forex USD receivable
Sell EURO Nil (EURO 55,236,982) Hedge of forex EURO receivable
Sell AUD 38,800,000 (AUD 61,500,000) Hedge of forex AUD receivable
Option contract outstanding as at balance sheet date:
USD Nil (5.50 crore) zero cost 1:1.5 forward put options outstanding
USD Nil (24.62 crore) long European knock in option outstanding
USD 0.04 crore (Nil) put option outstanding
Particulars of unhedged foreign currency exposure as at the balance sheet
Particulars As at March 31
2010 2009
Current liabilities 3,423.72 1,755.14
Debtors 4,049.17 230.29
Loans received 2,718.40 1,874.06
Bank balance in current accounts and term deposit accounts 79.98 108.37
Zero coupon convertible bonds 2,150.89 2,535.50
22. Related party disclosures
(A) Related parties with whom transactions have taken place during the year
a) AssociateHansen Transmission International N V
b) Joint VentureREpower Portugal - Sistemas Eolicos, S.A., Repower North (China) Ltd.
c) Entities where Key Management Personnel (KMP)/ Relatives of Key Management Personnel ('RKMP') has significant influence
Sarjan Realities Limited, Synefra Engineering & Construction Limited (Formerly Suzlon Infrastructure Limited), Shubh Realty (South) Private Limited, Tanti Holdings Private Limited (Formerly Tanti Holdings Limited), Suzlon Foundation, Girish R. Tanti (HUF), Sanman Holdings Private Limited, SE Energy Park Limited.
d) Key Management Personnel of Suzlon Energy LimitedTulsi R. Tanti, Girish R. Tanti
e) Relatives of Key Management Personnel of Suzlon Energy LimitedVinod R. Tanti, Jitendra R. Tanti
in R s crore
in R s crore
Suzlon Energy Limited, Annual Report 2009-10151
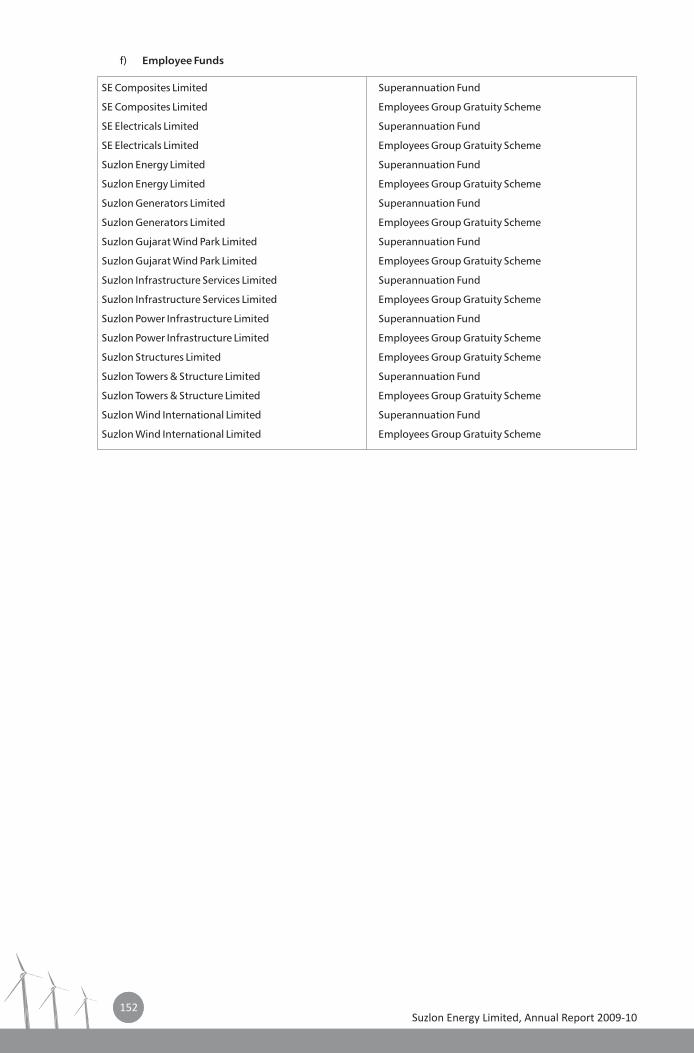
152
SE Composites Limited Superannuation Fund
SE Composites Limited Employees Group Gratuity Scheme
SE Electricals Limited Superannuation Fund
SE Electricals Limited Employees Group Gratuity Scheme
Suzlon Energy Limited Superannuation Fund
Suzlon Energy Limited Employees Group Gratuity Scheme
Suzlon Generators Limited Superannuation Fund
Suzlon Generators Limited Employees Group Gratuity Scheme
Suzlon Gujarat Wind Park Limited Superannuation Fund
Suzlon Gujarat Wind Park Limited Employees Group Gratuity Scheme
Suzlon Infrastructure Services Limited Superannuation Fund
Suzlon Infrastructure Services Limited Employees Group Gratuity Scheme
Suzlon Power Infrastructure Limited Superannuation Fund
Suzlon Power Infrastructure Limited Employees Group Gratuity Scheme
Suzlon Structures Limited Employees Group Gratuity Scheme
Suzlon Towers & Structure Limited Superannuation Fund
Suzlon Towers & Structure Limited Employees Group Gratuity Scheme
Suzlon Wind International Limited Superannuation Fund
Suzlon Wind International Limited Employees Group Gratuity Scheme
f) Employee Funds
Suzlon Energy Limited, Annual Report 2009-10152
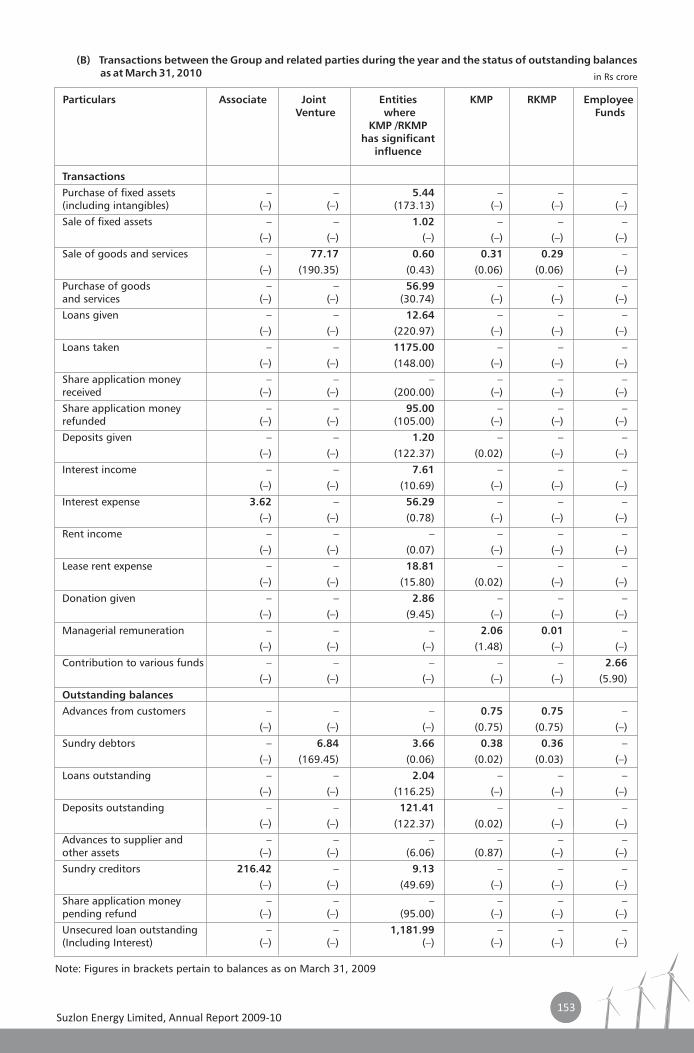
153
Transactions
Purchase of fixed assets – – 5.44 – – –(including intangibles) (–) (–) (173.13) (–) (–) (–)
Sale of fixed assets – – 1.02 – – –(–) (–) (–) (–) (–) (–)
Sale of goods and services – 77.17 0.60 0.31 0.29 –(–) (190.35) (0.43) (0.06) (0.06) (–)
Purchase of goods – – 56.99 – – –and services (–) (–) (30.74) (–) (–) (–)
Loans given – – 12.64 – – –(–) (–) (220.97) (–) (–) (–)
Loans taken – – 1175.00 – – –(–) (–) (148.00) (–) (–) (–)
Share application money – – – – – –received (–) (–) (200.00) (–) (–) (–)
Share application money – – 95.00 – – –refunded (–) (–) (105.00) (–) (–) (–)
Deposits given – – 1.20 – – –(–) (–) (122.37) (0.02) (–) (–)
Interest income – – 7.61 – – –(–) (–) (10.69) (–) (–) (–)
Interest expense 3.62 – 56.29 – – –(–) (–) (0.78) (–) (–) (–)
Rent income – – – – – –(–) (–) (0.07) (–) (–) (–)
Lease rent expense – – 18.81 – – –(–) (–) (15.80) (0.02) (–) (–)
Donation given – – 2.86 – – –(–) (–) (9.45) (–) (–) (–)
Managerial remuneration – – – 2.06 0.01 –(–) (–) (–) (1.48) (–) (–)
Contribution to various funds – – – – – 2.66
(–) (–) (–) (–) (–) (5.90)
Outstanding balances
Advances from customers – – – 0.75 0.75 –(–) (–) (–) (0.75) (0.75) (–)
Sundry debtors – 6.84 3.66 0.38 0.36 –(–) (169.45) (0.06) (0.02) (0.03) (–)
Loans outstanding – – 2.04 – – –(–) (–) (116.25) (–) (–) (–)
Deposits outstanding – – 121.41 – – –(–) (–) (122.37) (0.02) (–) (–)
Advances to supplier and – – – – – –other assets (–) (–) (6.06) (0.87) (–) (–)
Sundry creditors 216.42 – 9.13 – – –(–) (–) (49.69) (–) (–) (–)
Share application money – – – – – –pending refund (–) (–) (95.00) (–) (–) (–)
Unsecured loan outstanding – – 1,181.99 – – –(Including Interest) (–) (–) (–) (–) (–) (–)
Particulars Associate Joint Entities KMP RKMP Employee Venture where Funds
KMP /RKMPhas significant
influence
(B) Transactions between the Group and related parties during the year and the status of outstanding balances as at March 31, 2010
Note: Figures in brackets pertain to balances as on March 31, 2009
in R s crore
Suzlon Energy Limited, Annual Report 2009-10153
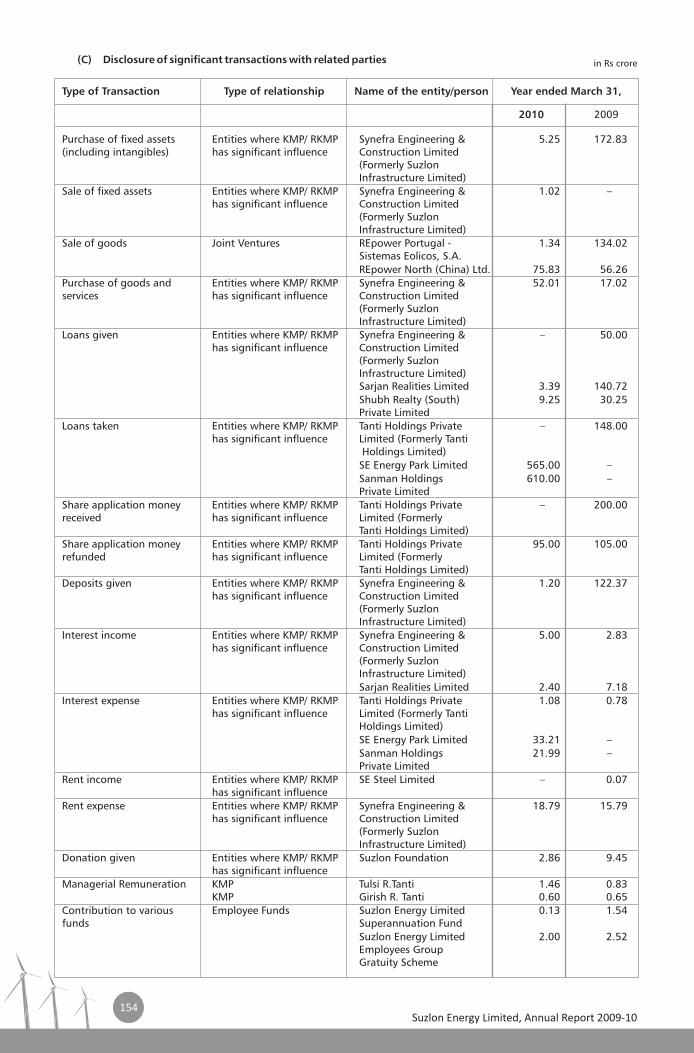
154
Purchase of fixed assets Entities where KMP/ RKMP Synefra Engineering & 5.25 172.83 (including intangibles) has significant influence Construction Limited
(Formerly Suzlon Infrastructure Limited)
Sale of fixed assets Entities where KMP/ RKMP Synefra Engineering & 1.02 –has significant influence Construction Limited
(Formerly Suzlon Infrastructure Limited)
Sale of goods Joint Ventures REpower Portugal - 1.34 134.02Sistemas Eolicos, S.A.REpower North (China) Ltd. 75.83 56.26
Purchase of goods and Entities where KMP/ RKMP Synefra Engineering & 52.01 17.02services has significant influence Construction Limited
(Formerly Suzlon Infrastructure Limited)
Loans given Entities where KMP/ RKMP Synefra Engineering & – 50.00 has significant influence Construction Limited
(Formerly Suzlon Infrastructure Limited)Sarjan Realities Limited 3.39 140.72Shubh Realty (South) 9.25 30.25 Private Limited
Loans taken Entities where KMP/ RKMP Tanti Holdings Private – 148.00has significant influence Limited (Formerly Tanti
Holdings Limited)SE Energy Park Limited 565.00 –Sanman Holdings 610.00 –Private Limited
Share application money Entities where KMP/ RKMP Tanti Holdings Private – 200.00received has significant influence Limited (Formerly
Tanti Holdings Limited)Share application money Entities where KMP/ RKMP Tanti Holdings Private 95.00 105.00refunded has significant influence Limited (Formerly
Tanti Holdings Limited)Deposits given Entities where KMP/ RKMP Synefra Engineering & 1.20 122.37
has significant influence Construction Limited (Formerly Suzlon Infrastructure Limited)
Interest income Entities where KMP/ RKMP Synefra Engineering & 5.00 2.83has significant influence Construction Limited
(Formerly Suzlon Infrastructure Limited)Sarjan Realities Limited 2.40 7.18
Interest expense Entities where KMP/ RKMP Tanti Holdings Private 1.08 0.78 has significant influence Limited (Formerly Tanti
Holdings Limited) SE Energy Park Limited 33.21 –Sanman Holdings 21.99 –Private Limited
Rent income Entities where KMP/ RKMP SE Steel Limited – 0.07has significant influence
Rent expense Entities where KMP/ RKMP Synefra Engineering & 18.79 15.79has significant influence Construction Limited
(Formerly Suzlon Infrastructure Limited)
Donation given Entities where KMP/ RKMP Suzlon Foundation 2.86 9.45has significant influence
Managerial Remuneration KMP Tulsi R.Tanti 1.46 0.83KMP Girish R. Tanti 0.60 0.65
Contribution to various Employee Funds Suzlon Energy Limited 0.13 1.54funds Superannuation Fund
Suzlon Energy Limited 2.00 2.52Employees Group Gratuity Scheme
(C) Disclosure of significant transactions with related parties
Type of Transaction Type of relationship Name of the entity/person Year ended March 31,
2010 2009
in R s crore
Suzlon Energy Limited, Annual Report 2009-10154
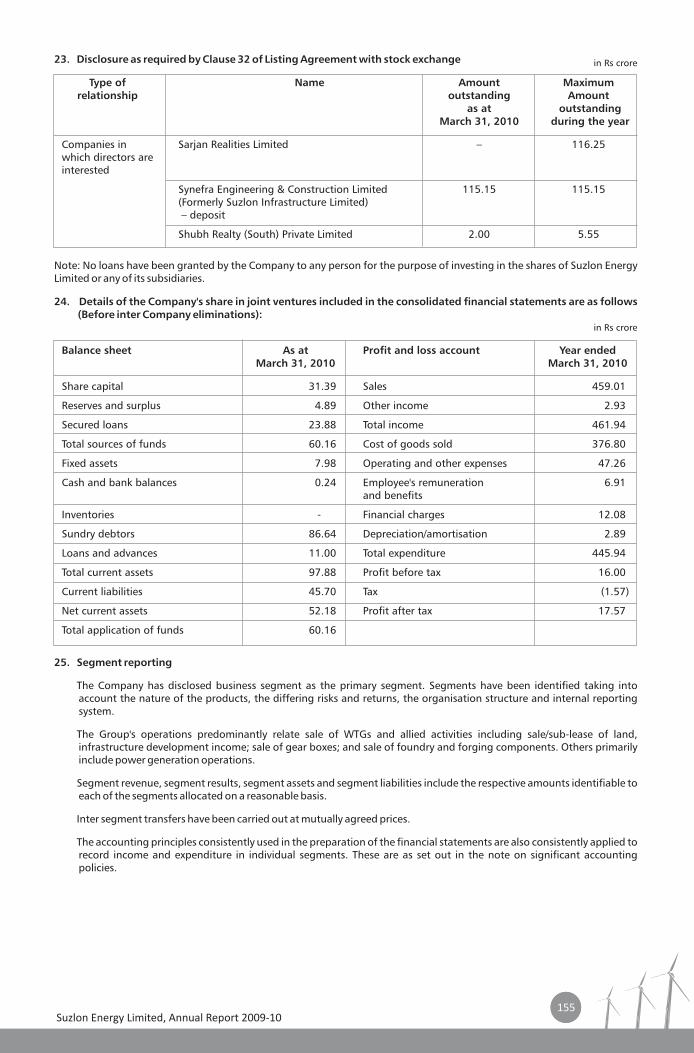
155
Balance sheet As at March 31, 2010 March 31, 2010
Share capital 31.39 Sales 459.01
Reserves and surplus 4.89 Other income 2.93
Secured loans 23.88 Total income 461.94
Total sources of funds 60.16 Cost of goods sold 376.80
Fixed assets 7.98 Operating and other expenses 47.26
Cash and bank balances 0.24 Employee's remuneration 6.91and benefits
Inventories - Financial charges 12.08
Sundry debtors 86.64 Depreciation/amortisation 2.89
Loans and advances 11.00 Total expenditure 445.94
Total current assets 97.88 Profit before tax 16.00
Current liabilities 45.70 Tax (1.57)
Net current assets 52.18 Profit after tax 17.57
Total application of funds 60.16
Profit and loss account Year ended
23. Disclosure as required by Clause 32 of Listing Agreement with stock exchange
Type of Name Amount Maximum relationship outstanding Amount
as at outstandingMarch 31, 2010 during the year
Companies in Sarjan Realities Limited – 116.25which directors are interested
Synefra Engineering & Construction Limited 115.15 115.15(Formerly Suzlon Infrastructure Limited) – deposit
Shubh Realty (South) Private Limited 2.00 5.55
Note: No loans have been granted by the Company to any person for the purpose of investing in the shares of Suzlon Energy Limited or any of its subsidiaries.
24. Details of the Company's share in joint ventures included in the consolidated financial statements are as follows (Before inter Company eliminations):
25. Segment reporting
The Company has disclosed business segment as the primary segment. Segments have been identified taking into account the nature of the products, the differing risks and returns, the organisation structure and internal reporting system.
The Group's operations predominantly relate sale of WTGs and allied activities including sale/sub-lease of land, infrastructure development income; sale of gear boxes; and sale of foundry and forging components. Others primarily include power generation operations.
Segment revenue, segment results, segment assets and segment liabilities include the respective amounts identifiable to each of the segments allocated on a reasonable basis.
Inter segment transfers have been carried out at mutually agreed prices.
The accounting principles consistently used in the preparation of the financial statements are also consistently applied to record income and expenditure in individual segments. These are as set out in the note on significant accounting policies.
in R s crore
in R s crore
Suzlon Energy Limited, Annual Report 2009-10155
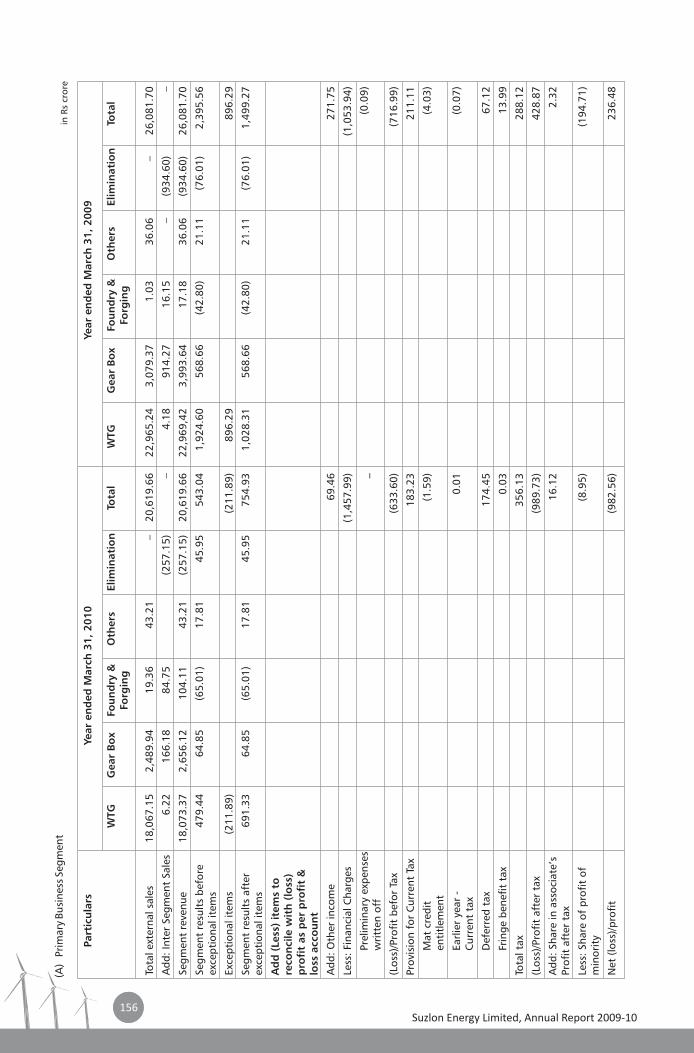
156
Part
icu
lars
Year
en
ded
Marc
h 3
1,
20
10
WTG
Gear
Bo
xFo
un
dry
&O
thers
Elim
inati
on
Tota
lW
TG
Gear
Bo
xFo
un
dry
&O
thers
Elim
inati
on
Tota
lFo
rgin
gFo
rgin
g
Year
en
ded
Marc
h 3
1, 2
00
9
(A)
Prim
ary
Busi
ness
Seg
men
t
Tota
l ext
erna
l sal
es18
,067
.15
2,48
9.94
19.3
643
.21
–20
,619
.66
22,9
65.2
43,
079.
371.
0336
.06
–26
,081
.70
Add
: Int
er S
egm
ent
Sale
s6.
2216
6.18
84.7
5(2
57.1
5)–
4.18
914.
2716
.15
–(9
34.6
0)–
Segm
ent
reve
nue
18,0
73.3
72,
656.
1210
4.11
43.2
1(2
57.1
5)20
,619
.66
22,9
69,4
23,
993.
6417
.18
36.0
6(9
34.6
0)26
,081
.70
Segm
ent
resu
lts
befo
re47
9.44
64.8
5(6
5.01
)17
.81
45.9
554
3.04
1,92
4.60
568.
66(4
2.80
)21
.11
(76.
01)
2,39
5.56
exce
ptio
nal i
tem
s
Exce
ptio
nal i
tem
s(2
11.8
9)(2
11.8
9)89
6.29
896.
29
Segm
ent
resu
lts
afte
r69
1.33
64.8
5(6
5.01
)17
.81
45.9
575
4.93
1,02
8.31
568.
66(4
2.80
)21
.11
(76.
01)
1,49
9.27
exce
ptio
nal i
tem
s
Ad
d (
Less
) it
em
s to
reco
nci
le w
ith
(lo
ss)
pro
fit
as
per
pro
fit
&
loss
acc
ou
nt
Add
: Oth
er in
com
e69
.46
271.
75
Less
: Fin
anci
al C
harg
es(1
,457
.99)
(1,0
53.9
4)
Prel
imin
ary
expe
nses
_(0
.09)
wri
tten
off
(Los
s)/P
rofit
bef
or T
ax(6
33.6
0)(7
16.9
9)
Prov
isio
n fo
r C
urre
nt T
ax18
3.23
211.
11
Mat
cre
dit
(1.5
9)(4
.03)
enti
tlem
ent
Earl
ier
year
-
0.01
(0.0
7)C
urre
nt t
ax
Def
erre
d ta
x17
4.45
67.1
2
Frin
ge b
enef
it t
ax0.
0313
.99
Tota
l tax
356.
1328
8.12
(Los
s)/P
rofi
t af
ter
tax
(989
.73)
428.
87
Add
: Sha
re in
ass
ocia
te’s
16.1
22.
32Pr
ofit
aft
er t
ax
Less
: Sha
re o
f pr
ofit
of
(8.9
5)(1
94.7
1)m
inor
ity
Net
(lo
ss)/p
rofit
(982
.56)
236.
48
in R
s cr
ore
Suzlon Energy Limited, Annual Report 2009-10156
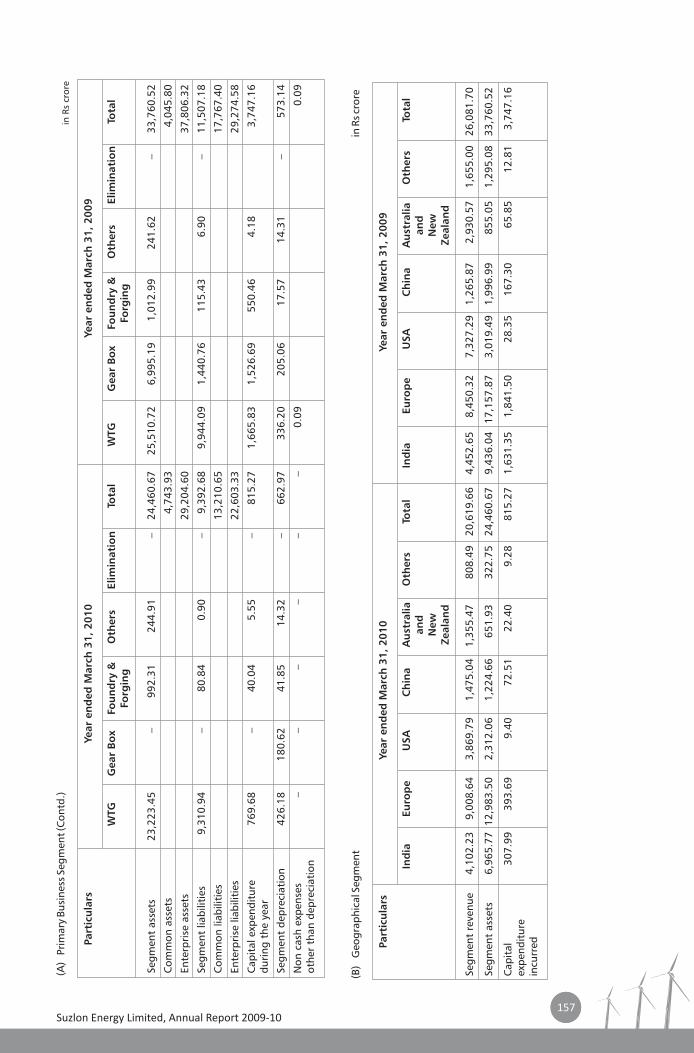
157
Segm
ent
reve
nue
4,10
2.23
9,00
8.64
3,86
9.79
1,47
5.04
1,35
5.47
808.
4920
,619
.66
4,45
2.65
8,45
0.32
7,32
7.29
1,26
5.87
2,93
0.57
1,65
5.00
26,0
81.7
0
Segm
ent
asse
ts6,
965.
7712
,983
.50
2,31
2.06
1,22
4.66
651.
9332
2.75
24,4
60.6
79,
436.
0417
,157
.87
3,01
9.49
1,99
6.99
855.
051,
295.
0833
,760
.52
Cap
ital
30
7.99
393.
699.
4072
.51
22.4
09.
2881
5.27
1,63
1.35
1,84
1.50
28.3
516
7.30
65.8
512
.81
3,74
7.16
expe
ndit
ure
incu
rredPart
icu
lars
Year
en
ded
Marc
h 3
1,
20
10
Ind
iaEu
rop
eU
SA
Ch
ina
Au
stra
lia
Oth
ers
Tota
lIn
dia
Eu
rop
eU
SA
Ch
ina
Au
stra
lia
Oth
ers
Tota
lan
dan
dN
ew
New
Zeala
nd
Zeala
nd
Year
en
ded
Marc
h 3
1, 2
00
9
(B)
Geo
grap
hica
l Seg
men
tin
Rs c
rore
Segm
ent
asse
ts23
,223
.45
–99
2.31
244.
91–
24,4
60.6
725
,510
.72
6,99
5.19
1,01
2.99
241.
62–
33,7
60.5
2
Com
mon
ass
ets
4,74
3.93
4,04
5.80
Ente
rpri
se a
sset
s29
,204
.60
37,8
06.3
2
Segm
ent
liabi
litie
s9,
310.
94–
80.8
40.
90–
9,39
2.68
9,94
4.09
1,44
0.76
115.
436.
90–
11,5
07.1
8
Com
mon
liab
iliti
es13
,210
.65
17,7
67.4
0
Ente
rpri
se li
abili
ties
22,6
03.3
329
,274
.58
Cap
ital
exp
endi
ture
76
9.68
–40
.04
5.55
–81
5.27
1,66
5.83
1,52
6.69
550.
464.
183,
747.
16du
ring
the
yea
r
Segm
ent
depr
ecia
tion
426.
1818
0.62
41.8
514
.32
–66
2.97
336.
2020
5.06
17.5
714
.31
–57
3.14
Non
cas
h ex
pens
es–
––
––
–0.
090.
09ot
her
than
dep
reci
atio
n
Part
icu
lars
Year
en
ded
Marc
h 3
1,
20
10
WTG
Gear
Bo
xFo
un
dry
&O
thers
Elim
inati
on
Tota
lW
TG
Gear
Bo
xFo
un
dry
&O
thers
Elim
inati
on
Tota
lFo
rgin
gFo
rgin
g
Year
en
ded
Marc
h 3
1, 2
00
9
(A)
Prim
ary
Busi
ness
Seg
men
t (C
ontd
.)in
R s
cror
e
Suzlon Energy Limited, Annual Report 2009-10157
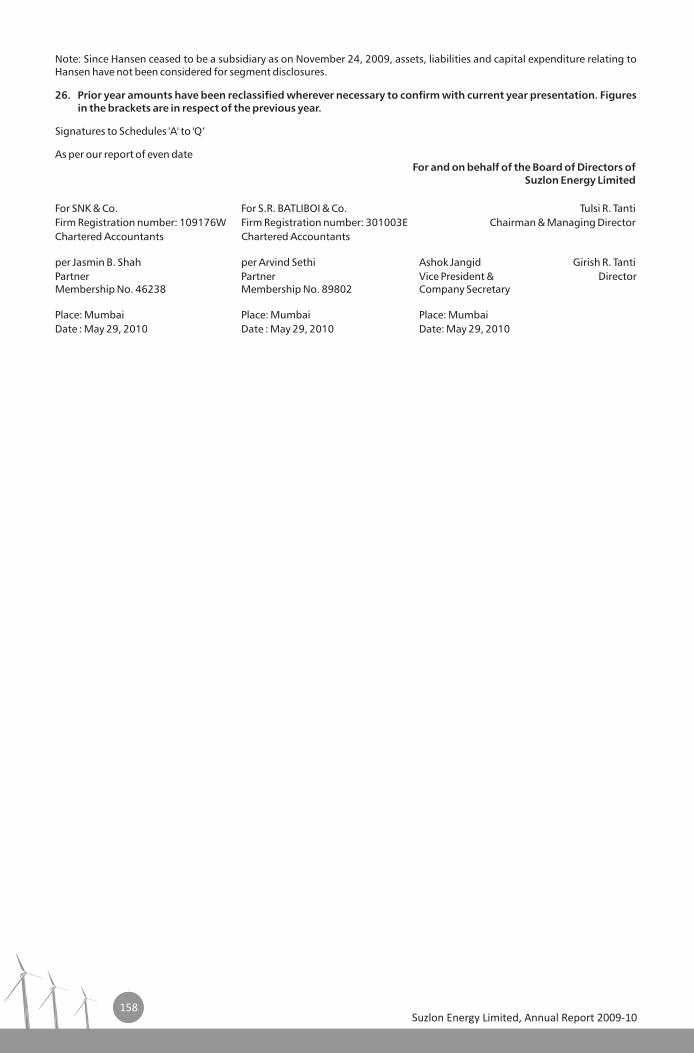
158
Note: Since Hansen ceased to be a subsidiary as on November 24, 2009, assets, liabilities and capital expenditure relating to Hansen have not been considered for segment disclosures.
26. Prior year amounts have been reclassified wherever necessary to confirm with current year presentation. Figures in the brackets are in respect of the previous year.
Signatures to Schedules 'A' to 'Q’
As per our report of even dateFor and on behalf of the Board of Directors of
Suzlon Energy Limited
For SNK & Co. For S.R. BATLIBOI & Co. Tulsi R. TantiFirm Registration number: 109176W Firm Registration number: 301003E Chairman & Managing DirectorChartered Accountants Chartered Accountants
per Jasmin B. Shah per Arvind Sethi Ashok Jangid Girish R. TantiPartner Partner Vice President & DirectorMembership No. 46238 Membership No. 89802 Company Secretary
Place: Mumbai Place: Mumbai Place: MumbaiDate : May 29, 2010 Date : May 29, 2010 Date: May 29, 2010
Suzlon Energy Limited, Annual Report 2009-10158

REGISTERED OFFICE
“Suzlon” 5, Shrimali Society,Near Shri Krishna Complex, Navrangpura, Ahmedabad - 380 009, IndiaTel.: +91-79-2647 1100Fax: +91-79-2656 5540
CORPORATE OFFICE
One Earth, Hadapsar,Pune - 411 028, IndiaTel.: +91-20-4012 2000Fax: +91-20-4012 2100
Annual Report 2009 - 10
SUSTAINING DEVELOPMENTACROSS 5 CONTINENTS.
25 COUNTRIES.
D:\DCCPC6-D_Current_Jobs\Annual Report_2k10\21000978_Suzlon_AR_2k9-2k10A
NN
UA
L REPORT 2009 - 10
SUZLO
N EN
ERGY LIM
ITED


![SUZLON ENERGY LIMITED › pdf › EGM-Notice.pdf · 1 SUZLON ENERGY LIMITED [CIN: L40100GJ1995PLC025447] Regd. Office: “Suzlon”, 5, Shrimali Society, Near Shri Krishna Complex,](https://img.pdfslide.us/doc/110x75/5f15898a520e5b2ad14d236e/suzlon-energy-limited-a-pdf-a-egm-noticepdf-1-suzlon-energy-limited-cin.jpg)