Embed Size (px)
Citation preview

RESULTS REVIEW 1QFY18 16 AUG 2017
Sonata Software BUY
HDFC securities Institutional Research is also available on Bloomberg HSLB <GO> & Thomson Reuters
On growth pathSonata delivered robust numbers in 1QFY18, International IT services (IITS) revenue grew 6.5% QoQ to USD 32.7mn ahead of our estimate of USD 31.0mn. Positive take away was recovery in OPD (30% of rev, +10.4% QoQ) and Travel (28% of rev, +10.5% QoQ). Sonata is now a preferred vendor for ‘Microsoft ISV Development Center’, which will drive growth in OPD vertical. Total Revenue stood at Rs 6.35bn down 10.4% QoQ led by weak Domestic Product & Services (DPS) revenue (Rs 4.34bn, -15.2% QoQ). IITS business strategy is to provide business solution wrapped with IPs (Rezopia, Halosys, Brick & Click and RETINA). This is a major differentiator for Sonata and is the base of its Platformation strategy. IP-Led revenue grew 15.4% QoQ to Rs 0.28bn (~14% of IITS revenue). Management is aiming of double growth in IITS business (~3% CQGR), led by OPD, Retail (Brick & Click Platform) and Travel (SAP Hybris and Rezopia) vertical. We expect IITS USD revenue to grow 13.0/13.5% in FY18/19E; IITS margin will be in the range of 17-18%. We like Sonata’s IP-focused business model, quality
balance sheet (Net cash of Rs 34/share, ~21% of Mcap), high RoE (~30%), high dividend yield (~6.0%) and reasonable valuations. Maintain BUY with a TP of Rs 200 based on 11x FY19 EPS.
Highlights of the quarter Testing, AX and BI were outliers: IMS was soft, grew
only 0.9% QoQ but is an important growth driver (+10% CQGR). Testing/AX/BI grew 19/21/7% QoQ driving 10/11% QoQ growth in OPD/Travel. Retail was weak for the second consecutive quarter (-1.7% QoQ).
Consolidated EBITDA margin was up 129bps QoQ to 7.5% due to higher margin in DPS (3.4%, +64 bps QoQ). IITS margin was down 212bps QoQ to 15.8% primarily due to currency depreciation, investments in IP’s and sales hiring.
Near-term outlook: We expect IITS revenue growth to continue in 2Q. IITS margins will recover gradually and DPS absolute EBITDA will grow despite top-line volatility. The stock is currently available at attractive valuations with decent growth potential.
Financial Summary YE Mar (Rs mn) 1QFY18 1QFY17 YoY (%) 4QFY17 QoQ (%) FY15 FY16 FY17 FY18E FY19E Net Sales 6,345 6,094 4.1 7,083 (10.4) 16,821 19,405 25,211 27,999 32,043 EBITDA 477 432 10.3 441 8.1 1,676 1,919 1,923 1,991 2,415 APAT 432 455 (5.2) 404 6.8 1,337 1,586 1,537 1,632 1,925 Diluted EPS (Rs) 4.1 4.3 (5.2) 3.8 6.8 12.7 15.1 14.6 15.5 18.3 P/E (x) 12.6 10.6 11.0 10.3 8.7 EV / EBITDA (x) 8.8 7.2 7.5 7.2 6.0 RoE (%) 33.3 35.3 31.2 30.3 32.2 Source: Company, HDFC sec Inst Research # Consolidated
INDUSTRY IT CMP (as on 16 Aug 2017) Rs 160 Target Price Rs 200 Nifty 9,897
Sensex 31,771
KEY STOCK DATA
Bloomberg/Reuters SSOF IN
No. of Shares (mn) 105
MCap (Rs bn) / ($ mn) 17/262
6m avg traded value (Rs mn) 37
STOCK PERFORMANCE (%)
52 Week high / low Rs 225 / 143
3M 6M 12M Absolute (%) 0.9 (15.4) 5.8 Relative (%) (3.8) (28.2) (7.0)
SHAREHOLDING PATTERN (%)
Promoters 30.95 FIs & Local MFs 2.13 FPIs 12.96 Public & Others 53.96 Source : BSE
Amit Chandra [email protected] +91-22-6171-7345
Apurva Prasad [email protected] +91-22-6171-7327

SONATA SOFTWARE: RESULTS REVIEW 1QFY18
Page | 2
Quarterly Consolidated Financials Snapshot Particulars 1QFY18 1QFY17 YoY (%) 4QFY17 QoQ (%) IITS Net Revenues (US $mn) 32.7 29.2 12.0 30.7 6.5 Net Revenues 6,345 6,094 4.1 7,083 (10.4) Inventory Costs 4,097 3,960 3.5 4,879 (16.0) Employee Costs 1,217 1,119 8.8 1,144 6.4 Other Operating Expenses 554 583 (4.9) 619 (10.4) EBITDA 477 432 10.3 441 8.1 Depreciation 30 24 28.2 29 6.7 EBIT 446 409 9.2 413 8.2 Interest Cost 17 43 (60.5) 11 52.9 Other Income 168 225 (25.3) 166 1.1 PBT 597 590 1.1 567 5.2 Tax 166 156 6.2 163 1.4 Minority Interest 0 0 NA 0 NA RPAT 432 455 (5.2) 404 6.8 E/o (adj for tax) 9 21 NM 56 NM APAT 422 435 (2.8) 348 21.4 Source: Company, HDFC sec Inst Research Margin Analysis Particulars 1QFY18 1QFY17 YoY (bps) 4QFY17 QoQ (bps) Inventory Cost % Net Revenue 64.6 65.0 (41) 68.9 (432) Employee Cost % Net Revenue 19.2 18.4 82 16.2 303 SG&A and Other Expenses % Net Revenues 8.7 9.6 (83) 8.7 0 EBITDA Margin (%) 7.5 7.1 42 6.2 129 EBIT Margin (%) 7.0 6.7 33 5.8 121 Tax Rate (%) 27.7 26.4 131 28.8 (104) APAT Margin (%) 6.7 7.1 (48) 4.9 174 Source: Company, HDFC sec Inst Research
IITS revenue grew 3.6% QoQ while DPS revenue declined 15.2% QoQ in INR terms. Consolidated EBITDA margin expanded due to margin expansion in DPS (+64bps QoQ to 3.4%) while IITS margins were weak (-212bps QoQ to 15.8%). IITS margin crack was primarily due to currency depreciation and few senior level sales hires IITS investments are almost complete and margin will expand with IBIS recovery (IBIS turned EBITDA positive, 5%) and higher IP revenue. PAT stood at 0.42bn up 21.4% QoQ due to higher EBITDA and lower tax rate

SONATA SOFTWARE: RESULTS REVIEW 1QFY18
Page | 3
Total Revenue (Excluding Inter-Segment) Total Revenue Contribution (%)
Source: Company, HDFC sec Inst Research Source: Company, HDFC sec Inst Research
Total EBITDA (Excluding Inter-Segment) Total EBITDA Contribution (%)
Source: Company, HDFC sec Inst Research Source: Company, HDFC sec Inst Research
DPS accounts for the bulk of revenues but contributed only 27.4% to EBITDA in FY17 DPS revenue contribution increased due to healthy growth in FY17. Mostly DPS/IITS revenue mix will be in the 70/30 ratio. IITS form the bulk of EBITDA with ~73% contribution
9.77 10.85 10.93 12.50 17.34 19.41 22.13 3.33
4.84 6.07 7.07
8.15 8.90
10.27
0
5
10
15
20
25
30
35
FY13
FY14
FY15
FY16
FY17
FY18
E
FY19
E
DPS IITS(Rs bn)
74.6 69.2 64.3 63.9 68.0 68.6 68.3
25.4 30.8 35.7 36.1 32.0 31.4 31.7
0%10%20%30%40%50%60%70%80%90%
100%
FY13
FY14
FY15
FY16
FY17
FY18
E
FY19
E
DPS IITS
0.22 0.28 0.38 0.55 0.57 0.61 0.77 0.43 0.74
1.35 1.51 1.52 1.56
1.85
0.0
0.5
1.0
1.5
2.0
2.5
3.0
FY13
FY14
FY15
FY16
FY17
FY18
E
FY19
E
DPS IITS(Rs bn)
34.1 27.6 22.0 26.6 27.4 28.0 29.5
65.9 72.4 78.0 73.4 72.6 72.0 70.5
0%10%20%30%40%50%60%70%80%90%
100%
FY13
FY14
FY15
FY16
FY17
FY18
E
FY19
E
DPS IITS

SONATA SOFTWARE: RESULTS REVIEW 1QFY18
Page | 4
IITS US$ Rev Growth Trend IITS INR Rev Growth Trend
Source: Company, HDFC sec Inst Research Source: Company, HDFC sec Inst Research
IITS EBITDA, Margin Trend
IITS Vertical Mix
Source: Company, HDFC sec Inst Research Source: Company, HDFC sec Inst Research
Management aims for USD ~200mn IITS revenue in next three years, which seems possible considering lower base, scalable top customers relationships and investment of IP’s IITS EBITDA margin is set to rise, desired level is high teens OPD, Travel and Retail form ~83% of IITS revenue. OPD is showing signs of recovery in the last two quarters Travel and Retail are the focus areas
61.2 79.2
98.3 107.8
121.4 137.2
155.7
5
10
15
20
25
30
35
10 30 50 70 90
110 130 150 170
FY13
FY14
FY15
FY16
FY17
FY18
E
FY19
E
Revenue (US$ mn) YoY growth (RHS)(US$ mn) (%, YoY)
3.35 4.84
6.07 7.07
8.15 8.90
10.27
5 10 15 20 25 30 35 40 45 50
0
2
4
6
8
10
12
FY13
FY14
FY15
FY16
FY17
FY18
E
FY19
E
Revenue (Rs bn) YoY growth (RHS)(Rs bn) (%, YoY)
0.43
0.74
1.35 1.51 1.52 1.56
1.85
9
11
13
15
17
19
21
23
25
0 0 0 1 1 1 1 1 2 2 2
FY13
FY14
FY15
FY16
FY17
FY18
E
FY19
E
EBITDA EBITDA margin (RHS)(Rs bn) (%)
37.8 37.6 36.7 30.4 30.0
31.6 30.2 29.8 31.7 27.5
0.0 13.4 15.7 20.1 25.0
30.6 18.8 17.7 17.7 17.5
0%10%20%30%40%50%60%70%80%90%
100%
FY13
FY14
FY15
FY16
FY17
OPD TTL CPG & Retail Others
SONATA SOFTWARE: RESULTS REVIEW 1QFY18
Page | 5
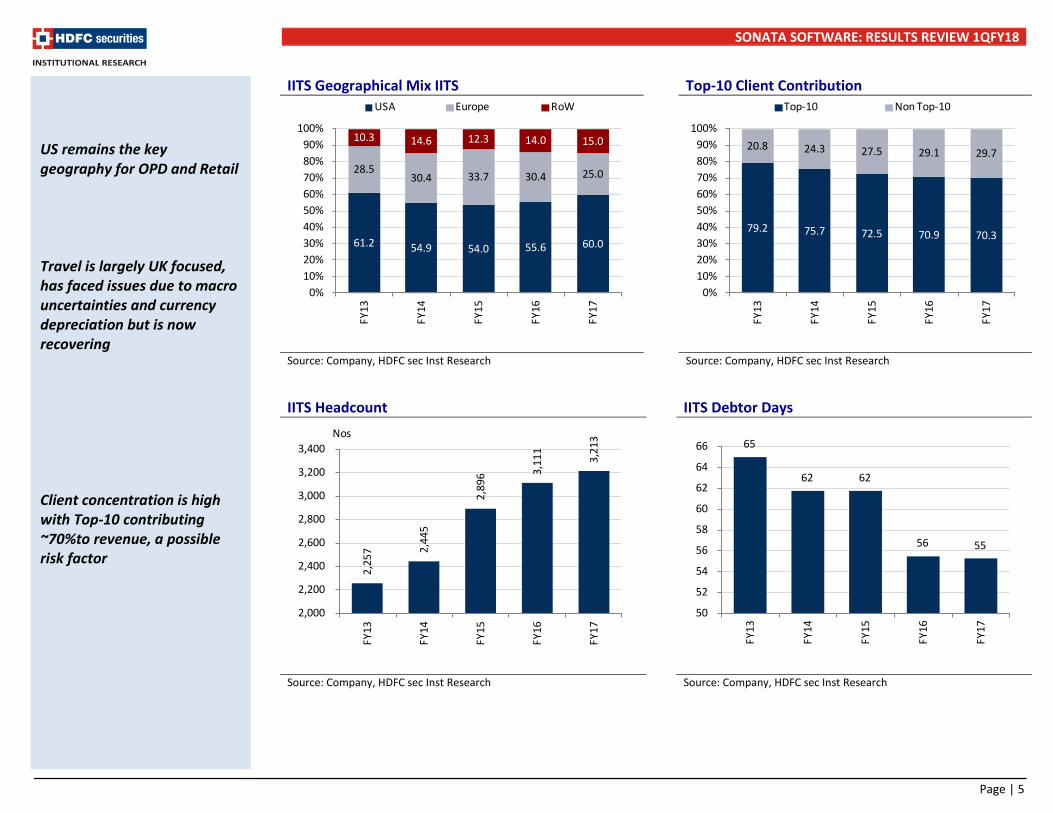
IITS Geographical Mix IITS Top-10 Client Contribution
Source: Company, HDFC sec Inst Research Source: Company, HDFC sec Inst Research
IITS Headcount IITS Debtor Days
Source: Company, HDFC sec Inst Research Source: Company, HDFC sec Inst Research
US remains the key geography for OPD and Retail Travel is largely UK focused, has faced issues due to macro uncertainties and currency depreciation but is now recovering Client concentration is high with Top-10 contributing ~70%to revenue, a possible risk factor
61.2 54.9 54.0 55.6 60.0
28.5 30.4 33.7 30.4 25.0
10.3 14.6 12.3 14.0 15.0
0%10%20%30%40%50%60%70%80%90%
100%
FY13
FY14
FY15
FY16
FY17
USA Europe RoW
79.2 75.7 72.5 70.9 70.3
20.8 24.3 27.5 29.1 29.7
0%10%20%30%40%50%60%70%80%90%
100%
FY13
FY14
FY15
FY16
FY17
Top-10 Non Top-10
2,25
7 2,44
5
2,89
6 3,11
1
3,21
3
2,000
2,200
2,400
2,600
2,800
3,000
3,200
3,400
FY13
FY14
FY15
FY16
FY17
Nos65
62 62
56 55
50
52
54
56
58
60
62
64
66
FY13
FY14
FY15
FY16
FY17
SONATA SOFTWARE: RESULTS REVIEW 1QFY18
Page | 6
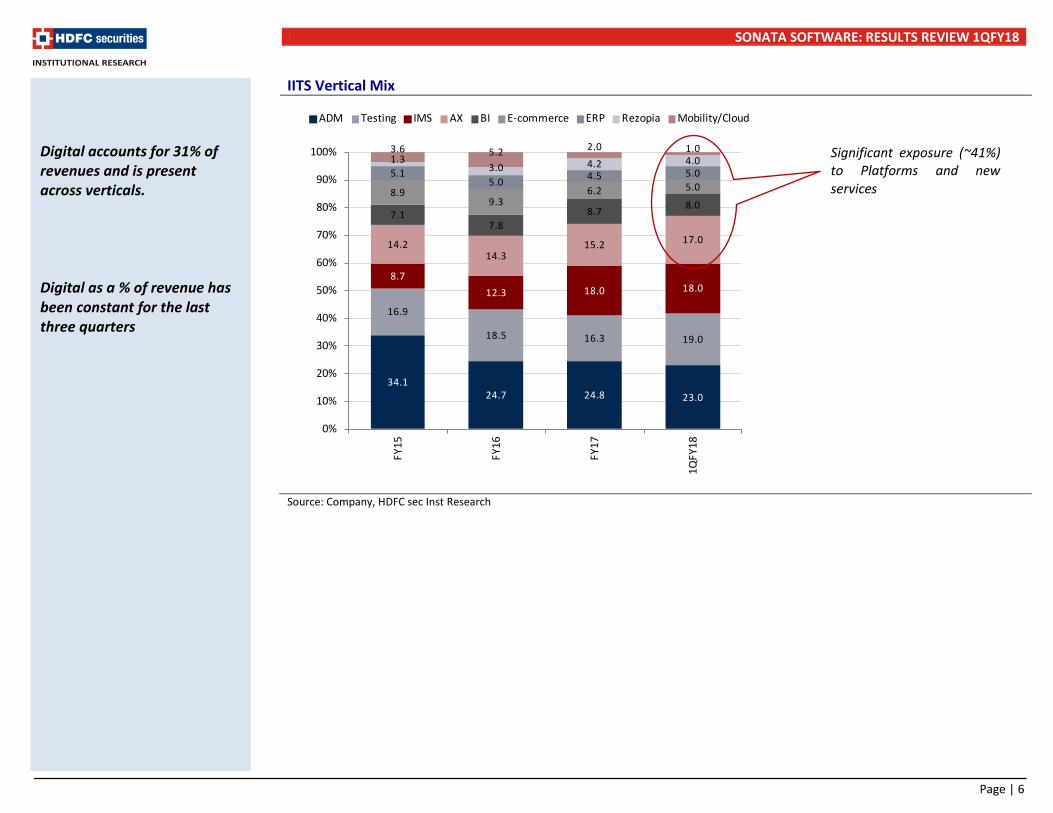
IITS Vertical Mix
Source: Company, HDFC sec Inst Research
34.1 24.7 24.8 23.0
16.9
18.5 16.3 19.0
8.7 12.3 18.0 18.0
14.2 14.3
15.2 17.0
7.1 7.8
8.7 8.0 8.9
9.3 6.2 5.0
5.1 5.0 4.5 5.0
1.3 3.0 4.2 4.0
3.6 5.2 2.0 1.0
0%
10%
20%
30%
40%
50%
60%
70%
80%
90%
100%
FY15
FY16
FY17
1QFY
18
ADM Testing IMS AX BI E-commerce ERP Rezopia Mobility/Cloud
Digital accounts for 31% of revenues and is present across verticals. Digital as a % of revenue has been constant for the last three quarters
Significant exposure (~41%) to Platforms and new services
SONATA SOFTWARE: RESULTS REVIEW 1QFY18
Page | 7
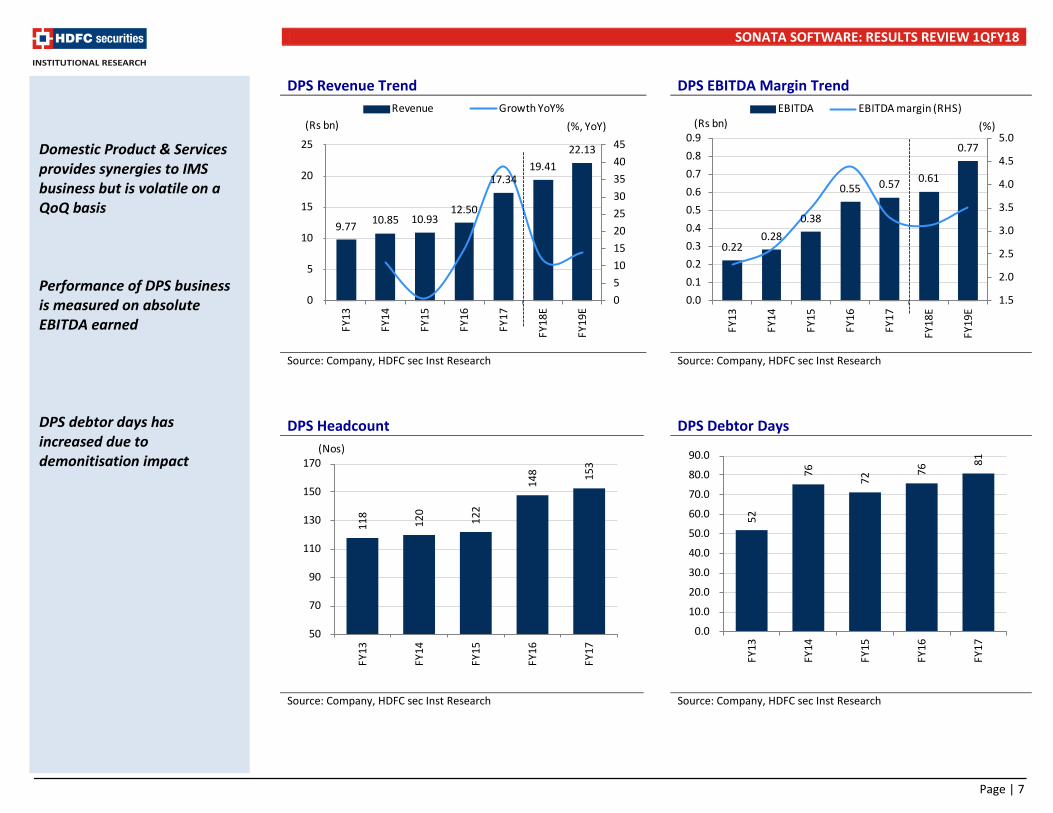
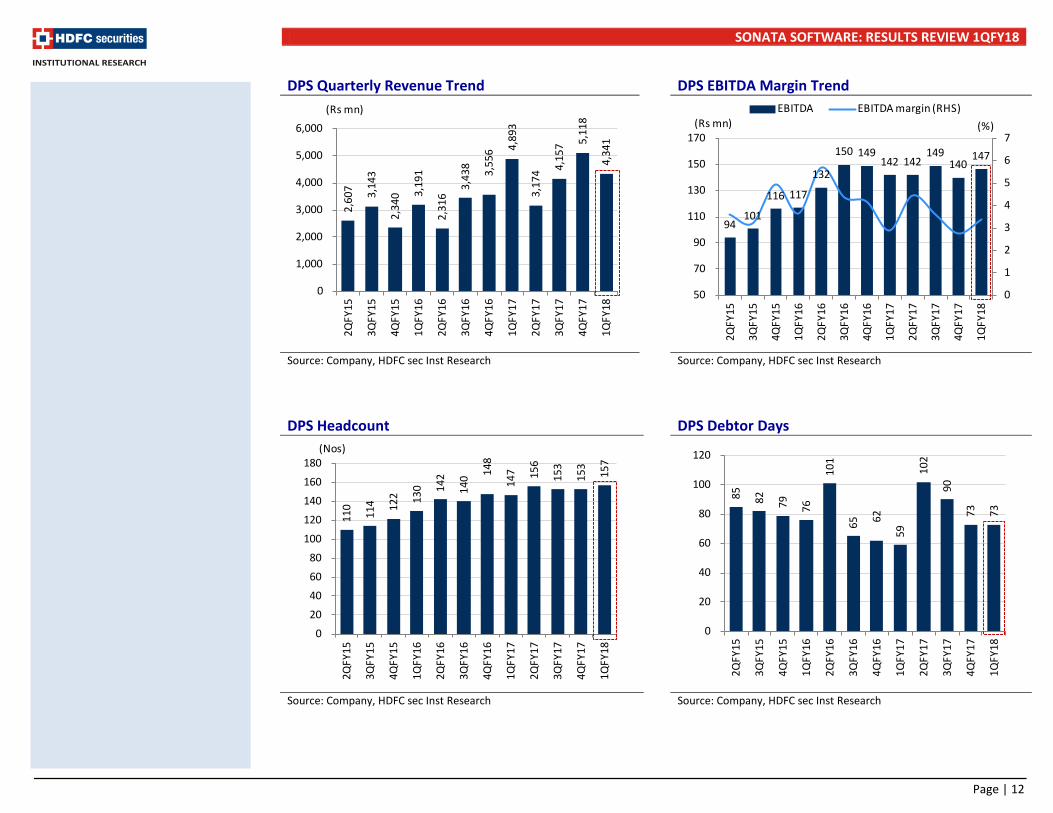
DPS Revenue Trend DPS EBITDA Margin Trend
Source: Company, HDFC sec Inst Research Source: Company, HDFC sec Inst Research
DPS Headcount DPS Debtor Days
Source: Company, HDFC sec Inst Research Source: Company, HDFC sec Inst Research
Domestic Product & Services provides synergies to IMS business but is volatile on a QoQ basis Performance of DPS business is measured on absolute EBITDA earned DPS debtor days has increased due to demonitisation impact
9.77 10.85 10.93 12.50
17.34 19.41
22.13
0 5 10 15 20 25 30 35 40 45
0
5
10
15
20
25
FY13
FY14
FY15
FY16
FY17
FY18
E
FY19
E
Revenue Growth YoY%(Rs bn) (%, YoY)
0.22 0.28
0.38
0.55 0.57 0.61
0.77
1.5
2.0
2.5
3.0
3.5
4.0
4.5
5.0
0.00.10.20.30.40.50.60.70.80.9
FY13
FY14
FY15
FY16
FY17
FY18
E
FY19
E
EBITDA EBITDA margin (RHS)(Rs bn) (%)
118
120
122
148 15
3
50
70
90
110
130
150
170
FY13
FY14
FY15
FY16
FY17
(Nos)
52
76
72
76
81
0.0
10.0
20.0
30.0
40.0
50.0
60.0
70.0
80.0
90.0
FY13
FY14
FY15
FY16
FY17
SONATA SOFTWARE: RESULTS REVIEW 1QFY18
Page | 8
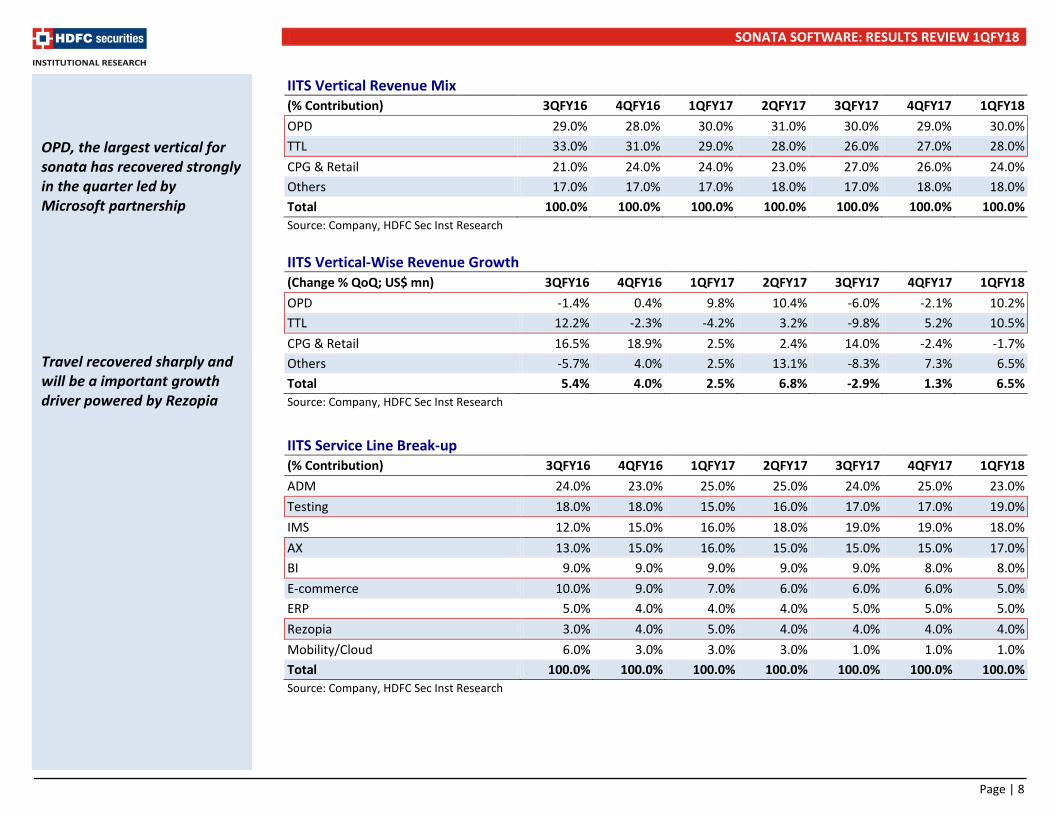
IITS Vertical Revenue Mix (% Contribution) 3QFY16 4QFY16 1QFY17 2QFY17 3QFY17 4QFY17 1QFY18 OPD 29.0% 28.0% 30.0% 31.0% 30.0% 29.0% 30.0% TTL 33.0% 31.0% 29.0% 28.0% 26.0% 27.0% 28.0% CPG & Retail 21.0% 24.0% 24.0% 23.0% 27.0% 26.0% 24.0% Others 17.0% 17.0% 17.0% 18.0% 17.0% 18.0% 18.0% Total 100.0% 100.0% 100.0% 100.0% 100.0% 100.0% 100.0% Source: Company, HDFC Sec Inst Research IITS Vertical-Wise Revenue Growth (Change % QoQ; US$ mn) 3QFY16 4QFY16 1QFY17 2QFY17 3QFY17 4QFY17 1QFY18 OPD -1.4% 0.4% 9.8% 10.4% -6.0% -2.1% 10.2% TTL 12.2% -2.3% -4.2% 3.2% -9.8% 5.2% 10.5% CPG & Retail 16.5% 18.9% 2.5% 2.4% 14.0% -2.4% -1.7% Others -5.7% 4.0% 2.5% 13.1% -8.3% 7.3% 6.5% Total 5.4% 4.0% 2.5% 6.8% -2.9% 1.3% 6.5% Source: Company, HDFC Sec Inst Research
IITS Service Line Break-up (% Contribution) 3QFY16 4QFY16 1QFY17 2QFY17 3QFY17 4QFY17 1QFY18 ADM 24.0% 23.0% 25.0% 25.0% 24.0% 25.0% 23.0% Testing 18.0% 18.0% 15.0% 16.0% 17.0% 17.0% 19.0% IMS 12.0% 15.0% 16.0% 18.0% 19.0% 19.0% 18.0% AX 13.0% 15.0% 16.0% 15.0% 15.0% 15.0% 17.0% BI 9.0% 9.0% 9.0% 9.0% 9.0% 8.0% 8.0% E-commerce 10.0% 9.0% 7.0% 6.0% 6.0% 6.0% 5.0% ERP 5.0% 4.0% 4.0% 4.0% 5.0% 5.0% 5.0% Rezopia 3.0% 4.0% 5.0% 4.0% 4.0% 4.0% 4.0% Mobility/Cloud 6.0% 3.0% 3.0% 3.0% 1.0% 1.0% 1.0% Total 100.0% 100.0% 100.0% 100.0% 100.0% 100.0% 100.0% Source: Company, HDFC Sec Inst Research
OPD, the largest vertical for sonata has recovered strongly in the quarter led by Microsoft partnership Travel recovered sharply and will be a important growth driver powered by Rezopia
SONATA SOFTWARE: RESULTS REVIEW 1QFY18
Page | 9
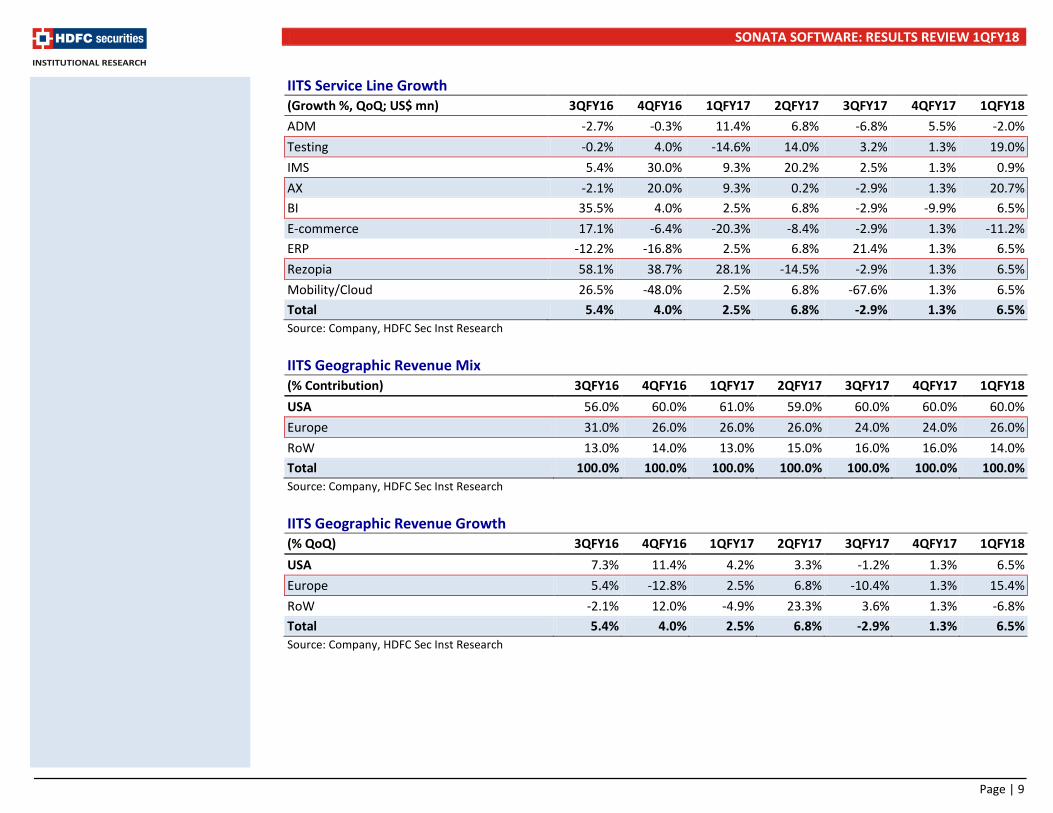
IITS Service Line Growth (Growth %, QoQ; US$ mn) 3QFY16 4QFY16 1QFY17 2QFY17 3QFY17 4QFY17 1QFY18 ADM -2.7% -0.3% 11.4% 6.8% -6.8% 5.5% -2.0% Testing -0.2% 4.0% -14.6% 14.0% 3.2% 1.3% 19.0% IMS 5.4% 30.0% 9.3% 20.2% 2.5% 1.3% 0.9% AX -2.1% 20.0% 9.3% 0.2% -2.9% 1.3% 20.7% BI 35.5% 4.0% 2.5% 6.8% -2.9% -9.9% 6.5% E-commerce 17.1% -6.4% -20.3% -8.4% -2.9% 1.3% -11.2% ERP -12.2% -16.8% 2.5% 6.8% 21.4% 1.3% 6.5% Rezopia 58.1% 38.7% 28.1% -14.5% -2.9% 1.3% 6.5% Mobility/Cloud 26.5% -48.0% 2.5% 6.8% -67.6% 1.3% 6.5% Total 5.4% 4.0% 2.5% 6.8% -2.9% 1.3% 6.5% Source: Company, HDFC Sec Inst Research IITS Geographic Revenue Mix (% Contribution) 3QFY16 4QFY16 1QFY17 2QFY17 3QFY17 4QFY17 1QFY18 USA 56.0% 60.0% 61.0% 59.0% 60.0% 60.0% 60.0% Europe 31.0% 26.0% 26.0% 26.0% 24.0% 24.0% 26.0% RoW 13.0% 14.0% 13.0% 15.0% 16.0% 16.0% 14.0% Total 100.0% 100.0% 100.0% 100.0% 100.0% 100.0% 100.0% Source: Company, HDFC Sec Inst Research IITS Geographic Revenue Growth (% QoQ) 3QFY16 4QFY16 1QFY17 2QFY17 3QFY17 4QFY17 1QFY18 USA 7.3% 11.4% 4.2% 3.3% -1.2% 1.3% 6.5% Europe 5.4% -12.8% 2.5% 6.8% -10.4% 1.3% 15.4% RoW -2.1% 12.0% -4.9% 23.3% 3.6% 1.3% -6.8% Total 5.4% 4.0% 2.5% 6.8% -2.9% 1.3% 6.5% Source: Company, HDFC Sec Inst Research
SONATA SOFTWARE: RESULTS REVIEW 1QFY18
Page | 10
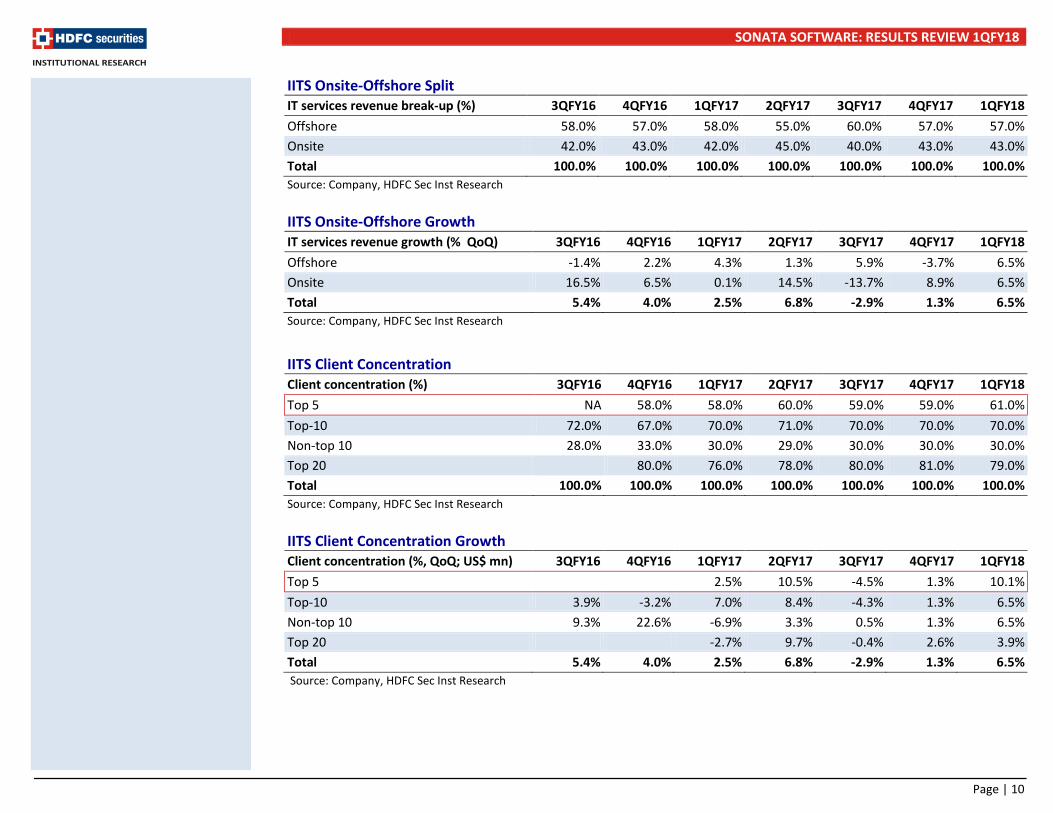
IITS Onsite-Offshore Split IT services revenue break-up (%) 3QFY16 4QFY16 1QFY17 2QFY17 3QFY17 4QFY17 1QFY18 Offshore 58.0% 57.0% 58.0% 55.0% 60.0% 57.0% 57.0% Onsite 42.0% 43.0% 42.0% 45.0% 40.0% 43.0% 43.0% Total 100.0% 100.0% 100.0% 100.0% 100.0% 100.0% 100.0% Source: Company, HDFC Sec Inst Research IITS Onsite-Offshore Growth IT services revenue growth (% QoQ) 3QFY16 4QFY16 1QFY17 2QFY17 3QFY17 4QFY17 1QFY18 Offshore -1.4% 2.2% 4.3% 1.3% 5.9% -3.7% 6.5% Onsite 16.5% 6.5% 0.1% 14.5% -13.7% 8.9% 6.5% Total 5.4% 4.0% 2.5% 6.8% -2.9% 1.3% 6.5% Source: Company, HDFC Sec Inst Research
IITS Client Concentration Client concentration (%) 3QFY16 4QFY16 1QFY17 2QFY17 3QFY17 4QFY17 1QFY18 Top 5 NA 58.0% 58.0% 60.0% 59.0% 59.0% 61.0% Top-10 72.0% 67.0% 70.0% 71.0% 70.0% 70.0% 70.0% Non-top 10 28.0% 33.0% 30.0% 29.0% 30.0% 30.0% 30.0% Top 20 80.0% 76.0% 78.0% 80.0% 81.0% 79.0% Total 100.0% 100.0% 100.0% 100.0% 100.0% 100.0% 100.0% Source: Company, HDFC Sec Inst Research IITS Client Concentration Growth Client concentration (%, QoQ; US$ mn) 3QFY16 4QFY16 1QFY17 2QFY17 3QFY17 4QFY17 1QFY18 Top 5 2.5% 10.5% -4.5% 1.3% 10.1% Top-10 3.9% -3.2% 7.0% 8.4% -4.3% 1.3% 6.5% Non-top 10 9.3% 22.6% -6.9% 3.3% 0.5% 1.3% 6.5% Top 20 -2.7% 9.7% -0.4% 2.6% 3.9% Total 5.4% 4.0% 2.5% 6.8% -2.9% 1.3% 6.5% Source: Company, HDFC Sec Inst Research

SONATA SOFTWARE: RESULTS REVIEW 1QFY18
Page | 11
IITS Rev Growth Trend IITS EBITDA, Margin Trend
Source: Company, HDFC sec Inst Research Source: Company, HDFC sec Inst Research
IITS Top-10 Client Contribution IITS Headcount
Source: Company, HDFC sec Inst Research Source: Company, HDFC sec Inst Research
25.0 25.9 25.9 26.0 27.4 28.5 29.2 31.2 30.3 30.7
32.7
(5)
(1)
3
7
11
15
0
5
10
15
20
25
30
35
3QFY
15
4QFY
15
1QFY
16
2QFY
16
3QFY
16
4QFY
16
1QFY
17
2QFY
17
3QFY
17
4QFY
17
1QFY
18
Revenue (US$ mn) QoQ growth (RHS)(US$ mn) (%, QoQ)
361 346 379 392
423
320 342
414 394 366
335
9
11
13
15
17
19
21
23
25
50
100
150
200
250
300
350
400
450
3QFY
15
4QFY
15
1QFY
16
2QFY
16
3QFY
16
4QFY
16
1QFY
17
2QFY
17
3QFY
17
4QFY
17
1QFY
18
EBITDA EBITDA margin (RHS)(Rs mn) (%)
75%
70%
72%
72% 73
%
72%
67%
70% 71
%
70%
70%
70%
62.0%
64.0%
66.0%
68.0%
70.0%
72.0%
74.0%
76.0%
2QFY
15
3QFY
15
4QFY
15
1QFY
16
2QFY
16
3QFY
16
4QFY
16
1QFY
17
2QFY
17
3QFY
17
4QFY
17
1QFY
18
2,74
6
2,83
7
2,89
6
2,88
9
2,90
8
3,13
9
3,11
1
3,14
4
3,14
7
3,16
1
3,21
3
3,41
8
0
500
1,000
1,500
2,000
2,500
3,000
3,500
4,000
2QFY
15
3QFY
15
4QFY
15
1QFY
16
2QFY
16
3QFY
16
4QFY
16
1QFY
17
2QFY
17
3QFY
17
4QFY
17
1QFY
18
Nos
SONATA SOFTWARE: RESULTS REVIEW 1QFY18
Page | 12
DPS Quarterly Revenue Trend DPS EBITDA Margin Trend
Source: Company, HDFC sec Inst Research Source: Company, HDFC sec Inst Research
DPS Headcount DPS Debtor Days
Source: Company, HDFC sec Inst Research Source: Company, HDFC sec Inst Research
2,
607 3,14
3
2,34
0 3,19
1
2,31
6
3,43
8 3,55
6 4,89
3
3,17
4 4,15
7 5,11
8
4,34
1
0
1,000
2,000
3,000
4,000
5,000
6,000
2QFY
15
3QFY
15
4QFY
15
1QFY
16
2QFY
16
3QFY
16
4QFY
16
1QFY
17
2QFY
17
3QFY
17
4QFY
17
1QFY
18
(Rs mn)
94 101
116 117
132
150 149 142 142
149 140
147
0
1
2
3
4
5
6
7
50
70
90
110
130
150
170
2QFY
15
3QFY
15
4QFY
15
1QFY
16
2QFY
16
3QFY
16
4QFY
16
1QFY
17
2QFY
17
3QFY
17
4QFY
17
1QFY
18
EBITDA EBITDA margin (RHS)(Rs mn) (%)
110
114 12
2 130 14
2
140 14
8
147 15
6
153
153
157
0
20
40
60
80
100
120
140
160
180
2QFY
15
3QFY
15
4QFY
15
1QFY
16
2QFY
16
3QFY
16
4QFY
16
1QFY
17
2QFY
17
3QFY
17
4QFY
17
1QFY
18
(Nos)
85 82 79 76
101
65 62
59
102
90
73 73
0
20
40
60
80
100
120
2QFY
15
3QFY
15
4QFY
15
1QFY
16
2QFY
16
3QFY
16
4QFY
16
1QFY
17
2QFY
17
3QFY
17
4QFY
17
1QFY
18
SONATA SOFTWARE: RESULTS REVIEW 1QFY18
Page | 13
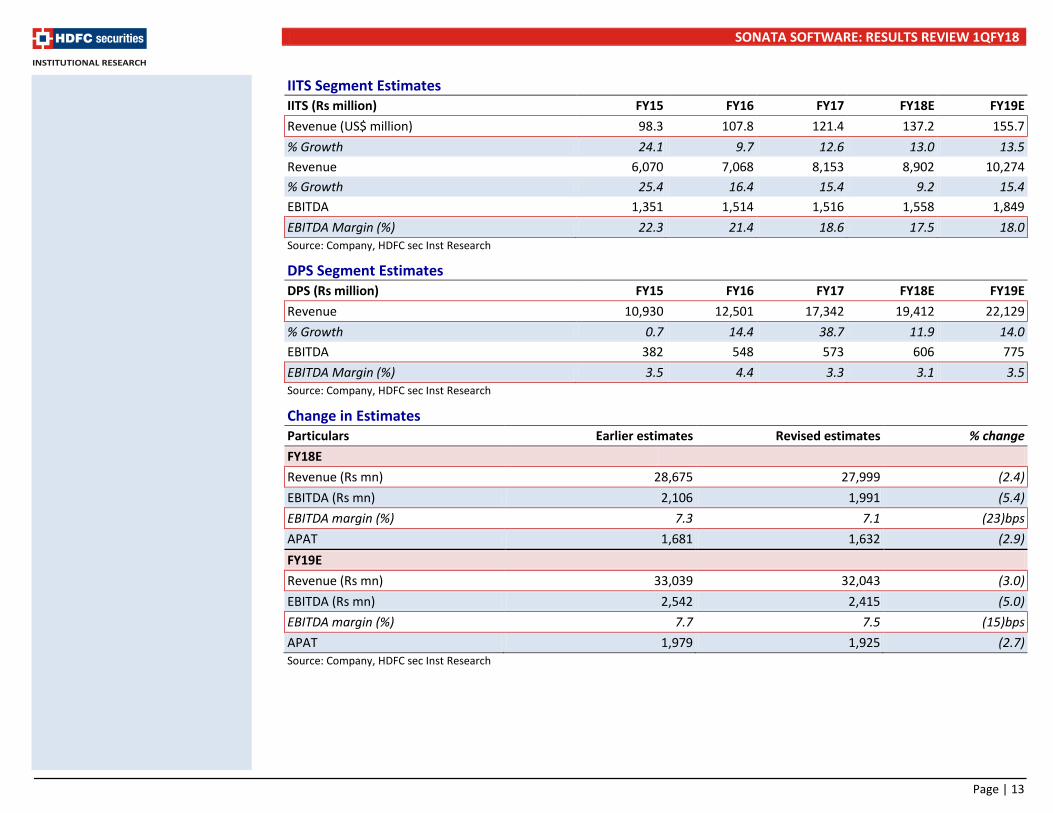
IITS Segment Estimates IITS (Rs million) FY15 FY16 FY17 FY18E FY19E Revenue (US$ million) 98.3 107.8 121.4 137.2 155.7 % Growth 24.1 9.7 12.6 13.0 13.5 Revenue 6,070 7,068 8,153 8,902 10,274 % Growth 25.4 16.4 15.4 9.2 15.4 EBITDA 1,351 1,514 1,516 1,558 1,849 EBITDA Margin (%) 22.3 21.4 18.6 17.5 18.0 Source: Company, HDFC sec Inst Research
DPS Segment Estimates DPS (Rs million) FY15 FY16 FY17 FY18E FY19E Revenue 10,930 12,501 17,342 19,412 22,129 % Growth 0.7 14.4 38.7 11.9 14.0 EBITDA 382 548 573 606 775 EBITDA Margin (%) 3.5 4.4 3.3 3.1 3.5 Source: Company, HDFC sec Inst Research
Change in Estimates Particulars Earlier estimates Revised estimates % change FY18E Revenue (Rs mn) 28,675 27,999 (2.4) EBITDA (Rs mn) 2,106 1,991 (5.4) EBITDA margin (%) 7.3 7.1 (23)bps APAT 1,681 1,632 (2.9) FY19E Revenue (Rs mn) 33,039 32,043 (3.0) EBITDA (Rs mn) 2,542 2,415 (5.0) EBITDA margin (%) 7.7 7.5 (15)bps APAT 1,979 1,925 (2.7) Source: Company, HDFC sec Inst Research
SONATA SOFTWARE: RESULTS REVIEW 1QFY18
Page | 14
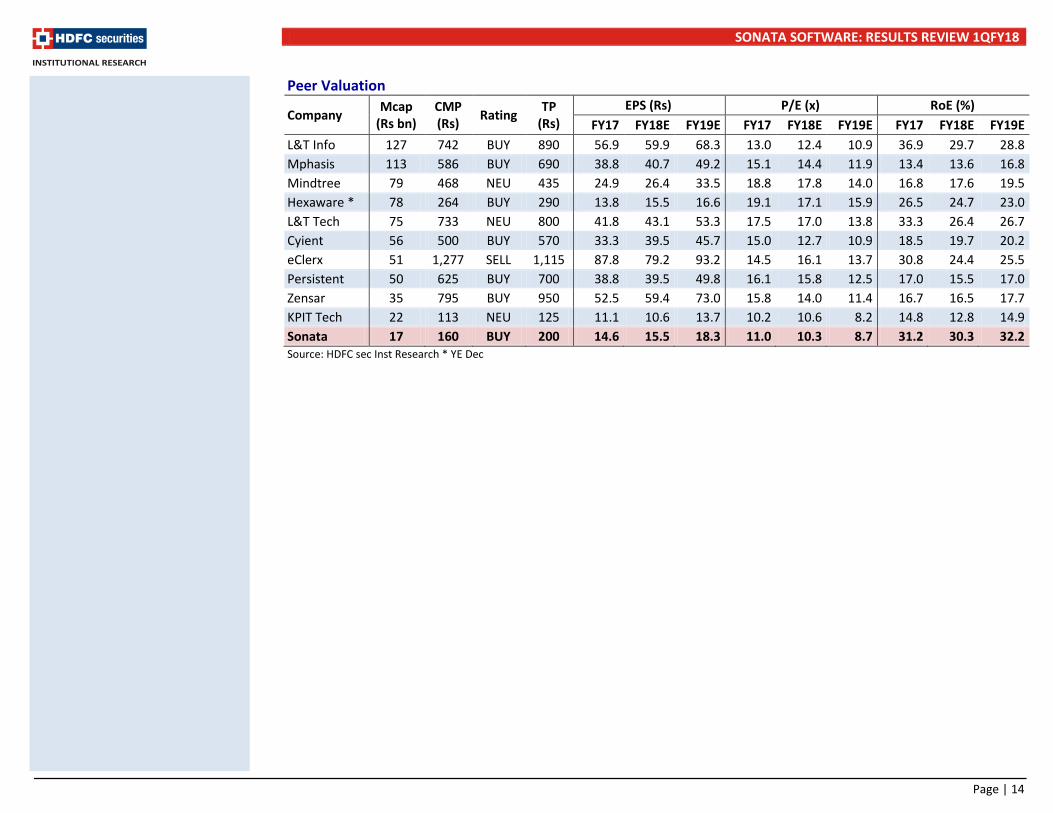
Peer Valuation
Company Mcap (Rs bn)
CMP (Rs) Rating TP
(Rs) EPS (Rs) P/E (x) RoE (%)
FY17 FY18E FY19E FY17 FY18E FY19E FY17 FY18E FY19E L&T Info 127 742 BUY 890 56.9 59.9 68.3 13.0 12.4 10.9 36.9 29.7 28.8 Mphasis 113 586 BUY 690 38.8 40.7 49.2 15.1 14.4 11.9 13.4 13.6 16.8 Mindtree 79 468 NEU 435 24.9 26.4 33.5 18.8 17.8 14.0 16.8 17.6 19.5 Hexaware * 78 264 BUY 290 13.8 15.5 16.6 19.1 17.1 15.9 26.5 24.7 23.0 L&T Tech 75 733 NEU 800 41.8 43.1 53.3 17.5 17.0 13.8 33.3 26.4 26.7 Cyient 56 500 BUY 570 33.3 39.5 45.7 15.0 12.7 10.9 18.5 19.7 20.2 eClerx 51 1,277 SELL 1,115 87.8 79.2 93.2 14.5 16.1 13.7 30.8 24.4 25.5 Persistent 50 625 BUY 700 38.8 39.5 49.8 16.1 15.8 12.5 17.0 15.5 17.0 Zensar 35 795 BUY 950 52.5 59.4 73.0 15.8 14.0 11.4 16.7 16.5 17.7 KPIT Tech 22 113 NEU 125 11.1 10.6 13.7 10.2 10.6 8.2 14.8 12.8 14.9 Sonata 17 160 BUY 200 14.6 15.5 18.3 11.0 10.3 8.7 31.2 30.3 32.2 Source: HDFC sec Inst Research * YE Dec
SONATA SOFTWARE: RESULTS REVIEW 1QFY18
Page | 15
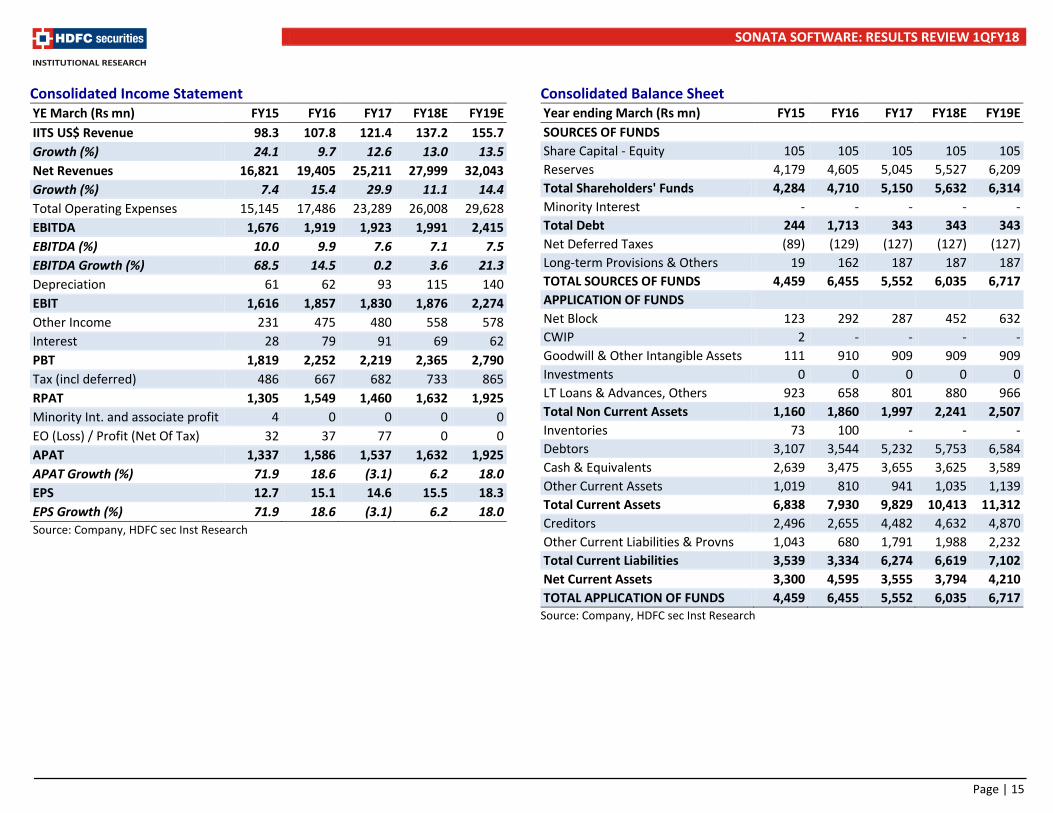
Consolidated Income Statement YE March (Rs mn) FY15 FY16 FY17 FY18E FY19E IITS US$ Revenue 98.3 107.8 121.4 137.2 155.7 Growth (%) 24.1 9.7 12.6 13.0 13.5 Net Revenues 16,821 19,405 25,211 27,999 32,043 Growth (%) 7.4 15.4 29.9 11.1 14.4 Total Operating Expenses 15,145 17,486 23,289 26,008 29,628 EBITDA 1,676 1,919 1,923 1,991 2,415 EBITDA (%) 10.0 9.9 7.6 7.1 7.5 EBITDA Growth (%) 68.5 14.5 0.2 3.6 21.3 Depreciation 61 62 93 115 140 EBIT 1,616 1,857 1,830 1,876 2,274 Other Income 231 475 480 558 578 Interest 28 79 91 69 62 PBT 1,819 2,252 2,219 2,365 2,790 Tax (incl deferred) 486 667 682 733 865 RPAT 1,305 1,549 1,460 1,632 1,925 Minority Int. and associate profit 4 0 0 0 0 EO (Loss) / Profit (Net Of Tax) 32 37 77 0 0 APAT 1,337 1,586 1,537 1,632 1,925 APAT Growth (%) 71.9 18.6 (3.1) 6.2 18.0 EPS 12.7 15.1 14.6 15.5 18.3 EPS Growth (%) 71.9 18.6 (3.1) 6.2 18.0 Source: Company, HDFC sec Inst Research
Consolidated Balance Sheet Year ending March (Rs mn) FY15 FY16 FY17 FY18E FY19E SOURCES OF FUNDS Share Capital - Equity 105 105 105 105 105 Reserves 4,179 4,605 5,045 5,527 6,209 Total Shareholders' Funds 4,284 4,710 5,150 5,632 6,314 Minority Interest - - - - - Total Debt 244 1,713 343 343 343 Net Deferred Taxes (89) (129) (127) (127) (127) Long-term Provisions & Others 19 162 187 187 187 TOTAL SOURCES OF FUNDS 4,459 6,455 5,552 6,035 6,717 APPLICATION OF FUNDS Net Block 123 292 287 452 632 CWIP 2 - - - - Goodwill & Other Intangible Assets 111 910 909 909 909 Investments 0 0 0 0 0 LT Loans & Advances, Others 923 658 801 880 966 Total Non Current Assets 1,160 1,860 1,997 2,241 2,507 Inventories 73 100 - - - Debtors 3,107 3,544 5,232 5,753 6,584 Cash & Equivalents 2,639 3,475 3,655 3,625 3,589 Other Current Assets 1,019 810 941 1,035 1,139 Total Current Assets 6,838 7,930 9,829 10,413 11,312 Creditors 2,496 2,655 4,482 4,632 4,870 Other Current Liabilities & Provns 1,043 680 1,791 1,988 2,232 Total Current Liabilities 3,539 3,334 6,274 6,619 7,102 Net Current Assets 3,300 4,595 3,555 3,794 4,210 TOTAL APPLICATION OF FUNDS 4,459 6,455 5,552 6,035 6,717
Source: Company, HDFC sec Inst Research

SONATA SOFTWARE: RESULTS REVIEW 1QFY18
Page | 16
Consolidated Cash Flow Year ending March (Rs mn) FY15 FY16 FY17 FY18E FY19E Reported PBT 1,819 2,252 2,219 2,365 2,790 Non-operating & EO items (195) (438) (403) (558) (578) Interest expenses 28 79 91 69 62 Depreciation 61 62 93 115 140 Working Capital Change (664) 513 (52) (348) (538) Tax paid (486) (667) (682) (733) (865) OPERATING CASH FLOW ( a ) 562 1,802 1,265 910 1,012 Capex (113) (101) (88) (280) (320) Free cash flow (FCF) 449 1,701 1,177 630 692 Investments 26 0 0 0 0 Non-operating income 199 438 403 558 578 INVESTING CASH FLOW ( b ) 112 337 315 278 257 Debt Issuance 187 1,469 (1,370) 0 0 Interest expenses (28) (79) (91) (69) (62) FCFE 609 3,090 (283) 562 630 Share capital Issuance 0 0 0 0 0 Dividend (675) (866) (1,110) (1,150) (1,243) FINANCING CASH FLOW ( c ) (515) 523 (2,570) (1,218) (1,305) NET CASH FLOW (a+b+c) 159 2,662 (990) (31) (35) Non-operating and EO items 39 (1,826) 1,170 0 0 Closing Cash & Equivalents 2,639 3,475 3,655 3,625 3,589 Source: Company, HDFC sec Inst Research
Key Ratios FY15 FY16 FY17 FY18E FY19E PROFITABILITY (%) EBITDA Margin 10.0 9.9 7.6 7.1 7.5 APAT Margin 7.9 8.2 6.1 5.8 6.0 RoE 33.3 35.3 31.2 30.3 32.2 RoIC or Core RoCE 64.6 43.6 65.7 53.7 50.2 RoCE 28.8 23.8 20.8 22.3 24.6 EFFICIENCY Tax Rate (%) 27.2 30.1 31.8 31.0 31.0 Fixed Asset Turnover (x) 20.1 18.2 21.8 19.5 18.2 Inventory (days) 2 2 0 0 0 Debtors (days) 71 67 76 75 75 Other Current Assets (days) 22 15 14 13 13 Payables (days) 60 55 70 65 60 Other Current Liab & Provns (days) 21 13 26 26 25
Inventory (days) 14 16 (7) (2) 3 Net Debt/EBITDA (x) (1.4) (0.9) (1.7) (1.6) (1.3) Net Debt/Equity (x) (0.6) (0.4) (0.6) (0.6) (0.5) Interest Coverage (x) 58.6 23.4 20.2 27.3 36.8 PER SHARE DATA EPS (Rs/sh) 12.7 15.1 14.6 15.5 18.3 CEPS (Rs/sh) 13.3 15.7 15.5 16.6 19.6 DPS (Rs/sh) 5.5 7.0 9.0 9.3 10.1 BV (Rs/sh) 40.7 44.8 49.0 53.6 60.0 VALUATION P/E 12.6 10.6 11.0 10.3 8.7 P/BV 3.9 3.6 3.3 3.0 2.7 EV/EBITDA 8.8 7.2 7.5 7.2 6.0 OCF/EV (%) 3.8 13.0 8.8 6.3 7.0 FCF/EV (%) 3.0 12.3 8.2 4.4 4.8 FCFE/mkt cap (%) 3.6 18.4 (1.7) 3.3 3.7 Dividend Yield (%) 3.6 4.7 6.0 6.2 6.7
Source: Company, HDFC sec Inst Research

SONATA SOFTWARE: RESULTS REVIEW 1QFY18
Page | 17
Rating Definitions BUY : Where the stock is expected to deliver more than 10% returns over the next 12 month period NEUTRAL : Where the stock is expected to deliver (-)10% to 10% returns over the next 12 month period SELL : Where the stock is expected to deliver less than (-)10% returns over the next 12 month period
Date CMP Reco Target 10-Aug-16 153 BUY 186 6-Oct-16 157 BUY 193 4-Nov-16 163 BUY 192 9-Jan-17 196 BUY 231 7-Feb-17 194 BUY 237
13-Feb-17 197 BUY 244 1-Jun-17 149 BUY 207
16-Aug-17 160 BUY 200
RECOMMENDATION HISTORY
100120140160180200220240
Aug-
16
Sep-
16
Oct
-16
Nov
-16
Dec-
16
Jan -
17
Feb-
17
Mar
-17
Apr-
17
May
-17
Jun-
17
Jul-1
7
Aug-
17
Sonata Software TP
SONATA SOFTWARE: RESULTS REVIEW 1QFY18
Page | 18
Disclosure: We, Amit Chandra, MBA & Apurva Prasad, MBA, authors and the names subscribed to this report, hereby certify that all of the views expressed in this research report accurately reflect our views about the subject issuer(s) or securities. HSL has no material adverse disciplinary history as on the date of publication of this report. We also certify that no part of our compensation was, is, or will be directly or indirectly related to the specific recommendation(s) or view(s) in this report. Research Analyst or his/her relative or HDFC Securities Ltd. does not have any financial interest in the subject company. Also Research Analyst or his relative or HDFC Securities Ltd. or its Associate may have beneficial ownership of 1% or more in the subject company at the end of the month immediately preceding the date of publication of the Research Report. Further Research Analyst or his relative or HDFC Securities Ltd. or its associate does not have any material conflict of interest. Any holding in stock –No HDFC Securities Limited (HSL) is a SEBI Registered Research Analyst having registration no. INH000002475. Disclaimer: This report has been prepared by HDFC Securities Ltd and is meant for sole use by the recipient and not for circulation. The information and opinions contained herein have been compiled or arrived at, based upon information obtained in good faith from sources believed to be reliable. Such information has not been independently verified and no guaranty, representation of warranty, express or implied, is made as to its accuracy, completeness or correctness. All such information and opinions are subject to change without notice. This document is for information purposes only. Descriptions of any company or companies or their securities mentioned herein are not intended to be complete and this document is not, and should not be construed as an offer or solicitation of an offer, to buy or sell any securities or other financial instruments. This report is not directed to, or intended for display, downloading, printing, reproducing or for distribution to or use by, any person or entity who is a citizen or resident or located in any locality, state, country or other jurisdiction where such distribution, publication, reproduction, availability or use would be contrary to law or regulation or what would subject HSL or its affiliates to any registration or licensing requirement within such jurisdiction. If this report is inadvertently send or has reached any individual in such country, especially, USA, the same may be ignored and brought to the attention of the sender. This document may not be reproduced, distributed or published for any purposes without prior written approval of HSL. Foreign currencies denominated securities, wherever mentioned, are subject to exchange rate fluctuations, which could have an adverse effect on their value or price, or the income derived from them. In addition, investors in securities such as ADRs, the values of which are influenced by foreign currencies effectively assume currency risk. It should not be considered to be taken as an offer to sell or a solicitation to buy any security. HSL may from time to time solicit from, or perform broking, or other services for, any company mentioned in this mail and/or its attachments. HSL and its affiliated company(ies), their directors and employees may; (a) from time to time, have a long or short position in, and buy or sell the securities of the company(ies) mentioned herein or (b) be engaged in any other transaction involving such securities and earn brokerage or other compensation or act as a market maker in the financial instruments of the company(ies) discussed herein or act as an advisor or lender/borrower to such company(ies) or may have any other potential conflict of interests with respect to any recommendation and other related information and opinions. HSL, its directors, analysts or employees do not take any responsibility, financial or otherwise, of the losses or the damages sustained due to the investments made or any action taken on basis of this report, including but not restricted to, fluctuation in the prices of shares and bonds, changes in the currency rates, diminution in the NAVs, reduction in the dividend or income, etc. HSL and other group companies, its directors, associates, employees may have various positions in any of the stocks, securities and financial instruments dealt in the report, or may make sell or purchase or other deals in these securities from time to time or may deal in other securities of the companies / organizations described in this report. HSL or its associates might have managed or co-managed public offering of securities for the subject company or might have been mandated by the subject company for any other assignment in the past twelve months. HSL or its associates might have received any compensation from the companies mentioned in the report during the period preceding twelve months from t date of this report for services in respect of managing or co-managing public offerings, corporate finance, investment banking or merchant banking, brokerage services or other advisory service in a merger or specific transaction in the normal course of business. HSL or its analysts did not receive any compensation or other benefits from the companies mentioned in the report or third party in connection with preparation of the research report. Accordingly, neither HSL nor Research Analysts have any material conflict of interest at the time of publication of this report. Compensation of our Research Analysts is not based on any specific merchant banking, investment banking or brokerage service transactions. HSL may have issued other reports that are inconsistent with and reach different conclusion from the information presented in this report. Research entity has not been engaged in market making activity for the subject company. Research analyst has not served as an officer, director or employee of the subject company. We have not received any compensation/benefits from the subject company or third party in connection with the Research Report. HDFC securities Limited, I Think Techno Campus, Building - B, "Alpha", Office Floor 8, Near Kanjurmarg Station, Opp. Crompton Greaves, Kanjurmarg (East), Mumbai 400 042 Phone: (022) 3075 3400 Fax: (022) 2496 5066 Compliance Officer: Binkle R. Oza Email: [email protected] Phone: (022) 3045 3600 HDFC Securities Limited, SEBI Reg. No.: NSE-INB/F/E 231109431, BSE-INB/F 011109437, AMFI Reg. No. ARN: 13549, PFRDA Reg. No. POP: 04102015, IRDA Corporate Agent License No.: HDF 2806925/HDF C000222657, SEBI Research Analyst Reg. No.: INH000002475, CIN - U67120MH2000PLC152193 Mutual Funds Investments are subject to market risk. Please read the offer and scheme related documents carefully before investing.

SONATA SOFTWARE: RESULTS REVIEW 1QFY18
Page | 19
HDFC securities Institutional Equities Unit No. 1602, 16th Floor, Tower A, Peninsula Business Park, Senapati Bapat Marg, Lower Parel,Mumbai - 400 013 Board : +91-22-6171-7330 www.hdfcsec.com