Embed Size (px)
Citation preview

Edelweiss Research is also available on www.edelresearch.com, Bloomberg EDEL <GO>, Thomson First Call, Reuters and Factset.
Edelweiss Securities Limited
Cipla’s Q4FY17 revenue grew mere 7% YoY due to dip in India and emerging markets. US business was flat through FY17 despite 18 launches. EBITDA margin plummeted to 14% due to higher R&D (8.6% of sales), which is expected to remain elevated. Adjusted for ~INR2.7bn one-off, net profit came at INR2bn compared to INR3bn estimate. A few limited competition launches like gVidaza, gDacogen & gRenvela and ramp up of Sereflo in UK are expected in FY18/FY19. We believe, though earnings CAGR of 30% over FY17-19 looks strong on weak base, valuation (20x FY19E) factors in the optimism, but not the challenging macro environment. Maintain ‘HOLD’.
Tepid India, higher R&D mar margin
Revenue grew mere 7% YoY due to 4% decline in India (38%) on account of
demonetisation & destocking and 8% fall in emerging markets (22%) on volatile
currency. While South Africa’s performance was good (13% CC growth), US (Invagen’s
contribution of ~USD54mn) remained flat for the fourth consecutive quarter at
~USD97mn despite 18 new launches during the year. Owing to weak India business
along with higher R&D spend, EBITDA margin declined to 14%.
Margin improvement unlikely without stronger top-line growth
Cipla has guided for a few limited competition launches like gVidaza, gDacogen and
gRenvela in the US market in FY18/19. Sereflo (gSeretide MDI), launched in Q3FY17 in
UK, is expected to ramp up in FY18. The company has indicated double digit top-line
growth in FY18 primarily driven by 20% plus spurt in US & Europe and 10-12% growth
in rest of the geographies. In our view, margin improvement will not be possible unless
monetisation of Sereflo and niche launches in US are successful. R&D cost is poised to
inch up as clinical trial for Advair kicks-off during FY18. In the medium term, products
like Nanopaclitaxel and Albuterol MDI (filed this year) will be critical.
Outlook and valuations: Limited upside; maintain ‘HOLD’
Given that some of Cipla’s most important investments in the past 3 years continue to
face structural pressures—US (competitive pressure & price erosion) and emerging
markets (forex volatility, price decline in Middle East, rising competition)—its organic
growth trajectory may not pan out to full potential. We maintain ‘HOLD/SP’ with target
price of INR510.
RESULT UPDATE
CIPLA Another quarter misses the mark
COMPANYNAME
EDELWEISS 4D RATINGS
Absolute Rating HOLD
Rating Relative to Sector Performer
Risk Rating Relative to Sector Low
Sector Relative to Market Equalweight
MARKET DATA (R: CIPL.BO, B: CIPLA IN)
CMP : INR 504
Target Price : INR 510
52-week range (INR) : 622 / 457
Share in issue (mn) : 804.5
M cap (INR bn/USD mn) : 405 / 6,273
Avg. Daily Vol.BSE/NSE(‘000) : 1,588.6
SHARE HOLDING PATTERN (%)
Current Q2FY17 Q1FY17
Promoters *
36.7 36.7 36.7
MF's, FI's & BK’s 15.5 16.2 16.3
FII's 19.8 18.7 18.3
Others 27.9 28.3 28.7
* Promoters pledged shares (% of share in issue)
: NIL
PRICE PERFORMANCE (%)
Stock Nifty
EW Pharma Index
1 month (8.9) 2.2 (9.9)
3 months (14.9) 6.4 (10.7)
12 months 7.3 19.8 (9.3)
Deepak Malik +91 22 6620 3147
Rahul Solanki +91 22 6623 3317
Archana Menon +91 22 6620 3020
India Equity Research| Pharmaceuticals
May 25, 2017
Financials (Consolidated) (INR mn)
Year to March Q4FY17 Q4FY16 % change Q3FY17 % change FY17 FY18E FY19E
Net revenue 35,820 33,145 8.1 36,472 (1.8) 142,809 168,897 191,466
EBITDA 5,062 1,761 187.4 6,776 (25.3) 24,758 31,752 36,881
Adj. net profit 2,042 2,824 (27.7) 3,043 (32.9) 12,019 17,631 20,419
Adj. EPS (INR) 2.5 3.5 (27.8) 3.8 (33.0) 14.9 21.9 25.4
Diluted P/E (x) 33.8 23.0 19.9
ROAE(%) 9.9 13.1 13.6
Pharmaceuticals
2 Edelweiss Securities Limited
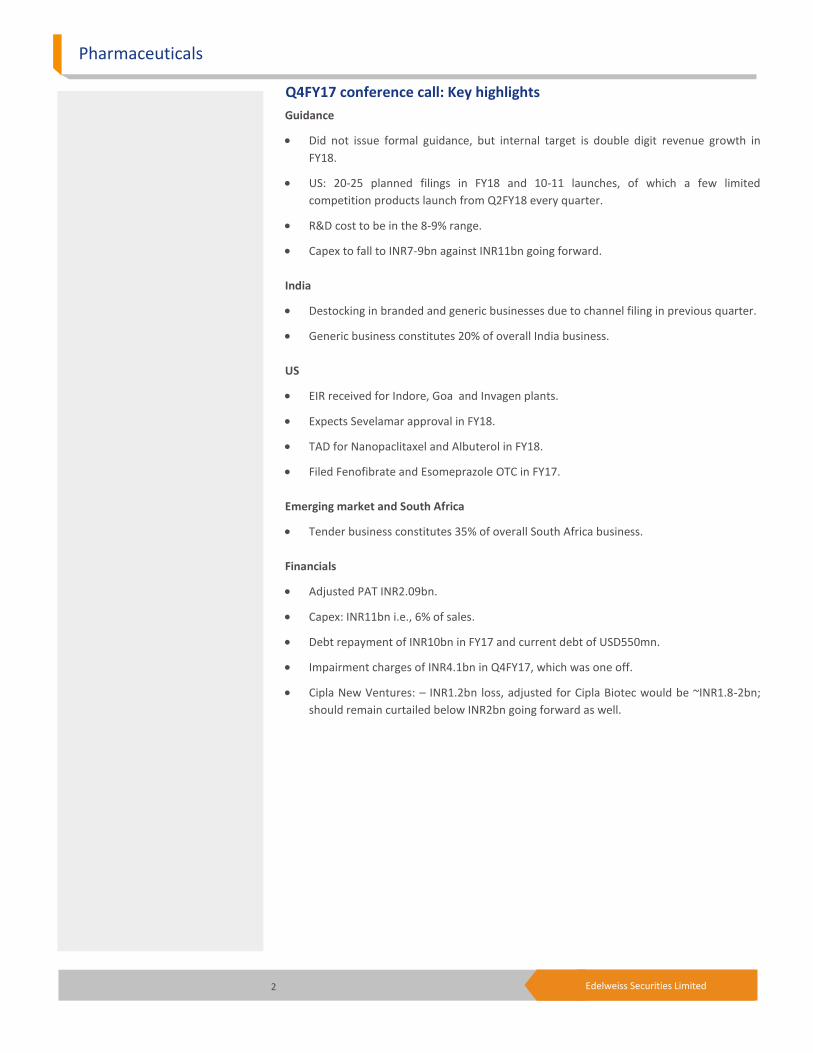
Q4FY17 conference call: Key highlights
Guidance
Did not issue formal guidance, but internal target is double digit revenue growth in
FY18.
US: 20-25 planned filings in FY18 and 10-11 launches, of which a few limited
competition products launch from Q2FY18 every quarter.
R&D cost to be in the 8-9% range.
Capex to fall to INR7-9bn against INR11bn going forward.
India
Destocking in branded and generic businesses due to channel filing in previous quarter.
Generic business constitutes 20% of overall India business.
US
EIR received for Indore, Goa and Invagen plants.
Expects Sevelamar approval in FY18.
TAD for Nanopaclitaxel and Albuterol in FY18.
Filed Fenofibrate and Esomeprazole OTC in FY17.
Emerging market and South Africa
Tender business constitutes 35% of overall South Africa business.
Financials
Adjusted PAT INR2.09bn.
Capex: INR11bn i.e., 6% of sales.
Debt repayment of INR10bn in FY17 and current debt of USD550mn.
Impairment charges of INR4.1bn in Q4FY17, which was one off.
Cipla New Ventures: – INR1.2bn loss, adjusted for Cipla Biotec would be ~INR1.8-2bn;
should remain curtailed below INR2bn going forward as well.
Cipla
3 Edelweiss Securities Limited
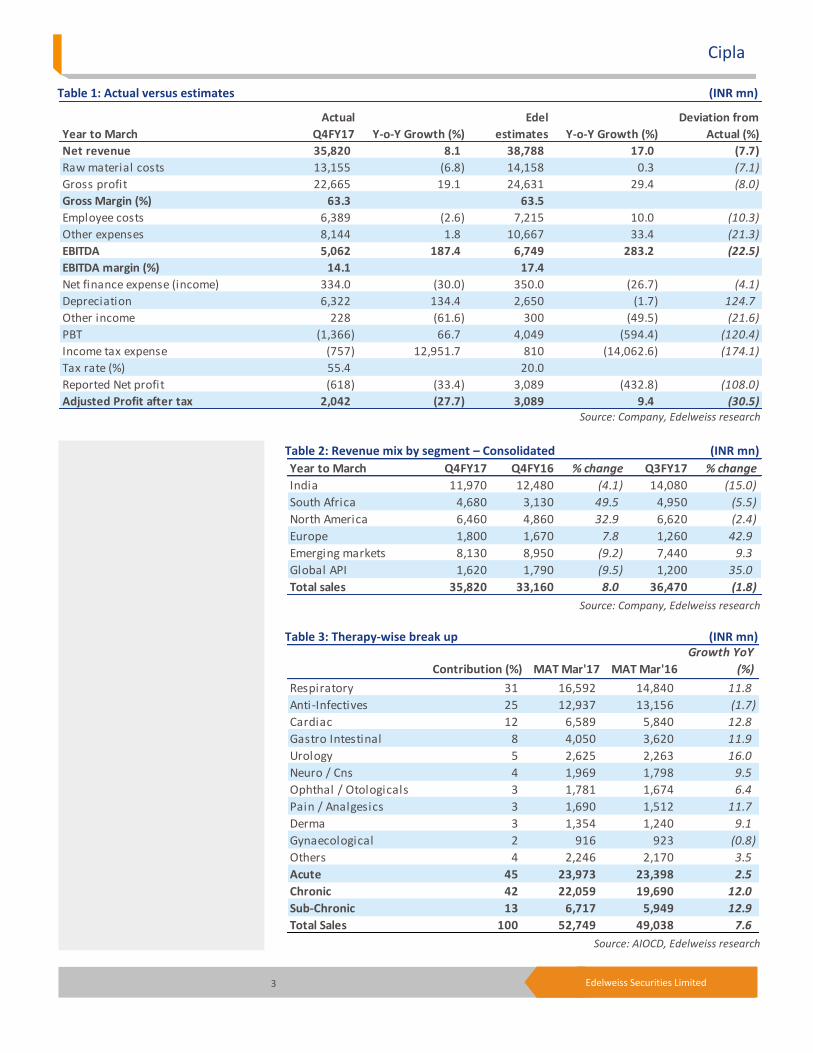
Table 1: Actual versus estimates (INR mn)
Source: Company, Edelweiss research
Table 2: Revenue mix by segment – Consolidated (INR mn)
Source: Company, Edelweiss research
Table 3: Therapy-wise break up (INR mn)
Source: AIOCD, Edelweiss research
Year to March
Actual
Q4FY17 Y-o-Y Growth (%)
Edel
estimates Y-o-Y Growth (%)
Deviation from
Actual (%)
Net revenue 35,820 8.1 38,788 17.0 (7.7)
Raw material costs 13,155 (6.8) 14,158 0.3 (7.1)
Gross profit 22,665 19.1 24,631 29.4 (8.0)
Gross Margin (%) 63.3 63.5
Employee costs 6,389 (2.6) 7,215 10.0 (10.3)
Other expenses 8,144 1.8 10,667 33.4 (21.3)
EBITDA 5,062 187.4 6,749 283.2 (22.5)
EBITDA margin (%) 14.1 17.4
Net finance expense (income) 334.0 (30.0) 350.0 (26.7) (4.1)
Depreciation 6,322 134.4 2,650 (1.7) 124.7
Other income 228 (61.6) 300 (49.5) (21.6)
PBT (1,366) 66.7 4,049 (594.4) (120.4)
Income tax expense (757) 12,951.7 810 (14,062.6) (174.1)
Tax rate (%) 55.4 20.0
Reported Net profit (618) (33.4) 3,089 (432.8) (108.0)
Adjusted Profit after tax 2,042 (27.7) 3,089 9.4 (30.5)
Year to March Q4FY17 Q4FY16 % change Q3FY17 % change
India 11,970 12,480 (4.1) 14,080 (15.0)
South Africa 4,680 3,130 49.5 4,950 (5.5)
North America 6,460 4,860 32.9 6,620 (2.4)
Europe 1,800 1,670 7.8 1,260 42.9
Emerging markets 8,130 8,950 (9.2) 7,440 9.3
Global API 1,620 1,790 (9.5) 1,200 35.0
Total sales 35,820 33,160 8.0 36,470 (1.8)
Contribution (%) MAT Mar'17 MAT Mar'16
Growth YoY
(%)
Respiratory 31 16,592 14,840 11.8
Anti-Infectives 25 12,937 13,156 (1.7)
Cardiac 12 6,589 5,840 12.8
Gastro Intestinal 8 4,050 3,620 11.9
Urology 5 2,625 2,263 16.0
Neuro / Cns 4 1,969 1,798 9.5
Ophthal / Otologicals 3 1,781 1,674 6.4
Pain / Analgesics 3 1,690 1,512 11.7
Derma 3 1,354 1,240 9.1
Gynaecological 2 916 923 (0.8)
Others 4 2,246 2,170 3.5
Acute 45 23,973 23,398 2.5
Chronic 42 22,059 19,690 12.0
Sub-Chronic 13 6,717 5,949 12.9
Total Sales 100 52,749 49,038 7.6
Pharmaceuticals
4 Edelweiss Securities Limited
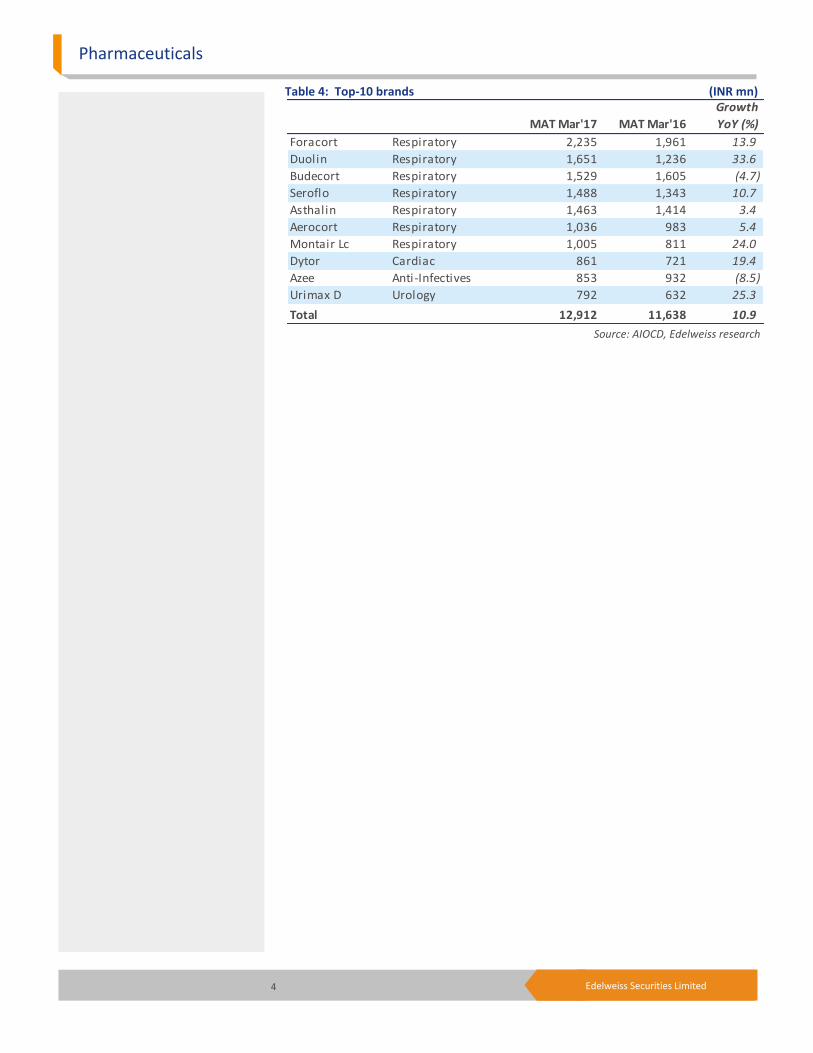
Table 4: Top-10 brands (INR mn)
Source: AIOCD, Edelweiss research
MAT Mar'17 MAT Mar'16
Growth
YoY (%)
Foracort Respiratory 2,235 1,961 13.9
Duolin Respiratory 1,651 1,236 33.6
Budecort Respiratory 1,529 1,605 (4.7)
Seroflo Respiratory 1,488 1,343 10.7
Asthalin Respiratory 1,463 1,414 3.4
Aerocort Respiratory 1,036 983 5.4
Montair Lc Respiratory 1,005 811 24.0
Dytor Cardiac 861 721 19.4
Azee Anti-Infectives 853 932 (8.5)
Urimax D Urology 792 632 25.3
Total 12,912 11,638 10.9

Cipla
5 Edelweiss Securities Limited
Financial snapshot (INR mn) Year to March Q4FY17 Q4FY16 % change Q3FY17 % change FY17 FY18E FY19E
Net revenues 35,820 33,145 8.1 36,472 (1.8) 146,302 172,244 195,064 Cost of revenue 13,155 14,109 (6.8) 13,011 1.1 53,171 61,147 68,760
Gross profit 22,665 19,036 19.1 23,461 (3.4) 93,131 111,097 126,304
R&D 3,070 2,718 13.0 2,261 35.8 11,119 14,641 16,580
Other expenses 8,144 7,996 1.8 8,092 0.6 30,916 35,206 39,803
EBITDA 5,062 1,761 187.4 6,776 (25.3) 24,758 31,752 36,881
EBITDA margin 14.1 5.3 18.6 16.9 18.4 18.9
Depreciation 6,322 2,697 134.4 2,577 145.3 13,229 9,451 10,024
EBIT (1,260) (936) NA 4,199 NA 11,529 22,301 26,858
Other income 228 594 (61.6) 1,535 (85.2) 2,287 2,200 2,200
Interest 334 477 (30.0) 593 (43.7) 1,594 1,525 1,445
Profit before tax (1,366) (819) NA 5,141 NA 12,222 22,976 27,613
Provision for taxes (757) (6) NA 1,283 NA 1,798 5,055 6,903
Minority interest 9 115 (91.9) 110 (91.5) 290 290 290
Associate profit share (70)
Reported net profit (618) (928) NA 3,748 NA 10,064 17,631 20,419
Adjusted Profit 2,042 2,824 (27.7) 3,043 (32.9) 12,019 17,631 20,419
Diluted shares (mn) 803 803 803 805 805 805
Adjusted Diluted EPS 2.5 3.5 (27.8) 3.8 (33.0) 14.9 21.9 25.4
Diluted P/E (x) - - - 33.8 23.0 19.9
EV/EBITDA (x) - - - 18.0 13.9 11.1
ROAE (%) - - - 9.9 13.1 13.6
Cost of revenue 36.7 42.6 35.7 36.3 35.5 35.3
Gross profit 63.3 57.4 64.3 63.7 64.5 64.8
R&D 8.6 8.2 6.2 7.6 8.5 8.5
Total expenses 85.9 94.7 81.4 83.1 81.6 81.1
Operating profit (3.5) (2.8) 11.5 7.9 12.9 13.8
Reported net profit (1.7) (2.8) 10.3 6.9 10.2 10.5
Tax rate 55.4 0.7 25.0 14.7 22.0 25.0

Pharmaceuticals
6 Edelweiss Securities Limited
Company Description
Cipla is a global Pharma company with a geographically diversified presence and products
registered in more than 170 countries. The India branded formulations accounts for more
than 40% of its business and Cipla is among the top three players in the market. In the past,
Cipla believed in the partnership model for international markets but over the last three
years the company is undergoing a strategic shift and has started setting up its own front
end. Cipla is also a well-known global player in the inhalers and antiretrovirals space. Going
forward the company expects launch of combination inhalers in the larger markets of US
and EU and setting up of own front ends to drive growth. Investment Theme
We believe Cipla is headed in the right direction as investments in pipeline/front end begin
to deliver. We expect steady growth and margin recovery going forward as acquired
businesses and own sales in US/EU start ramping up. Earnings to be driven by operating
leverage benefits on initiation of sales from US and EU through own front end, ramp up in
Dymista (nasal spray with partner Meda) and cost synergies in South Africa (recently
acquired). The launch of combination inhalers in EU validates its capabilities in the space
and expect this business to be a long term driver.
Key Risks
• Delay in approvals in US and EU / slower than expected ramp up in the combination
inhalers segment
• Currency appreciation: more than 60% of the business is international and any
substantial movement of the currency could hurt
7 Edelweiss Securities Limited
Cipla
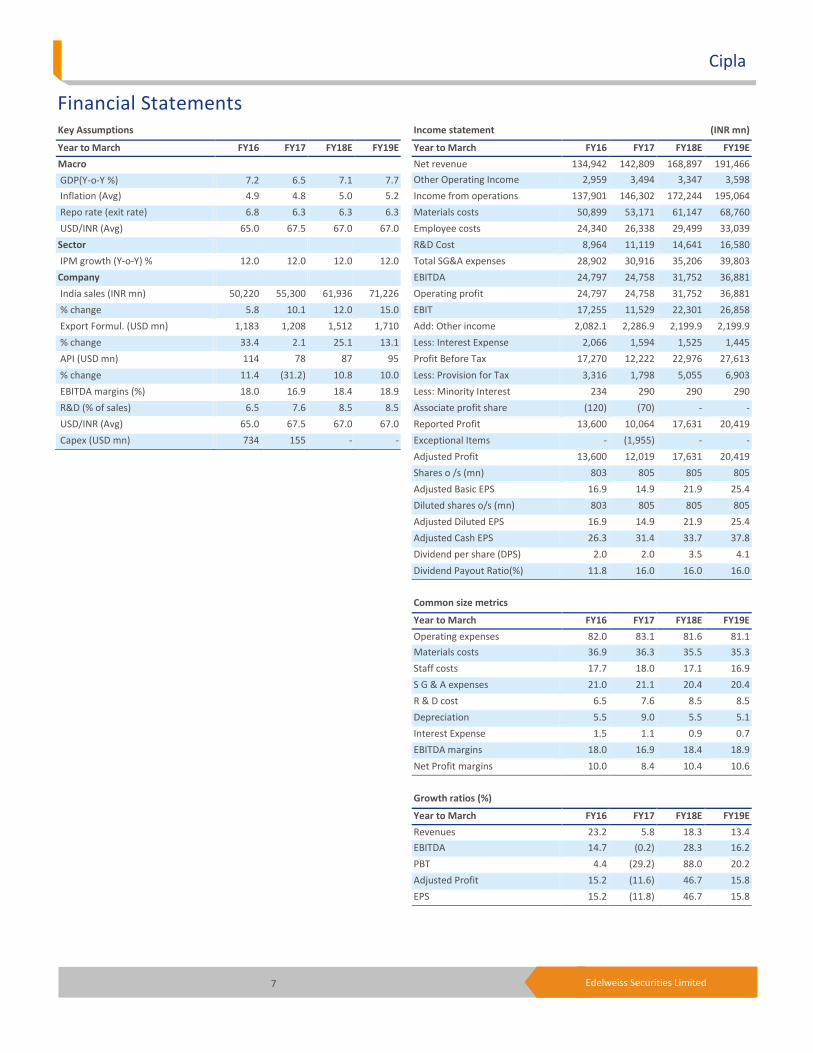
Financial Statements
Income statement (INR mn)
Year to March FY16 FY17 FY18E FY19E
Net revenue 134,942 142,809 168,897 191,466
Other Operating Income 2,959 3,494 3,347 3,598
Income from operations 137,901 146,302 172,244 195,064
Materials costs 50,899 53,171 61,147 68,760
Employee costs 24,340 26,338 29,499 33,039
R&D Cost 8,964 11,119 14,641 16,580
Total SG&A expenses 28,902 30,916 35,206 39,803
EBITDA 24,797 24,758 31,752 36,881
Operating profit 24,797 24,758 31,752 36,881
EBIT 17,255 11,529 22,301 26,858
Add: Other income 2,082.1 2,286.9 2,199.9 2,199.9
Less: Interest Expense 2,066 1,594 1,525 1,445
Profit Before Tax 17,270 12,222 22,976 27,613
Less: Provision for Tax 3,316 1,798 5,055 6,903
Less: Minority Interest 234 290 290 290
Associate profit share (120) (70) - -
Reported Profit 13,600 10,064 17,631 20,419
Exceptional Items - (1,955) - -
Adjusted Profit 13,600 12,019 17,631 20,419
Shares o /s (mn) 803 805 805 805
Adjusted Basic EPS 16.9 14.9 21.9 25.4
Diluted shares o/s (mn) 803 805 805 805
Adjusted Diluted EPS 16.9 14.9 21.9 25.4
Adjusted Cash EPS 26.3 31.4 33.7 37.8
Dividend per share (DPS) 2.0 2.0 3.5 4.1
Dividend Payout Ratio(%) 11.8 16.0 16.0 16.0
Common size metrics
Year to March FY16 FY17 FY18E FY19E
Operating expenses 82.0 83.1 81.6 81.1
Materials costs 36.9 36.3 35.5 35.3
Staff costs 17.7 18.0 17.1 16.9
S G & A expenses 21.0 21.1 20.4 20.4
R & D cost 6.5 7.6 8.5 8.5
Depreciation 5.5 9.0 5.5 5.1
Interest Expense 1.5 1.1 0.9 0.7
EBITDA margins 18.0 16.9 18.4 18.9
Net Profit margins 10.0 8.4 10.4 10.6
Growth ratios (%)
Year to March FY16 FY17 FY18E FY19E
Revenues 23.2 5.8 18.3 13.4
EBITDA 14.7 (0.2) 28.3 16.2
PBT 4.4 (29.2) 88.0 20.2
Adjusted Profit 15.2 (11.6) 46.7 15.8
EPS 15.2 (11.8) 46.7 15.8
Key Assumptions
Year to March FY16 FY17 FY18E FY19E
Macro
GDP(Y-o-Y %) 7.2 6.5 7.1 7.7
Inflation (Avg) 4.9 4.8 5.0 5.2
Repo rate (exit rate) 6.8 6.3 6.3 6.3
USD/INR (Avg) 65.0 67.5 67.0 67.0
Sector
IPM growth (Y-o-Y) % 12.0 12.0 12.0 12.0
Company
India sales (INR mn) 50,220 55,300 61,936 71,226
% change 5.8 10.1 12.0 15.0
Export Formul. (USD mn) 1,183 1,208 1,512 1,710
% change 33.4 2.1 25.1 13.1
API (USD mn) 114 78 87 95
% change 11.4 (31.2) 10.8 10.0
EBITDA margins (%) 18.0 16.9 18.4 18.9
R&D (% of sales) 6.5 7.6 8.5 8.5
USD/INR (Avg) 65.0 67.5 67.0 67.0
Capex (USD mn) 734 155 - -

8 Edelweiss Securities Limited
Pharmaceuticals
Peer comparison valuation
Market cap Diluted P/E (X) EV / EBITDA (X) ROAE (%)
Name (USD mn) FY18E FY19E FY18E FY19E FY18E FY19E
Cipla 6,273 23.0 19.9 13.9 11.1 13.1 13.6
Dr.Reddys Laboratories 6,222 25.3 16.4 14.1 10.2 12.3 17.1
Lupin 7,967 22.4 18.7 13.9 11.6 15.9 16.7
Sun Pharmaceuticals Industries 21,955 17.7 15.2 11.1 8.7 18.8 18.4
Median - 22.7 17.6 13.9 10.7 14.5 16.9
AVERAGE - 22.1 17.5 13.3 10.4 15.0 16.5
Source: Edelweiss research
Cash flow metrics
Year to March FY16 FY17 FY18E FY19E
Operating cash flow 17,939 21,518 6,360 37,164
Investing cash flow (45,844) (10,097) - -
Financing cash flow 31,027 (15,854) (6,393) (5,929)
Net cash Flow 3,122 (4,434) (32) 31,235
Capex (45,877) (10,487) - -
Dividend paid (1,934) (1,936) (3,393) (3,929)
Profitability and efficiency ratios
Year to March FY16 FY17 FY18E FY19E
ROAE (%) 12.1 9.9 13.1 13.6
ROACE (%) 12.6 7.9 13.6 15.0
Inventory Days 272 250 272 272
Debtors Days 59 62 59 59
Payable Days 109 105 109 109
Cash Conversion Cycle 222 208 221 221
Current Ratio 3.2 3.1 3.4 4.2
Gross Debt/EBITDA 2.1 1.7 1.2 1.0
Gross Debt/Equity 0.4 0.3 0.3 0.2
Adjusted Debt/Equity 0.4 0.3 0.3 0.2
Net Debt/Equity 0.4 0.3 0.2 -
Interest Coverage Ratio 8.4 7.2 14.6 18.6
Operating ratios
Year to March FY16 FY17 FY18E FY19E
Total Asset Turnover 0.9 0.8 0.9 1.0
Fixed Asset Turnover 1.7 1.5 1.9 2.4
Equity Turnover 1.2 1.2 1.2 1.3
Valuation parameters
Year to March FY16 FY17 FY18E FY19E
Adj. Diluted EPS (INR) 16.9 14.9 21.9 25.4
Y-o-Y growth (%) 15.2 (11.8) 46.7 15.8
Adjusted Cash EPS (INR) 26.3 31.4 33.7 37.8
Diluted P/E (x) 29.8 33.7 23.0 19.9
P/B (x) 3.5 3.2 2.9 2.6
EV / Sales (x) 3.4 3.1 2.6 2.1
EV / EBITDA (x) 18.2 18.0 13.9 11.1
Dividend Yield (%) 0.4 0.4 0.7 0.8
Balance sheet (INR mn)
As on 31st March FY16 FY17 FY18E FY19E
Share capital 1,607 1,609 1,609 1,609
Reserves & Surplus 113,555 123,645 137,884 154,374
Shareholders' funds 115,162 125,254 139,493 155,983
Minority Interest 3,501 4,382 4,382 4,382
Short term borrowings 49,697 4,672 1,672 (328)
Long term borrowings 2,219 36,454 36,454 36,454
Total Borrowings 51,916 41,126 38,126 36,126
Long Term Liabilities 2,882 2,792 2,792 2,792
Def. Tax Liability (net) 8,970 5,888 5,888 5,888
Sources of funds 182,431 179,442 190,681 205,171
Gross Block 100,017 114,555 114,555 114,555
Depreciation 7,542 13,229 9,451 10,024
Net Block 66,628 67,936 58,485 48,461
Capital work in progress 20,609 16,830 16,830 16,830
Intangible Assets 27,056 26,784 26,784 26,784
Total Fixed Assets 114,292 111,550 102,099 92,075
Non current investments 1,764 1,374 1,374 1,374
Cash and Equivalents 8,714 6,242 6,210 37,445
Inventories 38,081 34,853 56,313 46,204
Sundry Debtors 23,563 24,974 29,490 32,190
Loans & Advances 18,055 22,160 22,160 22,160
Current Assets (ex cash) 79,698 81,987 107,964 100,554
Trade payable 14,758 15,711 20,966 20,278
Other Current Liab 13,306 12,866 12,866 12,866
Total Current Liab 28,064 28,577 33,832 33,144
Net Curr Assets-ex cash 51,635 53,410 74,132 67,410
Uses of funds 182,431 179,442 190,681 205,171
BVPS (INR) 143.4 155.7 173.4 193.9
Free cash flow (INR mn)
Year to March FY16 FY17 FY18E FY19E
Reported Profit 13,600 10,064 17,631 20,419
Add: Depreciation 7,542 13,229 9,451 10,024
Interest (Net of Tax) 1,670 1,359 1,190 1,084
Others (9,682) (366) (42,633) 12,359
Less: Changes in WC (4,809) 2,769 (20,722) 6,721
Operating cash flow 17,939 21,518 6,360 37,164
Less: Capex 45,877 10,487 - -
Free Cash Flow (27,939) 11,030 6,360 37,164
9 Edelweiss Securities Limited
Cipla
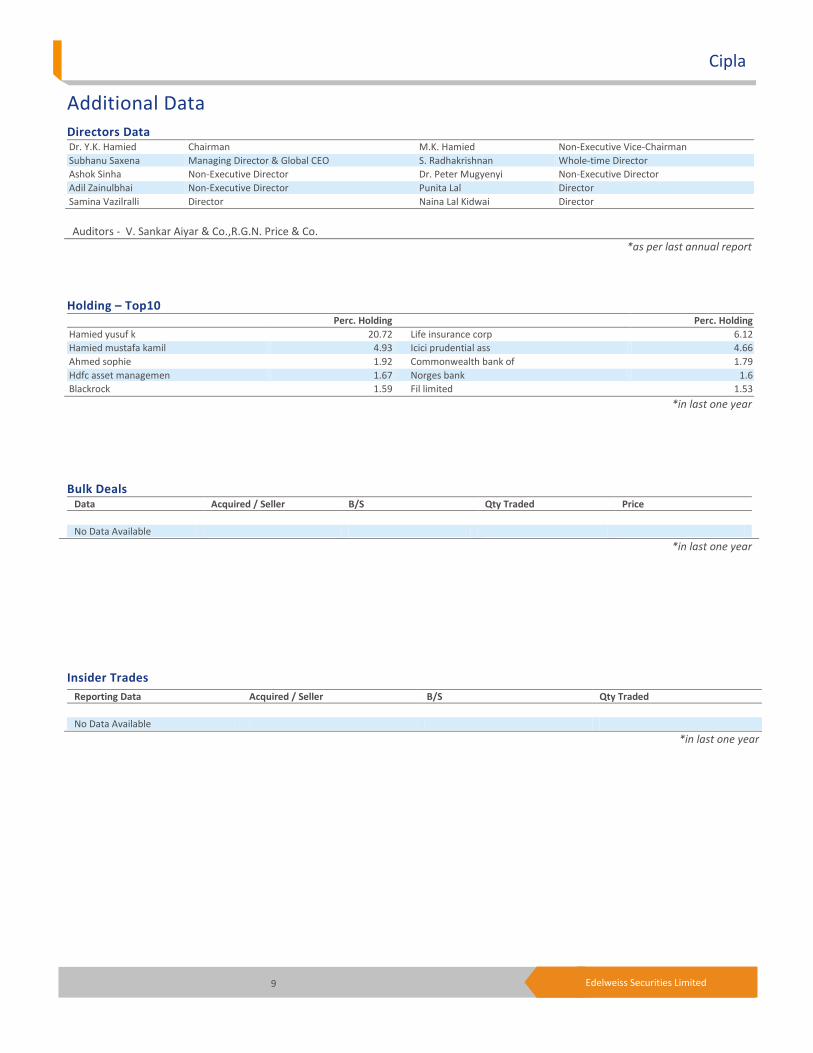
Insider Trades
Reporting Data Acquired / Seller B/S Qty Traded
No Data Available
*in last one year
Bulk Deals Data Acquired / Seller B/S Qty Traded Price
No Data Available
*in last one year
Holding – Top10 Perc. Holding Perc. Holding
Hamied yusuf k 20.72 Life insurance corp 6.12
Hamied mustafa kamil 4.93 Icici prudential ass 4.66
Ahmed sophie 1.92 Commonwealth bank of 1.79
Hdfc asset managemen 1.67 Norges bank 1.6
Blackrock 1.59 Fil limited 1.53
*in last one year
Additional Data
Directors Data Dr. Y.K. Hamied Chairman M.K. Hamied Non-Executive Vice-Chairman
Subhanu Saxena Managing Director & Global CEO S. Radhakrishnan Whole-time Director
Ashok Sinha Non-Executive Director Dr. Peter Mugyenyi Non-Executive Director
Adil Zainulbhai Non-Executive Director Punita Lal Director
Samina Vazilralli Director Naina Lal Kidwai Director
Auditors - V. Sankar Aiyar & Co.,R.G.N. Price & Co.
*as per last annual report
10 Edelweiss Securities Limited
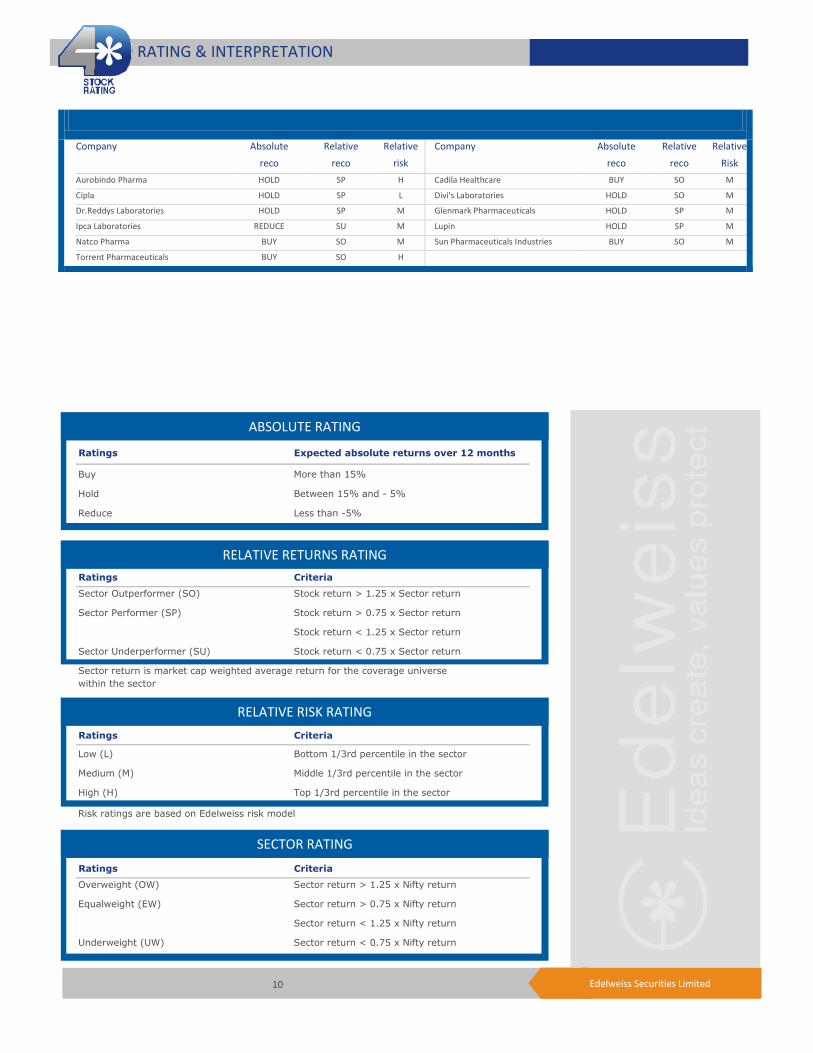
Company Absolute
reco
Relative
reco
Relative
risk
Company Absolute
reco
Relative
reco
Relative
Risk
Aurobindo Pharma HOLD SP H Cadila Healthcare BUY SO M
Cipla HOLD SP L Divi's Laboratories HOLD SO M
Dr.Reddys Laboratories HOLD SP M Glenmark Pharmaceuticals HOLD SP M
Ipca Laboratories REDUCE SU M Lupin HOLD SP M
Natco Pharma BUY SO M Sun Pharmaceuticals Industries BUY SO M
Torrent Pharmaceuticals BUY SO H
RATING & INTERPRETATION
ABSOLUTE RATING
Ratings Expected absolute returns over 12 months
Buy More than 15%
Hold Between 15% and - 5%
Reduce Less than -5%
RELATIVE RETURNS RATING
Ratings Criteria
Sector Outperformer (SO) Stock return > 1.25 x Sector return
Sector Performer (SP) Stock return > 0.75 x Sector return
Stock return < 1.25 x Sector return
Sector Underperformer (SU) Stock return < 0.75 x Sector return
Sector return is market cap weighted average return for the coverage universe
within the sector
RELATIVE RISK RATING
Ratings Criteria
Low (L) Bottom 1/3rd percentile in the sector
Medium (M) Middle 1/3rd percentile in the sector
High (H) Top 1/3rd percentile in the sector
Risk ratings are based on Edelweiss risk model
SECTOR RATING
Ratings Criteria
Overweight (OW) Sector return > 1.25 x Nifty return
Equalweight (EW) Sector return > 0.75 x Nifty return
Sector return < 1.25 x Nifty return
Underweight (UW) Sector return < 0.75 x Nifty return
11 Edelweiss Securities Limited
Cipla
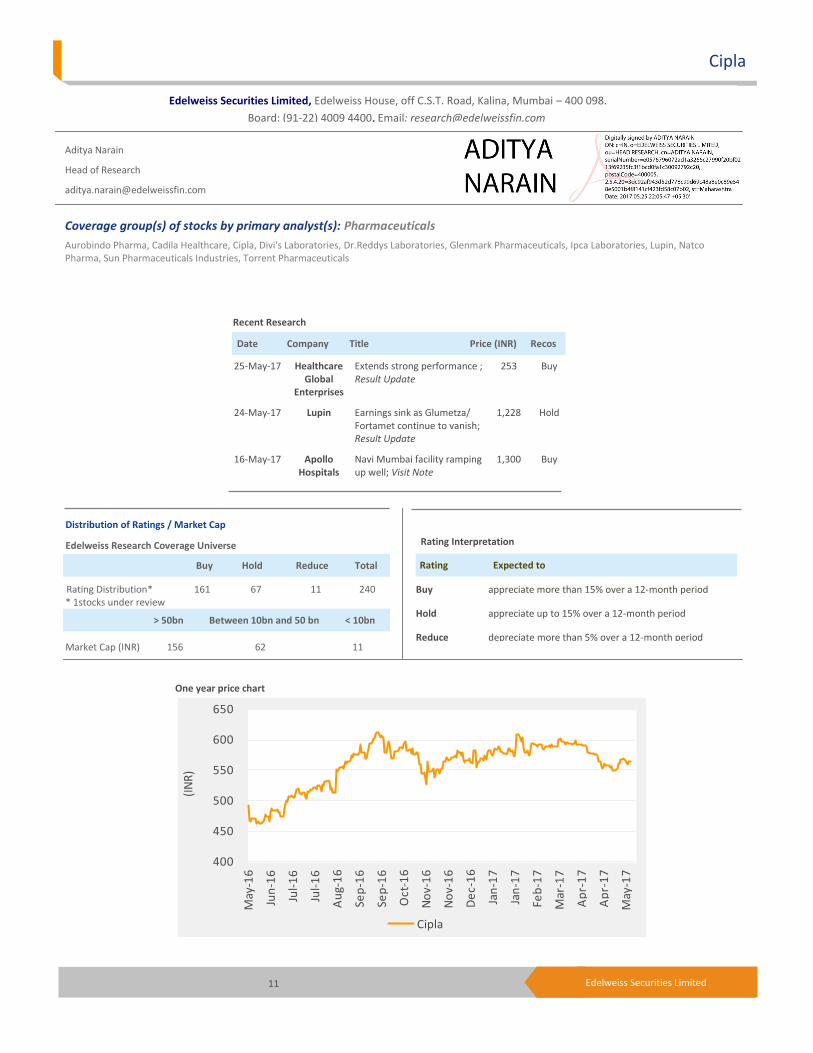
Edelweiss Securities Limited, Edelweiss House, off C.S.T. Road, Kalina, Mumbai – 400 098.
Board: (91-22) 4009 4400, Email: [email protected]
Aditya Narain
Head of Research
Coverage group(s) of stocks by primary analyst(s): Pharmaceuticals
Aurobindo Pharma, Cadila Healthcare, Cipla, Divi's Laboratories, Dr.Reddys Laboratories, Glenmark Pharmaceuticals, Ipca Laboratories, Lupin, Natco Pharma, Sun Pharmaceuticals Industries, Torrent Pharmaceuticals
Distribution of Ratings / Market Cap
Edelweiss Research Coverage Universe
Rating Distribution* 161 67 11 240 * 1stocks under review
Market Cap (INR) 156 62 11
Date Company Title Price (INR) Recos
Recent Research
25-May-17 Healthcare Global
Enterprises
Extends strong performance ; Result Update
253 Buy
24-May-17 Lupin Earnings sink as Glumetza/ Fortamet continue to vanish; Result Update
1,228 Hold
16-May-17 Apollo Hospitals
Navi Mumbai facility ramping up well; Visit Note
1,300 Buy
> 50bn Between 10bn and 50 bn < 10bn
Buy Hold Reduce Total
Rating Interpretation
Buy appreciate more than 15% over a 12-month period
Hold appreciate up to 15% over a 12-month period
Reduce depreciate more than 5% over a 12-month period
Rating Expected to
-
149
297
446
594
743
Jan
-14
Feb
-14
Mar
-14
Ap
r-1
4
May
-14
Jun
-14
Jul-
14
Au
g-1
4
Sep
-14
Oct
-14
No
v-1
4
De
c-1
4
(IN
R)
One year price chart
400
450
500
550
600
650
May
-16
Jun
-16
Jul-
16
Jul-
16
Au
g-1
6
Sep
-16
Sep
-16
Oct
-16
No
v-1
6
No
v-1
6
De
c-1
6
Jan
-17
Jan
-17
Feb
-17
Mar
-17
Ap
r-1
7
Ap
r-1
7
May
-17
(IN
R)
Cipla

12 Edelweiss Securities Limited
Pharmaceuticals
DISCLAIMER
Edelweiss Securities Limited (“ESL” or “Research Entity”) is regulated by the Securities and Exchange Board of India (“SEBI”) and is licensed to carry on the business of broking, depository services and related activities. The business of ESL and its Associates (list available on www.edelweissfin.com) are organized around five broad business groups – Credit including Housing and SME Finance, Commodities, Financial Markets, Asset Management and Life Insurance.
This Report has been prepared by Edelweiss Securities Limited in the capacity of a Research Analyst having SEBI Registration No.INH200000121 and distributed as per SEBI (Research Analysts) Regulations 2014. This report does not constitute an offer or solicitation for the purchase or sale of any financial instrument or as an official confirmation of any transaction. Securities as defined in clause (h) of section 2 of the Securities Contracts (Regulation) Act, 1956 includes Financial Instruments and Currency Derivatives. The information contained herein is from publicly available data or other sources believed to be reliable. This report is provided for assistance only and is not intended to be and must not alone be taken as the basis for an investment decision. The user assumes the entire risk of any use made of this information. Each recipient of this report should make such investigation as it deems necessary to arrive at an independent evaluation of an investment in Securities referred to in this document (including the merits and risks involved), and should consult his own advisors to determine the merits and risks of such investment. The investment discussed or views expressed may not be suitable for all investors.
This information is strictly confidential and is being furnished to you solely for your information. This information should not be reproduced or redistributed or passed on directly or indirectly in any form to any other person or published, copied, in whole or in part, for any purpose. This report is not directed or intended for distribution to, or use by, any person or entity who is a citizen or resident of or located in any locality, state, country or other jurisdiction, where such distribution, publication, availability or use would be contrary to law, regulation or which would subject ESL and associates / group companies to any registration or licensing requirements within such jurisdiction. The distribution of this report in certain jurisdictions may be restricted by law, and persons in whose possession this report comes, should observe, any such restrictions. The information given in this report is as of the date of this report and there can be no assurance that future results or events will be consistent with this information. This information is subject to change without any prior notice. ESL reserves the right to make modifications and alterations to this statement as may be required from time to time. ESL or any of its associates / group companies shall not be in any way responsible for any loss or damage that may arise to any person from any inadvertent error in the information contained in this report. ESL is committed to providing independent and transparent recommendation to its clients. Neither ESL nor any of its associates, group companies, directors, employees, agents or representatives shall be liable for any damages whether direct, indirect, special or consequential including loss of revenue or lost profits that may arise from or in connection with the use of the information. Our proprietary trading and investment businesses may make investment decisions that are inconsistent with the recommendations expressed herein. Past performance is not necessarily a guide to future performance .The disclosures of interest statements incorporated in this report are provided solely to enhance the transparency and should not be treated as endorsement of the views expressed in the report. The information provided in these reports remains, unless otherwise stated, the copyright of ESL. All layout, design, original artwork, concepts and other Intellectual Properties, remains the property and copyright of ESL and may not be used in any form or for any purpose whatsoever by any party without the express written permission of the copyright holders.
ESL shall not be liable for any delay or any other interruption which may occur in presenting the data due to any reason including network (Internet) reasons or snags in the system, break down of the system or any other equipment, server breakdown, maintenance shutdown, breakdown of communication services or inability of the ESL to present the data. In no event shall ESL be liable for any damages, including without limitation direct or indirect, special, incidental, or consequential damages, losses or expenses arising in connection with the data presented by the ESL through this report.
We offer our research services to clients as well as our prospects. Though this report is disseminated to all the customers simultaneously, not all customers may receive this report at the same time. We will not treat recipients as customers by virtue of their receiving this report.
ESL and its associates, officer, directors, and employees, research analyst (including relatives) worldwide may: (a) from time to time, have long or short positions in, and buy or sell the Securities, mentioned herein or (b) be engaged in any other transaction involving such Securities and earn brokerage or other compensation or act as a market maker in the financial instruments of the subject company/company(ies) discussed herein or act as advisor or lender/borrower to such company(ies) or have other potential/material conflict of interest with respect to any recommendation and related information and opinions at the time of publication of research report or at the time of public appearance. ESL may have proprietary long/short position in the above mentioned scrip(s) and therefore should be considered as interested. The views provided herein are general in nature and do not consider risk appetite or investment objective of any particular investor; readers are requested to take independent professional advice before investing. This should not be construed as invitation or solicitation to do business with ESL.

13 Edelweiss Securities Limited
Cipla
ESL or its associates may have received compensation from the subject company in the past 12 months. ESL or its associates may have managed or co-managed public offering of securities for the subject company in the past 12 months. ESL or its associates may have received compensation for investment banking or merchant banking or brokerage services from the subject company in the past 12 months. ESL or its associates may have received any compensation for products or services other than investment banking or merchant banking or brokerage services from the subject company in the past 12 months. ESL or its associates have not received any compensation or other benefits from the Subject Company or third party in connection with the research report. Research analyst or his/her relative or ESL’s associates may have financial interest in the subject company. ESL and/or its Group Companies, their Directors, affiliates and/or employees may have interests/ positions, financial or otherwise in the Securities/Currencies and other investment products mentioned in this report. ESL, its associates, research analyst and his/her relative may have other potential/material conflict of interest with respect to any recommendation and related information and opinions at the time of publication of research report or at the time of public appearance.
Participants in foreign exchange transactions may incur risks arising from several factors, including the following: ( i) exchange rates can be volatile and are subject to large fluctuations; ( ii) the value of currencies may be affected by numerous market factors, including world and national economic, political and regulatory events, events in equity and debt markets and changes in interest rates; and (iii) currencies may be subject to devaluation or government imposed exchange controls which could affect the value of the currency. Investors in securities such as ADRs and Currency Derivatives, whose values are affected by the currency of an underlying security, effectively assume currency risk.
Research analyst has served as an officer, director or employee of subject Company: No
ESL has financial interest in the subject companies: No
ESL’s Associates may have actual / beneficial ownership of 1% or more securities of the subject company at the end of the month immediately preceding the date of publication of research report.
Research analyst or his/her relative has actual/beneficial ownership of 1% or more securities of the subject company at the end of the month immediately preceding the date of publication of research report: No
ESL has actual/beneficial ownership of 1% or more securities of the subject company at the end of the month immediately preceding the date of publication of research report: No
Subject company may have been client during twelve months preceding the date of distribution of the research report.
There were no instances of non-compliance by ESL on any matter related to the capital markets, resulting in significant and material disciplinary action during the last three years except that ESL had submitted an offer of settlement with Securities and Exchange commission, USA (SEC) and the same has been accepted by SEC without admitting or denying the findings in relation to their charges of non registration as a broker dealer.
A graph of daily closing prices of the securities is also available at www.nseindia.com
Analyst Certification:
The analyst for this report certifies that all of the views expressed in this report accurately reflect his or her personal views about the subject company or companies and its or their securities, and no part of his or her compensation was, is or will be, directly or indirectly related to specific recommendations or views expressed in this report.
Additional Disclaimers
Disclaimer for U.S. Persons
This research report is a product of Edelweiss Securities Limited, which is the employer of the research analyst(s) who has prepared the research report. The research analyst(s) preparing the research report is/are resident outside the United States (U.S.) and are not associated persons of any U.S. regulated broker-dealer and therefore the analyst(s) is/are not subject to supervision by a U.S. broker-dealer, and is/are not required to satisfy the regulatory licensing requirements of FINRA or required to otherwise comply with U.S. rules or regulations regarding, among other things, communications with a subject company, public appearances and trading securities held by a research analyst account.
This report is intended for distribution by Edelweiss Securities Limited only to "Major Institutional Investors" as defined by Rule 15a-6(b)(4) of the U.S. Securities and Exchange Act, 1934 (the Exchange Act) and interpretations thereof by U.S. Securities and Exchange Commission (SEC) in reliance on Rule 15a 6(a)(2). If the recipient of this report is not a Major Institutional Investor as specified above, then it should not act upon this report and return the same to the sender. Further, this report may not be copied, duplicated and/or transmitted onward to any U.S. person, which is not the Major Institutional Investor.

14 Edelweiss Securities Limited
Pharmaceuticals
Access the entire repository of Edelweiss Research on www.edelresearch.com
In reliance on the exemption from registration provided by Rule 15a-6 of the Exchange Act and interpretations thereof by the SEC in order to conduct certain business with Major Institutional Investors, Edelweiss Securities Limited has entered into an agreement with a U.S. registered broker-dealer, Edelweiss Financial Services Inc. ("EFSI"). Transactions in securities discussed in this research report should be effected through Edelweiss Financial Services Inc. Disclaimer for U.K. Persons
The contents of this research report have not been approved by an authorised person within the meaning of the Financial Services and Markets Act 2000 ("FSMA"). In the United Kingdom, this research report is being distributed only to and is directed only at (a) persons who have professional experience in matters relating to investments falling within Article 19(5) of the FSMA (Financial Promotion) Order 2005 (the “Order”); (b) persons falling within Article 49(2)(a) to (d) of the Order (including high net worth companies and unincorporated associations); and (c) any other persons to whom it may otherwise lawfully be communicated (all such persons together being referred to as “relevant persons”). This research report must not be acted on or relied on by persons who are not relevant persons. Any investment or investment activity to which this research report relates is available only to relevant persons and will be engaged in only with relevant persons. Any person who is not a relevant person should not act or rely on this research report or any of its contents. This research report must not be distributed, published, reproduced or disclosed (in whole or in part) by recipients to any other person. Disclaimer for Canadian Persons
This research report is a product of Edelweiss Securities Limited ("ESL"), which is the employer of the research analysts who have prepared the research report. The research analysts preparing the research report are resident outside the Canada and are not associated persons of any Canadian registered adviser and/or dealer and, therefore, the analysts are not subject to supervision by a Canadian registered adviser and/or dealer, and are not required to satisfy the regulatory licensing requirements of the Ontario Securities Commission, other Canadian provincial securities regulators, the Investment Industry Regulatory Organization of Canada and are not required to otherwise comply with Canadian rules or regulations regarding, among other things, the research analysts' business or relationship with a subject company or trading of securities by a research analyst. This report is intended for distribution by ESL only to "Permitted Clients" (as defined in National Instrument 31-103 ("NI 31-103")) who are resident in the Province of Ontario, Canada (an "Ontario Permitted Client"). If the recipient of this report is not an Ontario Permitted Client, as specified above, then the recipient should not act upon this report and should return the report to the sender. Further, this report may not be copied, duplicated and/or transmitted onward to any Canadian person. ESL is relying on an exemption from the adviser and/or dealer registration requirements under NI 31-103 available to certain international advisers and/or dealers. Please be advised that (i) ESL is not registered in the Province of Ontario to trade in securities nor is it registered in the Province of Ontario to provide advice with respect to securities; (ii) ESL's head office or principal place of business is located in India; (iii) all or substantially all of ESL's assets may be situated outside of Canada; (iv) there may be difficulty enforcing legal rights against ESL because of the above; and (v) the name and address of the ESL's agent for service of process in the Province of Ontario is: Bamac Services Inc., 181 Bay Street, Suite 2100, Toronto, Ontario M5J 2T3 Canada. Disclaimer for Singapore Persons
In Singapore, this report is being distributed by Edelweiss Investment Advisors Private Limited ("EIAPL") (Co. Reg. No. 201016306H) which is a holder of a capital markets services license and an exempt financial adviser in Singapore and (ii) solely to persons who qualify as "institutional investors" or "accredited investors" as defined in section 4A(1) of the Securities and Futures Act, Chapter 289 of Singapore ("the SFA"). Pursuant to regulations 33, 34, 35 and 36 of the Financial Advisers Regulations ("FAR"), sections 25, 27 and 36 of the Financial Advisers Act, Chapter 110 of Singapore shall not apply to EIAPL when providing any financial advisory services to an accredited investor (as defined in regulation 36 of the FAR. Persons in Singapore should contact EIAPL in respect of any matter arising from, or in connection with this publication/communication. This report is not suitable for private investors.
Copyright 2009 Edelweiss Research (Edelweiss Securities Ltd). All rights reserved