Embed Size (px)
Citation preview

WHITE PAPER
Busting Myths about FeedbackWhat Leaders Should Know
By: William A. Gentry and Stephen F. Young

ContentsIntroduction 1
Making the Business Case for Feedback 2
What is Feedback and Why Is it Important? 4
The Results 5
Summary of Findings 13
So What? 14
Feedback Best Practices 15
Conclusion 19
About the Research 20
Endnotes 20
References 20
About the Authors 21

©2017 Center for Creative Leadership. All rights reserved. 1
IntroductionThe saying goes, “Feedback is a gift.” At work, we believe feedback should help those receiving it. But many times when it comes to feedback, like those ugly socks or worthless gadgets we get at birthdays or holidays, we want to return those gifts as soon as we receive them. That is, if feedback is even given to us in the fi rst place.
There are many thoughts and opinions about feedback: what it is, how to give it, how often these “gifts” must be given, and the benefi ts of only giving positive feedback. To better understand the intricacies of feedback in the workplace, we surveyed 235 leaders in organizations around the world. Our fi ndings will clarify the process of giving and receiving feedback, including:
• How often we typically get feedback from our bosses;
• What types of feedback (positive vs. negative, process vs. outcome) we actually get from our bosses;
• What types of feedback we would actually prefer to get from our bosses;
• How often we give feedback to our direct reports (and what types);
• Best practices for giving and receiving feedback.
Our research will increase awareness of what feedback is and what it is not. By doing so, we will dispel popular myths about the kind of feedback that employees really want to have to develop and improve.

2 ©2017 Center for Creative Leadership. All rights reserved.
Making the Business Case for Feedback
Jim, a young high potential, used to work in a sales role at a large telecommunications provider. He really enjoyed his work as a customer sales representative and often volunteered to stay overtime when the company needed him. His coworkers and boss thought Jim was a really nice guy who interacted well with the customers. Yet, Jim never got the promotion he wanted because his sales numbers were not exceeding expectations. Jim eventually left the company for a competitor and in his new organization, eventually got the promotion he wanted, becoming a top sales manager.
Why couldn’t Jim get the promotion at his former organization? Jim’s old boss never told Jim that he needed to improve his time-management skills; Jim was such a nice guy that he would spend too much time speaking with customers, causing him to neglect other potential buyers. Therefore, he wasn’t “exceeding the numbers” and growing potential new buyers at a rate that was necessary for bonuses and promotions. Unfortunately, Jim’s former boss didn’t give him the feedback he needed before Jim decided to leave. His new boss, however, did give feedback on the behavior that derailed Jim in his previous organization. Jim took it to heart, and changed his behavior in this area, leading to his promotion. Later, we’ll circle back and let you know how Jim’s new manager delivered this important feedback.
Jim’s story is relatable to a lot of us. So often, bosses do not give enough negative feedback for a number of reasons. They could be uncomfortable with the emotional reactions to feedback, discourage employees from seeking feedback by the intentional (or unintentional) creation of a culture with low tolerance for failure, or they may consistently fi nd faults and shoot down any idea brought to them (Moss & Sanchez, 2004).

©2017 Center for Creative Leadership. All rights reserved. 3
When managers avoid giving feedback to their employees or don’t set up environments that encourage individuals to seek out feedback, it hurts the individual and the organization. The individual is left feeling confused or angry. High potentials eventually leave the organization. Poor performers get even worse, which in turn hurts the performance of everyone else around them, ultimately aff ecting the bottom line. For instance, in a study of 83 executives, researchers at Ohio State University and Northwestern University determined that the inability to give under-performing employees feedback was one of the top “people problems” managers must deal with. According to the executives, the inability to give under-performing employees feedback cost their organizations between $6,000 and $8,000 per day (Menon & Thompson, 2016).
In an attempt to “fi x” the issue, some consultants have been teaching managers to just provide positive feedback to solve this problem. For example, a 2013 SHRM/Globoforce survey of 764 human resource professionals found that 94% of respondents said that positive feedback (reinforcing behaviors or performances that should be repeated) versus negative feedback (pointing out specifi c behaviors or performances that need improvement) has a greater impact on improving employee performance. One could infer that negative feedback is not as important to provide employees at work.
Through the data we have collected, we will argue that such fi ndings are misleading and dangerous to managers. To the contrary, the research
shows that negative feedback is just as important—if not more
important—for performance management issues at work.

4 ©2017 Center for Creative Leadership. All rights reserved.
What is Feedback and Why Is it Important?Many people assume that feedback is just being told that you did a good job on a task or that you did poorly on something. Yet, researchers at the University of Akron have found that feedback involves more than just a simple evaluation of whether someone performed well or poorly (Medvedeff , Gregory, & Levy, 2008). Specifi cally, there are four types of feedback that employees can receive on their work performance:
In a recent study with college students, University of Akron researchers found that positive outcome feedback and negative process feedback motivate individuals the most. People were most likely to seek more feedback when they received negative process feedback that told them what they were doing wrong and what they could do to increase performance as they worked on a task. Receiving positive outcome feedback also made individuals want to seek additional feedback but not as much as negative process feedback did. Positive outcome feedback was rewarding, and negative process feedback provided useful information to help individuals improve. In short, these types of feedback were most motivating but for diff erent reasons.
The academic research clearly shows that negative feedback in fact is important, and if used correctly, can be a tool for managers to use in performance management. People gain self-awareness and understand their strengths when they get positive feedback and become aware of opportunities for development when they get negative feedback. And contrary to popular belief, negative feedback (particularly negative process feedback) can be a powerful tool for leaders to use when working to motivate employees to get better—if delivered constructively.
• Positive Outcome Feedback a favorable evaluation of a completed task
(e.g., “Good work!”)
• Negative Outcome Feedback an unfavorable evaluation of a completed task
(e.g., “This work is not acceptable.”)
• Positive Process Feedback real-time feedback on what is going well as a task is being completed
(e.g., “Good work! You are spending the right amount of time working on this task.”)
• Negative Process Feedback
real-time feedback on what is not going well as a task is being completed (e.g., “This work is not acceptable. You are not spending the right amount of time working on this task.”)

©2017 Center for Creative Leadership. All rights reserved. 5
Daily6%
The Results
Exhibit 1
How often do people get feedback from their boss? First, we asked participants, “How often do you get feedback from your boss?” with the choices being daily, weekly, at least once a month if not more often, quarterly, and annually. As shown in Exhibit 1, only 6% (14 of the 235) said daily. The most popular choice was weekly, chosen by almost a third of participants, followed closely by monthly (27%). Further, 15% chose quarterly and 20% said annually. So, it could be said that a majority, 65% of participants, get some sort of feedback monthly, and 38%, in fact, get some sort of feedback at least once a week, if not daily.
Quarterly15%
Annually20%
Monthly27%
Weekly32%
We, however, wanted to learn more behind the realities and practicalities of feedback at work. We wanted to see how feedback actually plays out in the workplace with leaders. We therefore asked 235 leaders from around the world specifi c questions about the frequency and type of feedback they tend to give and receive. The purpose of the current study is to benchmark these feedback practices in a sample of global leaders so that organizations and their leaders can become more aware of the diff erent types of feedback they should be providing employees. What follows are the results and some ideas for best practices around feedback in the workplace.

6 ©2017 Center for Creative Leadership. All rights reserved.
Negative Outcome
11%
What types of feedback do people actually get from their boss? Next, we asked participants, “Over the last three months, think about the total amount of feedback you received from your immediate boss. What percentage of that feedback was positive outcome (e.g., “Good work!”), positive process (“Good work! You are spending the right amount of time working on this task.”), negative outcome (e.g., “This work is not acceptable.”) and negative process (e.g., “This work is not acceptable. You are not spending the right amount of time working on this task.”). Participants fi lled in percentages of each choice, ranging from 0% to 100% for each choice. All choices when added together had to equal 100%.
According to results which can be seen in Exhibit 2, most of the feedback participants received from their bosses is positive. More than three-fourths (77%) of the feedback participants received in the last three months was positive, with more positive outcome (44%) than positive process (33%). The negative feedback received was split almost evenly with negative process (12%) and negative outcome (11%).
Negative Process
12%Positive Process
33%
Positive Outcome
44%
Exhibit 2

©2017 Center for Creative Leadership. All rights reserved. 7
Negative Outcome
17%
What types of feedback would people prefer to get from their boss? Are the preferences for feedback similar or diff erent from the actual feedback received? We asked participants to think about the total amount of feedback they would prefer to get from their boss and like the previous question, fi lled in percentages for each of the four choices, ranging from 0% to 100% for each choice. Again, all choices when added together had to equal 100%. Exhibit 3 shows the results.
Negative Process
18%Positive Process
32%
Positive Outcome
33%
Exhibit 3

8 ©2017 Center for Creative Leadership. All rights reserved.
We found that participants actually would prefer a little less positive feedback (65% as compared to the 77% they are actually getting) and a little more negative feedback (35% as compared to the 23% they are actually getting). So, participants would prefer to get a little less positive outcome feedback (i.e., “Good job”) and a little more of both negative outcome and negative process than what they are actually getting. Individuals want to receive the same amount of positive process outcome feedback they are already getting.
Statistical analyses also suggest that while there are no signifi cant diff erences between the amount of positive process feedback received to preferred,1 participants actually would like to receive more negative process2 and negative outcome feedback3 from their boss, and less positive outcome feedback4 from their boss. Exhibit 4 shows these similarities and diff erences.
45
40
35
30
25
20
15
10
5
0
Perc
enta
ge
Actual Feedback Received Compared to Feedback Preferred
Positive Outcome* Negative Outcome* Positive Process Negative Process*
Preferred Received Preferred ReceivedPreferred Received Preferred Received
*Statistically Signifi cant Diff erence
Exhibit 4

©2017 Center for Creative Leadership. All rights reserved. 9
Annually2%
Quarterly6%
How often do people give feedback to their own direct reports? In the previous set of questions, we asked participants about the feedback they receive versus what they’d prefer to receive. Next, we examined the feedback they actually gave by asking, “How often do you typically give feedback to your own subordinates?” with choices of daily, weekly, monthly, quarterly, and annually. As shown in Exhibit 5, a majority (53%) give feedback weekly, with another 18% saying they give feedback daily. Over one-fi fth (21%) said they gave feedback monthly. Chosen less often, 6% said they gave feedback quarterly and 2% said they gave feedback yearly. Interestingly, the frequency of feedback these leaders report giving to their direct reports on a weekly, if not daily basis (71%) is much more than the amount of feedback they actually received from their own boss (38%).
Exhibit 5
Daily18%
Monthly21%
Weekly53%

10 ©2017 Center for Creative Leadership. All rights reserved.
What types of feedback do people give their own direct reports? When asked how much of the four diff erent types of feedback these leaders gave their direct reports, almost two-thirds (65%) is positive with equal amounts of positive outcome (32%) and positive process (33%). Of the negative feedback given, the amounts are almost equal as well, with slightly more negative process given (19%) than negative outcome (16%). Exhibit 6 shows these results.
Negative Outcome
16%
Positive Outcome
32%
Negative Process
19%Positive Process
33%
Exhibit 6
©2017 Center for Creative Leadership. All rights reserved. 11
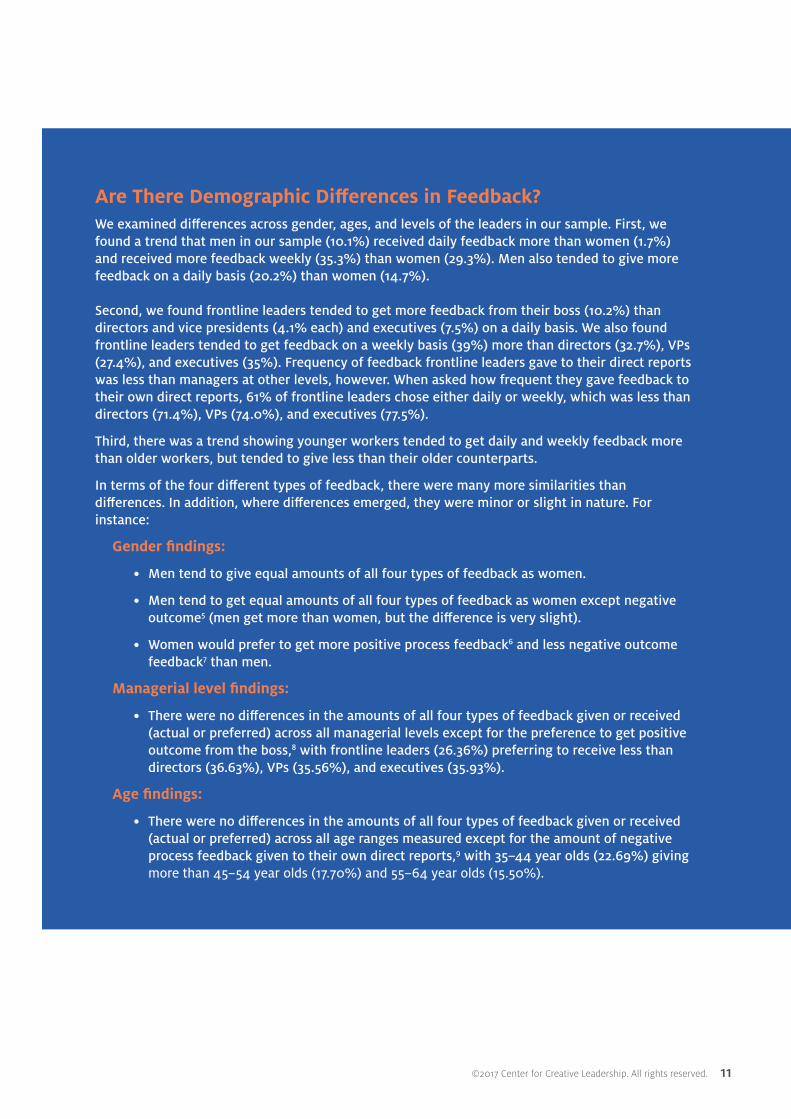
We examined diff erences across gender, ages, and levels of the leaders in our sample. First, we found a trend that men in our sample (10.1%) received daily feedback more than women (1.7%) and received more feedback weekly (35.3%) than women (29.3%). Men also tended to give more feedback on a daily basis (20.2%) than women (14.7%).
Second, we found frontline leaders tended to get more feedback from their boss (10.2%) than directors and vice presidents (4.1% each) and executives (7.5%) on a daily basis. We also found frontline leaders tended to get feedback on a weekly basis (39%) more than directors (32.7%), VPs (27.4%), and executives (35%). Frequency of feedback frontline leaders gave to their direct reports was less than managers at other levels, however. When asked how frequent they gave feedback to their own direct reports, 61% of frontline leaders chose either daily or weekly, which was less than directors (71.4%), VPs (74.0%), and executives (77.5%).
Third, there was a trend showing younger workers tended to get daily and weekly feedback more than older workers, but tended to give less than their older counterparts.
In terms of the four diff erent types of feedback, there were many more similarities than diff erences. In addition, where diff erences emerged, they were minor or slight in nature. For instance:
Gender fi ndings:
• Men tend to give equal amounts of all four types of feedback as women.
• Men tend to get equal amounts of all four types of feedback as women except negative outcome5 (men get more than women, but the diff erence is very slight).
• Women would prefer to get more positive process feedback6 and less negative outcome feedback7 than men.
Managerial level fi ndings:
• There were no diff erences in the amounts of all four types of feedback given or received (actual or preferred) across all managerial levels except for the preference to get positive outcome from the boss,8 with frontline leaders (26.36%) preferring to receive less than directors (36.63%), VPs (35.56%), and executives (35.93%).
Age fi ndings:
• There were no diff erences in the amounts of all four types of feedback given or received (actual or preferred) across all age ranges measured except for the amount of negative process feedback given to their own direct reports,9 with 35–44 year olds (22.69%) giving more than 45–54 year olds (17.70%) and 55–64 year olds (15.50%).
Are There Demographic Diff erences in Feedback?

12 ©2017 Center for Creative Leadership. All rights reserved.
Do eff ective and ineff ective leaders give diff erent types of feedback? We took a deeper look into how much and what type of feedback ineff ective and highly eff ective bosses give their subordinates. To examine this, we asked all 235 participants to rate their boss’s performance on his or her present job using a 1–5 scale with 1 = among the worst and 5 = among the best. We labeled “ineff ective bosses” as those receiving less than a 3 on the 5-point scale, and “highly eff ective bosses” as receiving a 5 on the 5-point scale. This resulted in one group of 39 participants with “ineff ective bosses” and 57 with “highly eff ective bosses.”
First, we found a trend that participants with ineff ective bosses in our sample tended to receive less weekly or daily feedback (5.1% daily and 20.5% weekly) than participants with highly eff ective bosses (8.8% daily and 45.6% weekly). Further, the major diff erence in the type of feedback received was positive process.10 Those with ineff ective bosses get positive process feedback 22.1% of the time, while those with highly eff ective bosses get positive process feedback 34.1% of the time. It seems the two major diff erentiators between ineff ective and highly eff ective bosses are the frequency of feedback and the amount of positive process feedback they give.

©2017 Center for Creative Leadership. All rights reserved. 13
Summary of FindingsWe asked 235 people what they thought about getting and receiving feedback. Key fi ndings include:
• Well over half (65%) of individuals receive feedback at least on a monthly basis; 38% are getting feedback even more frequently on a weekly basis—if not daily.
• Though individuals receive a lot more positive feedback (77%) than negative feedback (23%) from their bosses, they actually want more negative feedback. Specifi cally, individuals would prefer to get a little less positive outcome feedback (i.e., “Good job”) and a little more of both negative outcome and negative process than what they are actually getting.
• Individuals reported giving a lot more feedback to their subordinates on a weekly, if not daily basis (71%) than what they personally receive from their own boss (38%).
• There are some trends based on demographic diff erences:
- Men are getting more feedback than women.
- Front-line leaders give less feedback to their direct reports compared to higher-level leaders.
- Young leaders give less feedback than their older counterparts.
- Despite some slight diff erences, all individuals would like to receive a little less positive outcome feedback (i.e., “Good job”) and a little more of both negative outcome and negative process than what they are actually getting.
• Individuals with highly eff ective bosses receive a lot more feedback (54%) than those with ineff ective bosses (26%) on at least a weekly basis, if not daily. And, highly eff ective bosses give more positive process feedback.

14 ©2017 Center for Creative Leadership. All rights reserved.
So What?Overall, this research—using a global sample of 235 leaders—shows that contrary to a lot of popular opinion, people really want to receive more negative feedback from their own bosses than they are actually getting. This fi nding is also in line with scholarly work that previously found individuals are motivated by both positive and negative feedback (Medvedeff et al., 2008). Specifi cally, we found that individuals would prefer to get a little less positive outcome feedback (i.e., “Good job”) and a little more of both negative outcome and negative process. And the most highly eff ective bosses are providing a lot more feedback—particularly positive process feedback—to their direct reports than ineff ective bosses. Our sample of leaders even reports giving more feedback to their own direct reports than they get from their own bosses.
So why is this trend happening? Positive feedback makes us feel good, and clearly we are naturally more likely to respond to it (London, 2003). Many studies have documented the above average eff ect: people’s tendency to rate
themselves as above average on everything from driving (Guerin, 1994) to physical attractiveness (Eply & Whitchurch, 2008), and relevant to this research, competence at work (Gawande, 2002). These infl ated views are not necessarily a bad thing; the above-average eff ect can protect against depression and promote well-being (Taylor & Brown, 1988). However, this eff ect makes us less likely to be open to receiving accurate, constructive feedback. Since this feedback contradicts our above-average views of ourselves, we react emotionally and often shut down (London, 2003). But it does not have to be this way.
Leaders can learn and engage in practices that reduce the immediate emotional reaction that people instinctively feel when getting negative feedback.
The following section off ers advice, tips, and best practices in giving feedback—both positive and negative.
?

©2017 Center for Creative Leadership. All rights reserved. 15
Feedback Best PracticesProviding feedback to employees is a major job responsibility of leaders in organizations. We encourage managers to view feedback as an inherent part of their role as leaders to provide information aimed at helping their employees understand how they are meeting specifi c work goals. If leaders and employees view feedback as just information to help someone get better, the emotional bite it takes out of others can be reduced or eliminated. But how should they go about giving feedback in this way to maximize its acceptance and reduce resistance? The following is a list of some advice, tips, and best practices in giving feedback.
SBI: Situation, Behavior, Impact—The SBI model is a useful way for leaders to give feedback.
1. SituationDescribe the specifi c situation in which the behavior occurred.
For example, “Yesterday at 11 when we were in the team debrief meeting in room 200. . .”Avoid generalities, such as “last week,” or “the whole afternoon” as they can lead to confusion.
2. BehaviorDescribe the actual, observable behavior being discussed. Keep to the facts. Don’t insert opinions or judgments.
An example would be “You stood up and began talking about next year’s budget fi ve minutes into my presentation about the action review process,” instead of “You were rude.”
3. ImpactDescribe the impact the behavior had on you. Maybe this person has gotten into the habit of interrupting presentations and might not realize the eff ect of such behavior. If you believe that behavior needs to stop or be changed, you can use such impact words as “troubled” or “worried” or “frustrated” or “upset”.
For example, “I felt frustrated because I lost my train of thought, and upset because I felt unheard.”
If giving positive feedback, the impact part of SBI can be given in a positive way. Words like “impressed” or “proud” can help underscore the success of the behavior. For instance, if the situation was, “In the presentation you gave at 2 p.m. Tuesday to the board” and the behavior was, “You gave information about our competitors that we did not know about” and you want that behavior to continue in the future, you could say, “I was impressed when you addressed that issue without being asked.”
Because you are describing exactly what happened and explaining your true feelings—not passing judgment—the recipient is more likely to listen and learn.

16 ©2017 Center for Creative Leadership. All rights reserved.
How Feedback Helped JimRemember Jim from the introduction? In his former organization, he was never given feedback about the amount of time spent with current clients and how much time he needed to spend growing new clients. His boss in his current organization, however, wanted to use feedback to help develop Jim. This is how he used SBI feedback.
1. SituationJim’s boss fi rst described the specifi c situation in which the behavior occurred. For example, “Yesterday between the hours of 1 and 4 in the afternoon on the sales fl oor. . .”
2. BehaviorJim’s boss knew Jim took too long on calls with existing clients, so he gave a clear behavior: “You made one call to an existing client that lasted an hour and a half.”
3. ImpactDescribe the results of the behavior. Jim’s boss could describe the impact in four ways: positive outcome, positive process, negative outcome, and negative process. Depending on the situation, any of the various types may be important to provide.
Clearly, Jim’s boss at his current organization felt like this behavior needed to change.
• A negative outcome example could be, “When you spent that amount of time on the phone, I felt worried.”
• A negative process example could be, “When you spend that amount of time on the phone, I feel worried because the quotas for bringing in new clients are less achievable.”
Negative outcome and negative process feedback, can be diffi cult to hear but are clearly necessary in performance management. Though this was the fi rst time Jim had ever heard this feedback, he took it well. The SBI was the start of a conversation and the beginnings of a developmental plan to change behaviors so that Jim spent a little less time on current clients and more time expanding his client base. Three months later, Jim’s boss noticed he had changed for the better. On the sales fl oor, he noticed Jim was showing better time management. He wanted to give an SBI. The impact part of SBI could be:
• A positive outcome example: “I was impressed by your work.”
• A positive process example: “I am impressed by the work you are doing because you’re spending the right amount of time on current clients and expanding your client base.”

©2017 Center for Creative Leadership. All rights reserved. 17
As you give feedback in the SBI way, remember to keep it simple. SBI has three parts, so aim for three short, concise, and clear sentences. Steer clear of generalities like “always” and “never” because truthfully, nobody does something all the time or never. Avoid sarcastic humor to lighten the situation—keep it straight, to the point. And do not mix feedback with a threat or promise to avoid sending a mixed message.
• Frequency and timing—What is the proper ratio of positive to negative feedback? And when should feedback be given? Based on the results of our study, 66–75% of the total amount of feedback given over a period of time should be positive (with pretty much equal amounts process and outcome). So that’s around a 2:1 or 3:1 ratio, positive to negative. At the very least give that amount, but we also suggest to “strive for fi ve” as in a 5:1 positive to negative ratio. The 5:1 ratio is from the research of relationship experts John and Julie Gottman (Gottman, 1994) and their work investigating successful marriages and those ending in divorce. In their work with married couples, the ratio of positive to negative interactions during a time when the couple was in confl ict was usually around 5:1 for couples in successful marriages. For couples who were in unstable marriages, often ending in divorce, the ratio was far less, usually 0.8:1. If that 5:1 ratio of positive to negative interactions during confl ict is good enough to predict whether a marriage will be successful or not, it might be a rule of thumb worth considering in the amount of positive and negative feedback to give at work to others.
• Further, regardless of whether the feedback is positive or negative, process or outcome, it should be given “just in time” as soon as possible, so that the individual will accurately recall the event and avoid repeating the same behavior in the future. And by the way, don’t sandwich feedback. Even the best of bosses hate to deliver negative feedback, but they do still do it. And based on our results, people want it. You may fi nd it diffi cult at fi rst, so you may try to put in a compliment or positive feedback fi rst (that’s the bottom slice of bread). Then comes “the meat” or the bad news. Then put on that top-slice of bread whether it is another piece of positive feedback, a compliment, or some other means of dismissing the “meat” of the sandwich. If you sandwich your feedback this way, people will ignore the fi rst thing they hear because they know the bad news is coming next. And they won’t hear the last part because they will be stuck on the bad news in the middle. Sandwiches are great for lunch and picnics. Not for feedback.
• Show empathy when delivering negative feedback. By showing that you genuinely care about their welfare and that you recognize their need to improve performance, feedback recipients will have more interest and enthusiasm for accepting and using the feedback to get better (Young, Moukarzel, Steelman, Richard, & Gallo, 2013). This approach to delivering feedback could be particularly useful when individuals don’t like, value, or feel accountable for using feedback.

18 ©2017 Center for Creative Leadership. All rights reserved.
• Providing feedback is not about fi xing people. If there is something wrong with you, how open are you to “being fi xed”? That thought probably doesn’t go over very well, does it? People get very defensive if they have to “be fi xed,” and they will shut down and shut you off . Like your role in resolving confl ict, it’s not your role to fi x people when you give them feedback. Relieve that responsibility from yourself. Instead, help the people you lead and serve become aware of what they need to start, stop, or continue to do, to be eff ective through the feedback you give them. If “being fi xed” brings up walls of defense for you, it probably will with others too. Don’t fi x them, provide feedback to help and support them.
• Practice giving feedback. It’s hard giving SBIs at fi rst and adopting it as a way to provide feedback. In the beginning, you may need to take some time alone and think about what to say before delivering it. You also may need to practice saying the SBI to yourself in the mirror, or to a trusted friend or advisor before you deliver it to the person it’s intended for.
• Create a favorable feedback environment. As a leader, you should be working—on a daily basis—to build a favorable environment that makes others want to receive, seek out, and use feedback for performance improvement. In a favorable feedback environment, individuals continuously receive feedback from others, actively seek out feedback from others, and they are expected to learn from and use the feedback they receive. You can build a favorable feedback environment by: improving your credibility (know the individual’s job requirements and performance standards, inspire trust); giving high-quality feedback; delivering feedback with care (tactful and considerate, with empathy); providing the right amount of all four types of feedback; being available to give feedback; and encouraging others to actively seek feedback from you (Steelman, Levy, & Snell, 2004). Without investing in the cultivation of a favorable feedback environment on a regular basis, the most empathic SBI feedback moment may get rejected or forgotten in the daily grind.

©2017 Center for Creative Leadership. All rights reserved. 19
ConclusionContrary to what many consultants think and the popular view of feedback, employees really want to receive more negative feedback from their bosses than they are actually getting. And this should not be surprising; some scholars even argue that negative feedback is the most useful type of feedback to provide (but remember that the ratio of positive to negative feedback is at least 3:1 if not 5:1). When leaders follow best practices, negative feedback should be viewed as valuable information by recipients about how to get better. Positive feedback is also very useful, but it does not provide information about where performance gaps exist, and thus, where one needs to focus his/her time and attention (Kluger & DeNisi, 1996). Some have referred to this as the “great paradox of negative feedback” such that negative feedback is the most useful type of feedback, yet it’s what people like the least (Gregory & Levy, 2015).
Though giving negative feedback is an unpleasant experience for many managers, consider how valuable it can be to subordinates and even your own career. Potential benefi ts include higher retention of your top talent because they will appreciate that you took the time to give them honest, thoughtful feedback about how they can improve (Deal & Levenson, 2016). In a recent CCL study of 306 managers, leaders who provided higher-quality negative feedback (according to their direct reports) on a regular basis were also viewed as more promotable by their bosses. In short, giving high-quality negative feedback will allow you to retain your top performers. And your own career will benefi t too. But don’t forget that leaders should also “walk the talk” with feedback, and encourage others to give them feedback. According to a recent Washington Post article (2016), “The best leaders give feedback and take in feedback, being courageous enough to say, ‘This is what I’m working on. Help me be better.’”

20 ©2017 Center for Creative Leadership. All rights reserved.
About the Research
References
Endnotes
Data used for this white paper is from 235 leaders from our “leading insights” panel polled June, 2016. Most (69.8%) were from the United States, with 11% from the Asia Pacifi c region and 12% from the Europe, Middle East, and Africa region. Participants ranged in age from 6% being between the ages of 25–34, 28% between 35–44, 39% between 45–54, 26% between 55–64, and 2% 65 and older. The participants were almost equally split, men (51%) and women (49%). Most (51%) were from the corporate/for-profi t sector, with others coming from education (12%), government (11%), nonprofi t (15%), or other (11%). They also covered several managerial levels (25% manager of individual contributors, 21% manager of managers or responsible for leading senior professional staff , 31% senior-level manager who leads a function or division, 17% executive level responsible for leading the organization or enterprise, 6% other).
Deal, J. J., & Levenson, A. (2016). What millennials want from work: How to maximize engagement in today’s workforce. McGraw Hill Professional.
Epley, N., & Whitchurch, E. (2008). Mirror, mirror on the wall: Enhancement in self-recognition. Personality and Social Psychology Bulletin.
Gawande, A. (2002). The learning curve. New Yorker, 77, 52–61.
Gottman, J. M. (1994). What predicts divorce? Hillsdale NJ: Lawrence Erlbaum Associates.
Gregory, J. B., & Levy, P. E. (2015). Using feedback in organizational consulting. American Psychological Association.
Guerin, B. (1994). What do people think about the risks of driving? Implications for traffi c safety interventions. Journal of Applied Social Psychology, 24(11), 994–1021.
Kluger, A. N., & DeNisi, A. (1996). The eff ects of feedback interventions on performance: A historical review, a meta-analysis, and a preliminary feedback intervention theory. Psychological Bulletin, 119(2): 54–284.
London, M. (2003). Job feedback: Giving, seeking, and using feedback for performance improvement. Psychology Press.
Medvedeff , M., Gregory, J., & Levy, P. (2008). How attributes of the feedback message aff ect subsequent feedback seeking: The interactive eff ects of feedback sign and type. Psychologica Belgica, 48(2–3).
Menon, T., & Thompson, L. (2016). Stop spending, start managing: Strategies to transform wasteful habits. Harvard Business Review Press.
Moss, S. E., & Sanchez, J. I. (2004). Are your employees avoiding you? Managerial strategies for closing the feedback gap. The Academy of Management Executive, 18(1), 32–44.
SHRM/Globoforce survey (2013). https://www.shrm.org/hr-today/trends-and-forecasting/research-and-surveys/Documents/Globoforce_SHRM_Survey_Spring_2013_FINAL.pdf
Steelman, L. A., Levy, P. E., & Snell, A. F. (2004). The feedback environment scale: Construct defi nition, measurement, and validation. Educational and psychological measurement, 64(1), 165–184.
Taylor, S. E., & Brown, J. D. (1988). Illusion and well-being: a social psychological perspective on mental health. Psychological Bulletin, 103(2), 193–210.
The Washington Post WP Brand Studio (November 30, 2016). Rewards multiply with workplace empathy. http://www.washingtonpost.com/sf/brand-connect/businessolver/rewards-multiply-with-workplace-empathy/.
Young, S., Moukarzel, R., Steelman, L., Richard, E., & Gallo, J., (April, 2013). Increasing positive emotions following negative feedback: How empathy can help. Poster presented at the 28th Society for Industrial and Organizational Psychology Conference, Houston, Texas.
1 Preference for positive process feedback (M = 31.87, SD = 20.96) was similar than actual positive process feedback (M = 32.67, SD = 24.45), t(234) = .42, p = .68.2 Preference for negative process feedback (M = 17.97, SD = 13.07) was signifi cantly greater than actual negative process feedback (M = 12.14, SD = 15.90), t(234) = -4.65, p < .001.3 Preference for negative outcome feedback (M = 17.97, SD = 13.07) was signifi cantly greater than actual negative process feedback (M = 12.14, SD = 15.91), t(234) = -3.94, p < .001.4 Preference for positive outcome feedback (M = 33.44, SD = 21.38) was signifi cantly less than actual positive outcome feedback (M = 43.85, SD = 28.03), t(234) = 5.12, p < .001. [1] Preference for positive process feedback (M = 31.87, SD = 20.96) was similar than actual positive process feedback (M = 32.67, SD = 24.45), t(234) = .42, p = .68. 5 Men receive more negative outcome feedback (M = 13.43, SD = 15.28) than women (M = 9.19, SD = 14.05), t(233) = 2.21, p < .05.6 Preferences of women to get positive process feedback (M = 35.31, SD = 21.84) was statistically greater than men (M = 28.51, SD = 19.58), t(233) = -2.51, p < .05.7 Preferences of women to get negative outcome feedback (M = 13.61, SD = 14.52) was statistically less than men (M = 19.76, SD = 16.91), t(233) = 2.99, p < .01.8 F (3, 217) = 3.20, p < .05. Note, 14 people did not list a level in which they worked.9 F (4, 230) = 2.58, p < .05.10 t(94) = -2.44, p < .05.

©2017 Center for Creative Leadership. All rights reserved. 21
About the AuthorsWilliam A. (Bill) Gentry, PhD, is director of leadership insights and analytics and a senior research scientist at the Center for Creative Leadership (CCL®) in Greensboro, NC. He also trains CCL’s Assessment Certifi cation Workshop and Maximizing Your Leadership Potential programs and has been an adjunct professor at several colleges and universities. In applying his research into practice, Bill’s current focus is on helping leaders who are managing for the fi rst time in their lives. Bill has more than 70 academic presentations, has been featured in more than 50 Internet and newspaper outlets, and has published more than 40 peer-reviewed articles on leadership and organizational psychology. Bill also is the author of the highly acclaimed book, Be the Boss Everyone Wants to Work For: A Guide for New Leaders. Bill holds a BA degree in psychology and political science from Emory University and an MS and PhD in industrial/organizational psychology from the University of Georgia.You can follow Bill on twitter: @Lead_Better
Stephen F. Young, PhD, is a research scientist, leadership insights and analytics at CCL in Greensboro, NC. Steve uses data science to help leaders and organizations increase their eff ectiveness. Prior to joining CCL, Steve was a researcher with Design Interactive in Orlando, FL where he was principal investigator and technical lead of several US Department of Defense and US Department of Homeland Security research and development contracts. In his current role with CCL, he provides services that help accelerate the return on investment in leadership development solutions including trend research, client analytics, and employee engagement solutions via a four-factor approach (E4). Steve has a BA in psychology and political science from the University of Connecticut. He also received an MS and PhD in industrial/organizational psychology from Florida Institute of Technology.You can follow Steve on Twitter: @DataForLeaders
To learn more about this topic or the Center for Creative Leadership’s programs and products, please contact our Client Services team.
+1 800 780 1031 +1 336 545 2810 [email protected]

April 2017
CCL - Americaswww.ccl.org
+1 800 780 1031 (US or Canada)+1 336 545 2810 (Worldwide)
Greensboro, North Carolina+1 336 545 2810
Colorado Springs, Colorado+1 719 633 3891
San Diego, California+1 858 638 8000
CCL - Europe, Middle East, Africawww.ccl.org/emea
Brussels, Belgium+32 (0) 2 679 09 10
Addis Ababa, Ethiopia+251 118 957086
Johannesburg, South Africa+27 (11) 783 4963
southafrica.offi [email protected]
Moscow, Russia+7 495 662 31 39
CCL - Asia Pacifi cwww.ccl.org/apac
Singapore+65 6854 [email protected]
Gurgaon, India+91 124 676 [email protected]
Shanghai, China+86 21 6881 [email protected]
Affi liate Locations: Seattle, Washington • Seoul, Korea • College Park, Maryland • Ottawa, Ontario, Canada Ft. Belvoir, Virginia • Kettering, Ohio • Huntsville, Alabama • San Diego, California • St. Petersburg, Florida
Peoria, Illinois • Omaha, Nebraska • Minato-ku, Tokyo, Japan • Melbourne, Victoria, Australia
Center for Creative Leadership® and CCL® are registered trademarks owned by the Center for Creative Leadership.©2017 Center for Creative Leadership. All rights reserved.
The Center for Creative Leadership (CCL®) is a top-ranked, global provider of leadership development. By leveraging the power of leadership to drive results that matter most to clients, CCL transforms individual leaders, teams, organizations and society. Our array of cutting-edge solutions is steeped in extensive research and experience gained from working with hundreds of thousands of leaders at all levels. Ranked among the world’s Top 5 providers of executive education by the Financial Times and in the Top 10 by Bloomberg Businessweek, CCL has offi ces in Greensboro, NC; Colorado Springs, CO; San Diego, CA; Brussels, Belgium; Moscow, Russia; Addis Ababa, Ethiopia; Johannesburg, South Africa; Singapore; Gurgaon, India; and Shanghai, China.