Embed Size (px)
Citation preview
Business Travel Insight
2016
Business Travel Insight
2016
2016 Business Travel Forecast and Insight
©2015, Travel Leaders Franchise Group, LLC Page | 2
Introduction
Welcome to the Travel Leaders 2016 Business Travel Insight. As 2015 draws to
a close, it is important to assess trends that will impact 2016 and how travel
industry changes may affect clients in the coming year. The Travel Leaders
Business Travel Team constructs this yearly Insight document to assist our
clients to understand some of the travel developments that may take place in
the near future. To do so, our team analyzes an extensive variety of well-
known global travel resources and incorporates Travel Leaders specific data
patterns to create a customized forecast for our clientele. By reviewing the
2016 Business Travel Insight and working with the guidance of an experienced
travel account manager to develop a sound strategy—we hope each client will
gain a better understanding of the future of their business travel program and
will be proactive in optimizing their travel program.
Travel Leaders Business Travel Team
December 14, 2015
Timeline of Upcoming
Business Travel Insight
Updates:
April 2016
Quarter 1
Insight Updates
July 2016
Quarter 2
Insight Updates
October 2016
Quarter 3
Insight Updates
November 2016
Full 2017 Business
Travel Insight
Timeline of Upcoming
Business Travel Insight
Updates:
April 2016
Quarter 1
Insight Updates
July 2016
Quarter 2
Insight Updates
October 2016
Quarter 3
Insight Updates
November 2016
Full 2017 Business
Travel Insight
2016 Business Travel Forecast and Insight
©2015, Travel Leaders Franchise Group, LLC Page | 3
Contents
Overview ................................................................................................................................................................................ 5
2016 and Beyond: Outlooks and Trends to Watch ....................................................................................................... 5
Travel Buyers ............................................................................................................................................................................................... 5
TMC Partnership ......................................................................................................................................................................................... 7
Digital Technology Trends - 2016 and Beyond ............................................................................................................. 7
Meaningful Experiences ........................................................................................................................................................................... 8
Mobile Travel Management .................................................................................................................................................................... 8
DIY Travel ..................................................................................................................................................................................................... 8
Self-Serve ..................................................................................................................................................................................................... 8
Impact to Business Travel ........................................................................................................................................................................ 8
Airlines ................................................................................................................................................................................... 9
Outlook 2016 .............................................................................................................................................................................................. 9
The Price of Oil ........................................................................................................................................................................................... 9
Impact of Carrier Consolidation and Low Cost Carriers ................................................................................................................. 9
U.S. DOJ Investigation............................................................................................................................................................................. 10
Impact to Business Travel ...................................................................................................................................................................... 10
Travel Leaders Data: Airline ................................................................................................................................................................. 10
IT Investments Geared to Enhance Traveler Experience ............................................................................................ 11
Tailor My Trip ............................................................................................................................................................................................ 11
Mobile Adoption ...................................................................................................................................................................................... 11
It’s an App World ..................................................................................................................................................................................... 11
At the Airport ............................................................................................................................................................................................ 12
Ease My Anxiety........................................................................................................................................................................................ 12
Bag Check-In ............................................................................................................................................................................................. 12
Keep Me Posted ....................................................................................................................................................................................... 13
Impact to Business Travelers ................................................................................................................................................................. 13
Hotel ..................................................................................................................................................................................... 13
Outlook 2016 ............................................................................................................................................................................................ 13
Impact to Business Travel ...................................................................................................................................................................... 14
Travel Leaders Data: Hotel ................................................................................................................................................................... 15
Ground Transportation ..................................................................................................................................................... 15
2016 Business Travel Forecast and Insight
©2015, Travel Leaders Franchise Group, LLC Page | 4
Outlook 2016 ............................................................................................................................................................................................ 15
Travel Leaders Data: Rental Cars ......................................................................................................................................................... 16
2016 Global Outlook ......................................................................................................................................................... 17
Uncertainty Remains ............................................................................................................................................................................... 17
Major Global Markets ....................................................................................................................................................... 17
U.S. - A Shift in World Rankings ........................................................................................................................................................... 17
Europe ......................................................................................................................................................................................................... 18
China ............................................................................................................................................................................................................ 18
Russia, Middle-East and Africa ............................................................................................................................................................. 18
Impact to Business Travel ...................................................................................................................................................................... 19
Other Trends ...................................................................................................................................................................... 19
Meetings ..................................................................................................................................................................................................... 19
Regional Meeting Outlook .................................................................................................................................................................... 19
Appendix ............................................................................................................................................................................. 21
Domestic Air Trip Days Trending ......................................................................................................................................................... 21
International Air Trip Days Trending................................................................................................................................................... 22
Domestic Average Ticket Price (ATP) Based on Advanced Purchase ....................................................................................... 23
Domestic Total Trip Cost ....................................................................................................................................................................... 24
International Total Trip Cost ................................................................................................................................................................. 25
2016 Business Travel Forecast and Insight
©2015, Travel Leaders Franchise Group, LLC Page | 5
Overview
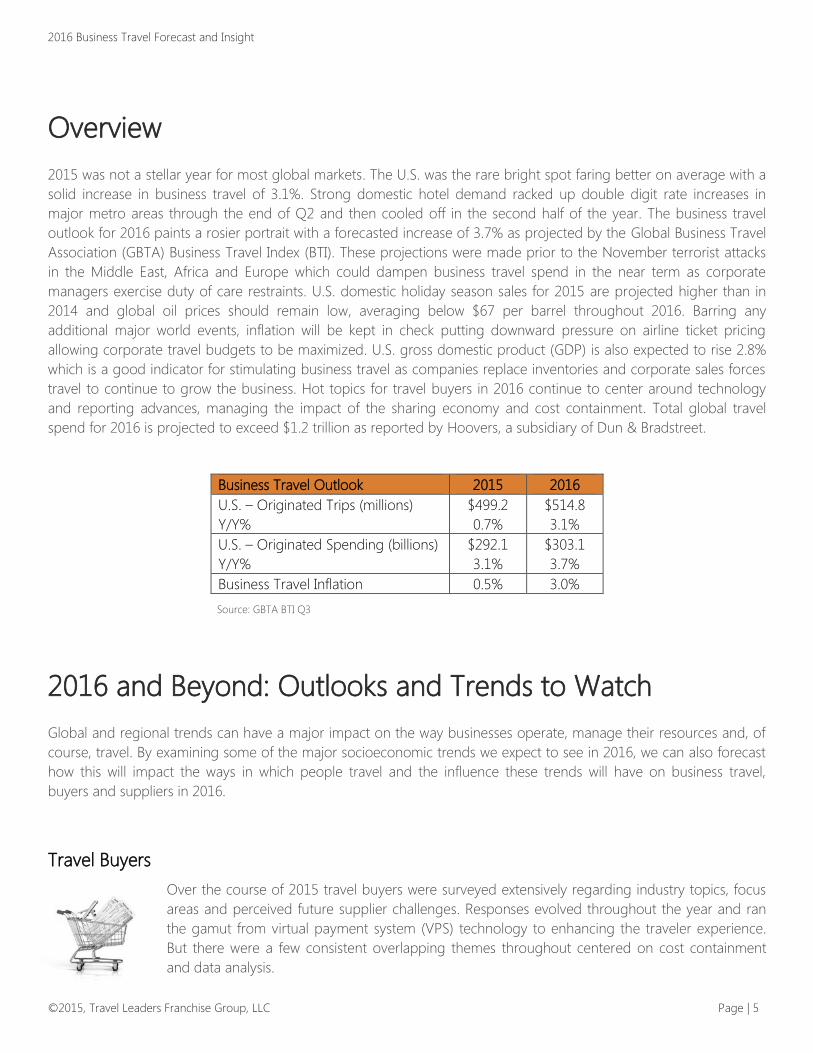
2015 was not a stellar year for most global markets. The U.S. was the rare bright spot faring better on average with a
solid increase in business travel of 3.1%. Strong domestic hotel demand racked up double digit rate increases in
major metro areas through the end of Q2 and then cooled off in the second half of the year. The business travel
outlook for 2016 paints a rosier portrait with a forecasted increase of 3.7% as projected by the Global Business Travel
Association (GBTA) Business Travel Index (BTI). These projections were made prior to the November terrorist attacks
in the Middle East, Africa and Europe which could dampen business travel spend in the near term as corporate
managers exercise duty of care restraints. U.S. domestic holiday season sales for 2015 are projected higher than in
2014 and global oil prices should remain low, averaging below $67 per barrel throughout 2016. Barring any
additional major world events, inflation will be kept in check putting downward pressure on airline ticket pricing
allowing corporate travel budgets to be maximized. U.S. gross domestic product (GDP) is also expected to rise 2.8%
which is a good indicator for stimulating business travel as companies replace inventories and corporate sales forces
travel to continue to grow the business. Hot topics for travel buyers in 2016 continue to center around technology
and reporting advances, managing the impact of the sharing economy and cost containment. Total global travel
spend for 2016 is projected to exceed $1.2 trillion as reported by Hoovers, a subsidiary of Dun & Bradstreet.
Business Travel Outlook 2015 2016
U.S. – Originated Trips (millions)
Y/Y%
$499.2
0.7%
$514.8
3.1%
U.S. – Originated Spending (billions)
Y/Y%
$292.1
3.1%
$303.1
3.7%
Business Travel Inflation 0.5% 3.0%
Source: GBTA BTI Q3
2016 and Beyond: Outlooks and Trends to Watch
Global and regional trends can have a major impact on the way businesses operate, manage their resources and, of
course, travel. By examining some of the major socioeconomic trends we expect to see in 2016, we can also forecast
how this will impact the ways in which people travel and the influence these trends will have on business travel,
buyers and suppliers in 2016.
Travel Buyers
Over the course of 2015 travel buyers were surveyed extensively regarding industry topics, focus
areas and perceived future supplier challenges. Responses evolved throughout the year and ran
the gamut from virtual payment system (VPS) technology to enhancing the traveler experience.
But there were a few consistent overlapping themes throughout centered on cost containment
and data analysis.
2016 Business Travel Forecast and Insight
©2015, Travel Leaders Franchise Group, LLC Page | 6
By mid-year it was revealed through a national survey specifically geared toward travel buyers with expense
responsibilities that a majority were keenly aware of or interested in learning more about VPS technology and 20%
had already launched a program, up 7% over the previous year. Travel Leaders Group expects this trend will continue
due to a multitude of benefits and process control improvements derived from these products and the increasing
access to VPS technology solutions with Sabre/Conferma leading the way. Travelport/Conferma follows closely
behind with a new product-wide release scheduled for early 2016. Riding this wave of interest, other technology and
corporate card companies such as Cornerstone and eNett have also partnered providing a mid-office solution while
Grasp Technologies and Wex Bank recently launched GraspPAY. In all of these instances, each product offering will
allow travel management companies (TMCs) to utilize single use virtual credit card accounts for pre-pay hotels for
transient business travelers. Travel Leaders Group sources have also confirmed that two major car rental companies,
National and Avis, are in the test phase to begin accepting payments in early 2016. The advantage to travel buyers is
that VPSs reduce risk to the company and provide a level of convenience and service to travelers not available
through the standard corporate card systems.
Source: Travel Leaders Business Travel Center of Excellence
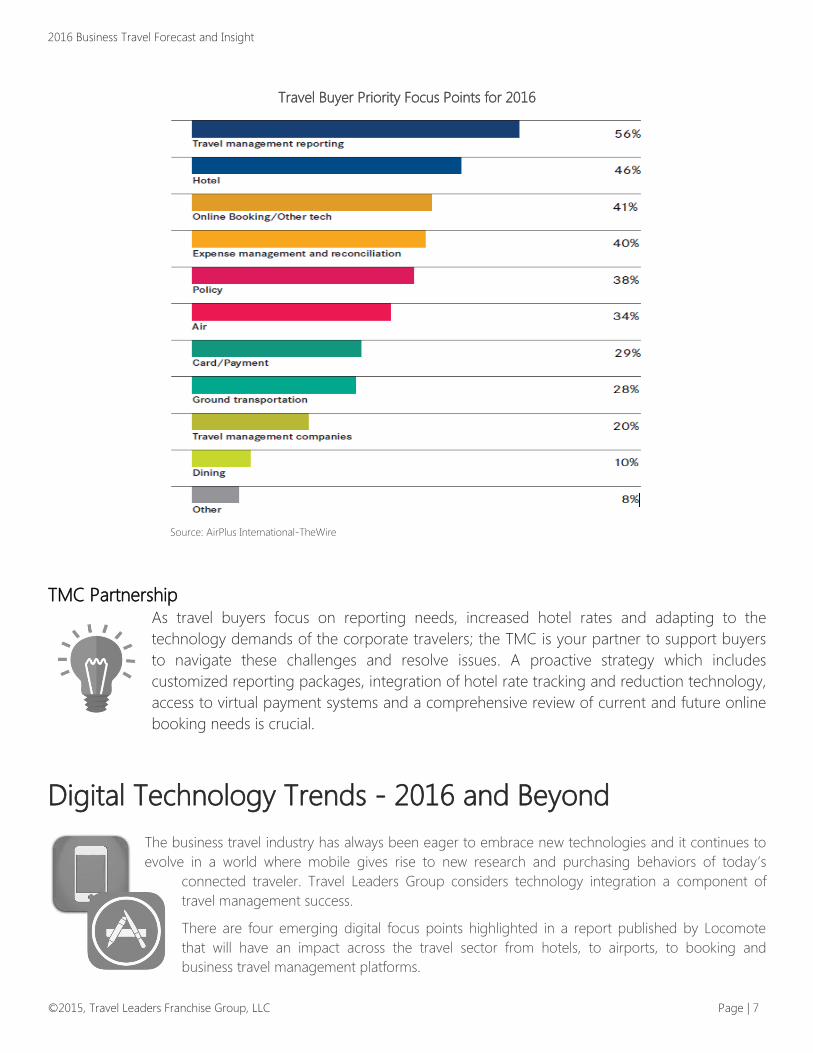
As 2015 progressed, surveys conducted by GBTA and AirPlus International revealed additional insights. Topping the
list of buyer priorities included balancing TMC supplier costs with services, TMC reporting and performance
measurement capabilities, cost containment and improving the traveler experience primarily through more efficient
use of existing booking and emerging mobile technologies such as smartphone apps.
Rounding out the list, nearly 25% of buyers also identified additional concerns and challenges citing a lack of
resources, bandwidth and processes to effectively support fast paced industry changes (see chart below for a more
comprehensive list).
Longer term, Travel Leaders Group believes that travel reporting, data analysis, cost containment and improving
traveler experience will remain hot topics and key areas of focus considered most important to travel buyers over the
next two to five years.
2016 Business Travel Forecast and Insight
©2015, Travel Leaders Franchise Group, LLC Page | 7
Travel Buyer Priority Focus Points for 2016
Source: AirPlus International-TheWire
TMC Partnership As travel buyers focus on reporting needs, increased hotel rates and adapting to the
technology demands of the corporate travelers; the TMC is your partner to support buyers
to navigate these challenges and resolve issues. A proactive strategy which includes
customized reporting packages, integration of hotel rate tracking and reduction technology,
access to virtual payment systems and a comprehensive review of current and future online
booking needs is crucial.
Digital Technology Trends - 2016 and Beyond
The business travel industry has always been eager to embrace new technologies and it continues to
evolve in a world where mobile gives rise to new research and purchasing behaviors of today’s
connected traveler. Travel Leaders Group considers technology integration a component of
travel management success.
There are four emerging digital focus points highlighted in a report published by Locomote
that will have an impact across the travel sector from hotels, to airports, to booking and
business travel management platforms.
2016 Business Travel Forecast and Insight
©2015, Travel Leaders Franchise Group, LLC Page | 8
Meaningful Experiences
Authenticity has become a key focus driver as the industry mindset has shifted from “tourist” to “traveler” and
“corporate travel agent” to “trusted adviser or consultant.” Digital has changed the way we connect with people
around the globe and TMCs connect with travelers. Technologies like Concur, GateGuru, and SafetoGo streamline the
business travel process, by helping travelers secure the lowest rates, navigate airports and stay informed and safe
while on the road. Integration of these technologies not only satisfies the business travelers desire to be connected
24/7, but also enables the traveler to be more efficient, productive and secure.
Mobile Travel Management
Online bookings exceeded 140 million last year and nearly 70% of same day hotel reservations were made via a
smartphone app, according to eMarketer. As confidence rises in mobile device technology and access to real time
data continues to increase, this area will continue to be a disrupter in corporate travel management.
DIY Travel
As the world becomes more automated marginalizing the human service element, the DIY business traveler trend
could increase exponentially. Business travelers will plan, manage, and book their travel via online booking tools or
apps which means rarely speaking with another human being. This shift will create new challenges for an industry
historically focused on the human aspect of service as companies like Airbnb will continue to make the absence of
human interaction a selling point.
Self-Serve
Self-serve is here to stay and will continue growing rapidly as the digital world has created a new business travel
culture of instant access and gratification. This new breed of travelers is keenly attuned and will fully embrace new
technologies which are perceived as more efficient and time saving while on the road.
Impact to Business Travel
Technology advances will provide efficiency and time savings during the booking process and the trip. Travel
managers will need to be keenly aware of how these trends may impact the corporate travel program from
compliance to Duty of Care. Through training and education, the travel manager can ensure future technology will
continue to enhance the traveler’s experience while still promoting the established travel program.
2016 Business Travel Forecast and Insight
©2015, Travel Leaders Franchise Group, LLC Page | 9
Airlines
Outlook 2016
A healthy commercial airline industry is essential to a stable and growing global economy. The
great recession took its toll on many carriers especially in the U.S., but eventually through an
unprecedented number of reorganizations and massive U.S. Federal Government sanctioned
consolidations, the industry has rebounded now posting record quarterly profits. Below is an
overview of current and future trends and its impact on business travel.
The Price of Oil
There are a host of factors which contributed to the recent explosion of windfall profits in the airline industry.
Improved capacity control measures and menu pricing for ancillary fees have contributed substantially to an increase
in revenues, but the most obvious and dramatic is the sustained drop in global oil pricing reducing the cost of jet fuel.
Favorable fluctuations in oil prices have a huge impact on the carriers’ bottom line. For example, American Airlines
alone reported a $5B savings year over year, just in reduced fuel costs and this savings will continue to grow as long
as prices remain low. Pricing projections posted through November vary, but the consensus appears to be towards
oil rising to over $60/barrel in 2016, which could produce upward pricing pressure and curtailing any thoughts of
price reductions. More recently these projections seem to have been thwarted as major OPEC nations announced on
December 4, 2015, that current production levels would remain in effect for the foreseeable future causing pricing to
temporarily fall below $40/barrel. Industry experts feel current production is well in excess of one million barrels per
day above real global demand. If supply remains artificially high and pricing remains at these extraordinarily low
levels, carriers will have additional incentives to continue to pass on savings to travelers through lower fares. The most
recent Travel Leaders Group domestic average ticket price data shows airfares decreasing 4.6% in 3Q15 as compared
to the same period in 2014.
Impact of Carrier Consolidation and Low Cost Carriers
Other factors can and certainly do impact pricing. The long term effects of consolidation and the emergence of the
new big three legacy carriers, American, Delta and United, is still to be determined as low oil prices have dampened
recent effects of consolidation. It could be years before the real impact is felt, but here are a couple of trends. The big
three are downsizing in markets where they do not dominate and reducing the number of commuter flights switching
to larger jets. The net effect in the smaller markets is more comfortable equipment, but reduced service. In addition,
United and Delta recently swapped landing slots between Newark and JFK strengthening United’s hold on Newark
and further enhancing Delta’s at JFK. If these trends continue throughout the U.S., competition will be reduced
especially impacting smaller markets where a single carrier could dominate a majority of all flights limiting options to
business travelers including connecting flights.
Conversely, domestic low cost carriers (LCCs) such as Southwest are ramping up expansion plans to keep pace with
the increased capacity of the big three. In the trans-Atlantic market new entrants such as WOW flying from Baltimore
to eight European markets are increasing new competition while offering deeply discounted fares resulting in most
major carries adjusting their pricing strategies.
2016 Business Travel Forecast and Insight
©2015, Travel Leaders Franchise Group, LLC Page | 10
U.S. DOJ Investigation
Capacity management is always a significant competitive pricing factor. Recently capacity management hit the radar
of the U.S. Department of Justice, prompting an ongoing investigation into accusations that airline executives shared
capacity strategies through press releases. The primary concern is the potential of this practice allowing competitors
to react accordingly keeping pricing artificially high contrary to U.S. anti-trust laws.
Impact to Business Travel
With oil pricing at historic lows and increased capacity from both domestic and international low cost carriers entering
U.S. markets, the probability of fare increases are highly unlikely. Based on Travel Leaders Group air data, the
domestic forecast is a marginal decline in airfares of 1-2%. On the international side, historical data supports quarterly
year over year declines, leading to an expected decline of 1-2% for 2016.
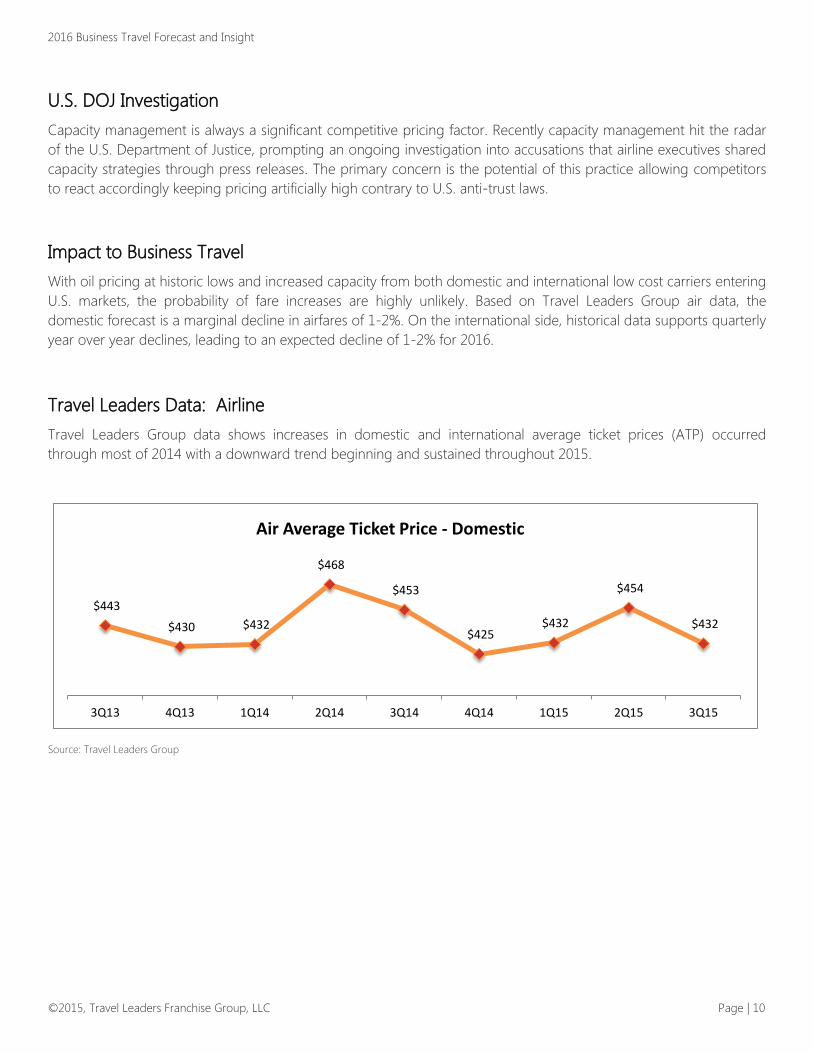
Travel Leaders Data: Airline
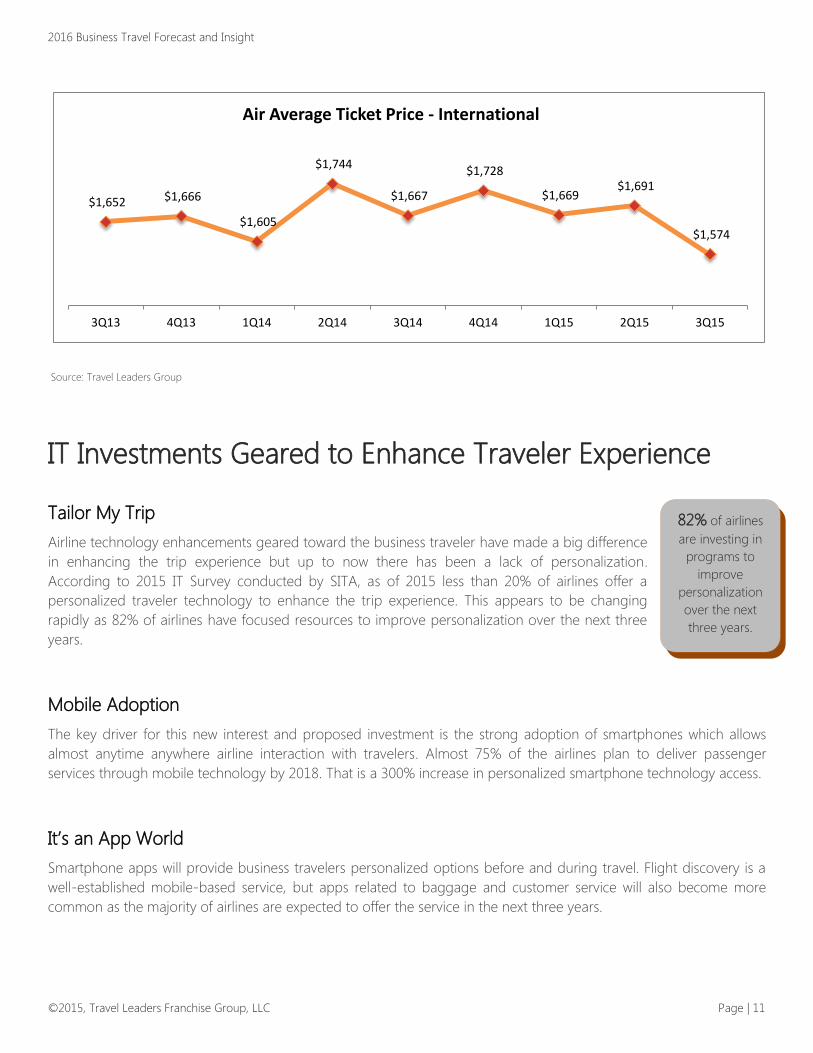
Travel Leaders Group data shows increases in domestic and international average ticket prices (ATP) occurred
through most of 2014 with a downward trend beginning and sustained throughout 2015.
$443
$430 $432
$468
$453
$425 $432
$454
$432
3Q13 4Q13 1Q14 2Q14 3Q14 4Q14 1Q15 2Q15 3Q15
Air Average Ticket Price - Domestic
Source: Travel Leaders Group
2016 Business Travel Forecast and Insight
©2015, Travel Leaders Franchise Group, LLC Page | 11
$1,652 $1,666
$1,605
$1,744
$1,667
$1,728
$1,669 $1,691
$1,574
3Q13 4Q13 1Q14 2Q14 3Q14 4Q14 1Q15 2Q15 3Q15
Air Average Ticket Price - International
Source: Travel Leaders Group
IT Investments Geared to Enhance Traveler Experience
Tailor My Trip
Airline technology enhancements geared toward the business traveler have made a big difference
in enhancing the trip experience but up to now there has been a lack of personalization.
According to 2015 IT Survey conducted by SITA, as of 2015 less than 20% of airlines offer a
personalized traveler technology to enhance the trip experience. This appears to be changing
rapidly as 82% of airlines have focused resources to improve personalization over the next three
years.
Mobile Adoption
The key driver for this new interest and proposed investment is the strong adoption of smartphones which allows
almost anytime anywhere airline interaction with travelers. Almost 75% of the airlines plan to deliver passenger
services through mobile technology by 2018. That is a 300% increase in personalized smartphone technology access.
It’s an App World
Smartphone apps will provide business travelers personalized options before and during travel. Flight discovery is a
well-established mobile-based service, but apps related to baggage and customer service will also become more
common as the majority of airlines are expected to offer the service in the next three years.
82% of airlines
are investing in
programs to
improve
personalization
over the next
three years.
2016 Business Travel Forecast and Insight
©2015, Travel Leaders Franchise Group, LLC Page | 12
At the Airport
The airlines will be delivering these new services via kiosks and/or beacons. New potential services being discussed
range from flight content to books to films and eventually concierge services which could be downloaded or
accessed via mobile technology including smartphones or Wi-Fi/Bluetooth enabled tablets.
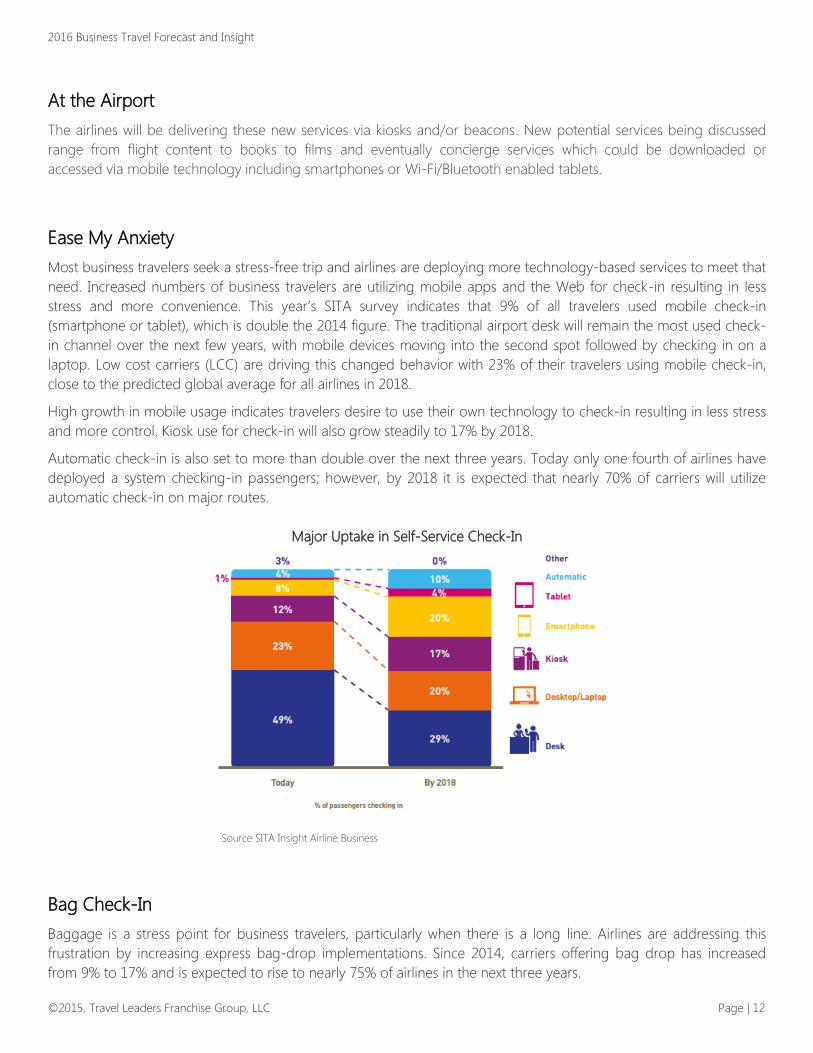
Ease My Anxiety
Most business travelers seek a stress-free trip and airlines are deploying more technology-based services to meet that
need. Increased numbers of business travelers are utilizing mobile apps and the Web for check-in resulting in less
stress and more convenience. This year’s SITA survey indicates that 9% of all travelers used mobile check-in
(smartphone or tablet), which is double the 2014 figure. The traditional airport desk will remain the most used check-
in channel over the next few years, with mobile devices moving into the second spot followed by checking in on a
laptop. Low cost carriers (LCC) are driving this changed behavior with 23% of their travelers using mobile check-in,
close to the predicted global average for all airlines in 2018.
High growth in mobile usage indicates travelers desire to use their own technology to check-in resulting in less stress
and more control. Kiosk use for check-in will also grow steadily to 17% by 2018.
Automatic check-in is also set to more than double over the next three years. Today only one fourth of airlines have
deployed a system checking-in passengers; however, by 2018 it is expected that nearly 70% of carriers will utilize
automatic check-in on major routes.
Major Uptake in Self-Service Check-In
Source SITA Insight Airline Business
Bag Check-In
Baggage is a stress point for business travelers, particularly when there is a long line. Airlines are addressing this
frustration by increasing express bag-drop implementations. Since 2014, carriers offering bag drop has increased
from 9% to 17% and is expected to rise to nearly 75% of airlines in the next three years.
2016 Business Travel Forecast and Insight
©2015, Travel Leaders Franchise Group, LLC Page | 13
Keep Me Posted
Keeping business travelers informed is one way to cut stress levels. While flight status
notifications are already established, by the end of the decade nearly all airlines will offer this
service. Rapidly evolving as the next wave of information services is a much more interactive
approach for the majority of airlines and their passengers.
The focus of these new services will be to use location-based information to solve baggage
issues. Airlines plan to keep travelers updated with the location of their baggage in real time
in the not so distant future. Information services will be developed using passenger location to ensure on time
boarding with notifications based on their location. One tenth of airlines already provide these notifications today and
this percentage will rise dramatically as airport based technology is updated. Kiosks are also evolving from their
traditional check-in role to offer a growing range of information and reporting services to assist business travelers in
areas such as lost baggage, flight transfer and flight disruption information.
Impact to Business Travelers
The proliferation of apps and emphasis on technology enhancements will provide many opportunities and challenges
for corporate travel programs. Early education and integration of available technology will be essential to ensure
program compliance, policy development and support of the travel program objectives.
Hotel
Outlook 2016
Average daily rates rose dramatically, nearly 5% on average, with inflation in double digits in most
major U.S. metro areas. Hotels pressed for even higher increases; however, weaker than
anticipated demand in the second half of 2015 combined with new supply and the sharing
economy (e.g. Airbnb) helped curtail price increases. Travel Leaders Group managed clients fared
much better as 2014-15 YOY data showed increases of only 2.3%, well below the national
average.
Given the projected growth for U.S. originated trips for 2016 at 3.7%, continued upward pricing pressures on major
markets where demand will again outstrip supply is expected into next year. Travel Leaders Group is projecting a
4.8% increase in hotel rates nationally assuming U.S. business does not slow and performs at or above the projected
2.8% growth for 2016. Continued fears of possible economic problems outside the U.S. in Russia, the Eurozone and
China could curtail some rate hike activity but supply versus demand will be the overriding factor.
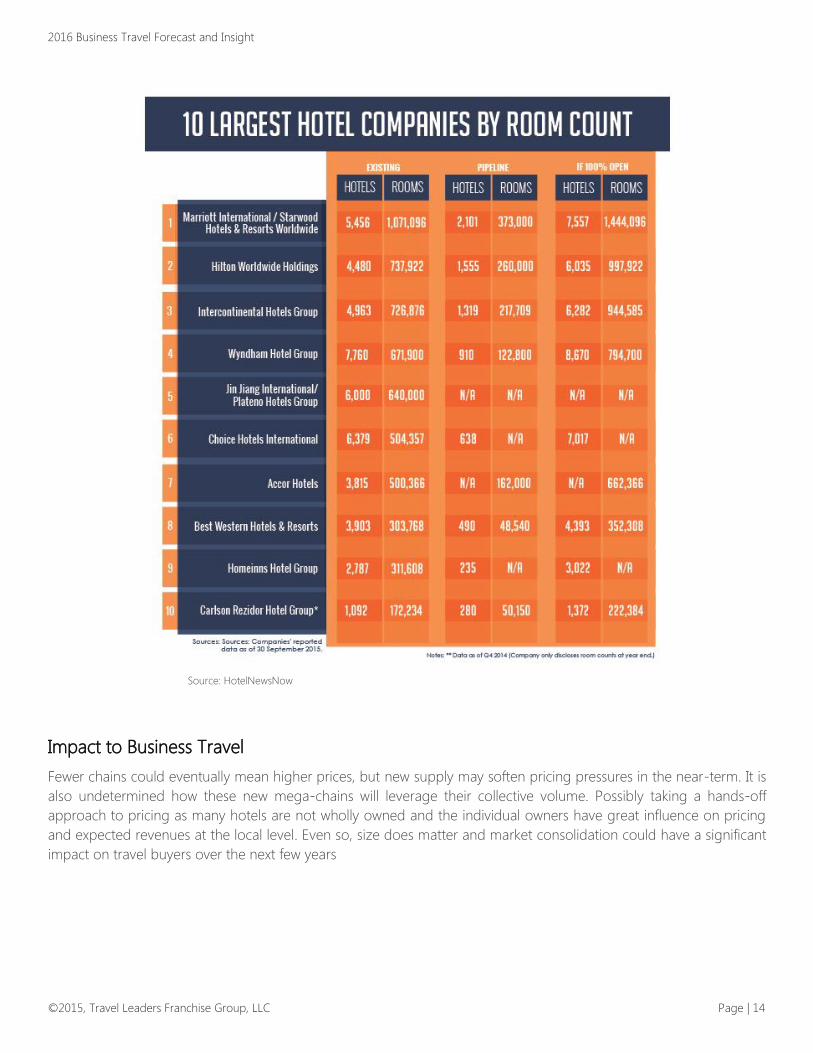
Under pressures to show stockholders strong growth, a recent flood of large chain acquisitions and mergers which
occurred throughout 2015 will have a huge impact on the future global hotel industry and especially in the U.S. IHG
announced the acquisition of Kimpton while Accor is absorbing Raffles, Fairmont and Swissotel brands. The recent
Marriott announcement to purchase Starwood will catapult them to the top hotel chain position with an estimated
inventory of over one million rooms or 7% of total rooms globally. Hilton, the next largest brand will have inventory
of approximately 737,000 rooms. In addition to showing strong growth, service differentiation which caters to
younger guests is also cited as driving consolidation.
96% of airlines
will provide flight
status updates by
2018.
2016 Business Travel Forecast and Insight
©2015, Travel Leaders Franchise Group, LLC Page | 14
Source: HotelNewsNow
Impact to Business Travel
Fewer chains could eventually mean higher prices, but new supply may soften pricing pressures in the near-term. It is
also undetermined how these new mega-chains will leverage their collective volume. Possibly taking a hands-off
approach to pricing as many hotels are not wholly owned and the individual owners have great influence on pricing
and expected revenues at the local level. Even so, size does matter and market consolidation could have a significant
impact on travel buyers over the next few years
2016 Business Travel Forecast and Insight
©2015, Travel Leaders Franchise Group, LLC Page | 15
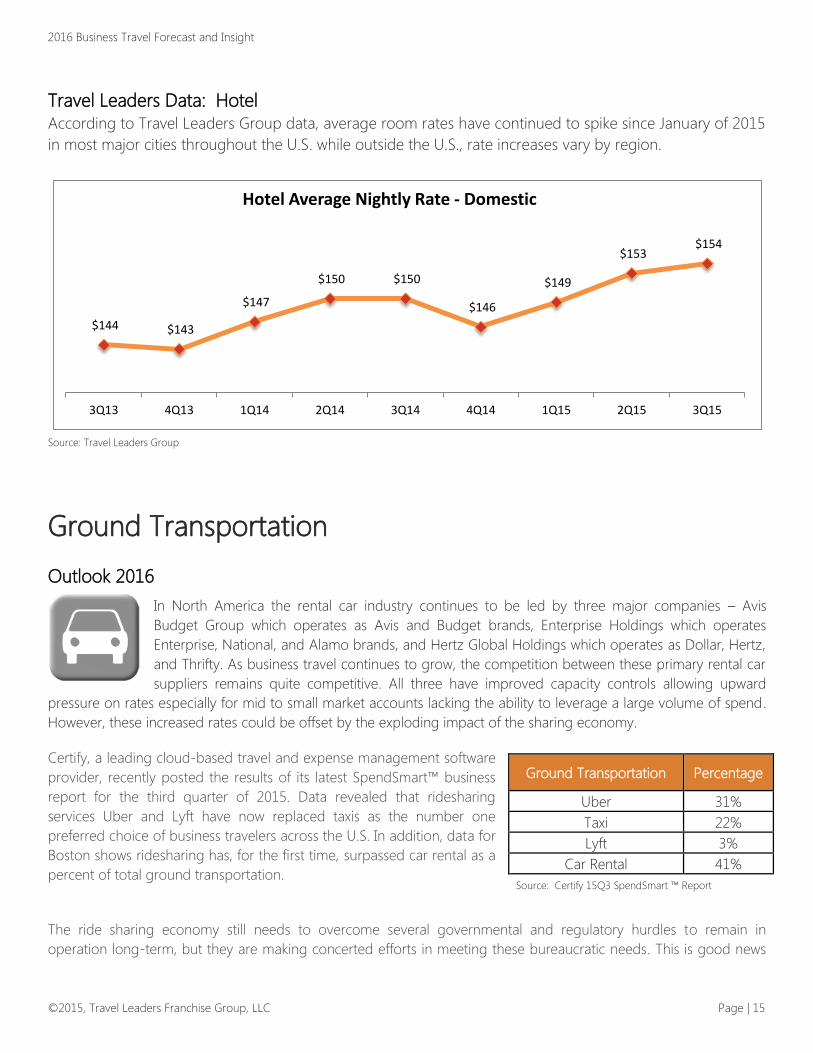
Travel Leaders Data: Hotel
According to Travel Leaders Group data, average room rates have continued to spike since January of 2015
in most major cities throughout the U.S. while outside the U.S., rate increases vary by region.
$144 $143
$147
$150 $150
$146
$149
$153 $154
3Q13 4Q13 1Q14 2Q14 3Q14 4Q14 1Q15 2Q15 3Q15
Hotel Average Nightly Rate - Domestic
Source: Travel Leaders Group
Ground Transportation
Outlook 2016
In North America the rental car industry continues to be led by three major companies – Avis
Budget Group which operates as Avis and Budget brands, Enterprise Holdings which operates
Enterprise, National, and Alamo brands, and Hertz Global Holdings which operates as Dollar, Hertz,
and Thrifty. As business travel continues to grow, the competition between these primary rental car
suppliers remains quite competitive. All three have improved capacity controls allowing upward
pressure on rates especially for mid to small market accounts lacking the ability to leverage a large volume of spend.
However, these increased rates could be offset by the exploding impact of the sharing economy.
Certify, a leading cloud-based travel and expense management software
provider, recently posted the results of its latest SpendSmart™ business
report for the third quarter of 2015. Data revealed that ridesharing
services Uber and Lyft have now replaced taxis as the number one
preferred choice of business travelers across the U.S. In addition, data for
Boston shows ridesharing has, for the first time, surpassed car rental as a
percent of total ground transportation.
The ride sharing economy still needs to overcome several governmental and regulatory hurdles to remain in
operation long-term, but they are making concerted efforts in meeting these bureaucratic needs. This is good news
Ground Transportation Percentage
Uber 31%
Taxi 22%
Lyft 3%
Car Rental 41%
Source: Certify 15Q3 SpendSmart ™ Report
2016 Business Travel Forecast and Insight
©2015, Travel Leaders Franchise Group, LLC Page | 16
for travel buyers that can capitalize on the added competition to rental car companies by extending current contracts
with low rates locked in or moving to longer term contracts.
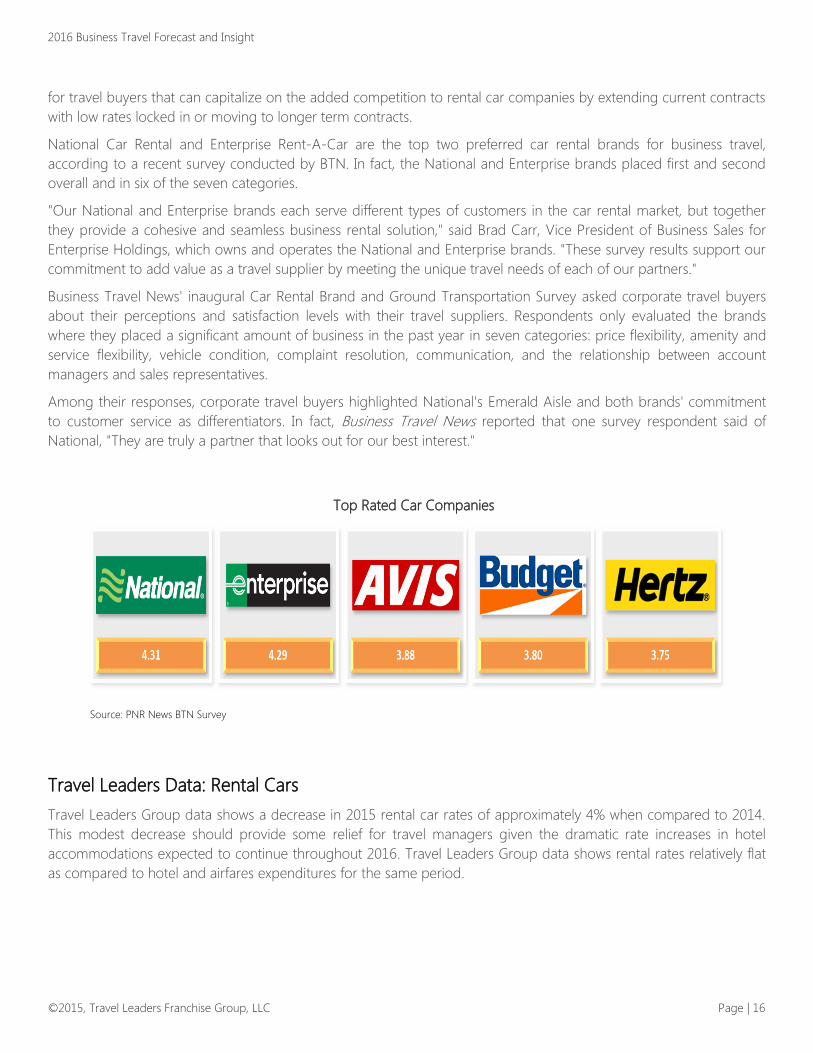
National Car Rental and Enterprise Rent-A-Car are the top two preferred car rental brands for business travel,
according to a recent survey conducted by BTN. In fact, the National and Enterprise brands placed first and second
overall and in six of the seven categories.
"Our National and Enterprise brands each serve different types of customers in the car rental market, but together
they provide a cohesive and seamless business rental solution," said Brad Carr, Vice President of Business Sales for
Enterprise Holdings, which owns and operates the National and Enterprise brands. "These survey results support our
commitment to add value as a travel supplier by meeting the unique travel needs of each of our partners."
Business Travel News' inaugural Car Rental Brand and Ground Transportation Survey asked corporate travel buyers
about their perceptions and satisfaction levels with their travel suppliers. Respondents only evaluated the brands
where they placed a significant amount of business in the past year in seven categories: price flexibility, amenity and
service flexibility, vehicle condition, complaint resolution, communication, and the relationship between account
managers and sales representatives.
Among their responses, corporate travel buyers highlighted National's Emerald Aisle and both brands' commitment
to customer service as differentiators. In fact, Business Travel News reported that one survey respondent said of
National, "They are truly a partner that looks out for our best interest."
Top Rated Car Companies
Source: PNR News BTN Survey
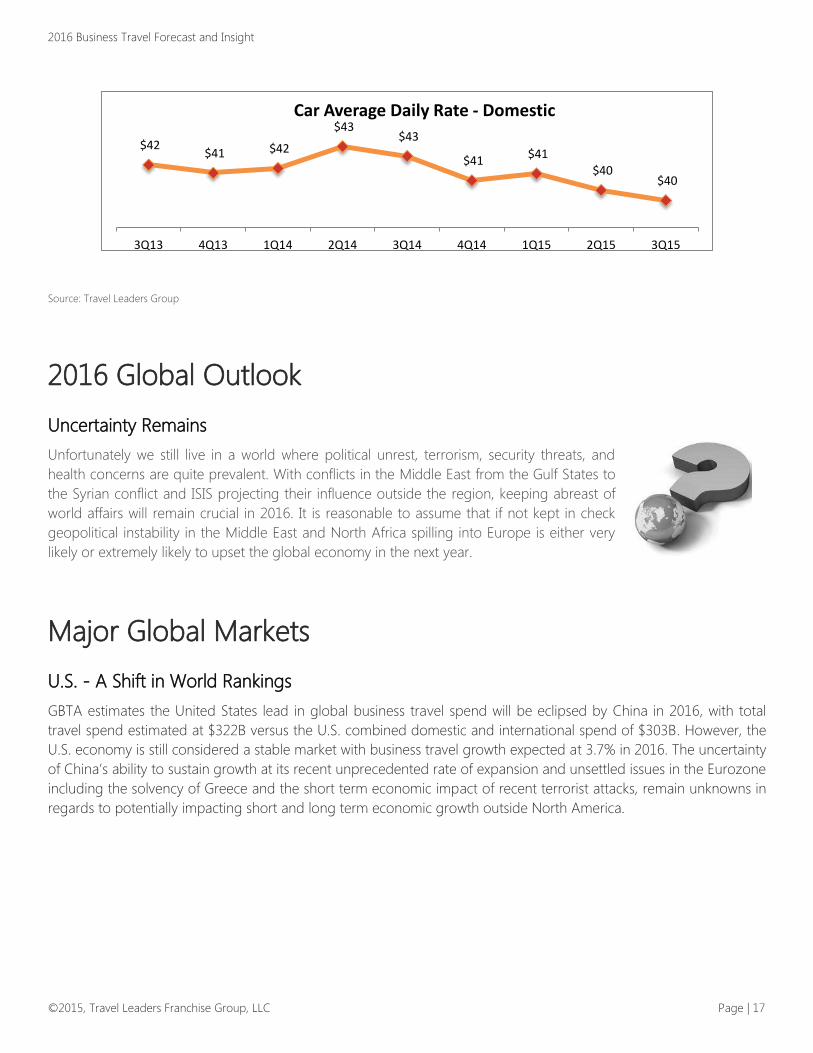
Travel Leaders Data: Rental Cars
Travel Leaders Group data shows a decrease in 2015 rental car rates of approximately 4% when compared to 2014.
This modest decrease should provide some relief for travel managers given the dramatic rate increases in hotel
accommodations expected to continue throughout 2016. Travel Leaders Group data shows rental rates relatively flat
as compared to hotel and airfares expenditures for the same period.
2016 Business Travel Forecast and Insight
©2015, Travel Leaders Franchise Group, LLC Page | 17
$42 $41 $42
$43 $43
$41 $41
$40 $40
3Q13 4Q13 1Q14 2Q14 3Q14 4Q14 1Q15 2Q15 3Q15
Car Average Daily Rate - Domestic
Source: Travel Leaders Group
2016 Global Outlook
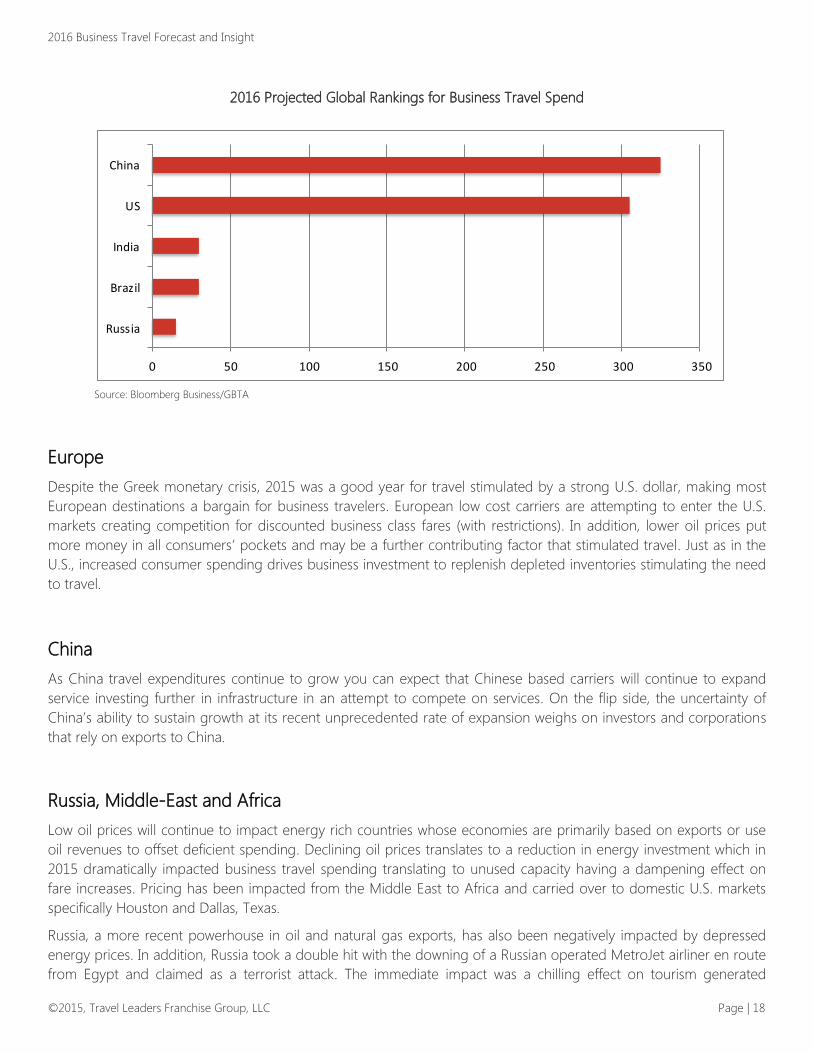
Uncertainty Remains
Unfortunately we still live in a world where political unrest, terrorism, security threats, and
health concerns are quite prevalent. With conflicts in the Middle East from the Gulf States to
the Syrian conflict and ISIS projecting their influence outside the region, keeping abreast of
world affairs will remain crucial in 2016. It is reasonable to assume that if not kept in check
geopolitical instability in the Middle East and North Africa spilling into Europe is either very
likely or extremely likely to upset the global economy in the next year.
Major Global Markets
U.S. - A Shift in World Rankings
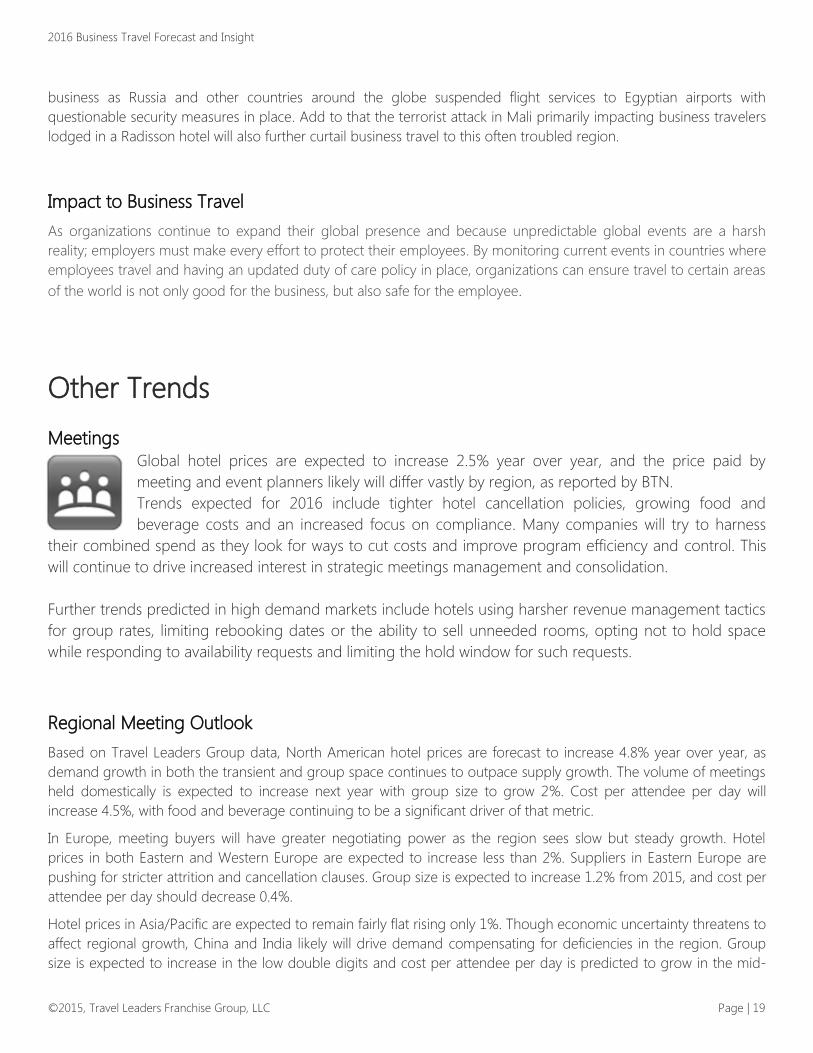
GBTA estimates the United States lead in global business travel spend will be eclipsed by China in 2016, with total
travel spend estimated at $322B versus the U.S. combined domestic and international spend of $303B. However, the
U.S. economy is still considered a stable market with business travel growth expected at 3.7% in 2016. The uncertainty
of China’s ability to sustain growth at its recent unprecedented rate of expansion and unsettled issues in the Eurozone
including the solvency of Greece and the short term economic impact of recent terrorist attacks, remain unknowns in
regards to potentially impacting short and long term economic growth outside North America.
2016 Business Travel Forecast and Insight
©2015, Travel Leaders Franchise Group, LLC Page | 18
2016 Projected Global Rankings for Business Travel Spend
Source: Bloomberg Business/GBTA
Europe
Despite the Greek monetary crisis, 2015 was a good year for travel stimulated by a strong U.S. dollar, making most
European destinations a bargain for business travelers. European low cost carriers are attempting to enter the U.S.
markets creating competition for discounted business class fares (with restrictions). In addition, lower oil prices put
more money in all consumers’ pockets and may be a further contributing factor that stimulated travel. Just as in the
U.S., increased consumer spending drives business investment to replenish depleted inventories stimulating the need
to travel.
China
As China travel expenditures continue to grow you can expect that Chinese based carriers will continue to expand
service investing further in infrastructure in an attempt to compete on services. On the flip side, the uncertainty of
China’s ability to sustain growth at its recent unprecedented rate of expansion weighs on investors and corporations
that rely on exports to China.
Russia, Middle-East and Africa
Low oil prices will continue to impact energy rich countries whose economies are primarily based on exports or use
oil revenues to offset deficient spending. Declining oil prices translates to a reduction in energy investment which in
2015 dramatically impacted business travel spending translating to unused capacity having a dampening effect on
fare increases. Pricing has been impacted from the Middle East to Africa and carried over to domestic U.S. markets
specifically Houston and Dallas, Texas.
Russia, a more recent powerhouse in oil and natural gas exports, has also been negatively impacted by depressed
energy prices. In addition, Russia took a double hit with the downing of a Russian operated MetroJet airliner en route
from Egypt and claimed as a terrorist attack. The immediate impact was a chilling effect on tourism generated
0 50 100 150 200 250 300 350
Russia
Brazil
India
US
China
2016 Business Travel Forecast and Insight
©2015, Travel Leaders Franchise Group, LLC Page | 19
business as Russia and other countries around the globe suspended flight services to Egyptian airports with
questionable security measures in place. Add to that the terrorist attack in Mali primarily impacting business travelers
lodged in a Radisson hotel will also further curtail business travel to this often troubled region.
Impact to Business Travel
As organizations continue to expand their global presence and because unpredictable global events are a harsh
reality; employers must make every effort to protect their employees. By monitoring current events in countries where
employees travel and having an updated duty of care policy in place, organizations can ensure travel to certain areas
of the world is not only good for the business, but also safe for the employee.
Other Trends
Meetings Global hotel prices are expected to increase 2.5% year over year, and the price paid by
meeting and event planners likely will differ vastly by region, as reported by BTN.
Trends expected for 2016 include tighter hotel cancellation policies, growing food and
beverage costs and an increased focus on compliance. Many companies will try to harness
their combined spend as they look for ways to cut costs and improve program efficiency and control. This
will continue to drive increased interest in strategic meetings management and consolidation.
Further trends predicted in high demand markets include hotels using harsher revenue management tactics
for group rates, limiting rebooking dates or the ability to sell unneeded rooms, opting not to hold space
while responding to availability requests and limiting the hold window for such requests.
Regional Meeting Outlook
Based on Travel Leaders Group data, North American hotel prices are forecast to increase 4.8% year over year, as
demand growth in both the transient and group space continues to outpace supply growth. The volume of meetings
held domestically is expected to increase next year with group size to grow 2%. Cost per attendee per day will
increase 4.5%, with food and beverage continuing to be a significant driver of that metric.
In Europe, meeting buyers will have greater negotiating power as the region sees slow but steady growth. Hotel
prices in both Eastern and Western Europe are expected to increase less than 2%. Suppliers in Eastern Europe are
pushing for stricter attrition and cancellation clauses. Group size is expected to increase 1.2% from 2015, and cost per
attendee per day should decrease 0.4%.
Hotel prices in Asia/Pacific are expected to remain fairly flat rising only 1%. Though economic uncertainty threatens to
affect regional growth, China and India likely will drive demand compensating for deficiencies in the region. Group
size is expected to increase in the low double digits and cost per attendee per day is predicted to grow in the mid-

2016 Business Travel Forecast and Insight
©2015, Travel Leaders Franchise Group, LLC Page | 20
single digits. Global clients that have a presence in Asia Pacific are looking to implement strategic meeting
management programs for improved control and cost savings, but not at the expense of local business needs.
In Latin America and the Caribbean, hotel prices are forecast to increase approximately 3%. Corporate group size in
the region dropped substantially from 2014 levels as a result of worsening economic conditions in Brazil and
Argentina. In 2016, group size is predicted to continue to drop. The pharmaceutical industry should drive meetings
growth as North American-based companies expand their meetings and events programs and visibility in the region.
Cost per attendee per day is expected to increase in the low single digits.
2016 Business Travel Forecast and Insight
©2015, Travel Leaders Franchise Group, LLC Page | 21
Appendix
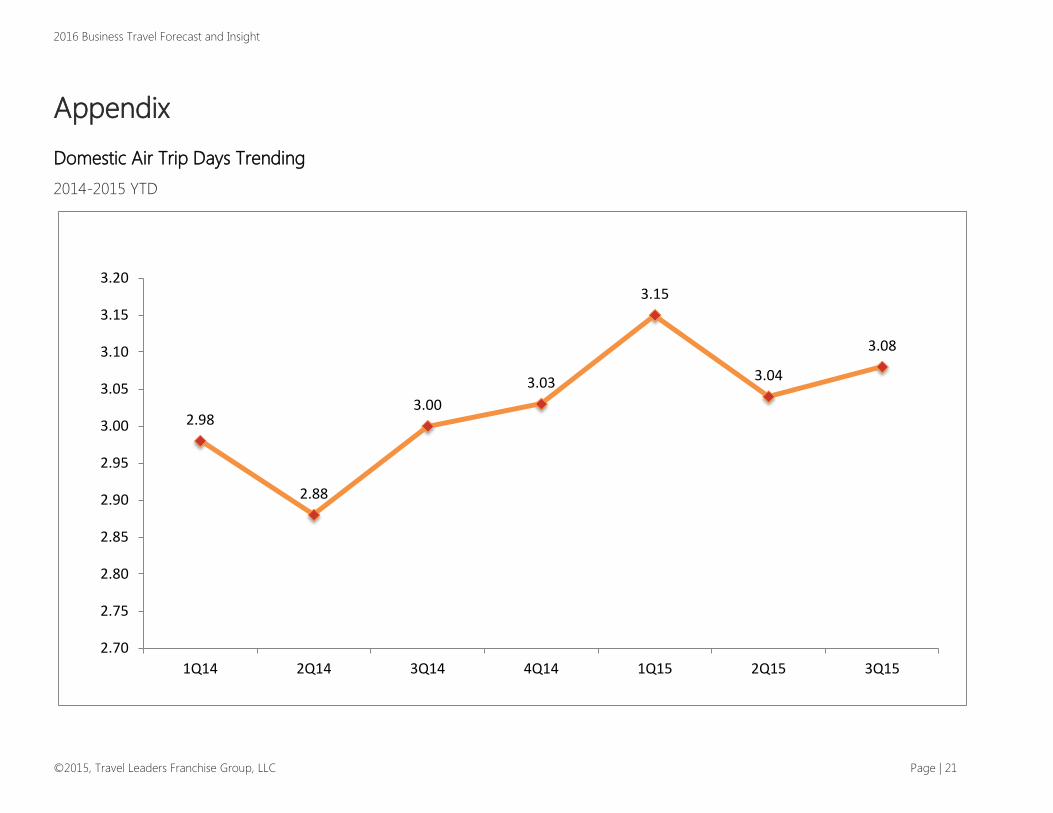
Domestic Air Trip Days Trending
2014-2015 YTD
2.98
2.88
3.00
3.03
3.15
3.04
3.08
2.70
2.75
2.80
2.85
2.90
2.95
3.00
3.05
3.10
3.15
3.20
1Q14 2Q14 3Q14 4Q14 1Q15 2Q15 3Q15
2016 Business Travel Forecast and Insight
©2015, Travel Leaders Franchise Group, LLC Page | 22
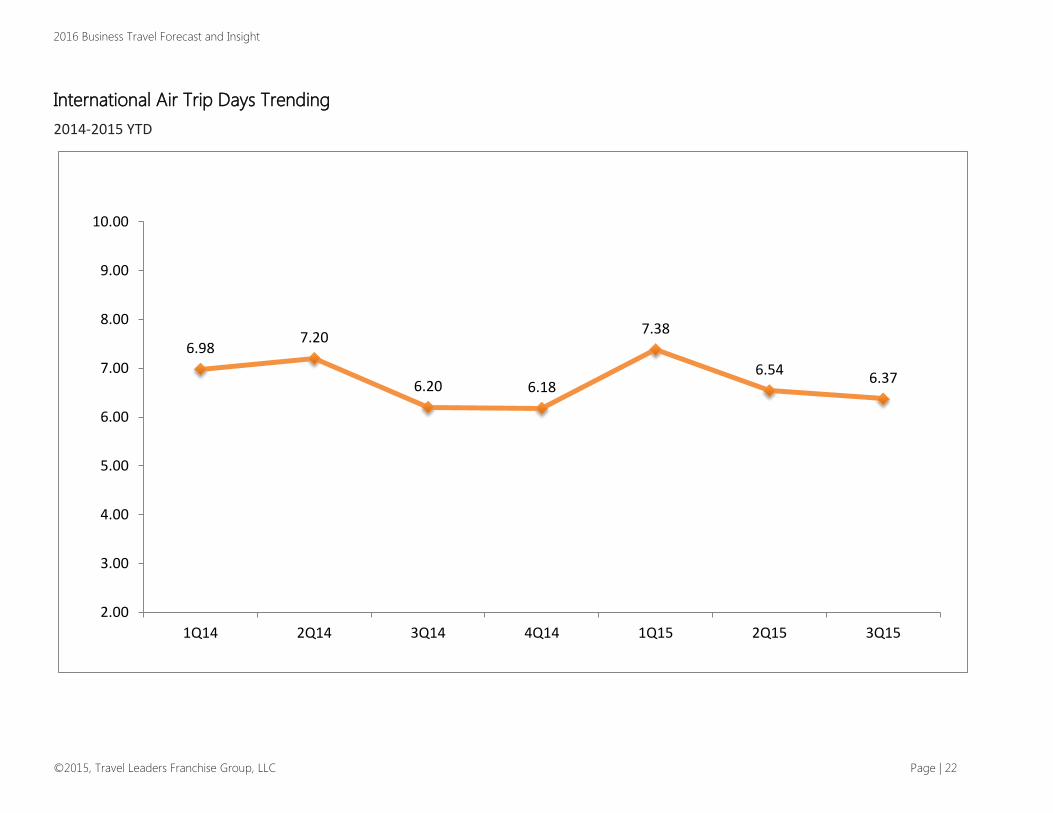
International Air Trip Days Trending
2014-2015 YTD
6.987.20
6.20 6.18
7.38
6.546.37
2.00
3.00
4.00
5.00
6.00
7.00
8.00
9.00
10.00
1Q14 2Q14 3Q14 4Q14 1Q15 2Q15 3Q15
2016 Business Travel Forecast and Insight
©2015, Travel Leaders Franchise Group, LLC Page | 23
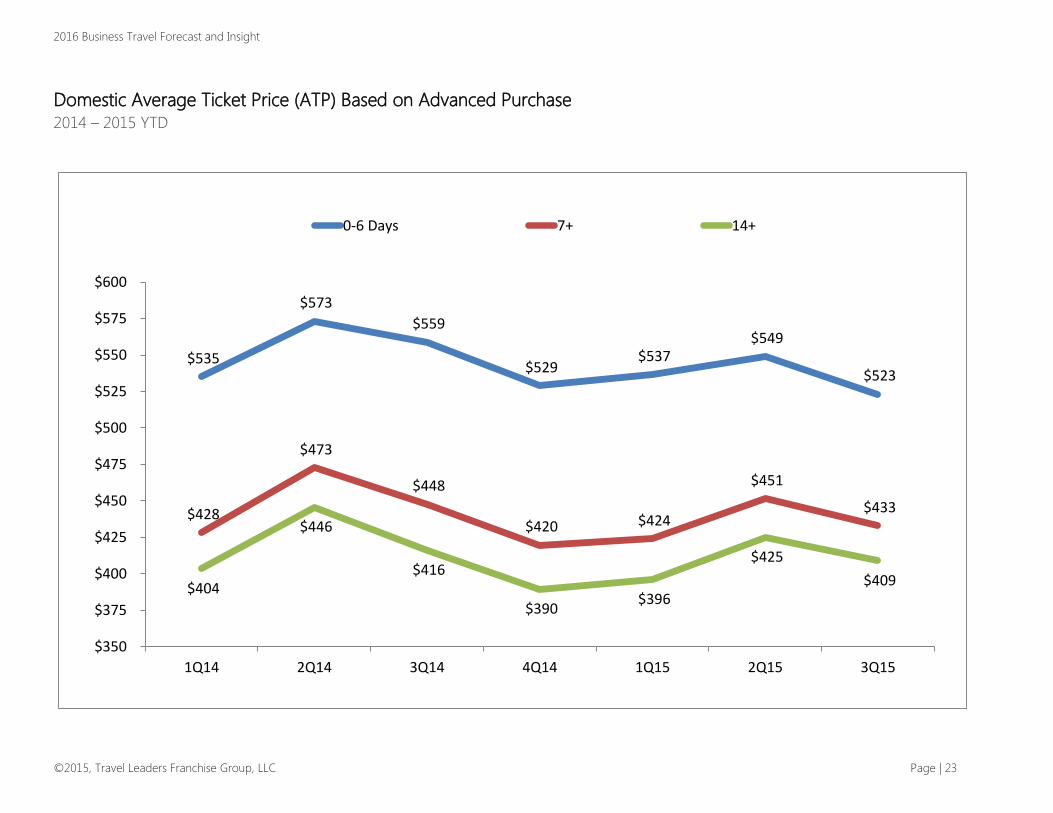
Domestic Average Ticket Price (ATP) Based on Advanced Purchase
2014 – 2015 YTD
$535
$573
$559
$529 $537
$549
$523
$428
$473
$448
$420 $424
$451
$433
$404
$446
$416
$390 $396
$425
$409
$350
$375
$400
$425
$450
$475
$500
$525
$550
$575
$600
1Q14 2Q14 3Q14 4Q14 1Q15 2Q15 3Q15
0-6 Days 7+ 14+
2016 Business Travel Forecast and Insight
©2015, Travel Leaders Franchise Group, LLC Page | 24
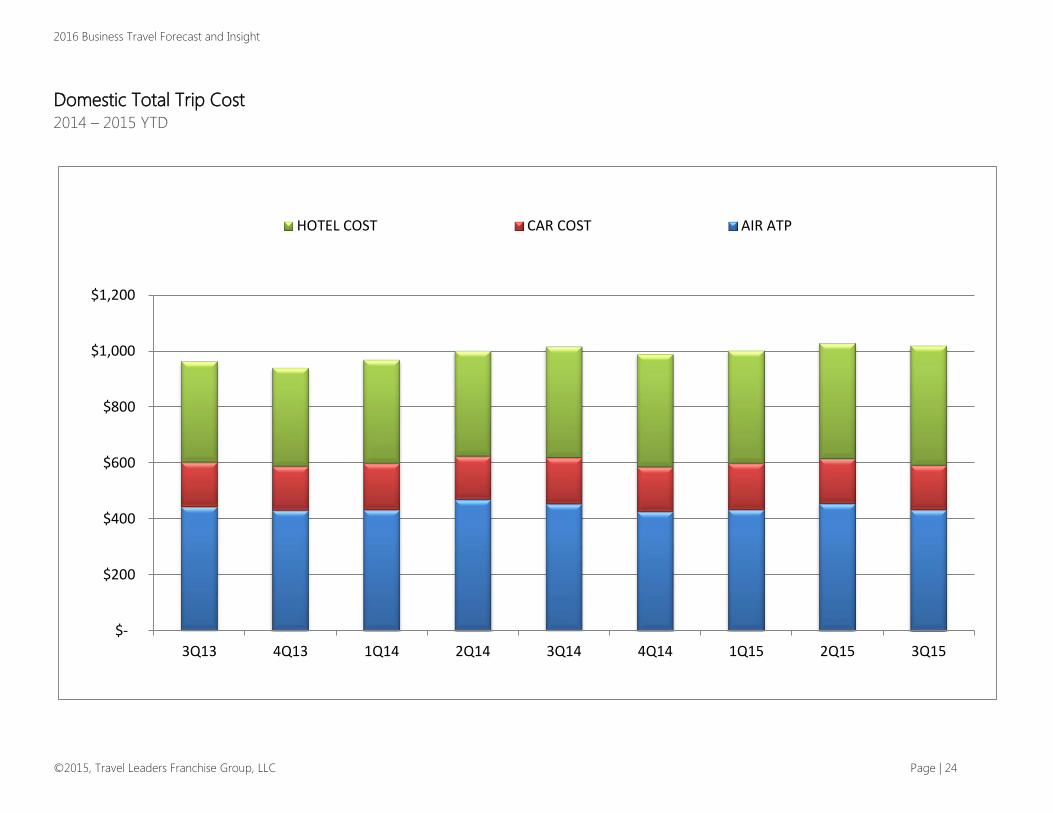
Domestic Total Trip Cost
2014 – 2015 YTD
$-
$200
$400
$600
$800
$1,000
$1,200
3Q13 4Q13 1Q14 2Q14 3Q14 4Q14 1Q15 2Q15 3Q15
HOTEL COST CAR COST AIR ATP
2016 Business Travel Forecast and Insight
©2015, Travel Leaders Franchise Group, LLC Page | 25
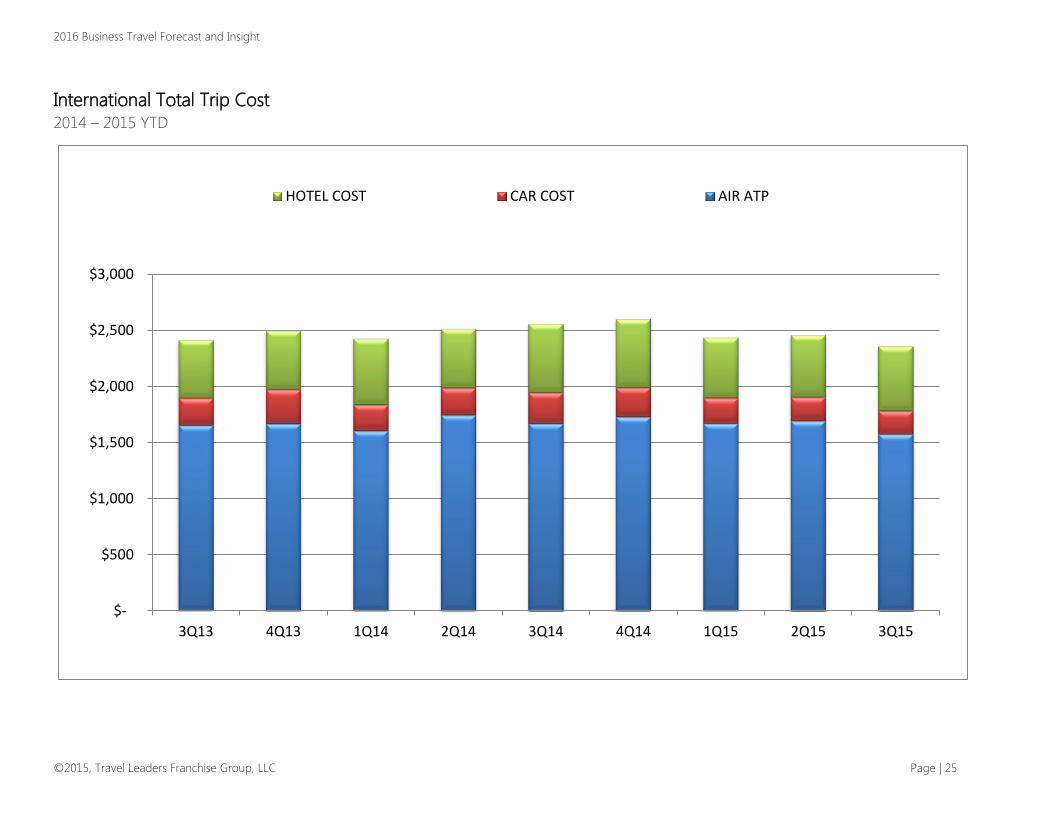
International Total Trip Cost
2014 – 2015 YTD
$-
$500
$1,000
$1,500
$2,000
$2,500
$3,000
3Q13 4Q13 1Q14 2Q14 3Q14 4Q14 1Q15 2Q15 3Q15
HOTEL COST CAR COST AIR ATP