Embed Size (px)
Citation preview

Blekinge Institute of Technology School of Management
FED006 - Master Thesis June 2004
Business Strategy and Management Control Measures for Success!
Authors: Kent Marshall Mikael Snygg
Business Strategy and Management Control Measures for Success! K. Marshall M. Snygg
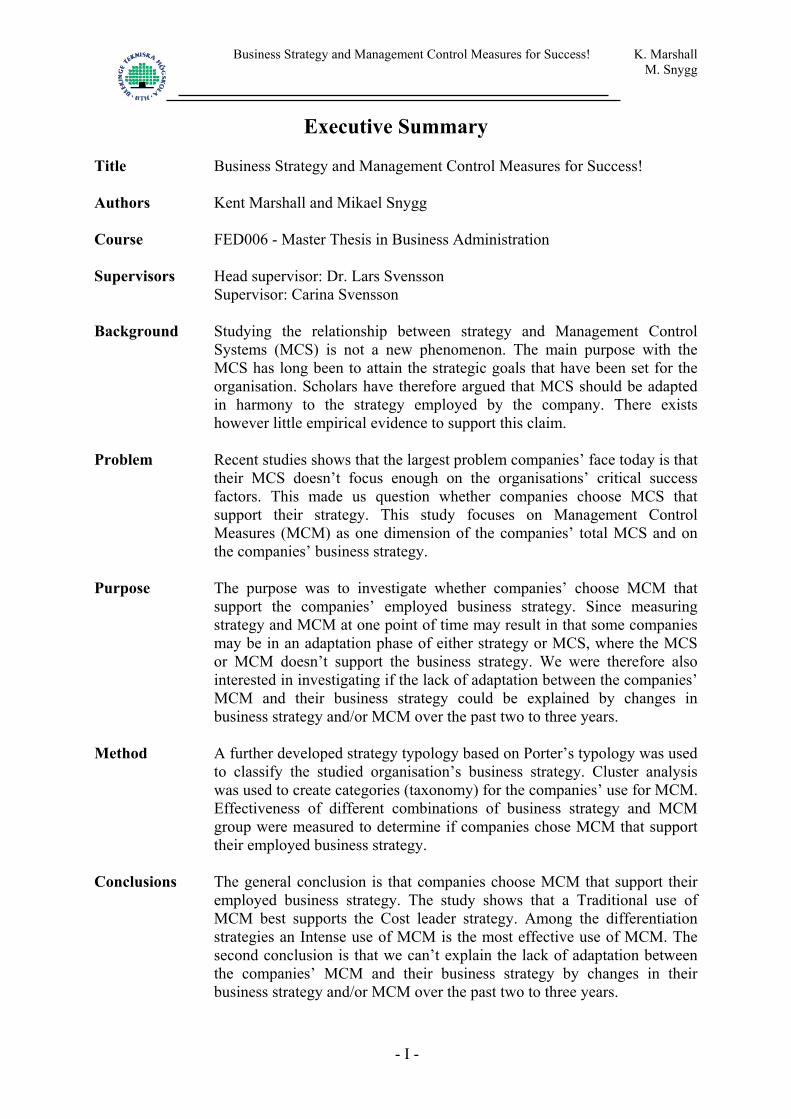
Executive Summary Title Business Strategy and Management Control Measures for Success! Authors Kent Marshall and Mikael Snygg Course FED006 - Master Thesis in Business Administration Supervisors Head supervisor: Dr. Lars Svensson
Supervisor: Carina Svensson Background Studying the relationship between strategy and Management Control
Systems (MCS) is not a new phenomenon. The main purpose with the MCS has long been to attain the strategic goals that have been set for the organisation. Scholars have therefore argued that MCS should be adapted in harmony to the strategy employed by the company. There exists however little empirical evidence to support this claim.
Problem Recent studies shows that the largest problem companies’ face today is that
their MCS doesn’t focus enough on the organisations’ critical success factors. This made us question whether companies choose MCS that support their strategy. This study focuses on Management Control Measures (MCM) as one dimension of the companies’ total MCS and on the companies’ business strategy.
Purpose The purpose was to investigate whether companies’ choose MCM that
support the companies’ employed business strategy. Since measuring strategy and MCM at one point of time may result in that some companies may be in an adaptation phase of either strategy or MCS, where the MCS or MCM doesn’t support the business strategy. We were therefore also interested in investigating if the lack of adaptation between the companies’ MCM and their business strategy could be explained by changes in business strategy and/or MCM over the past two to three years.
Method A further developed strategy typology based on Porter’s typology was used
to classify the studied organisation’s business strategy. Cluster analysis was used to create categories (taxonomy) for the companies’ use for MCM. Effectiveness of different combinations of business strategy and MCM group were measured to determine if companies chose MCM that support their employed business strategy.
Conclusions The general conclusion is that companies choose MCM that support their
employed business strategy. The study shows that a Traditional use of MCM best supports the Cost leader strategy. Among the differentiation strategies an Intense use of MCM is the most effective use of MCM. The second conclusion is that we can’t explain the lack of adaptation between the companies’ MCM and their business strategy by changes in their business strategy and/or MCM over the past two to three years.
- I -

Business Strategy and Management Control Measures for Success! K. Marshall M. Snygg
Acknowledgement
With this master thesis written, we are now ready to leave the sheltered life of university studies and step out into the tough and ruthless labour market. This thesis is the final component of four years University studies. The master thesis is equivalent to 10 weeks of fulltime studies at School of Management, Blekinge Institute of Technology. Considerably more time than 10 weeks has been spent on this thesis, since it has been under progress under the time period January 2004 to June 2004. We are very grateful to the respondents in the studied companies, for taking their time and effort to answer our questions honestly and frankly. We would also like to thank, the department of External Relations at Blekinge Institute of Technology, for their fast responses to our questions and willingness to help us. The “English-crew” which has proof read our thesis is also worth a word of appreciation. Finally we would like to especially thank our supervisors Lasse and Carina for the time they have spent on giving us valuable comments, ideas and suggestions. We have had many constructive and pleasant meetings, from which we have learnt a lot. We are proud to present this thesis and we hope you will have a pleasant time reading it!
Ronneby, Sweden, June 2004
_______________________ Kent Marshall
_______________________ Mikael Snygg
- II -

Business Strategy and Management Control Measures for Success! K. Marshall M. Snygg
Table of Contents 1. Problem Discussion ............................................................................................... 1
1.1. Relationship - Strategy and Management Control Systems....................................... 1 1.1.1. Strategy and MCS .............................................................................................. 2
1.2. Business Strategy ....................................................................................................... 3 1.3. Management Control Systems (MCS) ....................................................................... 4
1.3.1. Management Control Measures (MCM) ............................................................ 4 1.4. Perspectives................................................................................................................ 5 1.5. Problem Formulation.................................................................................................. 6
1.5.1. Purpose ............................................................................................................... 8 1.6. Disposition ................................................................................................................. 8
2. Theoretical Frame of Reference......................................................................... 10 2.1. Contingency Approach............................................................................................. 10
2.1.1. Fit and Effectiveness ........................................................................................ 10 2.2. Business Strategy ..................................................................................................... 11
2.2.1. Miles & Snow................................................................................................... 13 2.2.2. Porter ................................................................................................................ 15 2.2.3. Choice of Strategy Typology ........................................................................... 16
2.3. Management Control................................................................................................ 19 2.3.1. Means of Control.............................................................................................. 19 2.3.2. Management Control........................................................................................ 20 2.3.3. Tightness or Looseness .................................................................................... 21 2.3.4. Performance Measurement Systems (PMS)..................................................... 22 2.3.5. The Balanced Scorecard (BSC)........................................................................ 23 2.3.6. Management Control Measures ....................................................................... 24
3. Methodology......................................................................................................... 26 3.1. General Approach .................................................................................................... 26 3.2. Practical Approach ................................................................................................... 26
3.2.1. Selecting the Companies’ Features .................................................................. 26 3.2.1.1. Choice of Respondents............................................................................. 28
3.2.2. Construction of Survey..................................................................................... 28 3.2.2.1. Developing Business Strategy Questions................................................. 29 3.2.2.2. Developing Use of Management Control Measure Questions................. 30 3.2.2.3. Developing Effectiveness Measuring Questions...................................... 31
3.2.3. How Many Companies Should Be Included in The Study?............................. 31 3.2.4. Contacting the Companies ............................................................................... 32 3.2.5. Collecting Empirical Data ................................................................................ 32 3.2.6. Compiling the Data .......................................................................................... 33 3.2.7. Analysis Methods............................................................................................. 33
3.2.7.1. Classifying Business Strategy .................................................................. 33 3.2.7.2. Classifying MCM..................................................................................... 33 3.2.7.3. Cluster Analysis ....................................................................................... 34 3.2.7.4. Factor Analysis......................................................................................... 34 3.2.7.5. Analysis Model ........................................................................................ 34
- III -

Business Strategy and Management Control Measures for Success! K. Marshall M. Snygg
3.3. Reliability ................................................................................................................. 36 3.4. Validity..................................................................................................................... 36
4. Presentation of Survey Results........................................................................... 37 4.1. Drop of Analysis ...................................................................................................... 37 4.2. The Studied Companies ........................................................................................... 37
4.2.1. Branch, Number of Employees and Owner Structure...................................... 37 4.2.2. Subcontractor ................................................................................................... 38 4.2.3. Products............................................................................................................ 39
4.3. Critical Success Factors and Business Strategy ....................................................... 41 4.3.1. The Companies’ Critical Success Factors........................................................ 41 4.3.2. The companies’ business strategy .................................................................... 41
4.4. Management Control Measures ............................................................................... 42 4.4.1. Today’s Use of Management Control Measures.............................................. 42 4.4.2. The Use of Management Control Measures Two to Three Years Ago............ 44
4.5. Effectiveness ............................................................................................................ 45
5. Classification of Business Strategies .................................................................. 47 5.1. Cluster Analysis ....................................................................................................... 47
5.1.1. Classification According to Miles & Snow’s Typology .................................. 48 5.1.2. Further Analysis of the Cluster Analysis ......................................................... 50 5.1.3. Classification According to the Further Developed Typology ........................ 50
5.2. Factor Analysis of the Strategy Variables................................................................ 55 5.2.1. Classification of Business Strategies According to the Factor Analysis ......... 57
5.3. Summary and Validity of the Classification ............................................................ 58 5.3.1. Further Analysis of the Business Strategies..................................................... 59
5.3.1.1. Success Factors ........................................................................................ 60 5.3.1.2. Subcontractors .......................................................................................... 61
6. Creating Taxonomy for the Use of MCM ......................................................... 62 6.1. Cluster Analysis of the Use of MCM....................................................................... 63
6.1.1. Further Analysis of the MCM .......................................................................... 64
7. Effectiveness ......................................................................................................... 66 7.1. Measuring Effectiveness .......................................................................................... 66
8. Business Strategy and MCM - Fit or Misfit...................................................... 68 8.1. Business Strategy and Different Groups of MCM ................................................... 68 8.2. Business Strategy, Groups of MCM and Effectiveness ........................................... 69 8.3. Fit or Misfit Between MCM and Business Strategy ................................................ 70
8.3.1. Cost Leader Strategy ........................................................................................ 70 8.3.2. Marketing Strategy........................................................................................... 71 8.3.3. Customisation strategy ..................................................................................... 72 8.3.4. Product Development Strategy......................................................................... 72
8.4. Summary .................................................................................................................. 73 8.5. Misfits....................................................................................................................... 74
- IV -

Business Strategy and Management Control Measures for Success! K. Marshall M. Snygg
8.5.1. Eventual Changes of Business Strategy ........................................................... 74 8.5.2. Eventual Changes of MCM Group................................................................... 75
8.6. Summary .................................................................................................................. 76 8.7. Further Analysis of High and Low Effective Companies ........................................ 76
9. Results................................................................................................................... 79 9.1. Summary .................................................................................................................. 79 9.2. Conclusion................................................................................................................ 79
9.2.1. Other Conceivable Explanations to the Misfits................................................ 80 9.3. Is the Study’s Results Reasonable?.......................................................................... 81 9.4. Suggestions to Further Studies................................................................................. 83 9.5. The Authors’ final words ......................................................................................... 83
References Appendix
- V -
Business Strategy and Management Control Measures for Success! K. Marshall - M. Snygg Problem Discussion
1. Problem Discussion The relationship between strategy and management control systems is initially described in this chapter. This is followed by a discussion of the essential concepts and terms in this thesis, eventually resulting in a problem formulation.
1.1. Relationship - Strategy and Management Control Systems
Studies of the relationship between Strategy and Management Control Systems (MCS) are not a new phenomenon. In the 1960’s the term strategy became commonly used in companies. The purpose with the strategy was then to describe how the company should reach the set goals with the resources available. In 1965 Anthony divided organisations’ planning and strategy implementation into three levels – strategic, tactical and operational. There are specific decision-areas connected to each level. On the strategic level, companies should set long-term goals and sub-goals that need to be reached for the goals to be obtained. The strategic planning is therefore often long-term, a period of three years or more. The tactical level has the objective to implement the chosen strategies and to coordinate the organisations different units into the same direction. On the tactical level the planning is made in a shorter perspective of one to three years and is conducted more or less systematically. MCS were often connected to the tactical level. The operative level’s main objective is to reach an effective resource usage, meaning that the focus is on the on-going work in the near future, which is a shorter perspective than the tactical level.1 The main purpose with the MCS is to attain the strategic goals that have been set for the organisation. The starting point for the MCS is therefore the organisation’s strategy.2 When deciding on the strategy, the vision and business idea needs to be taken into consideration. The business idea describes what area the company should focus on now and in the future, and how the company should develop in relation to its vision3. The vision describes the long-term direction that the company desires to head for4. Strategies are plans for how companies should act in the future5. A company’s goals are set in the strategic planning process where the long-term goals are wide and independent of time. The tactical and operational planning processes then breaks the long-term goals down into more specific goals that should be obtained within a shorter time period. The goals should be possible to measure so that the company can follow-up the used measures to see the company’s position on the market6. A company’s strategies may then be seen as a description of a plan containing information of how a business idea can be obtained7. The strategies that companies define should lead organisations towards obtaining competitive advantages that will secure the company’s future8. This is the classic way of looking at the relationship between MCS and strategy in business administration. There are however other perspectives. Some researchers state the
1 Ax et al. 2002 2 Anthony & Govindarajan 2001 3 Ax et al. 2002 4 Johnson & Scholes 2002 5 Anthony & Govindarajan 2001 6 Svensson & Svensson 1995 7 Ax et al. 2002 8 Hatch 2002
- 1 -

Business Strategy and Management Control Measures for Success! K. Marshall - M. Snygg Problem Discussion
opposite, that strategy is developed from different organisational decisions or actions. The MCS is here considered to be a force among others, which together develop the strategy.9
1.1.1. Strategy and MCS
Changes in the society in which companies operate, require that both companies’ strategies and MCS are changed to fit the actual situation. When society changes, companies need new strategic directions; demanding new information in planning, decision making and control.10 Over the past hundred years we have seen several changes in society. In the first half of the 20th century society shifted from an agricultural society to an industrial society. In the beginning of the industrial society, companies focused mainly on the organisation and control of production in order to make large-scale production possible. In the 1960’s the market’s need for mass-produced goods was getting satisfied and focus shifted towards a more market-orientated production.11 According to Hope & Hope the industrial society has shifted into an information society, where products and services comprise more information than previously. The information society is characterised by the increased importance of the intellectual capital and the importance of customer satisfaction.12 Besides internal factors such as planning and controlling, the MCS also needs to consider external factors such as the increased speed of change in conditions, the more intense competition, the intense demand from customers, and the removal of geographical boundaries, in order for the company to become competitive in the future13. Due to this, operational processes (e.g. sales, manufacturing and administration) in companies continually need to improve. One example of this is that two decades ago a car manufacturer could present a new car model every 7 to 9 years, the development time has changed and today the market demands a new model every 2 to 3 years.14 In the 1980’s, corporate managers began to realise that to stay or become more competitive, companies needed MCS covering all aspects in the organisation and not only the financial aspect, that primary was used. Due to this several new models for controlling operations were developed, such as TQM (Total Quality Management), JIT (Just In Time), Kaizen and BSC (Balanced Scorecard). A consequence of this development was that the aim of the new models could cause conflicts with the traditional MCS. The conflict occurs because the companies’ new strategy is based on more non-financial aspects, like creating customer satisfaction. This contradicts the short-term focus many companies have by only focusing on financial measures.15 A survey regarding companies’ MCS conducted by Johansson et al. in 1997 show that the largest problem companies’ face today is that the MCS doesn’t focus enough on the organisations’ critical success factors16. Critical success factors can be described as the factors needed for a company to attain its strategy, or the components of strategy in which the
9 Rohlin et al. 1994 10 Olve et al. 1999 11 Rohlin et al. 1994 12 Hope & Hope 1997 13 Olve et al. 1999 14 Lind & Skärvad 1997 15 Olve et al. 1999 16 Johansson et al. 1997
- 2 -

Business Strategy and Management Control Measures for Success! K. Marshall - M. Snygg Problem Discussion
organisation must excel to outperform competition17. This made us question whether companies’ chose MCS that support their business strategy.
1.2. Business Strategy
The term Strategy is a wide concept and has many different definitions. We therefore believe it is necessary to clarify and distinguish some of the major strategy concepts used in the business literature. Corporate strategy relates to the product or market choices of the company and can be compared to the portfolio decision in the investment theory. It focuses on the companies’ goals and objectives, their products, the markets in which they serve and the surrounding environment. Business strategy is more focused. It defines how the firm will deploy its resources in a given market or product area.18 A third common type of strategy is the functional strategy, which focuses on how a certain function should reach its goals, e.g. how the production should be organised in order to meet the quality and quantity demands that are set.19 In the 1980’s it became a common practice for companies to focus more and more on the business strategy. Business strategy became a regularly used concept, often with a focus on customers and competitors20. Several researchers developed typologies for business strategies in the late 1970’s and the 1980’s. Two commonly used typologies in recent studies are Miles & Snow’s and Porter’s. In 1978 Miles & Snow developed a typology, which categorised companies into four organisation types (Defenders, Prospectors, Analyzers and Reactors). Companies that are considered to be Defenders have a Defender strategy and the same applies for the other organisational types. Three of these types were successful organisational types and one of them was unsuccessful (Reactors).21 The three successful organisational types have been clearly detailed by Miles & Snow, describing what components each of the different organisation types contain. In 1980 Porter presented a model, which suggested there are three different types of business strategies for companies to choose between. According to Porter companies need to consider the five competitive forces that effect the competition in the industry, when deciding on business strategy. From the five forces, Porter developed three generic business strategies: Overall cost leadership, Differentiation and Focus. These strategies are all considered to provide a good defence against the five forces.22 Porter’s model has some similarities with the three successful organisation types that Miles & Snow’s typology contains. One example of the similarities is Porter’s Cost leader and Miles & Snow’s Defender, which both strive for cost effectiveness.23
17 Johnson & Scholes 2002 18 Hatten et al. 1978 19 Nilsson 1997 20 Greve 1999 21 Miles & Snow 1978 22 Porter 1980 23 Porter 1980, Miles & Snow 1978
- 3 -

Business Strategy and Management Control Measures for Success! K. Marshall - M. Snygg Problem Discussion
This study focuses on companies’ business strategy, also called competitive strategy. We adhere to Porter’s definition of business strategy, which focuses on a position on the market24. We see similar approaches among other scholars e.g. Miles & Snow25.
1.3. Management Control Systems (MCS)
The main purpose of MCS is often considered to be creating goal congruence and to implement the strategy. The majority of the traditional MCS used today, (i.e. accounting principles, planning and controlling26) were developed in the beginning of the 20th century. According to Johnson & Kaplan MCS have not been developing since 1925, in those days financial measures had important roles. Costs were prioritised in companies; meanwhile little attention was aimed at the revenues27. In the contrary Olve et al. considers that the industry has gone through major technical development since World War II, as well as the organisations have grown and become more complex28. In the past decades the criticism towards the traditional MCS has been intense and its relevance has been questioned. Several researchers claim that the MCS lack of relevance has led to that the MCS has become a hinder for the organisation’s development. Some of Johnson & Kaplan’s criticism is summarised below.29
−
−
Financial reports only contain limited information about operational activities, which makes it difficult to make effectiveness-improving decisions. Short-term measures are considered more important than long-term measures. The measures used, often focuses on the owner and the owner’s return on investments and may lead to sub-optimisations, as short-term goals often contradict long-term goals.
The criticism towards the traditional MCS is not always general though, the MCS in Nordic countries seem to differ from other countries. Many interest groups have created models for the use of developing MCS, which has led to an increase in the use of non-financial information.30
1.3.1. Management Control Measures (MCM)
MCS can be shaped in different ways. Different emphasis can be put on structure, short-term and long-term focus, financial and non-financial measures etcetera. In this study we will focus on Management Control Measures (MCM), as a part of the companies MCS. According to Ewing & Samuelson financial and non-financial measures are two important dimensions needed to create a MCS with balance and focus, i.e. creating a balance between different dimensions of the MCS and focusing on critical success factors.31
24 Porter 1980 25 Miles & Snow 1978 26 Ax, et al. 2002 27 Johnson & Kaplan 1987 28 Olve et al. 1999 29 Johnson & Kaplan 1987 30 Johansson & Samuelson 1998 31 Ewing & Samuelson 1998
- 4 -
Business Strategy and Management Control Measures for Success! K. Marshall - M. Snygg Problem Discussion
The choice of only focusing on financial and non-financial measures was also partly based on time related obstacles. One of the main reasons behind this choice is as mentioned above that several authors (besides Ewing & Samuelson) consider measures focusing on financial and non-financial aspects as one among other dimensions (e.g. organisational structure, values etcetera), which establishes the framework in companies’ MCS.32 Another reason is that a large amount of the criticism towards the traditional management control is based on a far too one-sided use of financial measures. According to Johnson & Kaplan it was during the industrialism enough to use aggregated measures to create value for the companies’ owners.33 Today it isn’t enough to be able to use financial assets and debts in an efficient manner. For the organisations to be able to reach success in today’s more knowledge intense society it is important to use measures that gather and measures immaterial or “invisible” assets. Thus the need for so called non-financial measures has grown. The use of financial measures in internal planning and follow-up is however still large.34 Financial information is also relevant for external stakeholders like shareholders or lenders, where for example profit development and financing are studied before decisions are made concerning purchase or sale of shares and whether loans are to be granted. During the past ten to fifteen years a more normative focused literature concerning the relationship between strategy and MCS has grown forward35. These authors present general models that may be adapted to a specific company’s strategy. One common item among these models is that they are based on both financial and non-financial measures. Kaplan & Norton developed the Balanced Scorecard (BSC) in 1992. According to Kaplan & Norton companies need both financial and non-financial measures on all levels in the organisation. One of the BSC many functions is to translate companies’ strategies into specific goals and measures, thus companies will have different combinations of financial and non-financial measures depending on their strategy.36
1.4. Perspectives
In thesis writing one often has to approach the study from a perspective. The function of a perspective may be illustrated as different pairs of glasses. Each pair of glasses represents a different perspective, e.g. from one pair of glasses the observer looks at a phenomenon from the managements point of view, from another pair of glasses the observer looks at the phenomenon from the employees point of view.37 Hence a researcher can choose a wide range of perspectives to approach a study. In this study we have numerous of different perspectives to choose between, e.g. we could study the companies from an owner perspective, from a business group perspective, from the Managing Director’s perspective, from the Financial Manager or Chief Accountant’s perspective, etcetera. When a perspective has been chosen the observer chooses one or several aspects that are considered to be relevant for the interpretation of the studied phenomenon38.
32 Greve 1999, Gyllberg & Svensson 2002, Lind 1996 33 Johnson & Kaplan 1987 34 Olve et al. 1999 35 Kaplan & Norton 1992, Lynch & Cross 1991 36 Lind 2000 37 Lundahl & Skärvad 1999 38 Lundahl & Skärvad 1999
- 5 -
Business Strategy and Management Control Measures for Success! K. Marshall - M. Snygg Problem Discussion
We have chosen to approach this study from a management perspective, looking closer at the aspects of the relationship between business strategy and management control measures (MCM). Management can be referred to managers at a corporate, business or functional level39. We refer management to managers in leading positions at the business level, since we are studying business strategies in companies. Since this study focuses on the relationship between MCM and business strategies, we will collect the required data from the persons that have the most knowledge about the company’s management control and a good view of the company’s business strategy, namely one of the following persons; the Financial Manager, the Chief Accountant or the Controller (a further discussion is held in paragraph 3.2.1.1). In studies where the relationship between strategy and MCS has been studied, different interpretations can be done. This can to a certain point be explained by the differences in theoretical starting points. Research that assumes that strategy grows out of continuously made decisions in organisations sees the MCS like a force that develops the strategy. This means that research with this starting point, mainly studies the MCS role in political and social processes that lies behind the shaping of organisations strategy. In studies where strategy is treated as a structural activity that precedes business oriented decisions and activities MCS are mainly seen as a tool to implement a company’s strategy. Several of these studies use a contingency approach, where strategy is one variable that affects a company’s MCS. Not long ago a new research direction grew forward; it combined the two above named research directions and is called Strategic MCS. Here the MCS’s role for formulating and developing the strategy has been raised and is seen as important.40 In our study we assume that companies have a vision that is used to develop a strategy and afterwards develop a MCS to implement the strategy. It is however reasonable to believe that companies change or adjusts their strategies and MCS to the prevailing circumstances. Since Anthony’s study in 1965 several other studies have been conducted to establish the relationship between strategy and MCS. In the past two decades several studies in this research area have been published41. These authors have all used a contingency approach, which we also will use in order for us to be able to draw parallels between our study and previous studies. This approach view strategy as one variable among others that effects the shaping of the MCS. This approach is further discussed in paragraph 2.1.
1.5. Problem Formulation
Many researchers and MCS literature argue that MCS should be modified in harmony to the business strategy of a company. Simons has however found little empirical evidence to support this claim.42 Simons’s study was conducted several years ago, but even recent studies
39 Hatten et al. 1978 40 Lind 2000 41 Langfield-Smith 1997, Gupta & Govindarajan 1984, Chenhall & Langfield-Smith 1998, Greve 1999, Gyllberg & Svensson 2002 42 Simons 1987
- 6 -

Business Strategy and Management Control Measures for Success! K. Marshall - M. Snygg Problem Discussion
show that companies’ MCS don’t focus enough on their strategy43. Few empirical studies investigate whether companies chose MCS that support their strategy. According to Greve, most of the research within the subject has focused on answering two questions: “What distinguishes MCS that are used by companies with different strategies?” and “What preferences in the MCS in combination with strategy creates positive effects on company effectiveness?”.44 During our time at university, one of the most common topics in management control courses has been that MCS should be modified in harmony to the business strategy of a company. Due to the lack of empirical studies that investigate whether companies chose MCS that support their strategy and studies showing that one of the main problems companies have today is focusing their MCS in the same direction as their strategy, we found this interesting to investigate. Most of the research we have studied within this area has measured strategy and MCS at one point of time45. This may lead to a bias in the study of the relationship between MCS and business strategy in several ways. The adaptation of strategy to changes in the companies’ environment is an ongoing process where the adaptation of the strategy may take a long time. Also the adaptation of companies’ MCS to changes in the companies’ strategy may be an ongoing process where the adaptation of the MCS may take a long time. Changes in business strategy may not either yet have had impacts on the MCS. If you study the relationship between MCS and business strategy at one point of time you may end up in between an adaptation of either strategy or MCS, where the MCS doesn’t support the business strategy. Donaldson supports these assumptions through his statement that within contingency theory it is contingency that causes structure and according to Donaldson46:
“this is the long-run effect which flows through intermediary stages such as misfit. Thus contingency change initially only lead to misfit which eventually leads to structural change and new fit.”
Donaldson 1994, in Greve 1999:261 In relation to the results from previous studies47 we expect to find companies that haven’t chosen MCS that support their business strategy. One explanation to this may be the adjustments in companies’ MCS or their business strategy. We are therefore interested in investigating if misfits between MCS and business strategy can be explained by this adaptation difficulty. The following frame of questions summarises this discussion:
Do companies choose Management Control Measures (MCM) that supports their employed business strategy?
43 Johansson et al. 1997 44 Greve 1999 45 Langfield-Smith 1997, Gupta & Govindarajan 1984, Chenhall & Langfield-Smith 1998, Greve 1999, Gyllberg & Svensson 2002 46 Donaldson 1994 in Greve 1999 47 Langfield-Smith 1997, Gupta & Govindarajan 1984, Chenhall & Langfield-Smith 1998, Greve 1999, Gyllberg & Svensson 2002
- 7 -

Business Strategy and Management Control Measures for Success! K. Marshall - M. Snygg Problem Discussion
Can misfits between the companies’ management control measures and companies’ business strategy be explained by changes in business strategy and management control measures over the past two to three years?
1.5.1. Purpose
In the beginning of the 1980’s discussions arose around the gap between theory and practise in MCS. Many methods that theories recommend are used in low scale in practise. Today many researchers take the gap between methods that according to theory should be used and the actual methods used in practise seriously. Therefore many projects are driven by the purpose of closing the gap and increasing the understanding of MCS used in practise.48 We hope this study can contribute to closing the gap. This study will hopefully give a theoretical and practical guideline for managers in manufacturing companies to which MCM that support different business strategies. By enlightening these managers on which types of MCM that best supports different types of business strategies, we hope misfits caused by MCM that don’t support the employed business strategy may be avoided in the future.
1.6. Disposition
1. Background and problem formulation
3. Methodology
2. Theoretical frame of references
4. Presentation of the survey result
5.Classification of Business Strategies
6. Taxonomy of MCM
7. Effective-ness
8. Business strategy and MCM - fit or misfit
9. Results and conclusions
Introduction Empiric Analysis Conclusion
Figure 1.1 Disposition As seen in figure 1.1 the study consists of nine chapters. Below each chapter’s contents is described. 48 Ax et al. 2002
- 8 -
Business Strategy and Management Control Measures for Success! K. Marshall - M. Snygg Problem Discussion
The three first chapters consist of an introduction to the study’s problem area. As seen in chapter one, the background to the problem is discussed and ends up in a problem formulation. Chapter two’s contents consist of a theoretical frame of references to the discussed problem area. The third chapter describes the study’s approach. In the fourth chapter we present the result from the study’s survey. In chapters five to eight an analysis is held of the gathered data in chapter four. We started by classifying the studied companies’ business strategy, in chapter five. In chapter six a taxonomy is created of the studied companies’ use of management control measures (MCM). In chapter seven the effectiveness of different combinations of business strategy and MCM group is measured to determine if companies chose MCM that support their employed business strategy. Chapter eight presents how effective different combinations of business strategies and groups of MCM are. The question whether companies chose MCM that support their employed business strategy is answered. We also investigate if the lack of adaptation may be explained by changes in business strategy and/or MCM over the past two to three years. In the finial chapter (nine) the study’s result and conclusions are presented. Suggestions to further studies are also presented in this chapter.
- 9 -
Business Strategy and Management Control Measures for Success! K. Marshall - M. Snygg
Theoretical Frame of Reference
2. Theoretical Frame of Reference In this chapter we present fundamental and essential terms and concepts used in the study.
2.1. Contingency Approach
Until the 1960’s it was common within organisation theory to use an approach, which states that there often is one best way to organise an operation. The Contingency approach has after the 1960’s grown and been practised a strong influence in the organisation theory. The approach is based on two assumptions:
− There is no organisation structure, which is superior all others. − All methods to organise an operation aren’t equally efficient.
The contingency approach emphasises that organisations need to adapt its internal conditions to the environment in order to survive, grow and stay efficient. Criticism towards the contingency theory states that the development of organisations may imply developing the environment, not to adapt to it. The largest criticism towards this theory is that the concept adaptation or fit isn’t defined. There are few conducted studies, which empirically show whether a fit really exists or not and in which degree the organisations have adapted themselves to the environment. Thus there are no strong evidences confirming that it is the fit to the environment, which is the course to the effectiveness in the organisations.49
2.1.1. Fit and Effectiveness
It isn’t likely that all companies that apply one certain form of strategy also will use the same type of measures. How do we then judge to which extent companies adapt their MCM to their strategy? From a contingency approach the question of fit or adaptation is about effectiveness. Adaptation exists in those organisations that have found a combination between structure and context, which is efficient. Effectiveness is normally defined as the degree of goal fulfilment. Effectiveness therefore implies to relate resources and performance toward the aggregated goals and is measured as the degree of goal fulfilment.50 Effectiveness is an abstraction, which can’t be pointed at or observed. The concept is used to give a meaning to interpretations of organisations operations and is given content by operational definitions.51 In the literature we have found many different perspectives on the concept effectiveness. Several of these perspectives lie in a field outside our subject. We however need a definition or a starting point to be able to decide on how to measure effectiveness. Within organisation theory the Rationalistic theory and the System theory represent two dominating points of view. Within the Rationalistic theory goals are considered to be one main controlling factor for organisations activities. Within the System theory goals aren’t considered to be controlling organisations operations, perhaps only a dependent variable. The System theory has a larger weight on factors that increases the organisations long-run survival, e.g. the ability to acquire
49 Abrahamsson & Andersen 1996, Otley 1980 50 Abrahamsson & Andersen 1996 51 Gyllberg & Svensson 2002
- 10 -
Business Strategy and Management Control Measures for Success! K. Marshall - M. Snygg
Theoretical Frame of Reference
resources, keep their existence as a social organism and to cooperate successfully with their environment. We have chosen to start from the Rationalistic organisation theory, because we assume it is easier to measure and compare effectiveness between companies by comparing their degree of goal fulfilment. The starting point within this theory is the view that it is individual needs (wishes, demands, expectations and ambitions) which makes individuals realise that they best satisfy and reach their needs etcetera by a collective act. This creates the foundation for individuals to formulate common goals. An organisation is viewed as a tool for the principal and exists in order to carry out production in order to reach the principals goals. The concept effectiveness is therefore the same as goal fulfilment. One condition for accepting this approach is that the principal is involved in the decision concerning the organisations goals.52 We believe that this condition is reasonable to accept, because there are avowed aims in several organisations, which we assume the principal, are involved in. Otley pointed out some difficulties in measuring effectiveness out of a contingency approach. The main difficulty is based on the thought that companies and their stakeholders may have several and different goals. Thus it isn’t essential to use any general effectiveness criteria for the evaluation of fit. Companies will be efficient in different ways and different stakeholders will rate the results in different ways.53 We have taken this problem into consideration by using an instrument for measuring effectiveness. This instrument measures the effectiveness out of twelve different dimensions of both financial and operative aspects. The respondents are asked to state how successful the companies are in each of these dimensions. This is then weighted against how important the respondents judge each of these dimensions to be for the companies. This instrument is further discussed in paragraph 3.2.2.3 and chapter 7. The MCS is one essential component in a company’s total control system (see paragraph 2.3). It is thus conceivable that a company with a given business strategy may chose between alternative designs of a control system which all lead to the same level of fit.54 This means that companies with the same strategy and dissimilar categories of MCM may be equally efficient. Another conceivable explanation to why companies with the same strategy and dissimilar categories of MCM may be equally efficient is that all related factors haven’t been taken into consideration. This study only focuses on the use of financial and non-financial measures in medium sized manufacturing companies. The use of financial and non-financial measures doesn’t compose the whole MCS in companies. It is also conceivable that e.g. organisational structure, production technology etcetera may explain the differences in the control system design and the equal effectiveness.
2.2. Business Strategy
In business administration the term Strategy has a short history, approximately 30-40 years. In military organisations the term has an ancient history. When the term strategy was first used in business administration its foremost meaning was to use the company’s resources to reach the company’s goals. In today’s strategic literature the term strategy has several different 52 Abrahamsson & Andersen 1996 53 Greve 1999 54 Gyllberg & Svensson 2002
- 11 -
Business Strategy and Management Control Measures for Success! K. Marshall - M. Snygg
Theoretical Frame of Reference
definitions. According to Mintzberg many of these definitions can be adapted into one or several of the following four categorises55:
− Strategy as a plan - is the classic perspective where a plan is developed and then implemented. Decisions and activities should be guided by clear and explicit strategies that should be analytically well constructed.
− Strategy as a pattern - where the patterns in the way of acting in organisations is the strategy.
− Strategy as a position - in this category the focus lies on market positions, competitive advantages, cost levels etcetera. i.e. the determination of particular products in particular markets.
− Strategy as a perspective – where researchers look at the organisation and its way of doing things e.g. vision, organisational values, directions and norms.
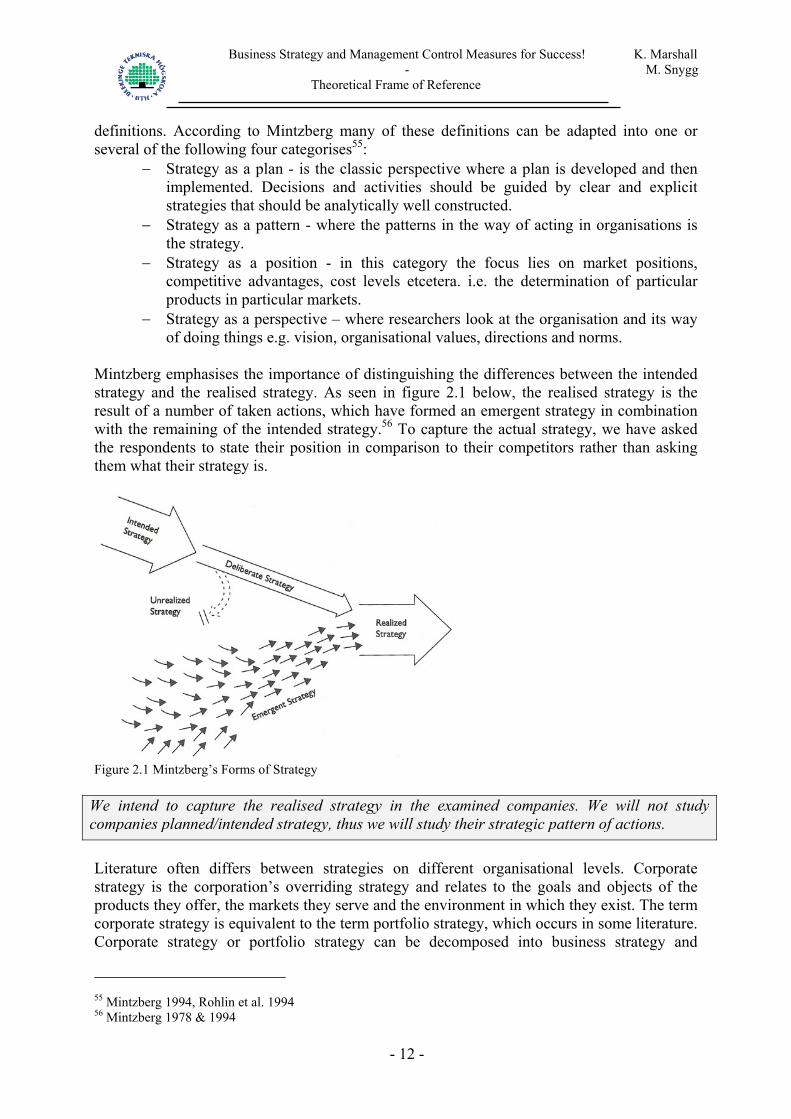
Mintzberg emphasises the importance of distinguishing the differences between the intended strategy and the realised strategy. As seen in figure 2.1 below, the realised strategy is the result of a number of taken actions, which have formed an emergent strategy in combination with the remaining of the intended strategy.56 To capture the actual strategy, we have asked the respondents to state their position in comparison to their competitors rather than asking them what their strategy is.
Figure 2.1 Mintzberg’s Forms of Strategy
We intend to capture the realised strategy in the examined companies. We will not study companies planned/intended strategy, thus we will study their strategic pattern of actions. Literature often differs between strategies on different organisational levels. Corporate strategy is the corporation’s overriding strategy and relates to the goals and objects of the products they offer, the markets they serve and the environment in which they exist. The term corporate strategy is equivalent to the term portfolio strategy, which occurs in some literature. Corporate strategy or portfolio strategy can be decomposed into business strategy and
55 Mintzberg 1994, Rohlin et al. 1994 56 Mintzberg 1978 & 1994
- 12 -

Business Strategy and Management Control Measures for Success! K. Marshall - M. Snygg
Theoretical Frame of Reference
functional strategy.57 The purpose of the business strategy is to achieve and sustain a competitive advantage that is profitable. The business strategy consists of an integrated plan of action to achieve the set goals by coordinating the company’s resources. The functional strategy coordinates the different functions in the organisation so they correlate with the business strategy.58 We adhere to Porter’s definition of business strategy, which focuses on a position on the market. We see similar tendencies in Miles & Snow’s approach; they have however not stated a clear definition of business strategy.
The strategy we will focus on from here on in the thesis is the term business strategy. If nothing else is mentioned we will from now on only talk about business strategy. Several strategy typologies have been developed. Two typologies that are commonly used in research are Miles & Snow’s typology and Porter’s typology. Below we will present these typologies.
2.2.1. Miles & Snow
In 1978 Miles & Snow developed a strategy typology based on existing research and studies from four different branches. The starting point of the typology is based on decisions made by top management. The decision is the foundation for what Miles & Snow call the adaptive cycle. The adaptive cycle contains three processes that are needed for the company to adapt to the demands of the environment; these are Entrepreneurial, Engineering and Administrative. The processes can be seen as problems, which top management need to consider. There is a mutual dependence between these processes and therefore the problems must be solved simultaneously. The Entrepreneurial problem has issues related to a specific product or service and the targeted market. The Engineering problem treats issues of operationalising the solution of the Entrepreneurial problem. The Administrative problem relates to the rationalisation and stabilisation of activities used to solve the entrepreneurial and engineering problem. From these three processes Miles & Snow presents four different types of strategies to move through the adaptive cycle.59 There are three successful organisational types and strategies; Defenders, Analyzers, and Prospectors, as well as one “failure”, the Reactor that consists of companies that have failed to adapt to one of the successful strategy types.60 Therefore we will only describe the three successful strategy types, because companies that use these strategies are the only lightly ones to be found in reality. In figures 2.2, 2.3 and 2.4 we have summarised the most common occurring characteristics of the three successful strategies.
57 Hatten et al. 1978 58 Karlöf 1989 59 Miles & Snow 1978 60 Miles & Snow 1978
- 13 -

Business Strategy and Management Control Measures for Success! K. Marshall - M. Snygg
Theoretical Frame of Reference
Defenders Entrepreneurial Engineering Administrative
1. Operate in a narrow and stable market. Competing with low prices and good customer service. 2. Strive for incremental growth through market penetration. 3. Product development is closely related to current products or services.
1. Cost-efficient technology 2. Single core technology 3. Tendency towards vertical integration 4. Continuous improvements in technology to maintain effectiveness
1. Intensive planning and cost orientation. 2. Functional structure and high degree of formalisation is lightly. 3. Centralised control 4. Performance measures that can be compared to previous years.
Figure 2.2 Characteristics for Defenders
Prospectors Entrepreneurial Engineering Administrative
1. Operate in a broad and continuously changing market. 2. Growth through product and market development, which creates changes in industry. 3. A wide range of environ-mental conditions are monitored.
1. Multiple and flexible technologies are used. 2. Low degree of routinisation and mechanisation
1. Extensive planning that is problem orientated and relying on actions taken. 2. Low degree of organisational formalisation. 3. Decentralised control 4. Performance measures that can be compared to competitors.
Figure 2.3 Characteristics for Prospectors
Analyzers Entrepreneurial Engineering Administrative
1. Operate in a both chang-ing and stable market. 2. Growth through market penetration and develop-ment of product-market. 3. Marketing is important and lower emphasis is put on R&D.
1. Both stable and flexible production depending on product or service.
1. Intensive marketing and production planning for present products. Extens-ive planning for new products. 2. Organisational structure has a “loose” matrix structure. 3. Moderatly centralised control 4. Productivity and effectiveness measures.
Figure 2.4 Characteristics for Analyzers
- 14 -

Business Strategy and Management Control Measures for Success! K. Marshall - M. Snygg
Theoretical Frame of Reference
2.2.2. Porter
The foundation of Porter’s strategy typology is the market and the five competitive forces that effect the competition in the industry. The five forces are:61
− Threat of new entrants − Bargaining power of buyers − Bargaining power of suppliers − Threat of substitute products or services − Rivalry among existing firms
Companies need to take these five forces into consideration when deciding on business strategy. The strategies Porter present are all considered to provide a good defence against the five forces. Porter describes competitive strategy as:62
”taking offensive or defensive actions to create a defendable position in an industry, to cope successfully with the five competitive forces and thereby yield a superior return on investments for the firm”
Porter 1980:34 From the five forces and the strategic scope Porter has developed four business strategies. In Porter 1980, three generic business strategies are described, where the fields 3a & 3b in figure 2.5 is seen as one strategy, only named Focus. Porter’s typology intends to describe companies’ strategies and not describing the companies. Porter has only presented strategies he has found to be successful. They are as follows:63
1. Overall Cost Leadership: The company offers product(s) or service(s) that are similar or almost similar to a competitor’s product(s) or service(s), but the product(s) or service(s) costs less. It is therefore cost effectiveness that is the main theme in this strategy; however other areas such as quality and service cannot be ignored. To achieve Overall Cost Leadership the company has to use its experience, use tight cost and overhead control, minimising costs in R&D, service, advertising, sales force, etcetera. Cost control is very important to achieve the aim of low costs. This strategy puts the company in a strong position against the five forces. It is worthwhile to mention that this strategy works best for companies’ with a large market share. Only one company can be cost leader, however other competing companies can have relative cost advantages.
2. Differentiation: This strategy is characterised by the company’s product(s) or
service(s), which are differentiated from the competitors’ product(s) or service(s) with specific preferences that are appreciated by the customers. By using a differentiation strategy companies try to create a brand image and thereby decreases the customers’ price sensitivity. Brand image can be created by supplying better technology, superior design, better service, and more features than competitors. Costs are not the primary strategic target, albeit costs are not to be neglected. Several companies in the same
61 Porter 1980 62 Porter 1980 63 Porter 1980
- 15 -

Business Strategy and Management Control Measures for Success! K. Marshall - M. Snygg
Theoretical Frame of Reference
branch can use this strategy as different dimensions can be differentiated in these companies, as a difference to the Overall Cost Leadership, where only one can be cost leader.
3a. Cost Focus: This strategy is similar to the Overall Cost Leadership strategy. The
difference here is that the company should focus on a specific segment on the market instead of the market as a whole. This narrow strategic target rests on the belief that the competitors that are operating over several segments or the whole market aren’t capable of focusing enough on keeping the costs down in one specific segment. The company focusing on one segment only should be able to serve its customers more efficiently or effectively.
3b. Differentiation Focus: This strategy is the same as the above mentioned, however the
belief is that the focus on only one market segment will lead to that differentiated products can be provided to fit the customers better than companies focusing on the whole market.
Strategic Advantage
Low Cost Position Uniqueness Percieved by the Customer
3b. DIFFERENTIATION FOCUS
3a. COST FOCUS
2. DIFFERENTIATION1. OVERALL COST LEADERSHIP
IndustrywideStrategic Target
Particularsegment only
Strategic AdvantageLow Cost Position Uniqueness Percieved by the Customer
3b. DIFFERENTIATION FOCUS
3a. COST FOCUS
2. DIFFERENTIATION1. OVERALL COST LEADERSHIP
IndustrywideStrategic Target
Particularsegment only
Figure 2.5 Porter’s Three Generic Strategies Porter is of the opinion that companies have to be consistent in their choice of business strategy, because they will otherwise be “stuck in the middle”. Companies that use a combination of strategies will be driven out of business by the competitors who only use one of the above-mentioned strategies.64
2.2.3. Choice of Strategy Typology
The two most common strategy typologies in strategic management are the two above mentioned, presented by Porter and Miles & Snow. One criticism towards these two typologies are that they were developed several years ago. According to some current researches these typologies haven’t got a realistic description of today’s situation. Some important components in many of companies’ business strategies today are time, quality and product adaptation. These components had no or little importance in typologies developed in the 1970’s and 1980’s. According to these scholars this criticism is mainly focused on Miles & Snow’s typology, because this typology is more complete, detailed and has little space to
64 Porter 1980
- 16 -
Business Strategy and Management Control Measures for Success! K. Marshall - M. Snygg
Theoretical Frame of Reference
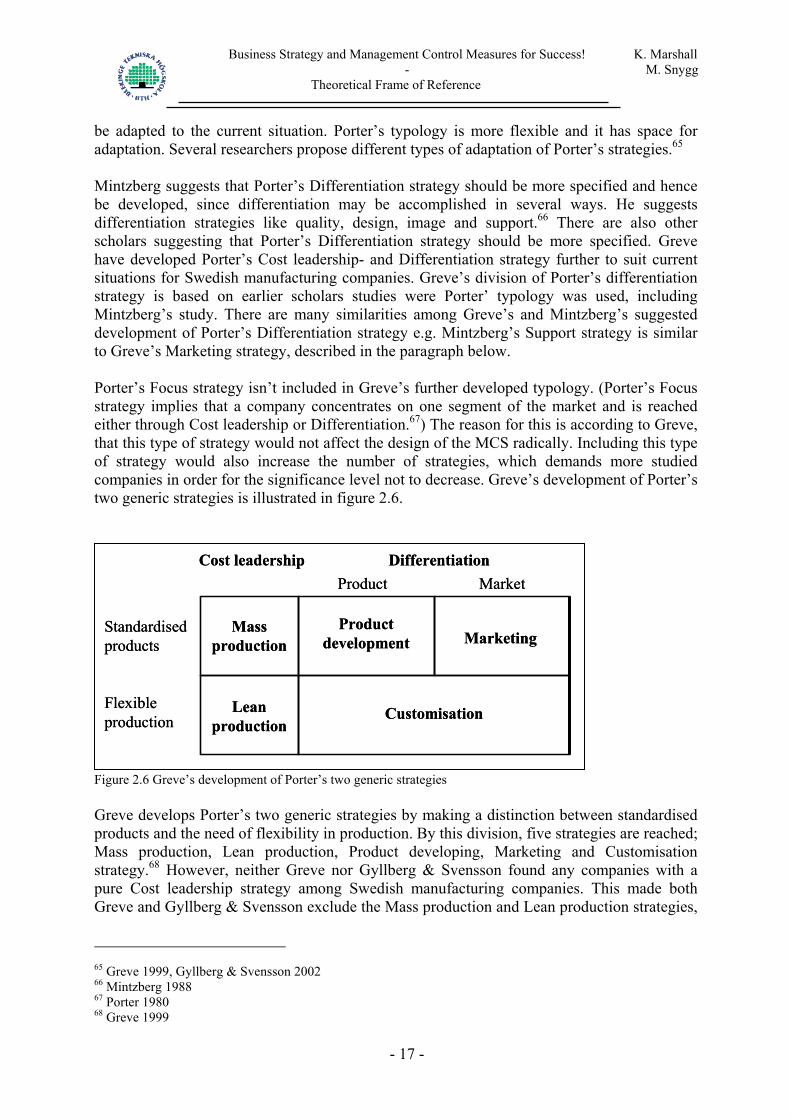
be adapted to the current situation. Porter’s typology is more flexible and it has space for adaptation. Several researchers propose different types of adaptation of Porter’s strategies.65 Mintzberg suggests that Porter’s Differentiation strategy should be more specified and hence be developed, since differentiation may be accomplished in several ways. He suggests differentiation strategies like quality, design, image and support.66 There are also other scholars suggesting that Porter’s Differentiation strategy should be more specified. Greve have developed Porter’s Cost leadership- and Differentiation strategy further to suit current situations for Swedish manufacturing companies. Greve’s division of Porter’s differentiation strategy is based on earlier scholars studies were Porter’ typology was used, including Mintzberg’s study. There are many similarities among Greve’s and Mintzberg’s suggested development of Porter’s Differentiation strategy e.g. Mintzberg’s Support strategy is similar to Greve’s Marketing strategy, described in the paragraph below. Porter’s Focus strategy isn’t included in Greve’s further developed typology. (Porter’s Focus strategy implies that a company concentrates on one segment of the market and is reached either through Cost leadership or Differentiation.67) The reason for this is according to Greve, that this type of strategy would not affect the design of the MCS radically. Including this type of strategy would also increase the number of strategies, which demands more studied companies in order for the significance level not to decrease. Greve’s development of Porter’s two generic strategies is illustrated in figure 2.6.
Productdevelopment Marketing
Customisation
Standardisedproducts
Flexibleproduction
Cost leadership DifferentiationProduct Market
Massproduction
Leanproduction
Productdevelopment Marketing
Customisation
Standardisedproducts
Flexibleproduction
Cost leadership DifferentiationProduct Market
Massproduction
Leanproduction
Figure 2.6 Greve’s development of Porter’s two generic strategies Greve develops Porter’s two generic strategies by making a distinction between standardised products and the need of flexibility in production. By this division, five strategies are reached; Mass production, Lean production, Product developing, Marketing and Customisation strategy.68 However, neither Greve nor Gyllberg & Svensson found any companies with a pure Cost leadership strategy among Swedish manufacturing companies. This made both Greve and Gyllberg & Svensson exclude the Mass production and Lean production strategies,
65 Greve 1999, Gyllberg & Svensson 2002 66 Mintzberg 1988 67 Porter 1980 68 Greve 1999
- 17 -

Business Strategy and Management Control Measures for Success! K. Marshall - M. Snygg
Theoretical Frame of Reference
only focusing on the three developed Differentiation strategies.69 We have hence decided to further develop Greve’s five Cost leadership and Differentiation strategies to one Cost leader strategy and three Differentiation Strategies, see figure 2.7.
Productdevelopment Marketing
Customisation
Costleader
Standardisedproducts
Flexibleproduction
Differentiation Cost leadershipProduct Market
Productdevelopment Marketing
Customisation
Costleader
Standardisedproducts
Flexibleproduction
Differentiation Cost leadershipProduct Market
Figure 2.7 Our further developed typology Since only one company can be a Cost leader in each branch, we may expect to find few companies with this strategy. We don’t believe we will find enough companies to classify them in accordance with Greve’s two Cost leadership strategies. If we would find only one company in each type of strategy, the significance level would be too low. We hence, view Cost leader as one strategy that isn’t divided between standardised products and the need of flexibility in production. Porter’s Differentiation strategy is divided into three Differentiation strategies just like Greve’s development of Porter’s Differentiation strategy. The characteristic of each strategy is described below: Cost leader strategy: Here the company’s products are similar to the competitor’s products. The Cost leader company however produces its products to a lower cost and sell them at a lower price. The products are often standard products. Other characteristics for this strategy are that the company invests little recourses in R&D, marketing and service.70 Product developing strategy: This strategy is characterised by the large investments of resources in R&D. Miles & Snow call this strategy Prospectors.71 Marketing strategy: The physical products sold by the company don’t differ in a decisive manner from the competitor’s products. By marketing actions (advertising, service etc.) the company aims to differentiate themselves from the competitors. This strategy shares some characteristics with Miles & Snow’s Defender and Analyzer Strategies.72 Customisation strategy: Companies with a Customisation strategy are very customer oriented. By a very flexible production they reach a high level of adaptation to each individual customer or a small group of customers.73 69 Greve 1999, Gyllberg & Svensson 2002 70 Porter 1980 71 Greve 1999 72 Greve 1999 73 Greve 1999
- 18 -

Business Strategy and Management Control Measures for Success! K. Marshall - M. Snygg
Theoretical Frame of Reference
Our further developed typology is, as described above, based on Porter’s typology, Mintzberg and Greve. Further on in the study we will call this strategy typology “our further developed typology based on Porter’s typology”. In order to classify the studied companies we have decided to use both Miles & Snow’s and our further developed typology based on Porter’s typology. Despite the criticism toward Miles & Snow’s typology we found it interesting to test this typology in the studied companies’ current situation. Our further developed typology based on Porter’s typology is used, since we believe this typology is better adapted to the studied companies and their current situation. If we succeed in classifying the companies according to both typologies a comparison between them is possible and interesting to conduct. If we only succeed in classifying the companies according to one of the two typologies, we will leave the typology which we couldn’t use. This study uses Miles & Snow’s typology and a further developed typology based on Porter’s typology to classify the studied companies’ business strategy.
2.3. Management Control
Management control exists in all companies and almost every employee is affected by its activities. The MCS can be more or less formal, e.g. in small companies the MCS is often informal, however when the company grows the MCS tends to become more formal.74 Management control frequently occurs in this thesis; we will therefore break it down into smaller components and give our definition of these terms.
2.3.1. Means of Control
To manage a company towards financial goals, the company needs tools to facilitate the control of the company, these tools are means of control. The term Means of Control is synonymous with the term Control Devices; both terms occur frequently in the business administration literature75. Several scholars have suggested different classifications of means of control. One classification divides means of control into formal (e.g. budgets, performance measurement systems) and less formal (e.g. company culture, leadership style) means of control76. We will here present Ewing & Samuelson’s means of control model. In this model the concept of control consists of four important means of control: Control system, Vision and Strategy, Leadership style and Culture, and Organisation structure and Reward systems. Besides these four main means of control there are other factors that effect the construction of the control. This is illustrated in figure 2.8. The control is also influenced by the market and the society in which the company operates; different owners can have different requirements; and control should ultimately lead to goal fulfilment for the business as such. The fact that information technology plays an increasingly important part for the orientation and shaping of the business is also noted. It is important to have a suitable balance between these means of
74 Anthony & Govindarajan 2001 75 E.g. Anthony & Govindrajan 2001 and Emmanuel et al. 1990 uses the term Control Devices, whilst Johansson & Samuelson 1998 uses the term Means of Control 76 Ax et al. 2002
- 19 -

Business Strategy and Management Control Measures for Success! K. Marshall - M. Snygg
Theoretical Frame of Reference
control, because the means of control should lead to goal fulfilment and reflect the demand on the market.77
Figure 2.8 Ewing & Samuelson’ means of control model Peter Senge is one of several researchers, who question the possibility of control78. We however believe that managers have the possibility to effect the organisations’ situation through conscious choices.
2.3.2. Management Control
Management Control is defined in several different ways in the literature. A common difference between the definitions of Management Control is that they have different starting points in what control means. The starting point in some definitions is that the control affects the individuals in the organisation, whilst other definitions assume that control is about control of activities in companies. Frenckner defines management control as planning and follow-up of the operational activities in relation to the financial goals. Frenckner further means that to accomplish these goals it is important to use means such as budgeting, accounting and calculating.79 This definition is a traditional way of looking at management control and focuses more on the operational effectiveness than on the influence on behavioural aspects. Anthony & Govindarajan mean 77 Ewing & Samuelson 1998, Johansson & Samuelson 1998 78 Rohlin et al. 1994 79 Frenckner 1983
- 20 -

Business Strategy and Management Control Measures for Success! K. Marshall - M. Snygg
Theoretical Frame of Reference
that management control rather concerns actions that aim at affecting the co-workers behaviour efficiently.80 The definition we have chosen is to some extent broader than the above mentioned, and focuses both on the operational effectiveness and the behaviour effecting aspects:
“Management control concerns activities that intentionally influence operational activities and the managers towards certain financial objectives.”
(Ax, Johansson & Kullvén 2002:65, translated by Marshall & Snygg) Thus, this choice of definition means that financial objectives can be expressed in financial and non-financial terms.81 This means that MCS encompass both financial and non-financial performance measures. The primary role of management control is to ensure that the chosen strategy is implemented. However, management control is only one of several tools for implementing strategies. Strategies may also e.g. be implemented through organisation structure and culture.82 Management control may also be seen as a helping device in developing new strategies. In companies, especially those that meet a rapid environmental change; management control information may also provide a base for considering new strategies. Simons calls this an interactive control that indicates a potential need for new strategy development.83 We consider the primary role of management control is strategy implementation. In an ongoing business the interactive control may be a part of the MCS, it is however not its primary role. According to us, the main objective of interactive control is to facilitate the creation of a learning organisation, which is important in a rapidly changing environment.
2.3.3. Tightness or Looseness
Different constructions of MCS will more or less affect the co-workers performance. The use of tight or loose MCS depends on various factors, among others: organisation’s culture, strategy, structure, co-workers and their educational background, environment. Merchant & Van der Stede have a negative view upon loose MCS. They consider that a loose MCS increases the risk for manipulative behaviour and wrongfully conducted actions84. We partly share their views, thus, we believe that a loose MCS can contain the necessary control needed to avoid these risks. Loose MCS may even increase the employees’ creativity; the feeling of responsibility and in this way increases the employees’ performance. Figure 2.9 illustrates different models that are more or less tightly controlled85.
80 Anthony & Govindarajan 2001 81 Ax et al. 2002 82 Anthony & Govindarajan 2001 83 Anthony & Govindarajan 2001, Simons 1990 84 Merchant & Van der Stede 2003 85 Arwidi & Samuelson 1991
- 21 -

Business Strategy and Management Control Measures for Success! K. Marshall - M. Snygg
Theoretical Frame of Reference
- 22 -
Loose Control Management By Objectives
Tight Control Direct Control
Figure 2.9 Tight and loose control This study focuses on Management By Objectives (MBO) because measures play a critical role in the study. As illustrated in figure 2.9 MBO is a form of loose control. Performance Measurement Systems is a system based on management by objectives and will be further discussed in the paragraph below.
2.3.4. Performance Measurement Systems (PMS)
The goal with Performance Measurement Systems (PMS) is strategy implementation. A PMS consists of a selected series of measures, which best reflects the companies’ strategies. These measures may be seen as critical success factors and if these measures are reached the strategy is implemented. A PMS can be seen as a mechanism for improving the likelihood of a successful implementation of a strategy in an organisation. Whilst a PMS reflects a company’s strategy there exists no series of measures that are optimal for each company. An example of a PMS is the Balanced Scorecard (BSC).86 PMS creates a broader understanding for how short-term activities fit with the long-term plans and how it contributes to goal fulfilment. The measures should communicate the critical factors for a company’s success and on which factors the company should focus. The measures will also signal deviations from plans and expectations.87 In figure 2.10, framework is presented for how a PMS should be designed. Critical success factors are defined from strategy and if these factors are measured and rewarded, co-workers will be motivated.88
What counts, get measured
What gets rewarded,really counts
What gets measured, gets done
What gets done, gets rewarded
STRATEGY
What counts, get measured
What gets rewarded,really counts
What gets measured, gets done
What gets done, gets rewarded
STRATEGY
What counts, get measured
What gets rewarded,really counts
What gets measured, gets done
What gets done, gets rewarded
STRATEGY
Figure 2.10 Framework for designing a PMS
86 Anthony & Govindarajan 2001, Ax et al. 2002 87 Ax et al. 2002 88 Anthony & Govindarajan 2001

Business Strategy and Management Control Measures for Success! K. Marshall - M. Snygg
Theoretical Frame of Reference
2.3.5. The Balanced Scorecard (BSC)
Kaplan and Norton developed the Balanced Scorecard in 1992. The BSC is a method for balancing strategic measures in an effort to achieve goal congruence, thus ensuring employees to act in the best interest of the organisation. Besides this function a BSC is a tool for improving communication, setting organisational objectives, focusing the organisation and providing feedback on strategy.89 According to Kaplan & Norton, business units should be assigned goals and then measured from four different perspectives: Financial – financial measures are used because they summarises consequences of actions already taken. These measures show how the consequences of actions taken, affect important financial measures like profit margins and return on assets. Customer – this perspective and its measures is used to summarise how the companies’ customers sees them. Examples of important measures may be customer satisfaction, on-time delivery, lost customers, new customers and percent of sale in different market areas or customer area. Internal business – each company have different processes in purpose of creating value for its customers. This perspective focus on what the company must excel in, to be able to create a higher value for its customers. Examples of measures in this category are employee retention, cycle time and efficiency. Innovation and learning – the fourth perspective in Kaplan & Norton’s BSC focuses on the infrastructure needed to reach long-term growth. These measures should reflect the future and hence be long-term focused. Product innovations, patent, staff training, knowledge may be examples of measures in the innovation and learning perspective. Based on the discussion concerning the similarities between MBO and BSC in the literature, it seems like the BSC is based on the same thoughts as the MBO. That is, in order to improve performance, organisations need a system that creates goal congruence. The best way to obtain this is through a process, which combines goal setting and review. There are scholars stating that the MBO is a failure in practice. This failure may partly be explained by two factors: the system has been implemented as an individual system instead of an overall goal congruence system as intended; and a problem adapting the model from theoretical approach to practice. Due to these similarities these scholars have investigated if the BSC will work in practise or if it will meet the same destiny as MBO. They conclude that the BSC should function if the organisations manage to keep the system up to date with the rapid external changes.90 In Swedish companies that have implemented the BSC, researchers have found some issues related to the control system: establishing measures critical for the companies’ success; difficulty in finding measures that can be measured; getting managers at all levels to use the measures critical for success91. Nørreklit also recognises these problems and also mentions that the BSC isn’t a valid strategic management tool, because the BSC doesn’t
89 Kaplan & Norton 1992, 1996, Anthony & Govindarajan 2001 90 Dinesh & Palmer 1998 91 Samuelson 2001
- 23 -

Business Strategy and Management Control Measures for Success! K. Marshall - M. Snygg
Theoretical Frame of Reference
ensure organisational and environmental rooting92. As described the BSC isn’t the perfect PMS and a PMS isn’t the optimal system for management control in every situation. Besides Kaplan & Norton’s BSC there are several other PMS based on the same thoughts as the BSC (tableau de bord, performance pyramid etc.). We have chosen to structure the measures used in the study after the model used in the BSC. This choice was made because we believe that the BSC is the most commonly used PMS and it most lightly includes all management control measures that may occur in medium sized manufacturing companies. The BSC is probably the most recognised PMS in the business administration literature, thus we believe the interviews are facilitated if a model that the respondents recognise, is used.
2.3.6. Management Control Measures
Each measure in the BSC should address an aspect of a company’s strategy.93 Therefore we may expect to find different measures depending on which business strategy the company uses. Much of the criticism toward the traditional management accounting states that the management control information focuses too much on monetary measures and should focus more on operational measures for the internal control94. Recent studies acknowledge that management accounting has developed to not exclusively include monetary measures, thus including non-financial measures, i.e. more interest focused on product quality, processing times and many other aspects. One reason to this recent development is that companies need to be coherent to changes in the marketplace. If the company fails to be coherent, the company’s competitiveness will decline.95 Non-financial measures have therefore become more commonly used. The MCM we will look closer at in this study have been summarised in the Balanced Scorecard figure 2.11 below. The majority of these measures have been captured from Gyllberg & Svensson’s study. Gyllberg & Svensson have used measures that Kaplan & Norton have used in their studies, which indicated a high degree of validity in usage of these measures96. Their model has been complemented with financial measures and a couple of extra measures in the customer perspective, which has been used in other literature and studies97. It is important to note that the BSC perspectives should create an overall view of the company’s activities and that none of the perspectives is more important than another.
92 Nørreklit 2000 93 Anthony & Govindarajan 2001 94 Johnson & Kaplan 1987 95 Johansson & Samuelson 1998 96 Gyllberg & Svensson 2002 97 Kullvén 2001, Ewing & Samuelson 1998, Burlid & Rezai 2003, Perera & Harrison 1997
- 24 -

Business Strategy and Management Control Measures for Success! K. Marshall - M. Snygg
Theoretical Frame of Reference
- 25 -
STRATEGY
Financial
ProfitabilityYield measuresNet sales
Cash flowLiquiditySolvencyTotal assets
Customer
Customer satisfactionLost customersNew customers
Market share
Profitability per customerInnovation & Learning
Product development
Staff turnoverStaff trainingStaff knowledgeStaff abilitiesJob satisfaction
Internal Business
Effectiveness
Customer requestsPrice sensitivity
Capacity utilisationAbility to adapt productEnvironment related
measures
Product quality Delivery qualityScrapNumber of complaints
Lead timeChangeover timeStorage costsStandstill frequencyBudget differencesCalculation differences
Figure 2.11 Our choice of measures, illustrated in a Balanced Scorecard.
Business Strategy and Management Control Measures for Success! K. Marshall - M. Snygg Methodology
3. Methodology The methodology chapter illustrates both our general approach and our practical approach.
3.1. General Approach
In order to be able to answer the study’s two questions we need to collect data from several companies. The questions are framed in a manner that can’t be answered by only studying one or a few companies. We are interested in studying the use of MCM in companies with different employed business strategies; hence we need data from several companies. In creating the needed data we will use a quantitative method. The quantitative techniques have emerged from the positivistic idealism of objectiveness, where the researchers study the “phenomenon” from a neutral position98. The quantitative technique gives us the opportunity to make statistical analysis, more specifically factor- and cluster analysis. Due to limited time, financial support and geographical barriers we have chosen to collect relevant data by using a survey. The respondents have been given the choice of either answering the survey through a telephone interview or by filling in a survey sent by e-mail. The framed questions require two different types of survey questions: one set of questions are of a more descriptive type, where we aim at describing the two studied phenomenon and the relationship between them. The second set of questions aim at explaining a part of the described phenomenon.99
3.2. Practical Approach
The study began with literature studies within the subjects’ strategy and management control. This thesis’s subject has grown forward during the initial literature study, where we found that few studies concerning MCS support to strategies had been conducted. We also found that all of the conducted studies had focused on the strategies and MCS at one point of time100, meanwhile we decided to measure at two points of time. From this we chose relevant companies and respondents to study and interview, and then developed the survey. After this we contacted companies and collected empirical data for analysis. In the following paragraphs these choices will be discussed.
3.2.1. Selecting the Companies’ Features
The companies focused on in this study are manufacturing companies. Gyllberg & Svensson argues that manufacturing companies have the most complete MCS since companies’ in other branches have used models, tools and concepts originally created in manufacturing companies. The starting point for the creation and development of the models and concepts has been and is manufacturing companies.101 Another reason for focusing on manufacturing companies is to avoid a too heterogeneous population. By studying different branches within
98 Darmer & Freytag 1995 99 Lundahl & Skärvad 1999 100 Lind 1996 101 Gyllberg & Svensson 2002
- 26 -
Business Strategy and Management Control Measures for Success! K. Marshall - M. Snygg Methodology
the manufacturing industry we will despite the demarcation reach a certain generality in the result of the study. The majority of the conducted research regarding MCS has been conducted in large companies. The reason to why many researchers have chosen not to conduct research in small companies may be answered by the quotation below:
“… small enterprises in the eyes of the academic community are analogous to plain girls and acne-ridden boys at a high school dance – they are present in large numbers, but usually are unnoticed. Small firms move through their typically brief life spans neglected, untouched and unassisted by the sophisticated hand of scholarship.”
(McGuire, 1976:115 in Bergström & Lumsden 1993) Swedish medium sized manufacturing companies have been considered forgotten in research, according to several authors. They state that there are comparatively many employed people in small and large companies compared to medium sized companies. Other state that media mainly focuses on small, recently started companies and larger companies.102 We therefore find it interesting to study Swedish medium sized manufacturing companies. It is reasonable to believe that small companies don’t have formalised and structured MCS e.g. budget and report systems might not exist or are not used to the same extent as in larger companies. Another reason to the focus on medium sized companies is that the Managing director, Financial manager and other members in the top-management have a general insight in the whole organisation and its operations. We believe it can be difficult to find people with this covering knowledge of the company in larger organisations. What is a medium sized company? Depending on the studied branch different size classifications should be done. The classifications may vary from country to country e.g. in Anglo-Saxon countries companies with less than 500 employees are often considered to be small companies, meanwhile in Nordic countries a small company often has less than 200 employees103. The EU-commission recommends that companies should be classified with the following criteria104:
− Number of employees − Turn over − Balance sheet total − Ownership
To facilitate the statistical compilation in the study we will only use the number of employees to classify medium sized companies. The criteria turn over and balanced sheet are based on monetary measures. These criteria may be negatively affected by e.g. price changes and inflation.105 Our opinion is that the ownership criterion isn’t relevant in our study. Since we are studying medium sized companies it is possible that some of these companies are subsidiaries to a parent company. Concentrating on ownership would then perhaps be misleading. Classifying medium sized companies according to the number of employees may
102 Vesterlund et al. 1998 103 Ghauri & Grønhaug 2002 104 Nutek 1996 105 Bergström & Lumsden 1993
- 27 -

Business Strategy and Management Control Measures for Success! K. Marshall - M. Snygg Methodology
have some difficulties, how to treat part-time employees for example. We haven’t paid attention to part-time employment, we view every employed individual as one employed. In statistical context as well in studies the following categorisation of companies on the bases of number of employees has been done106:
Micro companies: 0-9 employees Small companies: 0-19, 20-99 employees Medium sized companies: 100-199, 200-499 employees Large companies: 500- employees
Medium sized companies can be divided into two groups 100-199 (small medium sized companies) and 200-499 (larger medium sized companies); we however will only focus on medium sized companies as one group.
The study focuses on Swedish medium sized manufacturing companies (within SNI- groups 26-36) with 100-499 employees.
3.2.1.1. Choice of Respondents
This study focuses on the relationship between management control measures (MCM) and business strategies in companies from a management perspective. As discussed in paragraph 1.4 Perspective, we refer management to managers in leading positions at business level. We interviewed either the; Financial Manager, Chief Accountant or the Controller in the studied companies, since they often are responsible for the design of management control systems. It could be discussed whether these managers are the best respondents to answer the questions concerning the companies strategic positions. However we made the judgement that we couldn’t interview two respondents in each company. We assumed that the Financial Manager, Chief Accountant or Controller had a good general view over the business strategies in the companies in which they work. We have also noted that respondents in similar studies are the Financial Managers or Chief Accountants107.
Respondents with a good understanding for the management control system and of the entire organisation have been selected i.e. either the Financial Manager, Chief Accountant or the Controller
3.2.2. Construction of Survey
The survey presented to the respondents contained questions concerning three essential areas, Business Strategy; The Use of Management Control Measures; and Effectiveness. The survey contained structured and standardised questions, which enabled us to conduct statistical analysis in a structured manor. By using a structured survey, bias could be avoided, since no positions needed to be taken. The survey also contained some general questions about the
106 Nutek 1994, Vesterlund et al. 1998, Gyllberg & Svensson 2002 107 Gyllberg & Svensson 2002
- 28 -

Business Strategy and Management Control Measures for Success! K. Marshall - M. Snygg Methodology
companies’ features. It is presented in Appendix 1 and 2. The survey which the respondents answered was written in Swedish and then translated into English.
3.2.2.1. Developing Business Strategy Questions
Snow & Hambrick studies have resulted in four different approaches of identifying and measuring business strategies. The four approaches are: investigator inference, self-typing, external assessment and objective indicators. Each method has its advantages and disadvantages. We have used the self-typing approach in this study. The self-typing method allows the organisation’s managers to characterise the organisations strategy. It implies that the respondent states the strategy by choosing between different answer alternatives, designed in advance by the researchers.108 We considered two alternative ways of developing these answer alternatives: The first alternative is to present a short written description of different strategies, from these strategies the respondent is asked to classify which one of the strategies that best describes their organisation. The second alternative implies that the respondent states, with help of estimation scales, the organisation’s strategic position in relation to competitor’s position. The stated scales are used to make a gathering index, which measures the organisation’s strategy. One disadvantage with the first alternative is that the descriptions of the strategies may be too short, e.g. in our study it would mean we would have to describe three different strategies in one question and still keep the answer alternatives at a level that grasps the situation. The second alternative is used in several studies109. In these studies there are two alternatives to measuring strategies. Either one can create a generic index, which summarises all strategy variables or one can create an index for each strategy included in the typology. Because of the potential difficulty in presenting a complete description of each strategy we decided to use the second alternative. In our questionnaire we used a set of measure variables to be able to decide which strategy the different organisations belong to. The strategy variables used, makes it possible to classify companies’ business strategy after both Porter’s typology and Miles & Snow’s typology. To capture possible changes in strategy over the past years, we added questions to the survey related to the strategy two to three years ago. To classify the companies according to Porter’s typology, Govindarajan recommends six strategy variables, namely Sales price; Percentage of turnover invested in marketing; Percentage of turnover invested in research and development; Product quality; Specific product features; and Brand image. We have used these variables as a starting point when we developed the required strategy variables. We however excluded the variable Brand image from the recommended variables, since recent studies have not found this variable useful.110 The other variables needed to classify the companies according to our further developed typology, have been selected on the basis on other previous research111. On top of these eight strategy variables, there are an additional four variables that are needed to classify the companies after the three strategies suggested by Miles & Snow. These variables characterises
108 Snow & Hambrick 1980 109 Govindarajan 1988, Gyllberg & Svensson 2002, Greve 1999 110 Govindarajan 1988, Gyllberg & Svensson 2002, Greve 1999 111 Greve 1999, Gyllberg & Svensson 2002
- 29 -
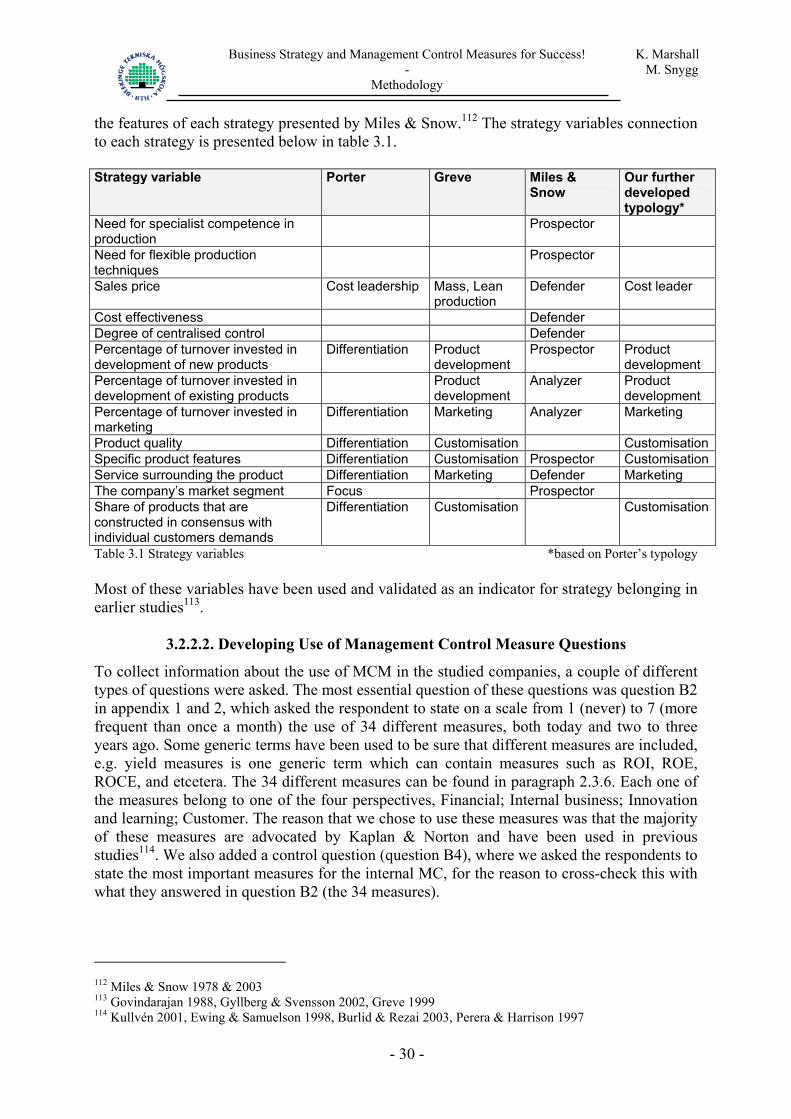
Business Strategy and Management Control Measures for Success! K. Marshall - M. Snygg Methodology
the features of each strategy presented by Miles & Snow.112 The strategy variables connection to each strategy is presented below in table 3.1. Strategy variable Porter Greve Miles &
Snow Our further developed typology*
Need for specialist competence in production
Prospector
Need for flexible production techniques
Prospector
Sales price Cost leadership Mass, Lean production
Defender Cost leader
Cost effectiveness Defender Degree of centralised control Defender Percentage of turnover invested in development of new products
Differentiation Product development
Prospector Product development
Percentage of turnover invested in development of existing products
Product development
Analyzer Product development
Percentage of turnover invested in marketing
Differentiation Marketing Analyzer Marketing
Product quality Differentiation Customisation CustomisationSpecific product features Differentiation Customisation Prospector CustomisationService surrounding the product Differentiation Marketing Defender Marketing The company’s market segment Focus Prospector Share of products that are constructed in consensus with individual customers demands
Differentiation Customisation Customisation
Table 3.1 Strategy variables *based on Porter’s typology Most of these variables have been used and validated as an indicator for strategy belonging in earlier studies113.
3.2.2.2. Developing Use of Management Control Measure Questions
To collect information about the use of MCM in the studied companies, a couple of different types of questions were asked. The most essential question of these questions was question B2 in appendix 1 and 2, which asked the respondent to state on a scale from 1 (never) to 7 (more frequent than once a month) the use of 34 different measures, both today and two to three years ago. Some generic terms have been used to be sure that different measures are included, e.g. yield measures is one generic term which can contain measures such as ROI, ROE, ROCE, and etcetera. The 34 different measures can be found in paragraph 2.3.6. Each one of the measures belong to one of the four perspectives, Financial; Internal business; Innovation and learning; Customer. The reason that we chose to use these measures was that the majority of these measures are advocated by Kaplan & Norton and have been used in previous studies114. We also added a control question (question B4), where we asked the respondents to state the most important measures for the internal MC, for the reason to cross-check this with what they answered in question B2 (the 34 measures).
112 Miles & Snow 1978 & 2003 113 Govindarajan 1988, Gyllberg & Svensson 2002, Greve 1999 114 Kullvén 2001, Ewing & Samuelson 1998, Burlid & Rezai 2003, Perera & Harrison 1997
- 30 -
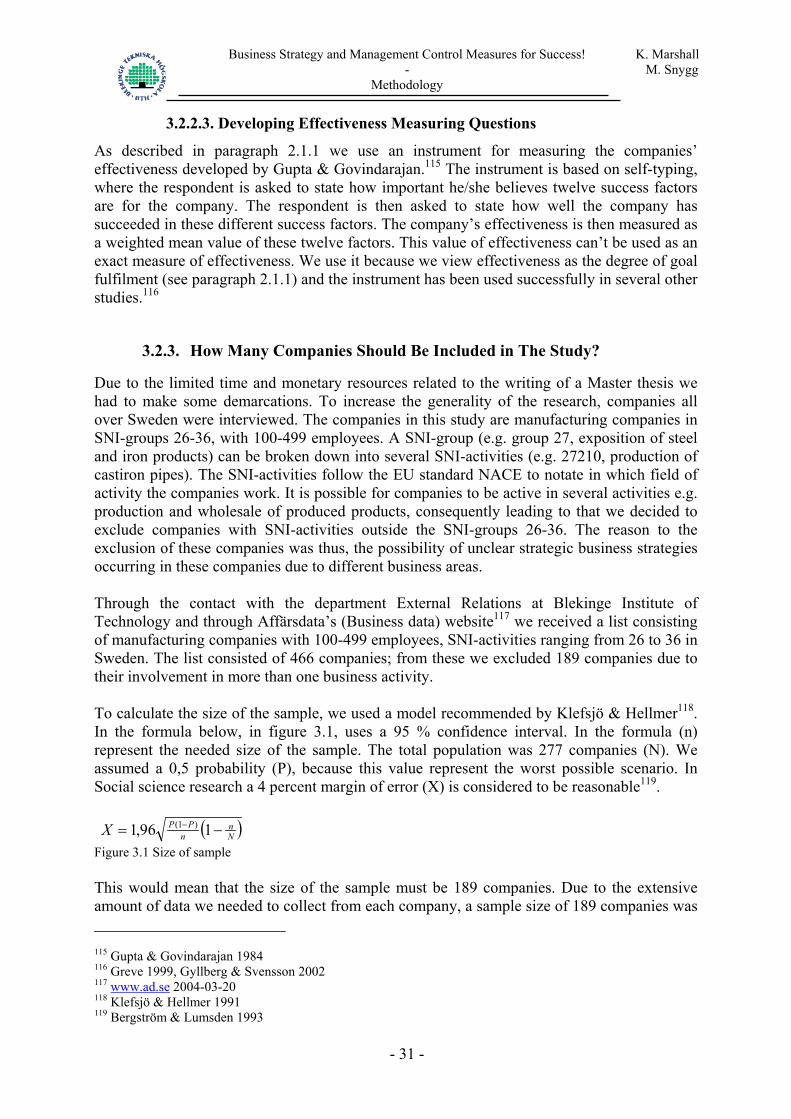
Business Strategy and Management Control Measures for Success! K. Marshall - M. Snygg Methodology
3.2.2.3. Developing Effectiveness Measuring Questions
As described in paragraph 2.1.1 we use an instrument for measuring the companies’ effectiveness developed by Gupta & Govindarajan.115 The instrument is based on self-typing, where the respondent is asked to state how important he/she believes twelve success factors are for the company. The respondent is then asked to state how well the company has succeeded in these different success factors. The company’s effectiveness is then measured as a weighted mean value of these twelve factors. This value of effectiveness can’t be used as an exact measure of effectiveness. We use it because we view effectiveness as the degree of goal fulfilment (see paragraph 2.1.1) and the instrument has been used successfully in several other studies.116
3.2.3. How Many Companies Should Be Included in The Study?
Due to the limited time and monetary resources related to the writing of a Master thesis we had to make some demarcations. To increase the generality of the research, companies all over Sweden were interviewed. The companies in this study are manufacturing companies in SNI-groups 26-36, with 100-499 employees. A SNI-group (e.g. group 27, exposition of steel and iron products) can be broken down into several SNI-activities (e.g. 27210, production of castiron pipes). The SNI-activities follow the EU standard NACE to notate in which field of activity the companies work. It is possible for companies to be active in several activities e.g. production and wholesale of produced products, consequently leading to that we decided to exclude companies with SNI-activities outside the SNI-groups 26-36. The reason to the exclusion of these companies was thus, the possibility of unclear strategic business strategies occurring in these companies due to different business areas. Through the contact with the department External Relations at Blekinge Institute of Technology and through Affärsdata’s (Business data) website117 we received a list consisting of manufacturing companies with 100-499 employees, SNI-activities ranging from 26 to 36 in Sweden. The list consisted of 466 companies; from these we excluded 189 companies due to their involvement in more than one business activity. To calculate the size of the sample, we used a model recommended by Klefsjö & Hellmer118. In the formula below, in figure 3.1, uses a 95 % confidence interval. In the formula (n) represent the needed size of the sample. The total population was 277 companies (N). We assumed a 0,5 probability (P), because this value represent the worst possible scenario. In Social science research a 4 percent margin of error (X) is considered to be reasonable119. ( )N
nn
PPX −= − 196,1 )1( Figure 3.1 Size of sample This would mean that the size of the sample must be 189 companies. Due to the extensive amount of data we needed to collect from each company, a sample size of 189 companies was 115 Gupta & Govindarajan 1984 116 Greve 1999, Gyllberg & Svensson 2002 117 www.ad.se 2004-03-20 118 Klefsjö & Hellmer 1991 119 Bergström & Lumsden 1993
- 31 -
Business Strategy and Management Control Measures for Success! K. Marshall - M. Snygg Methodology
unreasonable considering the limited time and resources. We therefore decided to increase the margin of error (X) to just above 10 percent. With this margin of error, we needed to have a sample of 65 companies. We assumed this sample size was reasonable, it wasn’t so small that the framed questions couldn’t be answered and it wasn’t larger than we could handle, considering time and resources. This however means that this studies result is not general for all Swedish medium sized manufacturing companies in the SNI-groups 26-36. This was one consideration we made. The conclusions are however general for the studied population. We consider the population is quite large.
3.2.4. Contacting the Companies
We contacted all respondents at the chosen companies by telephone. The respondents received the following information and were asked if they wanted to participate in the study:
− Short presentation of the study − Answering the survey takes about 10-15 minutes, either by telephone interview or
by filling in a survey sent by e-mail − The respondent’s name and company name will not be published − The result of this study will hopefully lead to that managers can avoid misfits
between business strategy and MC measures in the future One of the reasons to why we promised that all respondents would be anonymous was that anonymity often leads to more honest answers that reflect the real situation120. The survey results have therefore been presented in a manner, which doesn’t make it possible to trace which companies have participated and what the respondents have stated. After the interview or when we received the answered survey we sent a thank you letter to the respondents, thanking them for their participation and informing them that we may need to ask some complementing questions.
3.2.5. Collecting Empirical Data
As mentioned above, the needed data were gathered either through telephone interviews with the respondents or by letting the respondents answer a survey sent by e-mail. The empirical data in this study is based on primary data, since all data is collected through the survey121. Respondents answering the survey through a telephone interview were sent the survey before the interview started. This made the interview easier and faster. To increase the validity of the survey, we have tested the survey on three people with a business administration background, before we contacted the companies. The testing of the survey pointed out some small issues, which we improved before we approached the companies. There were several reasons to why we decided to let the respondents chose to answer the survey through a telephone interview or letting the respondents fill in a survey sent by e-mail. An optimal approach would have been to conduct a longitudinal study. This approach would however not fit in a Master thesis, due to the time, geographic and monetary related obstacles.
120 Gupta & Govindarajan 1984 121 Ghauri & Grønhaug 2002
- 32 -

Business Strategy and Management Control Measures for Success! K. Marshall - M. Snygg Methodology
We therefore had to exclude the possibility to make physical observations in these companies and instead chose the telephone and internet approach. Telephone interviews enabled the respondent to ask questions if there was any information that was unclear. The respondents that filled in the survey sent to them by e-mail were given our telephone numbers and e-mail addresses, so any eventual unclear issues could be explained. The possibility to use control questions is an advantage that speaks for the use of oral interview techniques.122 This enabled us to ask some questions that the interviewee wasn’t aware of, allowing us to make sure that the respondent didn’t give us the information that he/she thought we wanted. The survey sent to the respondents by e-mail contained the same control questions as were used in the telephone interviews. These control questions seems to have fulfilled its purposes even though the respondents could read them i.e. it doesn’t seem like the respondents gave us the information that he/she thought we wanted.
3.2.6. Compiling the Data
Each survey contained 145 different variables which we entered into SPSS. Since we interviewed 48 companies, we reached almost 7000 cells of data. SPSS is a statistical software that often is used in business administration studies, because it is easy to enter data into the spread sheet and has some advanced features that enables the researcher to make various statistical analysis. Excel was also used, however not in analysis purposes, rather for creating different indexes.
3.2.7. Analysis Methods
In order to classify three different MCM groups and the strategy groups, we used two statistical analysis methods, cluster analysis and factor analysis. A classification may be done in a deductive or in an inductive manner. In our study the strategies have been classified by a typology. This is made in a deductive manner, i.e. driven by theory. The MCM are classified by taxonomy. This is made in an inductive manner, i.e. driven by data.123
3.2.7.1. Classifying Business Strategy
To classify the business strategies, the respondent’s answers on the 13 different strategy variables, described in paragraph 3.2.2.1, were used. Similar instruments for classifying business strategy have been used in previous studies124. Since we used this measure instrument in a somewhat different way, we were interested in validating this instrument. With factor analysis and cluster analysis we examined the validity of the variables and then used the valid variables to classify the business strategies. (See paragraphs 3.3, 3.4, and chapter 5 for further descriptions.)
3.2.7.2. Classifying MCM
The basis of dividing MCM into different categories originates from the categorisation of companies’ use of financial and non-financial measures. Based on the measures included in each of the BSC’s four perspectives (paragraph 2.3.6), we created four indexes for the use of 122 Ghauri & Grønhaug 2002 123 Greve 1999 124 Govindarajan 1988, Gyllberg & Svensson 2002, Greve 1999
- 33 -

Business Strategy and Management Control Measures for Success! K. Marshall - M. Snygg Methodology
measures in each respective perspective. Since the number of MCM included in each perspective vary, indexes needed to be created to enable comparisons between them. To create categories for the companies’ use of MCM, we have created taxonomies by using cluster analysis on the indexes. The objective of cluster analysis is to discover natural groupings of the units in a sample.125 This analysis implies that the distance between the values of the variables within a cluster is as small as possible at the same time as the distance to other variable values in other clusters is as large as possible. This method has been used in other studies where the researchers have made categories of MCS. In these situations this method is considered to be a good method for analysing the gathered data.126
3.2.7.3. Cluster Analysis
Cluster analysis was used to identify relatively homogeneous variables. This method uses an algorithm that from the beginning places each variable in separate clusters and then combines the clusters until there is only one left.127 Cluster analysis was used in both the creation of clusters of MCM and classifying the companies according to Miles & Snow’s typology and our further developed typology based on Porter’s typology. In this study we have used the Hierarchical cluster analysis technique, since this is the most suitable technique to use in studies with small populations (less than 200 observations)128. In chapter 5.1, a more precise description of the cluster analysis can be found as well as a description of the approach we have used.
3.2.7.4. Factor Analysis
We used a factor analysis to validate some of the strategy variables and to find out which strategy variables that belonged to each strategy. Factor analysis aims at identifying the smallest possible number of groups that can explain the correlation between the different variables. Data reduction is one common purpose of the use of factor analysis, because one tries to identify a small number of factors that can explain the most of the observed variances.129 When selecting components essential for a successful factor analysis, numerous statistical functions and methods can be used, such as Scree plot; Kaiser-Meyer-Olkin-test, Bartlett’s test of sphericity; Variances; and Rotation methods. These functions and methods are closer described in chapter 5.2. Our approach in the use of factor analysis is also described in the same paragraph.
3.2.7.5. Analysis Model
To be able to arrange and analyse the empirical material we have chosen to develop an analysis model. The purpose of the analysis model is to illustrate how we gathered and analysed the data. The model is presented in figure 3.2 below.
125 Ghauri & Grønhaug 2002 126 Gyllberg & Svensson 2002, Greve 1999 127 SPSS 11.0 tutorial 128 Aronsson 1999 129 SPSS 11.0 tutorial
- 34 -

Business Strategy and Management Control Measures for Success! K. Marshall - M. Snygg Methodology
- 35 -
ManagementControl MeasureGroups
e1
e2
en
Business strategiess1 s2 s3 sn
High effective
Low effective
High effective
Low effective
High effective
Low effective
High effective
Low effective
High effective
Low effective
High effective
Low effective
High effective
Low effective
High effective
Low effective
High effective
Low effective
High effective
Low effective
High effective
Low effective
High effective
Low effective
Figure 3.2 Analysis model To answer the question whether companies choose MCM that support their employed business strategy, we needed to investigate if companies chose the type of MCM that contributed to the highest share of high effective companies within each respective business strategy. The three different types of data that are needed are illustrated in figure 3.2. Firstly we need data concerning the companies’ strategic position (s1 to sn in figure 3.2). The classifications of Miles & Snow’s typology and a further developed typology based on Porter’s typology were used. Secondly we used the classifications of the use of MCM (e1 to en in figure 3.2). From this information we were able to answer the question: which types of measures are used in the different strategies. Thirdly we divided the companies into two categories, high effective and low effective. To do this we used the values from the effectiveness index and compared it to a predetermined value, companies above this value were considered high effective and vice versa. From this information we were able to see tendencies to how well the different types of used MCM supported the companies’ business strategy. If the majority of companies within each respective business strategy chose the type of MCM that contributed to the highest share of high effective companies, we drew the conclusion that there was some sort of fit between MCM and business strategy. For those companies that used MCM that contribute to lower effectiveness for the company within each respective business strategy we drew the conclusion that there existed some sort of misfit between MCM and business strategy. To answer our second framed question: Can misfits between the companies’ management control measures and companies’ business strategy be explained by changes in business strategy and management control measures over the past two to three years? we will start from those companies that were evaluated to be misfits in our first question. In the questionnaire the respondents were asked to state the organisation’s strategy and their use of management control measures both today and for two to three years ago. We have therefore compared the data from two points of times to investigate whether there have been adjustments in strategy or the use of management control measures during the past two to three years. A problem with this method is that the data received from respondents concerning business strategy and use of MCM two to three years ago may be reflections that are rationalised of how the respondent interpreted the situation then. Our opinion is however that

Business Strategy and Management Control Measures for Success! K. Marshall - M. Snygg Methodology
two to three years is a reasonable time and that changes during this time still exists in peoples’ minds. If there has been any kind of adjustment, we will categorise the companies again to investigate if they now belong to another business strategy or type of MCM and if there still exists some sort of misfit.
3.3. Reliability
Reliability is determined of how the measurement is performed and how accurate we are in arranging the data.130 The purpose with the questionnaire was to gather facts concerning the companies’ business strategy, use of financial and non-financial measures and effectiveness. The respondents’ knowledge concerning these areas is therefore very important for the answers reliability. As mentioned earlier in paragraph 3.2.1.1 we believe that the Financial Managers in the studied companies are the best suited respondents. Some of the questions could however lie outside of the respondents’ knowledge area. This lack of knowledge could have made the respondent provide an answer, which wasn’t correct. It is also possible that some of the concepts used in the questionnaire wasn’t familiar for the respondents. This could also lead to that the respondent is providing an answer that isn’t correct. To avoid these biases we presented the subject areas the survey involved, when we contacted the respondents. The respondents then had the opportunity to decline answering the survey if they didn’t consider that they had the required knowledge. This made us sure of that the respondent could answer our questions. With the help of telephone interviews the opportunity to explain concepts that the respondent wasn’t familiar with was given. In interviews with respondents it is possible that the respondents state an alternative answer that is more desirable, instead of stating the truth. To avoid this we aimed to formulate questions that don’t give the expression of any values. Reliability is also determined of how accurate we put together, arrange and code the data. To avoid mistakes in putting together, arranging and coding the data, we did most of the work together. We also let our supervisors study the arranged data to avoid these mistakes.
3.4. Validity
Validity is depending on how well our instrument for measurement (questionnaire) is measuring what we intend to measure,131 i.e. business strategy, use of financial and non-financial measures and effectiveness. Most of the instruments we have used to measure business strategy, use of financial and non-financial measures and effectiveness are developed by other scholars and used in several other studies. The instruments are therefore validated in earlier studies. Whilst we have used these measuring instruments in a somewhat different way, we are interested in validating these instruments. The statistical instruments we have used offer a possibility to validate some of the variables. We have therefore chosen to illustrate and validate the variables in each respective paragraph where the variables and measurement instruments are used.
130 Holme & Solvang 1997 131 Holme & Solvang 1997
- 36 -

Business Strategy and Management Control Measures for Success! K. Marshall - M. Snygg Presentation of Survey Results
4. Presentation of Survey Results Chapter four contain a presentation of the survey result. To facilitate the reading of this chapter we only present those results that we found interesting and essential for the study. The complete result of the study is presented in appendix 3.
4.1. Drop of Analysis
In the collection process of empirical data, we needed to send our survey to 65 companies. Totally we contacted 77 companies. From these companies, 12 were dropped, due to two reasons. The first reason was the lack of time because of work load and closing of the books. The second reason was that they were already involved in other studies conducted at other universities. To the respondents in the 65 companies, we sent our survey by e-mail. One week after we had contacted the respondents and sent the survey, we sent an e-mail to remind the people that had not answered the survey. The reminder had a good effect on the respondents and many answered the survey. 4 respondents informed us that they did not have time to answer the survey. Respondents that still had not answered the survey after two weeks were contacted by telephone and asked either to answer the survey over telephone or e-mail the answered survey to us immediately. After almost four weeks of data collection we had received 49 answers out of the 65 surveys we had sent to the respondents. One of the answered surveys was not possible to use, because sufficient information was not provided. Hence we had an answer frequency of 75 %, which is very good.
4.2. The Studied Companies
4.2.1. Branch, Number of Employees and Owner Structure
Every company in the study is a manufacturing company, see paragraph 3.2.1 for a discussion concerning this choice. The total population consisted of 466 companies. From this group we excluded 189 companies due to their involvement in more than one SNI-activity. The remaining 277 companies were divided between the different branches as seen in table 4.1.
SNI-group Number of companies in each respective SNI-group
Number of companies in our study
26. Soil and stone goods industry 13 3 27. Steel and metal industry 30 4 28. Metal goods industry except machines and apparatus
60 10
29. Machine industry that isn’t included in other SNI-groups
71 13
30. Office machinery and computer industry
3 1
31. Other electronic industry 15 3 32. Telecom product industry 16 2 33. Industry for precision-, medical- and optical instruments
17 3
34. Motor vehicle and trailer industry 24 4 35. Other means of transport industry 7 1 36. Furniture industry; other manufacturing industry
21 4
Sum 277 48 Table 4.1 Division of companies between the different branches
- 37 -

Business Strategy and Management Control Measures for Success! K. Marshall - M. Snygg Presentation of Survey Results
In the right column in table 4.1 we also present the number of companies from each respective SNI-group that are included in the study. The numbers of companies were calculated through multiplication of the number of companies in each respective SNI-group with the total desired number of companies to be included in the study. Then dividing this sum with the total population after exclusions of companies with several SNI-activities. The purpose was to get an even spread over the eleven SNI-groups. As seen in table 4.1 the companies included in our study are very well proportioned in relation to the total populations spread across the groups. At a matter of fact, all groups except group 29 (with one more company than desired) and group 32 (with one company less than desired) are proportionally represented in our study. As mentioned in paragraph 3.2.1 the study is focusing on medium sized companies, i.e. companies with 100 – 499 employees. The studied companies are divided in the following manner when it concerns the number of employees, table 4.2.
Number of employees Number of companies 100-199 29 (60,4%) 200-299 9 (18,8%) 300-399 7 (14,6%) 400-499 3 (6,2%)
Table 4.2 Division of employees among the companies As illustrated in table 4.2 the majority of the studied companies are classified as smaller medium sized companies. According to Affärsdata132, 83% of the Swedish medium sized manufacturing companies within the SNI-groups 26-36 have 100-299 employees. Only 5% of the medium sized companies within these groups have 400-499 employees. Thus the spread of companies within the different groups in our study reflects the spread of employees fairly well in Swedish medium sized manufacturing companies, within these groups. The companies’ owner structure, table 4.3 shows that the majority of the companies are owned by Swedish or foreign companies. A minority of the companies are family owned or have stated another owner structure. The other owner structures are e.g. limited companies, different owner combinations. Owner structure Number of companies Family owned 8 Owned by other Swedish companies 18 Owned by other foreign companies 16 Other owner structure 6 Table 4.3 Owner structures in the studied companies
4.2.2. Subcontractor
60% of the companies are subcontractors to one or other companies, table 4.4. The other companies’ markets consist of several customers and hence isn’t as controlled in their retail as
132 www.ad.se 2004-05-03
- 38 -

Business Strategy and Management Control Measures for Success! K. Marshall - M. Snygg Presentation of Survey Results
the subcontract companies. In table 4.5 we can also see that almost one fourth of the companies are depending to a large extent or very large extent on few subcontractors.
Yes No The company is mainly subcontractor to one or other companies. 29 19
Table 4.4 Subcontractors
1 Very small extent
3
2 Small extent 6 3 Moderate extent 28 4 Large extent 7
The company is dependent of one or few subcontractors to a:
5 Very large extent
4
Table 4.5 Dependence on subcontractors A cross tabulation between the owner structures of the companies and the answers to the questions on whether the companies are subcontractors or not has resulted in table 4.6. The results show that the majority of the companies that aren’t family owned are subcontractors.
Subcontractor Owner structure Yes No
Family owned 3 5 Swedish company 11 7 Foreign company 10 6 Other owner 5 1 Table 4.6 Owner structure compared to if companies are subcontractors or not Many companies are quite dependent on subcontractors. In table 4.7 it is interesting to see that family owned companies and companies owned by other Swedish companies are widely spread over the dependence scale, however companies owned by foreign companies have a rather high dependence on subcontractors.
Dependence on subcontractors Owner structure No Partly Very Large Family owned 2 1 3 2 Swedish company
1 5 9 2 1
Foreign company 10 3 3 Other owner 6 Table 4.7 Owner structure compared to companies dependence’ on subcontractors
4.2.3. Products
Table 4.8 illustrates how the main products are produced in the studied companies, and how the companies’ production is planned. As one should be able to expect a clear majority of the companies that offer products adapted to the customers mainly produces products towards orders. At the same time it is also reasonable to expect that companies with standard products
- 39 -

Business Strategy and Management Control Measures for Success! K. Marshall - M. Snygg Presentation of Survey Results
have a higher degree of production towards stock. Both these observations can also be made from our empirical data. A minority (25 %) of the companies produces standardised products; hence the majority (75 %) of the companies adapt their products either to each individual customer or to different groups of customers.
Production towards order/stock Main product 100% Order75% / 25% 50% / 50% 25% / 75% 100% Stock
The companies’ main products are adapted to each individual customer
16 10 3
The companies’ main products are adapted to different customer groups
4 1 1 1
The companies’ main products consists of standard products
2 1 3 5 1
Table 4.8 The companies’ main product compared to production planning With the above mentioned argument, that companies with customised products more likely produces towards order, it is also likely to find that companies with customised products tend to produce its products in shorter series, whilst companies with standardised products tend to produce its products in longer series. In table 4.9 these tendencies in production series can be seen. There is a correlation between the series length in production and the production towards order/stock. In table 4.10 one can see that production in short series tend to be mainly spread over the fields in which companies with production towards order are located. The allocation of companies with production towards long series tends to have production towards stock.
Production is in short/long series Main product 100% Short 75% / 25% 50% / 50% 25% / 75% 100% Long
The companies’ main products are adapted to each individual customer
13 7 3 6
The companies’ main products are adapted to different customer groups
2 3 1 1
The companies’ main products consists of standard products
2 1 3 5 1
Table 4.9 The companies’ main product compared to series length in production
Production is in short/long series Production towards order/stock 100% Short 75% / 25% 50% / 50% 25% / 75% 100% Long
Order 100% 11 4 4 3 Order/Stock 75% / 25% 6 5 1 Order/Stock 50% / 50% 1 2 1 Stock/Order 25% / 75% 2 1 4 2
Stock 100% 1 Table 4.10 Production planning compared to series length in production
- 40 -

Business Strategy and Management Control Measures for Success! K. Marshall - M. Snygg Presentation of Survey Results
4.3. Critical Success Factors and Business Strategy
4.3.1. The Companies’ Critical Success Factors
To be able to map the studied companies’ critical success factors (CSF), we asked the respondents to make a decision on nine CSF and to grade these after the importance to the companies. Table 4.11 illustrates the companies’ judgment of the different CSF and the CSF importance to the companies. Most companies believe that Cost effectiveness; Quality & service; and Customer adaptation are the most CSF for the company. These CSF are also considered the second and third most important factors for the companies’ success. One company considered that a wider range of products was critical for success. None of the below mentioned CSF were considered unimportant. Success factors
Most important
Second most important
Third most important
Customer adaptation (in broad context) 13 9 8 Short term profits 1 1 2 Quality and service 12 13 8 Innovation ability 1 4 4 Flexibility in production 7 9 4 Cost effectiveness 13 8 17 Market effectiveness 1 1 4 Limited range of products 0 3 0 Other success factor: 0 0 1 Table 4.11 The importance of success factors
4.3.2. The companies’ business strategy
The foundation for dividing the companies into different strategies is the respondents’ own judgement. The respondents were asked to state how the company is positioned compared to their competitors. 13 strategy variables described in paragraph 3.2.2.1 were used. The respondents were asked to state their position (compared to their competitors) on a scale consisting of five grades. The number one is implying that the company has a lower position than the competitors; whilst the number five is implying that the company has a larger position than the competitors. The number three is hence implying that the company doesn’t differ from the company’s competitors. Table 4.12 shows how the companies are divided on each respective variable. In the table, one can see that many companies have answered that they have the same position as their competitors; this is a common result when using a scale of 5, because a 3 is the easiest answer to give. All companies do however characterise themselves by having a stronger or lower position in some of the strategy variables. The strategy variables; product quality; and service surrounding the product; indicates that this is areas in which the companies try to differentiate themselves from their competitors.
- 41 -

Business Strategy and Management Control Measures for Success! K. Marshall - M. Snygg Presentation of Survey Results
Consider-ably lower
The same
Consider-ably larger
Strategy variable
1 2 3 4 5 Need for specialist competence in production 0 1 35 11 1 Need for flexible production techniques 0 2 27 14 5 Sales price 2 5 23 17 1 Cost effectiveness 2 4 30 11 1 Degree of centralised control 0 9 24 11 4 Percentage of turnover invested in development of new products
1 9 20 16 2
Percentage of turnover invested in development of existing products
0 7 30 10 1
Percentage of turnover invested in marketing 5 10 24 7 2 Product quality 0 1 17 25 5 Specific product features 0 1 24 15 8 Service surrounding the product 0 4 18 19 7 The company’s market segment 0 2 32 12 2 Share of products that are constructed in consensus with individual customers demands
3 3 25 14 3
Table 4.12 Division of strategy variables For companies competing with cost effectiveness we could expect to find low values on each of the variables. Companies competing with differentiation we could expect to find a high value on at least a couple of the variables beyond the variable selling price133.
4.4. Management Control Measures
The use of management control measures differs widely among companies. To make it easier to grasp the contents of the measures, we have created four groups of measures, each group containing different measures. The groups are the same as the ones illustrated in the Balanced Scorecard in paragraph 2.3.5 and 2.3.6, namely Internal Business; Financial; Customers; and Innovation & learning. The indexes are mean values of the group measures and have thus been created by adding the different measures in each of the groups and dividing the sum by the number of measures in each group. The measures have been graded after the frequency of use in companies, with the value 1 for measures never used, and the value 7 for measures used more frequently than once a month, thus the mean value lies within the interval of 1 and 7. All the companies’ index values have been used to create mean values for the groups.
4.4.1. Today’s Use of Management Control Measures
As seen in table 4.13 the majority of the companies uses many financial measures frequently, there are however a few exceptions. Internal business measures are also measured quite frequently, with a few companies that use very few internal measures. The two remaining groups Customers and Innovations & learning; have as expected lower mean values, which can be explained by that measures such as customer satisfaction, customer loyalty, employee 133 Porter 1980
- 42 -
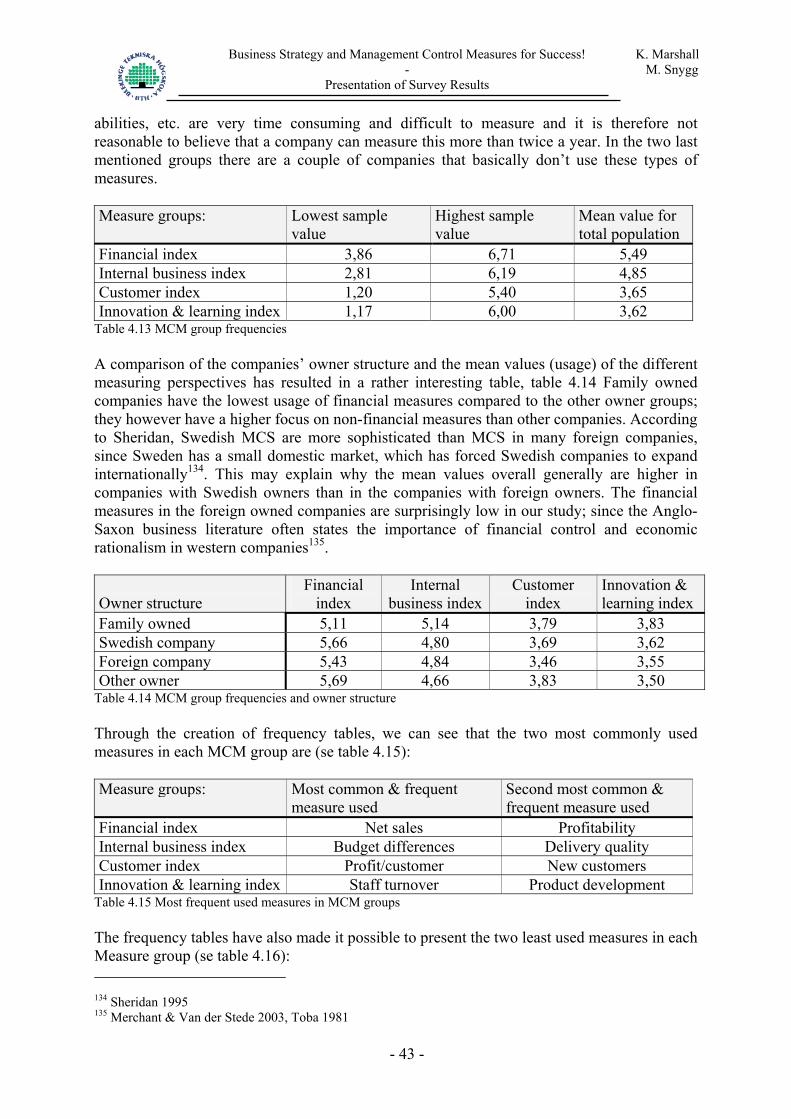
Business Strategy and Management Control Measures for Success! K. Marshall - M. Snygg Presentation of Survey Results
abilities, etc. are very time consuming and difficult to measure and it is therefore not reasonable to believe that a company can measure this more than twice a year. In the two last mentioned groups there are a couple of companies that basically don’t use these types of measures. Measure groups: Lowest sample
value Highest sample value
Mean value for total population
Financial index 3,86 6,71 5,49 Internal business index 2,81 6,19 4,85 Customer index 1,20 5,40 3,65 Innovation & learning index 1,17 6,00 3,62
Table 4.13 MCM group frequencies A comparison of the companies’ owner structure and the mean values (usage) of the different measuring perspectives has resulted in a rather interesting table, table 4.14 Family owned companies have the lowest usage of financial measures compared to the other owner groups; they however have a higher focus on non-financial measures than other companies. According to Sheridan, Swedish MCS are more sophisticated than MCS in many foreign companies, since Sweden has a small domestic market, which has forced Swedish companies to expand internationally134. This may explain why the mean values overall generally are higher in companies with Swedish owners than in the companies with foreign owners. The financial measures in the foreign owned companies are surprisingly low in our study; since the Anglo-Saxon business literature often states the importance of financial control and economic rationalism in western companies135. Owner structure
Financial index
Internal business index
Customer index
Innovation & learning index
Family owned 5,11 5,14 3,79 3,83 Swedish company 5,66 4,80 3,69 3,62 Foreign company 5,43 4,84 3,46 3,55 Other owner 5,69 4,66 3,83 3,50
Table 4.14 MCM group frequencies and owner structure Through the creation of frequency tables, we can see that the two most commonly used measures in each MCM group are (se table 4.15): Measure groups: Most common & frequent
measure used Second most common & frequent measure used
Financial index Net sales Profitability Internal business index Budget differences Delivery quality Customer index Profit/customer New customers Innovation & learning index Staff turnover Product development
Table 4.15 Most frequent used measures in MCM groups The frequency tables have also made it possible to present the two least used measures in each Measure group (se table 4.16): 134 Sheridan 1995 135 Merchant & Van der Stede 2003, Toba 1981
- 43 -
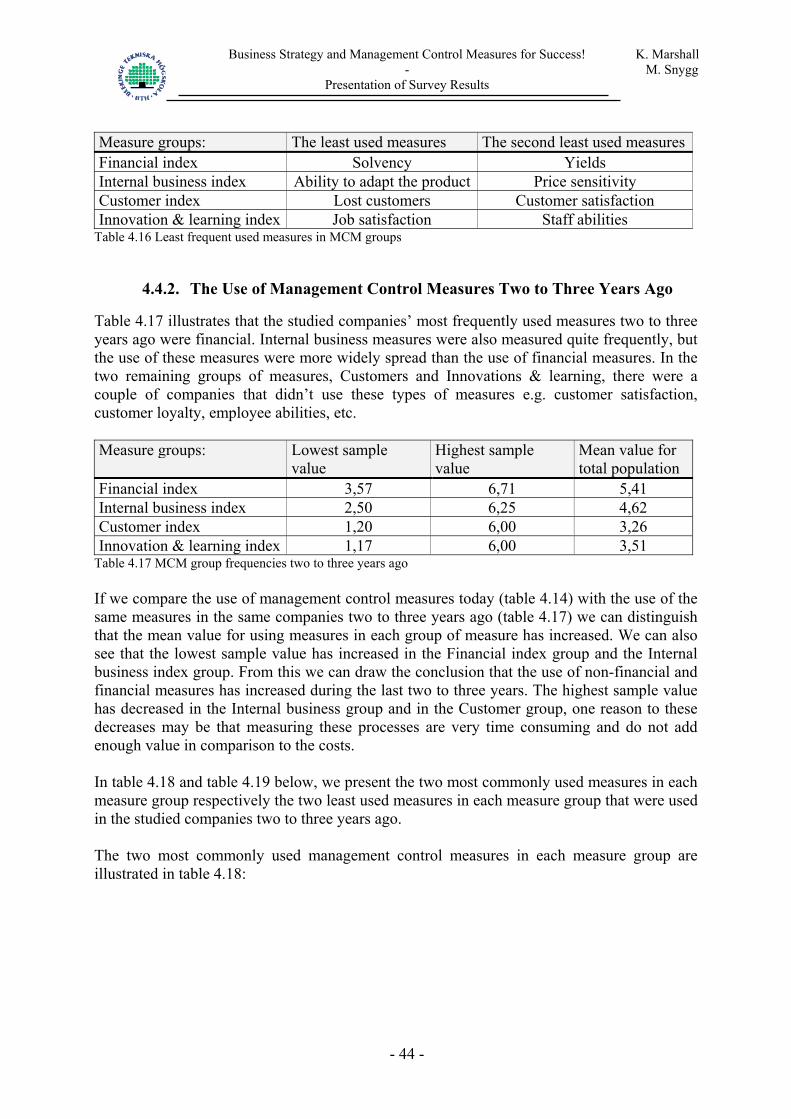
Business Strategy and Management Control Measures for Success! K. Marshall - M. Snygg Presentation of Survey Results
Measure groups: The least used measures The second least used measuresFinancial index Solvency Yields Internal business index Ability to adapt the product Price sensitivity Customer index Lost customers Customer satisfaction Innovation & learning index Job satisfaction Staff abilities
Table 4.16 Least frequent used measures in MCM groups
4.4.2. The Use of Management Control Measures Two to Three Years Ago
Table 4.17 illustrates that the studied companies’ most frequently used measures two to three years ago were financial. Internal business measures were also measured quite frequently, but the use of these measures were more widely spread than the use of financial measures. In the two remaining groups of measures, Customers and Innovations & learning, there were a couple of companies that didn’t use these types of measures e.g. customer satisfaction, customer loyalty, employee abilities, etc. Measure groups: Lowest sample
value Highest sample value
Mean value for total population
Financial index 3,57 6,71 5,41 Internal business index 2,50 6,25 4,62 Customer index 1,20 6,00 3,26 Innovation & learning index 1,17 6,00 3,51
Table 4.17 MCM group frequencies two to three years ago If we compare the use of management control measures today (table 4.14) with the use of the same measures in the same companies two to three years ago (table 4.17) we can distinguish that the mean value for using measures in each group of measure has increased. We can also see that the lowest sample value has increased in the Financial index group and the Internal business index group. From this we can draw the conclusion that the use of non-financial and financial measures has increased during the last two to three years. The highest sample value has decreased in the Internal business group and in the Customer group, one reason to these decreases may be that measuring these processes are very time consuming and do not add enough value in comparison to the costs. In table 4.18 and table 4.19 below, we present the two most commonly used measures in each measure group respectively the two least used measures in each measure group that were used in the studied companies two to three years ago. The two most commonly used management control measures in each measure group are illustrated in table 4.18:
- 44 -

Business Strategy and Management Control Measures for Success! K. Marshall - M. Snygg Presentation of Survey Results
Measure groups: Most common & frequent measure used
Second most common & frequent measure used
Financial index Net sales Profitability Internal business index Budget differences Product quality Customer index Profit/customer New customers Innovation & learning index Staff turnover Product development
Table 4.18 Most frequent used measures in MCM groups two to three years ago The two least commonly used management control measures in each measure group are illustrated in table 4.19: Measure groups: The least used measures The second least used measuresFinancial index Solvency Yields Internal business index Ability to adapt the product Standstill frequency Customer index Lost customers Customer satisfaction Innovation & learning index Job satisfaction Staff abilities
Table 4.19 Least frequent used measures in MCM groups two to three years ago The increased frequency in the use of customer measures is the most evident change over the past two to three years. This increase could be related to the tougher competition that has grown forward throughout the years. There are also other tendencies that show on the increased importance of taking care of the customer. The second most frequent measure used today in the Internal business index is delivery quality (table 4.19 above), and was two years ago product quality (table 4.18). The shift from measuring product quality to measuring delivery quality indicates that the companies perspectives have broadened to include all the additional components beyond product quality, such as on time delivery and correct delivery, which all can be included in the term delivery quality.
4.5. Effectiveness The effectiveness is measured by the respondents’ judgment of the company’s success in comparison to competitors. To avoid measuring effectiveness in the aspects that are considered not to have any importance we also let the respondents state how important the stated success factors were. The companies’ effectiveness is hence measured as a weighted mean value of these two statements. The respondents’ judgment of how successful the respondent’s company is in comparison to competitors in the same branch is illustrated in table 4.20. There is a risk that the majority of the respondents state the average value in surveys, when respondents are unsure about what to answer. We however consider the answers to have a rather wide spread and we don’t believe this has been the case in to many cases. No respondent considers its company to be considerably less successful in the five financial variables (1, 3, 4, 5, 6).
- 45 -
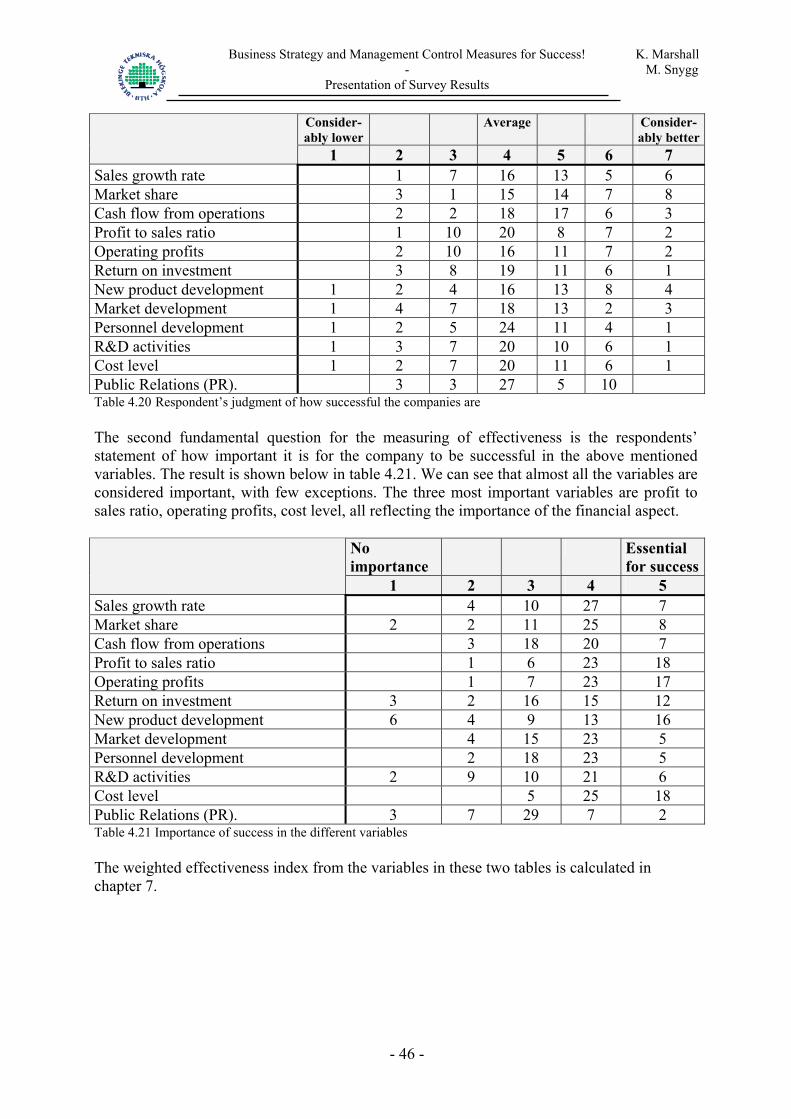
Business Strategy and Management Control Measures for Success! K. Marshall - M. Snygg Presentation of Survey Results
Consider-ably lower
Average Consider-ably better
1 2 3 4 5 6 7 Sales growth rate 1 7 16 13 5 6 Market share 3 1 15 14 7 8 Cash flow from operations 2 2 18 17 6 3 Profit to sales ratio 1 10 20 8 7 2 Operating profits 2 10 16 11 7 2 Return on investment 3 8 19 11 6 1 New product development 1 2 4 16 13 8 4 Market development 1 4 7 18 13 2 3 Personnel development 1 2 5 24 11 4 1 R&D activities 1 3 7 20 10 6 1 Cost level 1 2 7 20 11 6 1 Public Relations (PR). 3 3 27 5 10 Table 4.20 Respondent’s judgment of how successful the companies are The second fundamental question for the measuring of effectiveness is the respondents’ statement of how important it is for the company to be successful in the above mentioned variables. The result is shown below in table 4.21. We can see that almost all the variables are considered important, with few exceptions. The three most important variables are profit to sales ratio, operating profits, cost level, all reflecting the importance of the financial aspect.
No importance
Essential for success
1 2 3 4 5 Sales growth rate 4 10 27 7 Market share 2 2 11 25 8 Cash flow from operations 3 18 20 7 Profit to sales ratio 1 6 23 18 Operating profits 1 7 23 17 Return on investment 3 2 16 15 12 New product development 6 4 9 13 16 Market development 4 15 23 5 Personnel development 2 18 23 5 R&D activities 2 9 10 21 6 Cost level 5 25 18 Public Relations (PR). 3 7 29 7 2 Table 4.21 Importance of success in the different variables The weighted effectiveness index from the variables in these two tables is calculated in chapter 7.
- 46 -
Business Strategy and Management Control Measures for Success! K. Marshall - M. Snygg Classification of Business Strategies
5. Classification of Business Strategies Chapter five starts the analysis section of the study. In this chapter the studied companies’ business strategy are classified.
The foundation for dividing the companies into the different business strategies is the answers to questions A7 and A8 in the questionnaire, where the respondent was asked to state the company’s position compared to competitors in the same branch, regarding 13 strategy variables. These 13 strategy variables are described in paragraph 3.2.2.1. The classification of companies’ business strategies is based hence on the respondents’ own judgments. The respondents were asked to state the company’s position on a scale consisting of five grades. The number one is implying that the company has a lower position than the competitors; while the number five is implying that the company has a larger position than the competitors. The number three is hence implying that the company doesn’t differ from the company’s competitors. Table 4.12 in paragraph 4.3 showed how the companies were divided on each respective variable. To classify each company into one of the strategies in both our own developed strategy typology based on Porter’s typology and the strategy typology developed by Miles & Snow, we initially used a cluster analysis.
5.1. Cluster Analysis
The term cluster refers to one or several groups in a population that have close connections in some respect136. The cluster analysis uses an algorithm that from the beginning places each variable in separate clusters and then combines the clusters until there is only one left, in its attempt to identify relatively homogeneous variables. The clusters located in each cluster-group are more alike than any cluster from another group.137 In this study we have used the Hierarchical cluster analysis technique, since this is the most suitable technique to use in studies with small populations (less than 200 observations)138. The standard approach in business administration studies is to use Ward’s cluster method and Squared Euclidean distance measure, which we also have done. Ward’s method is also suitable to use when the population is relatively small139. Euclidean distance, measures differences and is suitable to use with Ward’s method, which identifies the squared differences and allocates these clusters into groups, where the squared distance is the smallest140. Ward’s cluster method is subordinated to the Hierarchical cluster analysis, which is mentioned in paragraph 3.2.7.3.
136 Aronsson 1999 137 SPSS 11.0 tutorial 138 Aronsson 1999 139 Gyllberg & Svensson 2002 140 Aronsson 1999
- 47 -

Business Strategy and Management Control Measures for Success! K. Marshall - M. Snygg Classification of Business Strategies
5.1.1. Classification According to Miles & Snow’s Typology
To classify the companies according to Miles & Snow’ typology as either a Analyzer, Prospector or Defender we have used five strategy variables out of the total eleven variables described in paragraph 3.2.2.1 that could be used to classify companies according to Miles & Snow’ typology. The five variables used were sales price, percentage of turnover invested in marketing, percentage of turnover invested in development of existing products, percentage of turnover invested in development of new products and specific product features. When we used more than these five variables we couldn’t find any homogeneous clusters. The result of the cluster analysis with these five strategy variables are illustrated in the dendogram in figure 5.1.
- 48 -
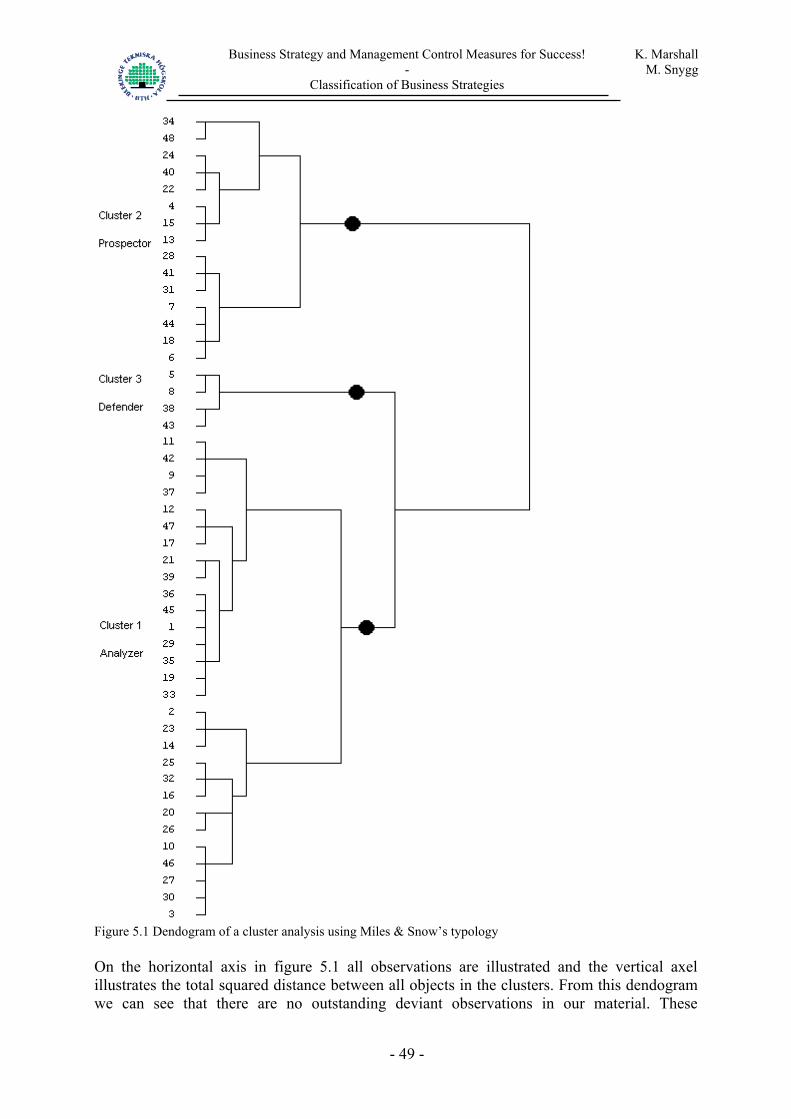
Business Strategy and Management Control Measures for Success! K. Marshall - M. Snygg Classification of Business Strategies
- 49 -
Figure 5.1 Dendogram of a cluster analysis using Miles & Snow’s typology On the horizontal axis in figure 5.1 all observations are illustrated and the vertical axel illustrates the total squared distance between all objects in the clusters. From this dendogram we can see that there are no outstanding deviant observations in our material. These
Business Strategy and Management Control Measures for Success! K. Marshall - M. Snygg Classification of Business Strategies
observations would have a combination to other observations in a late stage, far to the right in the dendogram, to become a cluster. The dendogram gives solutions to different suitable numbers of clusters. The choice of number of clusters implies a balance between being manageable i.e. few relevant clusters, and homogeneous i.e. should avoid large jumps when some observations are combined to other observations. The three black points in figure 5.1 symbolises our choice of clusters. This division of clusters supports Miles & Snow’s strategy typology (Analyzer, Prospector and Defender). The Boxplot charts in appendix 4 illustrate what characteristics each cluster has. Cluster 2: Prospectors are characterised by having a high sales price, high percentage of turnover invested in marketing, high percentage of turnover invested in development of existing products, high percentage of turnover invested in development of new products and high specific product features. Cluster 3: Defenders are characterised by having low sales price, low percentage of turnover invested in marketing, some percentage of turnover invested in development of existing products, low percentage of turnover invested in development of new products and low specific product features. Cluster 1: Analyzers are characterised by having a moderate sales price, moderate percentage of turnover invested in marketing, some percentage of turnover invested in development of existing products, moderate percentage of turnover invested in development of new products and some specific product features.
5.1.2. Further Analysis of the Cluster Analysis
In figure 5.1 we can see that the Analyzer cluster contains many companies and that this cluster could be divided into two (Analyzer) clusters. We decided to create a four cluster dendogram with the same variables and presenting boxplots in order to see if there are any special characteristics for each of the two respective Analyzer groups (see appendix 5 for details). There appears to be one characteristic for each of these two clusters, one cluster has a higher level of turnover invested in marketing (cluster 1), whilst the other cluster has a higher level of specific product features (cluster 2).
5.1.3. Classification According to the Further Developed Typology
To classify the companies according to our further developed typology based on Porter’s typology, as having either a Cost leader, Marketing, Product development or Customisation strategy, we have used seven strategy variables of the total eight variables described in paragraph 3.2.2.1, which could be used to classify companies according to this typology. The used variables are sales price, percentage of turnover invested in marketing, percentage of turnover invested in development of existing products, percentage of turnover invested in development of new products, product quality, services surrounding the products and specific product features. We have excluded the strategy variable share of products that are constructed in consensus with individual customers’ demands. The reason behind this choice is that several companies with different strategies have stated a high value on this variable.
- 50 -

Business Strategy and Management Control Measures for Success! K. Marshall - M. Snygg Classification of Business Strategies
The variable hence didn’t express a difference between the companies choice of strategy. This choice is also further explained in paragraph 5.2. Also when we classified each company into one of the strategies in our own developed strategy typology based on Porter’s typology, we initially used a cluster analysis. The result of this cluster analysis is illustrated in figure 5.2.
- 51 -

Business Strategy and Management Control Measures for Success! K. Marshall - M. Snygg Classification of Business Strategies
- 52 -
Figure 5.2 Dendogram of a cluster analysis using our further developed typology based on Porter’s typology Also the dendogram in figure 5.2 illustrates that there are no outstanding deviant observations in our material. Also this dendogram gives solutions to different suitable numbers of clusters.

Business Strategy and Management Control Measures for Success! K. Marshall - M. Snygg Classification of Business Strategies
The four black points in figure 5.2 symbolises our choice of clusters. This division of clusters supports our further developed typology based on Porter’s typology. For companies competing with a Cost leader strategy, we could expect to find low values on each of the strategy variables141. The four companies identified as Cost leaders in figure 5.2 (cluster 4) have all stated low values on all or almost all variables, see boxplot in appendix 6. One company (number 8 in figure 5.2.) have stated they have good product quality, whilst the other companies have stated they have a mediocre product quality. Both Porter and Miles & Snow state that product quality among Cost leaders and Defenders is good, however these companies do not use this characteristic as a main competitive advantage142. We therefore believe that our observations are reasonable. In companies competing with Differentiation strategies, we expect to find high values on at least one more variable beyond sales price. As described in paragraph 3.2.3 three different Differentiation strategies were developed based on Porter, Mintzberg and Greve. Besides the four companies identified as Cost leaders in figure 5.2 we have identified three other clusters. A closer look at these clusters’ boxplots in appendix 6 illustrates that these clusters have the same characteristics as the three Differentiation strategies that were developed based on Porter, Mintzberg and Greve in paragraph 3.2.3. Cluster 1: Marketing strategy. Characteristics for these companies are that they have stated a high rate on percentage of turnover invested in marketing and service surrounding the products. Cluster 2: Customisation strategy. These companies have rated product quality and specific product features as the most important competitive advantages. Cluster 3: Product development strategy. These companies are characterised by having a high percentage of turnover invested in development of existing products and a high percentage of turnover invested in development of new products. One observation made is that both cluster 2 (Customisation strategy) and cluster 3 (Product development strategy) have relatively high values on product quality and specific product features. To investigate if this depends on having both a Cost leader strategy and the Differentiation strategies in the same dendogram or if the result would be overthrown by removing the Cost leader companies from this analysis, we removed the Cost leader companies. We conducted a cluster analysis on the remaining 44 companies and hence also excluded the strategy variable sales price, because it is associated to the Cost leader strategy. The result from this analysis is presented in figure 5.3 below.
141 Porter 1980 142 Miles & Snow 1978, Porter 1980
- 53 -

Business Strategy and Management Control Measures for Success! K. Marshall - M. Snygg Classification of Business Strategies
- 54 -
Figure 5.3 Dendogram with the three Differentiation strategies. From the dendogram in figure 5.3 we can see the same division of clusters as was illustrated in figure 5.2 when the Cost leader strategy was included. The division of companies among the three Differentiation strategies fits well with the division of companies among the three Differentiation strategies in figure 5.3 It is only three companies that have changed their strategy belonging. Company 4 and 30 were earlier in figure 5.2 in cluster 3 (Product development), but are now in cluster 2 (Customisation strategy). Company 17 was earlier (in figure 5.2) in cluster 2 (Customisation strategy), but are now in cluster 1 (Marketing strategy).
Business Strategy and Management Control Measures for Success! K. Marshall - M. Snygg Classification of Business Strategies
In the boxplots in appendix 7, we can also see that the characteristics of each Differentiation strategy are more pure in this cluster analysis. The Customisation strategy has a higher value on the variables product quality and specific product features than the other strategies. The Marketing strategy has a higher value on the variables percentage of turnover invested in marketing and service surrounding the products, than the other strategies. The Product development strategy has a higher value on the variables percentage of turnover invested in development of existing products and the high percentage of turnover invested in development of new products, than the other strategies.
5.2. Factor Analysis of the Strategy Variables
To further validate our business strategy measurement instrument we have decided to make a factor analysis of the strategy variables. Due to some companies’ change of strategy belonging in the cluster analysis when we excluded the Cost leader companies, we decided to study each company individually. Therefore a factor analysis is made on the strategy variables. We decided to study the Cost leader strategy and the Differentiation strategies separately to avoid interference between these two types of strategies. Because it is impossible to use a factor analysis on only one variable (sales price, associated with the Cost leader strategy), a factor analysis is only made on the Differentiation strategies. We believe that the result from the first cluster analysis (figure 5.2.) gave a reliable result regarding the four Cost leader companies. After studying them separately we found that this classification was reasonable. The strategy variable sales price is hence excluded from the factor analysis. A factor analysis is made with the remaining seven strategy variables, associated with the Differentiation strategies (percentage of turnover invested in marketing, percentage of turnover invested in development of existing products, percentage of turnover invested in development of new products, product quality, service surrounding the products, share of products that are constructed in consensus with individual customer’s demands and specific product features). Factor analysis aims at identifying the smallest possible number of groups that can explain the correlation between the different variables143. In the factor analysis the number of factors was set at three to reflect the three Differentiation strategies (Product development, Marketing and Customisation strategy). The data reduction method was used. One common purpose of the use of this method in a factor analysis is that it tries to identify a small number of factors that can explain the most of the observed variances.144 When factor analysis is conducted extraction method Principal Component Analysis and the rotation method Varimax is commonly used, (also used in our factor analysis). By using a rotation method, variations in the components are more evenly spread. This means that it will be easier to interpret the results.145 By using the Kaiser-Meyer-Olkin (KMO) test, a function included in the statistical software SPSS 11.0, one can get indications whether or not it is possible to conduct a factor analysis on the selected variables. High values that are close to 1.0, indicate that it is useful to use factor
143 SPSS 11.0 tutorial 144 SPSS 11.0 tutorial 145 SPSS 11.0 tutorial
- 55 -

Business Strategy and Management Control Measures for Success! K. Marshall - M. Snygg Classification of Business Strategies
analysis on the data. A value below 0.50 indicates that it probably will not be useful to use factor analysis on the selected variables. There is also a second test that can be conducted, Bartlett’s test of sphericity, in which significance values less than 0.05 indicate that factor analysis may be prosperous to use.146 Both these demands are fulfilled and hence we believed it would be useful to use factor analysis on the selected variables. A guideline is that only those factors with an Eigenvalue more than one should be used.147 This requirement is also fulfilled and together the three factors explain 77 % of the variance. By looking closer at variance values, variability in the variables can be explained. The closer the value is to 100% the less is the loss of information. The complexity of the data can be considerably reduced when choosing variables that are considered to be important in the factor analysis. In our case the variability can be explained to 77 % and there is a 23 % loss of information.148 This can be considered good in comparison to explained variance in other similar studies149. The Scree plot function makes it more feasible to determine the optimal number of components (factors). In the scree plot a pattern of the included components will appear, preferably the plotted pattern looks like steep slope, because this indicates that the components should be used in the factor analysis. If however a shallow slope appears, this indicates that the components included in the shallow slope should be excluded from the factor analysis. The steep slope can sometimes surpass into a shallow slope, hence the components included in the shallow slope should then be excluded150. The Scree plot in Appendix 8 illustrates that three factors would be a satisfactory number of factors, because the first decline on the slope is at factor number three and the second decline at factor number five. Table 5.1 illustrates the result of our factor analysis.
Factor 1 Factor 2 Factor 3Percentage of turnover invested in development of existing products
,908 ,122
Percentage of turnover invested in development of new products
,889 ,109 ,151
Services surrounding the product ,928Percentage of turnover invested in marketing
,249 ,689 -,255
Product quality ,932Specific product features ,267 -,319 ,676Table 5.1 Factor analysis The values illustrated in the matrix are the different variables’ “loadings”. What is regarded to be a high loading is individual in different cases. The number of variables, the size of the sample and the number of factors must be taken into account. A guideline is that one variable should have a high value (> 0,3) in only one factor. In the other factors the same variable should have a lower value (< 0,3). One variable with two or more loadings exceeding 0,3 are 146 SPSS 11.0 tutorial 147 Greve 1999 148 SPSS 11.0 tutorial 149 Greve 1999, Gyllberg & Svensson 2002 150 SPSS 11.0 tutorial
- 56 -

Business Strategy and Management Control Measures for Success! K. Marshall - M. Snygg Classification of Business Strategies
considered to be multidimensional i.e. it may express more than one factor. Another often used guideline is:151 < 0,3 not acceptable 0,3-0,4 interesting 0,4-0,5 important > 0,5 practically significant In this study the size or value of the loadings is required to exceed 0,4. This implies that the studied variables must have a loading exceeding 0,4 in one factor and less in the other factors to be considered to give support for the high loaded factor. As illustrated in table 5.1 the variable share of products that are constructed in consensus with individual customer’s demands is not included. This variable had a high loaded value (> 0,4) on more than one factor (Factor 1, 3 and also some in 2) and was therefore excluded. This is the same reason why the variable is excluded in the cluster analysis. The factor analysis supports the division of Differentiation strategies that were made. Factor 1, with high loaded values on the variables percentage of turnover invested in development of existing products and percentage of turnover invested in development of new products and low values on the remaining variables is representing the Product development strategy. Factor 2, with high loaded values on the variables service surrounding the product and percentage of turnover invested in marketing and low values on the remaining variables is representing the Marketing strategy. Factor 3, with high loaded values on the variables product quality and specific product features and low values on the remaining variables is representing the Customisation strategy.
5.2.1. Classification of Business Strategies According to the Factor Analysis
The companies are here classified with the six strategy variables, which was the result from the factor analysis. An average value for each strategy variable in each respective company is calculated by multiplying the weight below with the values each respondent have stated for each respective variable. The weights below are one divided by the number of strategy variables reflecting each factor in the factor analysis. Product development strategy Percentage of turnover invested in development of existing products ½ Percentage of turnover invested in development of new products ½ Marketing strategy Services surrounding the product ½ Percentage of turnover invested in marketing ½ Customisation strategy Product quality ½ Specific product features ½
151 Aronsson 1999
- 57 -

Business Strategy and Management Control Measures for Success! K. Marshall - M. Snygg Classification of Business Strategies
Each company have been classified as that business strategy, which has the highest average value. In some cases the companies reached similar values on two different strategies. In these cases an evaluation with those variables that had the highest loaded value in the factor analysis was made. The variable that had the highest loaded value in the factor analysis decided which strategy the company belonged to. All 48 companies were divided between the four business strategies (our further developed typology, based on Porter’s typology) in the following manner, table 5.2. Product
development strategy
Marketing strategy
Customisation strategy
Cost leader strategy
Companies 6, 7, 9, 11, 18, 19, 24, 28, 31, 36, 37, 41, 42, 44
1, 21, 29, 34, 35, 39, 45, 47, 48
2, 3, 4, 10, 12, 13, 14, 15, 16, 17, 20, 22, 23, 25, 26, 27, 30, 32, 33, 40, 46
5, 8, 38, 43
Total number of companies
14 9 21 4
Table 5.2 Companies division between the four business strategies If we compare the division of companies between the four business strategies in table 5.2 above with the division of companies between the same four business strategies that was made in the first cluster analysis (figure 5.2), we can see that some companies have changed strategy belonging. Companies 22, 40, 15, 4 and 30 have changed from a Product development strategy (in figure 5.2, cluster analysis) to a Customisation strategy (table 5.2). Company number 19 and 36 have changed from a Customisation strategy (in figure 5.2, cluster analysis) to a Product development strategy (table 5.2).
5.3. Summary and Validity of the Classification
From the classification of companies according to Miles & Snow’s typology we reached a result that ended up in three clusters, which characterised the three strategies: Analyzer, Prospector and Defender. However, to reach this result we used five strategy variables out of the total eleven variables described in paragraph 3.2.2.1, which could be used to classify companies according to Miles & Snow’ typology. When we used more than these five variables we couldn’t find any homogeneous clusters. Classifying the companies according to Miles & Snow’s typology gave a satisfactory result with several strategy variables until we reached 45 companies. After that, we couldn’t reach three homogeneous clusters with more than five strategy variables. The further analysis of the Analyzer group in Miles & Snow’s typology showed some interesting similarities with our further developed typology based on Porter’s typology. We found that one of the two Analyzer cluster groups only consisted of what appeared to be companies with a customisation strategy according to our further development strategy typology based on Porter’s typology. The other Analyzer cluster consisted of a mix of companies from the three differentiation strategies in our further developed typology based on Porter’s typology, they are however not companies with failed strategies that Mile & Snow
- 58 -

Business Strategy and Management Control Measures for Success! K. Marshall - M. Snygg Classification of Business Strategies
calls Reactors. We consider the Analyzer strategy too wide and diffuse, and it is difficult to find any common characteristics among the used strategy variables. These circumstances made us decide to continue the study with only one classification of strategies and to leave Miles & Snow’s typology. The criticism raised towards Miles & Snow’s typology may explain this result. The typology was developed in the late 1970’s and some researches state that strategy typologies formulated 20 to 30 years ago don’t reflect a realistic description of companies’ situations today. Miles & Snow’s typology has a detailed picture for each strategy and it seems to be hard to adapt the strategies to today’s companies. Some of the important components in companies’ business strategy today, had none or little importance in the late 1970’s e.g. quality and customer adaptation.152 The three methods for classifying the companies’ strategy according to our own further developed strategy typology based on Porter’s typology, gives almost a similar result. A closer look at those companies that change strategy when different methods are used shows that these companies have stated high values on variables in more than one strategy. This may explain why they are changing strategy when different techniques for classifying their strategy belonging are used. We therefore believe this result is trustworthy. All three methods for classifying the companies’ strategy belonging are, according to us, reliable. Whilst the classification based on the factor analysis is made by studying each company individually, we have decided that this result is most reliable and this classification is therefore used further on in the study. To further validate the classification of the studied companies’ business strategy we have tried to classify some companies solely on our insight and knowledge concerning these companies. The two classifications showed approximately the same result, there were no big differences between the two classifications. From here on in the thesis, the studied companies will be classified to our further developed strategy typology based on Porter’s typology.
5.3.1. Further Analysis of the Business Strategies
Besides classifying each company’s business strategy, it may be interesting to place the different business strategies in relation to the studied companies’ situation and environment, to be able to observe similarities and differences among the different business strategies. In this paragraph we present some comparisons which we found interesting. In table 5.3 long respective short series in production are compared with the different business strategies.
Production is in short/long series Strategy 100% Short 75% / 25% 50% / 50% 25% / 75% 100% Long Cost leader 1 2 1 Marketing 5 1 2 1 Customisation 9 5 2 2 1 Product development 4 7 1 4 Table 5.3 Long respective short series of production in different business strategies
152 Greve 1999
- 59 -
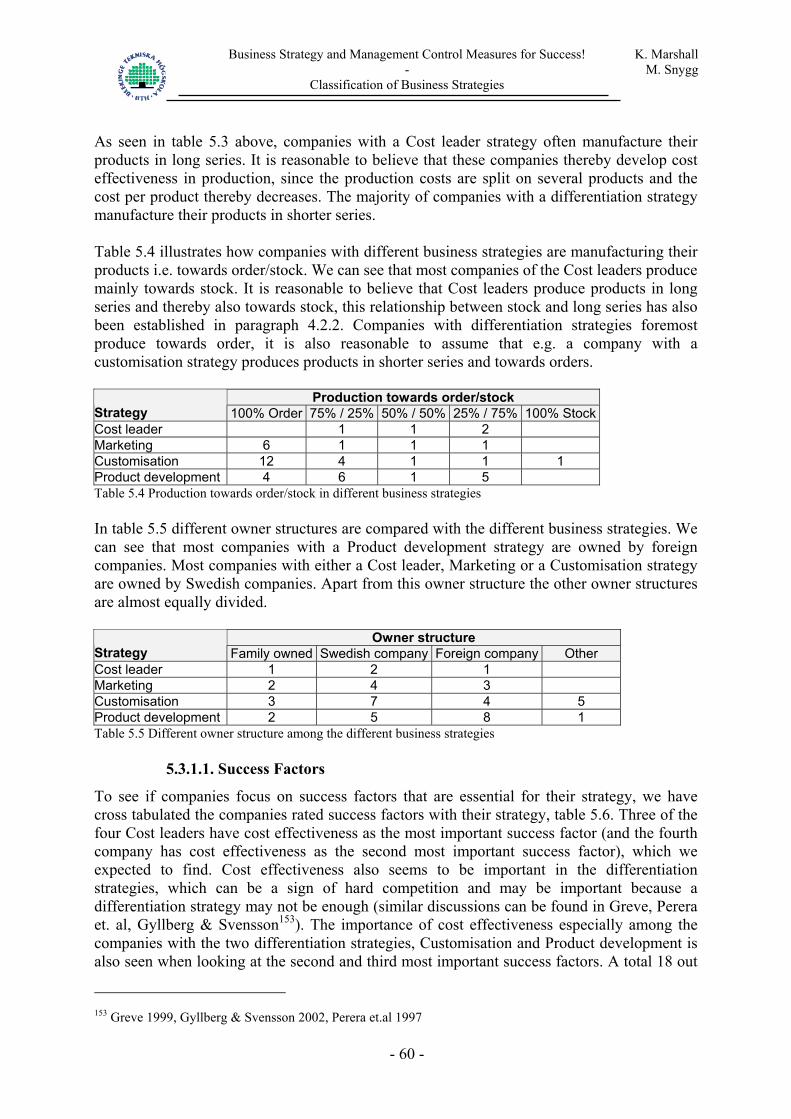
Business Strategy and Management Control Measures for Success! K. Marshall - M. Snygg Classification of Business Strategies
As seen in table 5.3 above, companies with a Cost leader strategy often manufacture their products in long series. It is reasonable to believe that these companies thereby develop cost effectiveness in production, since the production costs are split on several products and the cost per product thereby decreases. The majority of companies with a differentiation strategy manufacture their products in shorter series. Table 5.4 illustrates how companies with different business strategies are manufacturing their products i.e. towards order/stock. We can see that most companies of the Cost leaders produce mainly towards stock. It is reasonable to believe that Cost leaders produce products in long series and thereby also towards stock, this relationship between stock and long series has also been established in paragraph 4.2.2. Companies with differentiation strategies foremost produce towards order, it is also reasonable to assume that e.g. a company with a customisation strategy produces products in shorter series and towards orders.
Production towards order/stock Strategy 100% Order 75% / 25% 50% / 50% 25% / 75% 100% Stock Cost leader 1 1 2 Marketing 6 1 1 1 Customisation 12 4 1 1 1 Product development 4 6 1 5 Table 5.4 Production towards order/stock in different business strategies In table 5.5 different owner structures are compared with the different business strategies. We can see that most companies with a Product development strategy are owned by foreign companies. Most companies with either a Cost leader, Marketing or a Customisation strategy are owned by Swedish companies. Apart from this owner structure the other owner structures are almost equally divided.
Owner structure Strategy Family owned Swedish company Foreign company Other Cost leader 1 2 1 Marketing 2 4 3 Customisation 3 7 4 5 Product development 2 5 8 1 Table 5.5 Different owner structure among the different business strategies
5.3.1.1. Success Factors
To see if companies focus on success factors that are essential for their strategy, we have cross tabulated the companies rated success factors with their strategy, table 5.6. Three of the four Cost leaders have cost effectiveness as the most important success factor (and the fourth company has cost effectiveness as the second most important success factor), which we expected to find. Cost effectiveness also seems to be important in the differentiation strategies, which can be a sign of hard competition and may be important because a differentiation strategy may not be enough (similar discussions can be found in Greve, Perera et. al, Gyllberg & Svensson153). The importance of cost effectiveness especially among the companies with the two differentiation strategies, Customisation and Product development is also seen when looking at the second and third most important success factors. A total 18 out
153 Greve 1999, Gyllberg & Svensson 2002, Perera et.al 1997
- 60 -

Business Strategy and Management Control Measures for Success! K. Marshall - M. Snygg Classification of Business Strategies
of 19 Customisation and 12 out of 16 Product developing companies considers that cost effectiveness is one of the three most important success factors.
Strategy
Most important success factors Cost leader Marketing Customisation Product
developmentCustomer adaptation (in broad context) 2 5 6 Short term profits 1 Quality and service 1 1 6 4 Innovation ability 1 Flexibility in production 4 1 2 Cost effectiveness 3 2 5 3 Market effectiveness 1 Table 5.6 Most important success factors in different business strategies
5.3.1.2. Subcontractors
Table 5.7 shows that all Cost leader companies are subcontractors. This can indicate that these companies are very cost effective since they are under a large pressure to keep the costs at a low level. Companies with a Customisation strategy are the only companies where the majority aren’t subcontractors.
Subcontractor Strategy Yes No Cost leader 4 Marketing 5 4 Customisation 9 10 Product development 11 5 Table 5.7 The relationship between business strategies and subcontractors
- 61 -

Business Strategy and Management Control Measures for Success! K. Marshall - M. Snygg Creating Taxonomy for the Use of MCM
6. Creating Taxonomy for the Use of MCM In chapter six a taxonomy is created of the studied companies’ use of management control measures (MCM) to find similar clusters for the use of MCM.
The foundation for creating taxonomy for the use of MCM is the answers on the question B2 in the questionnaire, where the respondent was asked to state how frequently the company used each one of the 34 types of MCM. The taxonomy expresses the overall similarity between variables in a hierarchical fashion. In fact the taxonomy is built of sets of similar groups that are built into ever larger and increasingly subsuming groups. Elementary similarities between variables are first recognised and grouped into like populations in different hierarchical levels.154 A general difference between typology and taxonomy is that the typology is based on a deductive approach, whilst the taxonomy is based on an inductive approach, i.e. driven by data155. According to Rich the variables to be chosen for the data collection, can be chosen by two different approaches. One approach is named numerical empirical, and implies that the researcher collects a large and wide range of data and uses statistical analysis to decide which characteristics that discriminate others. An evaluation of the characteristics relevance is not necessary in the collection of data. The other approach (theoretic empirical) implies that the variables selected to collect the data for the development of taxonomy should be based on underlying theory.156 This study is based on the second approach, as we have started from Kaplan & Norton’s Balanced Scorecard model (described in paragraph 2.3.5 and 2.3.6). The theory connection is in some parts relatively weak. We have only chosen to present the different MCM and the use of measures in Kaplan & Norton’s Balanced Scorecard model157. This choice was made because we needed a model to present the measures and the use of them. The Balanced Scorecard model is recently developed, commonly known and gives us an opportunity to present the MCM in the model’s four different perspectives. The taxonomy is created by a cluster analysis. All MCM in our questionnaire are brought to its respective perspective according to the Balanced Scorecard model illustrated in figure 2.11. The number of variables used in the cluster analysis is hence four (one of each perspective described in the balanced scorecard model). To increase the feasibility of creating relatively feasible cluster analysis, we have created four indexes, representing each perspective in the BSC. The indexes then represent the total usage of the different types of measures. The index values are the mean values of the frequency of measure usage, in each respective perspective. The index values ranges from 1 (where none of the measures are used) to 7 (where all measures are used more frequently than once a month).
154 Rich 1992 155 Greve 1999 156 Rich 1992 157 Kaplan & Norton 1992
- 62 -

Business Strategy and Management Control Measures for Success! K. Marshall - M. Snygg Creating Taxonomy for the Use of MCM
6.1. Cluster Analysis of the Use of MCM
The cluster analysis of the different MCM perspectives was conducted by using hierarchical clustration, Ward’s method and Squared Euclidian Distance.
Figure 6.1 Dendogram of the use of MCM
- 63 -

Business Strategy and Management Control Measures for Success! K. Marshall - M. Snygg Creating Taxonomy for the Use of MCM
Three relatively pure MCM groups were the result of the cluster analysis, as seen in figure 6.1. The three black points illustrates our choice of clusters. The characteristics for each MCM group are presented below. (In appendix 9 we present boxplots of the result from the cluster analysis of the use of MCM.) MCM group 1: Traditional use of MCM. This group is characterised by a high use of financial measures, relatively low use of measures in the Innovation and learning perspective and in the Internal business perspective and a low use of measures in the Customer perspective. This group is named Traditional, because it consists of companies with a high use of financial measures. Measures in the other perspectives (non-financial measures) have a relatively low use frequency. These characteristics have a resemblance with the use of MCM in traditional MCS158. MCM group 2: Intense use of MCM. This group of companies is characterised by a relatively high use of both financial and non-financial measures. This group has the highest use of measures in the Innovation and learning perspective, the Internal business perspective and the Customer perspective. Group 1 has however a more frequent use of financial measures than this group, however the gap isn’t that big and we may still view group 2 as a high frequent group of using financial measures. This group is named Intense, because the high usage of both financial and non-financial MCM. Kaplan & Norton, among others, advocate that financial measures should be complemented with non-financial measures159. This characteristic can be seen in this group. MCM group 3: Simple use of MCM. Characteristic for these companies are the low use of almost every measure in each perspective. This group has a low use of measures in the financial perspective, the Innovation and learning perspective and in the Internal business perspective. The use of measures in the Customer perspective is relatively mediocre. This group of MCM is named Simple. Greve found in his study a group of companies with, what he named a Simple MCS. Characteristics for this MCS were that those models (planning, follow-up models etc.) that occurred were rather simple. It didn’t consist of non-financial measures or an environmental accounting. There seems to be some resemblance between the MCM group we named Simple and the Simple MCS that Greve found, concerning the use of MCM.
160
6.1.1. Further Analysis of the MCM
When comparing the companies’ owner structure with the three different measure groups (table 6.1), we can see a couple of characteristics. None of the family owned companies uses traditional MCM. Most of the family owned companies have a high use of both financial and non-financial MCM. Companies owned by foreign companies use a rather high share of simple MCM. Sheridan implies that subsidiaries to foreign companies don’t have the same degree of non-financial measures as Swedish companies161. 158 Ax et al. 2002 159 Kaplan & Norton 1992 160 Greve 1999 161 Sheridan 1995
- 64 -

Business Strategy and Management Control Measures for Success! K. Marshall - M. Snygg Creating Taxonomy for the Use of MCM
Measure groups Owner structure Traditional Intense Simple
Family owned 6 2 Owned by other Swedish companies 5 9 4 Owned by other foreign companies 3 8 5 Other owner structure 1 3 2 Table 6.1 Comparing owner structure and MCM group Interesting in table 6.2 is that companies using Traditional or Intense use of MCM considers that the company’s MCM focuses on factors critical for success to a large extent. Companies using a Simple use of MCM consider the company’s MCM focuses the least on factors critical for success.
MCM focus on CSF MCM group
None at all 1
2
3
4
Large extent5
Traditional 0 0 1 4 4 Intense 0 0 2 17 7 Simple 0 0 5 7 1 Table 6.2 The extent of companies’ use of MCM focus on the companies’ CSF Among smaller companies (100-199 employees) the use of MCM group is equally divided across the three MCM groups. These companies do not seem to prefer a special MCM group. Among larger companies (300-499 employees) the Intense MCM group is preferred, it seems like intense use of financial and non-financial measures are required in these companies. It is possible that companies see the need for a more complex MCS when they grow, evidently the need of the Intense MCM group has grown stronger already at 200-299 employees and totally dominates among companies with 300-499 employees as seen in table 6.3. A similar discussion concerning the increased need for formalised MCS when companies grow is held in Anthony & Govindarajan, Ax et.al and Gyllberg & Svensson162.
Number of employees MCM group 100-199 200-299 300-399 400-499 Traditional 7 2 Intense 11 6 7 2 Simple 11 1 1 Table 6.3 Companies’ size compared to the use of MCM
162 Anthony & Govindarajan 2001, Ax et.al 2002 & Gyllberg & Svensson 2002
- 65 -

Business Strategy and Management Control Measures for Success! K. Marshall - M. Snygg Effectiveness
7. Effectiveness In the two previous chapters the companies have been classified into different business strategy groups and groups of measures. In this chapter we will present an effectiveness index, which will be used to reflect how effective different combinations of MCM and business strategies are.
7.1. Measuring Effectiveness
Effectiveness is an abstract concept. Due to this it is very difficult to measure effectiveness. We have however tried to measure the effectiveness by using a self evaluative effectiveness model, previously used in studies conducted by among others Gupta & Govindarajan 1984; Govindarajan & Fisher 1990; Chenhall & Langfield-Smith 1998, Gyllberg & Svensson 2002. This type of effectiveness has proven to be one of the best ways to establish a company’s current goal fulfilment. An effectiveness index of this type often gives a more correct reflection of the company than studies of financial results and ratios.163 Gyllberg & Svensson compared the self-evaluative effectiveness index with an effectiveness index based on return on total capital over a three-year period. They reached the conclusion that the self-evaluative effectiveness index reflects the companies’ actual situation very well. One problem with using an effectiveness index based on financial ratios is that this index doesn’t regard sales prices that aren’t market based for example. The self-evaluative effectiveness index overlooks these problems.164 With this effectiveness index we can’t express a general opinion concerning the companies’ absolute value of effectiveness. The index isn’t used in this manner; however the index may be and is used to compare effectiveness among the studied companies. The model creates an effectiveness index, which is constructed as seen in figure 7.1. (Observe, this is an fictitious example) Question Level of success Importance Importance -1 Effectiveness index
1 2 3 4 5 6 7 8 9 10 11 12
5 7 5 3 3 3 6 5 4 6 4 5
4 5 4 5 5 4 4 3 5 4 5 3
3 4 3 4 4 3 3 2 4 3 4
2 39
5*3/39 = 0,38 7*4/39 = 0,72 5*3/39 = 0,38 3*4/39 = 0,31 3*4/39 = 0,31 3*3/39 = 0,23 6*3/39 = 0,46 5*2/39 = 0,26 4*4/39 = 0,41 6*3/39 = 0,46 4*4/39 = 0,41 5*2/39 = 0,26
4,59 ≈ 4,6 Figure 7.1. Model used for calculation of effectiveness index
163 Gyllberg & Svensson 2002 164 Gyllberg & Svensson 2002
- 66 -

Business Strategy and Management Control Measures for Success! K. Marshall - M. Snygg Effectiveness
Twelve factors are used to measure the companies’ effectiveness. The factors concern the companies’ Sales growth rate, Market share, Cash flow from operations, Operating profits, Profit to sales ratio, Return on investment, New product development, Market development, Personnel development, R&D activities, Cost level, and Public Relations (PR). Each respondent was asked to rate on a 7-point Likert type scale (ranging from 1, not at all satisfactory to, 7, outstanding) the company’s performance. The respondents were also asked to rate on a 5-point Likert type scale (ranging from 1, not at all important to 5, very important) the importance of each factor from the company’s point of view. In the model the importance is subtracted by 1, this is done because a company should be able to receive a total value between 0 (not at all effective) to 7 (very effective). As illustrated in figure 7.1 the company’s effectiveness is measured as a weighted mean value of the twelve factors. The value of how well the respondent stated the level of success is multiplied with the value of how well the same respondent stated the importance of each factor. The importance value of each factor is before the multiplication reduced with one, because success factors that are considered not at all important receive the weight zero. This value is then divided with the total sum of importance minus one, to calculate the effectiveness index for each factor. Finally all twelve factors are summarised to receive the company’s total effectiveness. To validate the effectiveness index, we have also used one additional measure. In the strategy variable section, we asked the respondents to state their company’s effectiveness in relation to its competitors. A stated 3 in the stated effectiveness field, should be and is approximately 4 in the effectiveness index, presented in Appendix 10. This effectiveness measure should to some extent correlate with the effectiveness index. The measure was placed in the strategy section of the survey, because we wanted a control question to see whether the respondents gave the correct information. In Appendix 10 all companies’ effectiveness index and stated effectiveness results are presented. The effectiveness indexes are varying from 3,1 as the lowest value, 6,4 as the highest value and the mean value is 4,5. The additionally used effectiveness measure correlates quite well with the effectiveness index, approximately 41 out of the total 48 companies have stated similar values on these two effectiveness measures.
- 67 -
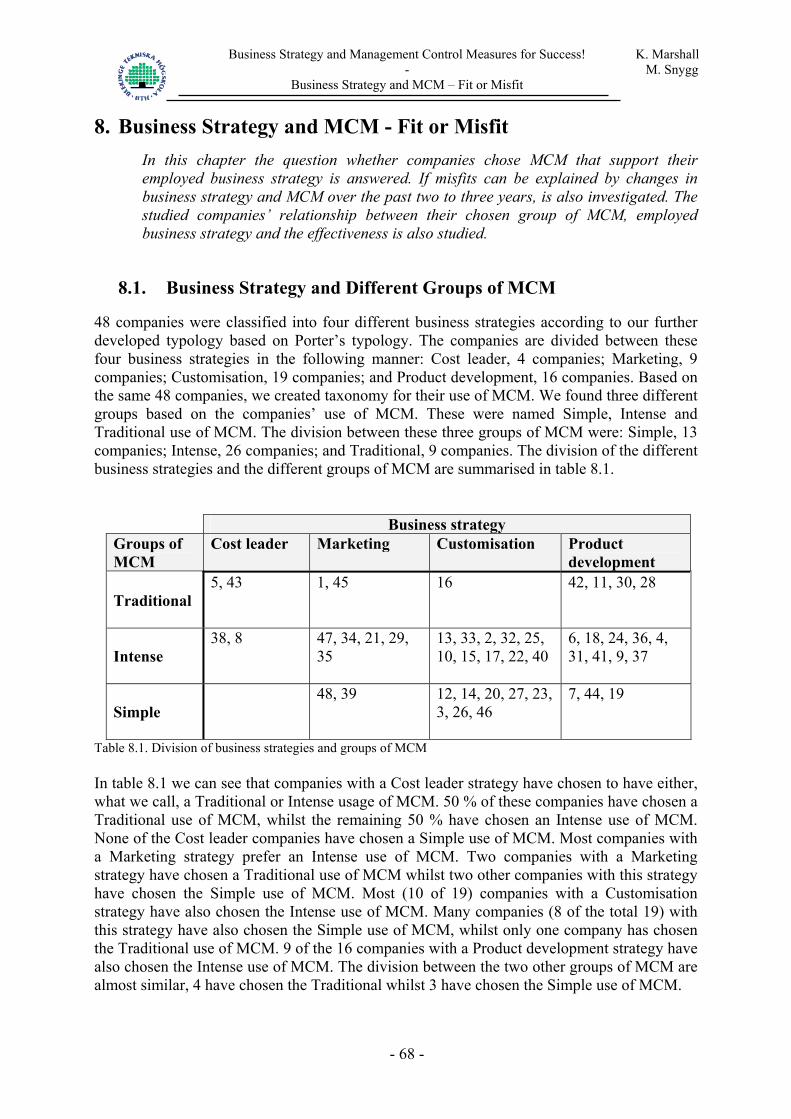
Business Strategy and Management Control Measures for Success! K. Marshall - M. Snygg Business Strategy and MCM – Fit or Misfit
8. Business Strategy and MCM - Fit or Misfit In this chapter the question whether companies chose MCM that support their employed business strategy is answered. If misfits can be explained by changes in business strategy and MCM over the past two to three years, is also investigated. The studied companies’ relationship between their chosen group of MCM, employed business strategy and the effectiveness is also studied.
8.1. Business Strategy and Different Groups of MCM
48 companies were classified into four different business strategies according to our further developed typology based on Porter’s typology. The companies are divided between these four business strategies in the following manner: Cost leader, 4 companies; Marketing, 9 companies; Customisation, 19 companies; and Product development, 16 companies. Based on the same 48 companies, we created taxonomy for their use of MCM. We found three different groups based on the companies’ use of MCM. These were named Simple, Intense and Traditional use of MCM. The division between these three groups of MCM were: Simple, 13 companies; Intense, 26 companies; and Traditional, 9 companies. The division of the different business strategies and the different groups of MCM are summarised in table 8.1.
Business strategy Groups of MCM
Cost leader Marketing Customisation Product development
Traditional
5, 43
1, 45
16
42, 11, 30, 28
Intense
38, 8
47, 34, 21, 29, 35
13, 33, 2, 32, 25, 10, 15, 17, 22, 40
6, 18, 24, 36, 4, 31, 41, 9, 37
Simple
48, 39
12, 14, 20, 27, 23, 3, 26, 46
7, 44, 19
Table 8.1. Division of business strategies and groups of MCM In table 8.1 we can see that companies with a Cost leader strategy have chosen to have either, what we call, a Traditional or Intense usage of MCM. 50 % of these companies have chosen a Traditional use of MCM, whilst the remaining 50 % have chosen an Intense use of MCM. None of the Cost leader companies have chosen a Simple use of MCM. Most companies with a Marketing strategy prefer an Intense use of MCM. Two companies with a Marketing strategy have chosen a Traditional use of MCM whilst two other companies with this strategy have chosen the Simple use of MCM. Most (10 of 19) companies with a Customisation strategy have also chosen the Intense use of MCM. Many companies (8 of the total 19) with this strategy have also chosen the Simple use of MCM, whilst only one company has chosen the Traditional use of MCM. 9 of the 16 companies with a Product development strategy have also chosen the Intense use of MCM. The division between the two other groups of MCM are almost similar, 4 have chosen the Traditional whilst 3 have chosen the Simple use of MCM.
- 68 -

Business Strategy and Management Control Measures for Success! K. Marshall - M. Snygg Business Strategy and MCM – Fit or Misfit
8.2. Business Strategy, Groups of MCM and Effectiveness
In this paragraph we present how effective different combinations of business strategies and groups of MCM are. Which group of MCM that best support the strategy is depending on which business strategy the company employs. From our approach (described in chapter 3) we assume that the companies’ choice of MCM group may affect the companies’ effectiveness depending on which business strategy the company employs. This approach implies to study differences in effectiveness among companies with different combinations of business strategy and MCM group. As described in paragraph 2.1.1 and 3.2.2.3 we have used an instrument developed by Govindarajan to measure this effectiveness amongst the studied companies. In determining which group of MCM that best support the strategy, different methods may be used and therefore a short discussion is held concerning this choice. One approach is to calculate an aggregated mean value of the effectiveness for the studied companies with different combinations of business strategies and types of MCM groups. The combination of the business strategy and the group of MCM that has the highest aggregated mean effectiveness is determined as the group of MCM that best support the strategy. This aggregated value may however be too rough. Another approach would be to calculate a mean value or the median value of the companies’ effectiveness value. Companies below the mean or median value would be determined as low effectiveness companies and vice versa. We assume this value may be either too high or too low and won’t reflect the companies’ actual effectiveness. One approach used in earlier studies within the same subject is to classify the studied companies as either high effective or low effective. In order to answer the question if “there are any differences regarding effectiveness between companies in the same situation, with different choices of MCS”, a comparison between companies’ situation, choice of MCS and effectiveness is made. The classification of companies as either high effective or low effective is made by comparing the companies return on investments and their own judgment of effectiveness using Govindarajan’s measurement instrument. Companies are classified as high effective as long as the ranking, according to their own judgment, doesn’t mean that the return on investments is below the mean value of the whole branch.165 We believe this method is most suitable since it compares each individual company’s effectiveness with the company’s branch. The final estimation concerning the companies effectiveness is hence partly based on the financial effectiveness and partly based on the companies own judgment. The method requires present data concerning the studied companies’ return on investments and the mean value of the whole branch’s return on investments if it should be comparable to the effectiveness index used. Since most companies’ annual accounts for 2003 haven’t been presented yet, we have had problems finding the required data. In year 2000 Gyllberg & Svenssson came to the conclusion that high effective companies had 4,3 or higher in the effectiveness index, after studying companies’ return on investments in relation to branch return on investments166. Although the financial pressure on companies has increased due to the weak development of the world economy since Gyllberg & Svensson’s study in 2000, we consider that all companies are in the same situation, which also will affect branch indexes, meaning no real effect on the bottom line result in these comparisons. We thereby consider
165 Gyllberg & Svensson 2002 166 Gyllberg & Svensson 2000
- 69 -

Business Strategy and Management Control Measures for Success! K. Marshall - M. Snygg Business Strategy and MCM – Fit or Misfit
that the limit of 4,3 will be suitable for us to use when deciding if the companies are low effective or high effective in our study. How the studied companies are classified is illustrated in table 8.2.
Company High eff.
25, 38, 18, 14, 20, 27, 36, 21, 17, 43, 12, 15, 47, 13, 28, 5, 45, 35, 41, 10, 4, 22, 26, 34, 33, 40, 24, 9, 37, 7, 48, 31, 44
Low eff.
39, 6, 2, 23, 8, 30, 16, 46, 1, 3, 29, 32, 19, 11, 42
Table 8.2 High and low effective companies The set limit for high respectively low effective companies is a critical part for the study’s result. To be able to get an indication of what would happen if the limit was set higher or lower than 4,3 we also tried setting the limit at 4,2 or 4,4 instead. Table 8.3 and 8.4 illustrates these results.
Company High eff.
25, 38, 18, 14, 20, 27, 36, 21, 17, 43, 12, 15, 47, 13, 28, 5, 45, 35, 41, 10, 4, 22, 26, 34, 33, 40, 24, 9, 37, 7, 48, 31, 44, 19, 11, 42
Low eff.
39, 6, 2, 23, 8, 30, 16, 46, 1, 3, 29, 32
Table 8.3 High and low effective companies at a limit of 4,2
Company High eff.
14, 20, 27, 36, 21, 17, 43, 12, 15, 47, 13, 28, 5, 45, 35, 41, 10, 4, 22, 26, 34, 33, 40, 24, 9, 37, 7, 48, 31, 44
Low eff.
39, 6, 2, 23, 8, 30, 16, 46, 1, 3, 29, 32, 19, 11, 42, 25, 38, 18
Table 8.4 High and low effective companies at a limit of 4,4 The result of small changes of the limit for high respectively low effective companies is that there are no radical changes of companies classified as either high or low effective.
8.3. Fit or Misfit Between MCM and Business Strategy
In this paragraph we will compare the result from the two previous paragraphs (8.1 and 8.2) in order to be able to answer the question whether companies chose management control measures that support their employed business strategy. Since the answer to this question is depending on which business strategy the companies employ, we will present the result for each respectively business strategy.
8.3.1. Cost Leader Strategy
In table 8.5 the result from the two previous paragraphs (8.1 and 8.2) concerning the Cost leader companies are put together.
- 70 -

Business Strategy and Management Control Measures for Success! K. Marshall - M. Snygg Business Strategy and MCM – Fit or Misfit
Traditional Intense Simple
High eff. Low eff. High eff. Low eff. High eff. Low eff. Companies with a Cost leader strategy
5, 43
38
8 - -
Table 8.5 Effectiveness and division of companies with a Cost leader strategy Among the Cost leader companies no company has chosen a Simple us of MCM. All companies with a Traditional use of MCM are considered to be high effective. Among the Cost leader companies with an Intense use of MCM we find one high effective and one low effective company. It is therefore difficult to draw any conclusion since the companies are divided equally between the two effectiveness groups. If the different combinations are compared it seems like a Traditional use of MCM better supports the Cost leader strategy than the Intense use of MCM does, i.e. having a larger focus on financial measures is more effective in these companies than having an Intense use of MCM. There exists a certain level of adaptation between business strategy and MCM among Cost leader companies. The two companies with the Traditional use of MCM are considered as fit, whilst the low effective company with an Intense use of MCM is considered as misfit. Low effective companies are viewed as misfits since these companies haven’t found a combination of structure and context that is viewed as effective. A further discussion is held in paragraph 2.1.1.
8.3.2. Marketing Strategy
In table 8.6 the result from the two previous paragraphs (8.1 and 8.2) concerning the Marketing companies are put together.
Traditional Intense Simple High eff. Low eff. High eff. Low eff. High eff. Low eff.
Companies with a Marketing strategy
45
1 47, 34, 21, 35
29
48 39
Table 8.6 Effectiveness and division of companies with a Marketing strategy Among the companies with a Marketing strategy equally many companies have chosen Traditional and Simple use of MCM. In both these groups there are one high effective and one low effective company. It is therefore also here difficult to draw any conclusion since the companies are divided equally between the two effectiveness groups. Most companies with an Intense use of MCM are however high effective. A comparison between the different combinations shows that an Intense use of MCM is considered to be more effective than a Traditional or a Simple use of MCM. It hence seems like there exists an adaptation and fit between business strategy and MCM among the companies with a Marketing strategy. The six high effective companies are viewed as fit, whilst the three low effective companies are viewed as misfits.
- 71 -

Business Strategy and Management Control Measures for Success! K. Marshall - M. Snygg Business Strategy and MCM – Fit or Misfit
8.3.3. Customisation strategy
In table 8.7 the result from the two previous paragraphs (8.1 and 8.2) concerning the Customisation companies are put together.
Traditional Intense Simple High eff. Low eff. High eff. Low eff. High eff. Low eff.
Companies with a Customisation strategy
-
16 13, 33, 25, 10, 15, 17, 22, 40
2, 32
12, 14, 20, 27, 26
23, 46, 3
Table 8.7 Effectiveness and division of companies with a Customisation strategy Only one company with a Customisation strategy has a Traditional use of MCM, this company is however considered to be low effective. A Simple use of MCM seems to give a certain support to companies with a Customisation strategy. Taking a closer look at the group “Simple use of MCM” we can see that this group is characterised by a low use of measures in the financial perspective, the innovation and learning perspective and the internal business perspective. The use of measures in the customisation perspective is however relatively mediocre. This may explain way a Simple use of MCM seems to give a certain support to companies with a Customisation strategy. Most high effective companies are also among the Customisation companies, found in the Intense group of MCM. A comparison between the different combinations also shows that an Intense use of MCM is considered to be more effective than a Traditional or a Simple use of MCM. It however seems like a Simple use of MCM may give some support to the Customisation companies. Also for companies with this business strategy it seems like there is an adaptation between business strategy and MCM. The six low effective companies are viewed as misfits, whilst the high effective companies are viewed as fits.
8.3.4. Product Development Strategy
In table 8.8 the result from the two previous paragraphs (8.1 and 8.2) concerning the Product development companies are put together.
Traditional Intense Simple High eff. Low eff. High eff. Low eff. High eff. Low eff.
Companies with a Customisation strategy
28
30, 11, 42
18, 24, 36, 4, 31, 41, 9, 37
6
7, 44
19
Table 8.8 Effectiveness and division of companies with a Product development strategy Also among Product development companies the Intense use of MCM is considered to be most effective. Only one company with an Intense use of MCM is considered to be low effective. Among the companies with a Traditional use of MCM we find one high effective company and three low effective companies. The Traditional use of MCM is hence considered to be less suitable for companies with a Product development strategy. Since the companies with a Simple use of MCM are divided almost equally between the two effectiveness groups, it is difficult to draw any conclusion concerning how well a Simple use
- 72 -

Business Strategy and Management Control Measures for Success! K. Marshall - M. Snygg Business Strategy and MCM – Fit or Misfit
of MCM supports companies with a Customisation strategy. If the different combinations are compared it seems like an Intense use of MCM better supports the Customisation strategy than the Simple or Traditional use of MCM does. Hence, it seems like there exists an adaptation between business strategy and MCM among these companies. The five low effective companies are viewed as misfits, whilst the high effective companies are viewed as fits. An interesting observation is that among all the Differentiation strategies an Intense use of MCM is the most effective use of MCM. Hence it seems like a combination of financial and non-financial MCM is very important among companies with a Differentiation strategy, whilst focusing more on financial measures is more important among companies with a Cost leader strategy. Another interesting observation is thus that the Simple design of MCM is not the most efficient design and use in any combination with one of the four business strategies.
8.4. Summary
Figure 8.1 summarises the results in the first sections of this chapter.
Business strategy Groups of MCM
Cost leader Marketing Customisation Product development
5, 43
45 28
High eff. Traditional
Low eff. 1
16 30, 11, 42
38
47, 34, 21, 35
13, 33, 25, 10, 15, 17, 22, 40
18, 24, 36, 4, 31, 41, 9, 37
High eff. Intense
Low eff. 8
29 2, 32 6
48
12, 14, 20, 27, 26
7, 44
High eff. Simple
Low eff. 39
23, 46, 3
19
Figure 8.1 Division of business strategies and groups of MCM This section of the study showed that the occurrence or different groups of MCM among companies with different business strategy differs. With a contingency approach this variance may be explained by that different business strategies require different information and that companies, to a large extent, choose the set of MCM that best support the requirements demanded. A contingency approach also implies that we could expect that companies in general chose the group of MCM that best support the employed business strategy.167 The analysis of effectiveness showed that the majority of companies chose the group of MCM that best supported the respective business strategies. The general conclusion must be that companies choose MCM that supports their employed business strategy. 167 Otley 1980
- 73 -

Business Strategy and Management Control Measures for Success! K. Marshall - M. Snygg Business Strategy and MCM – Fit or Misfit
The 15 low effective companies are viewed as misfits. In order to answer this study’s second framed question: “Can misfits between the companies’ management control measures and the companies’ business strategy be explained by changes in business strategy and management control measures over the past two to three years?”, the companies classified as misfits will be further analysed.
8.5. Misfits
In this section we will investigate if these misfits can be explained by changes in business strategy and management control measures over the past two to three years. In paragraph 8.5.1 eventual changes of business strategies over the past two to three years in these misfits companies will be studied. In paragraph 8.5.2 eventual changes of MCM group over the past two to three years in these misfit companies will be studied.
8.5.1. Eventual Changes of Business Strategy
The foundation for studying eventual changes in business strategy is a comparison of the respondents’ answers to the questions A7 and A8 in the questionnaire (Appendix 1 and 2). In these questions the respondents were asked to state the company’s position compared to the company’s competitors in the same branch, regarding 13 strategy variables both today and the same two to three years ago. To classify these companies’ business strategy two to three years ago, we have used the same typology (a further developed typology based on Porter’s typology) used to classify their present strategy belonging. The same factor analysis of the strategy variables and the same weightings of variables were used to classify the misfit companies’ business strategy two to three years ago as were used to classify their present business strategy (see paragraph 5.2). This was done because we wanted a method that divided the companies’ strategy belonging on the same foundations at the two points of times. To study each company individually was considered to be the most suitable method (see also paragraph 5.2.1.). Classification of the companies’ business strategies two to three years ago was done according to the factor analysis with the six strategy variables and the weight of them as described below. Product development strategy Percentage of turnover invested in development of existing products ½ Percentage of turnover invested in development of new products ½ Marketing strategy Services surrounding the product ½ Percentage of turnover invested in marketing ½ Customisation strategy Product quality ½ Specific product features ½
- 74 -

Business Strategy and Management Control Measures for Success! K. Marshall - M. Snygg Business Strategy and MCM – Fit or Misfit
Each company has been classified as the business strategy, which has the highest average value. The 15 misfit companies where divided between the four business strategies in the following manner, table 8.9. Product
development strategy
Marketing strategy
Customisation strategy
Cost leader strategy
Companies 42, 11, 30, 6, 19
1, 29, 39
16, 2, 32, 46, 3, 23
8
Total number of companies
5 3 6 1
Table 8.9 The misfit companies’ division between the four business strategies If we compare the result from the classification of the companies’ business strategies two to three years ago in figure 8.9 with the result from the classification of the companies’ present business strategies in figure 5.2 we can see that none of the 15 misfit companies have changed business strategy over the past two to three years. This result confirms to some extent, what some researchers within the subject state; that a change of business strategy is an extensive change for a company and it is therefore reasonable that these changes aren’t carried through very often.168 That several companies during a limited time would have changed strategy may therefore appear to be unlikely. Even though each one of the four business strategies in this study has its unique characteristics and Porter warns companies not to get “stuck in the middle”169, the border between two or more strategies isn’t always that clear. Single companies may to a varying extent deviate from the different strategies ideal profile and thereby get closer to another business strategy’s characteristics. This may imply a sliding changeover between strategies, which doesn’t need to be viewed as an extensive change. If several companies have strategies, where it is difficult to distinguish any specific type, the relationship between business strategy, group of MCM and effectiveness will reasonably be weaker. In this study’s classification of the companies’ present business strategy and the business strategy two to three years ago, there weren’t many companies that were difficult classifying because of the problem to distinguish any specific strategy type. No shift in business strategies was found among the misfit companies, meaning that none of these companies have had an “extensive” or sliding changeover between strategies during the last two to three years.
8.5.2. Eventual Changes of MCM Group
Besides studying eventual changes in business strategy among the misfit companies, it is also interesting to study eventual changes in MCM group amongst the misfit companies to decide if these misfits can be explained by changes in either business strategy or MCM over the past two to three years ago. The foundation for studying eventual changes of MCM group is a comparison of the respondents’ answers on question B2 in the questionnaire (Appendix 1 and 2). In this question the respondents were asked to state their present use of 34 MCM and the use of the same MCM two to three years ago.
168 Greve 1999 169 Porter 1980
- 75 -
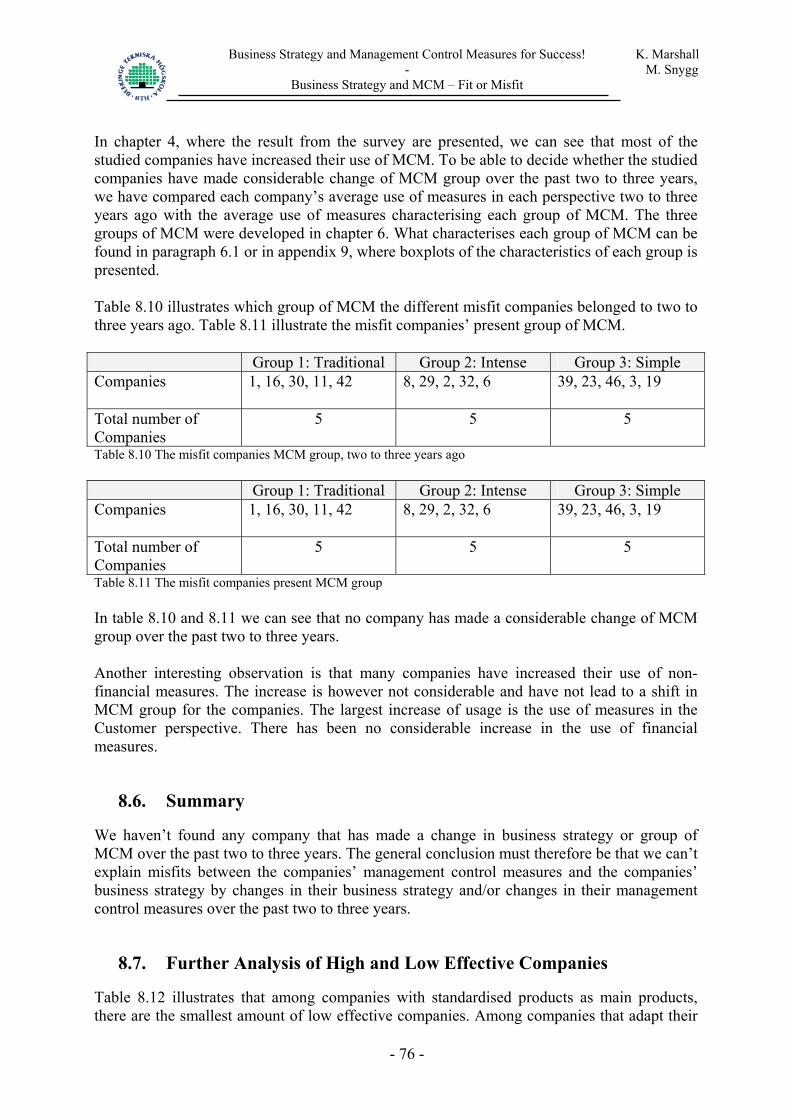
Business Strategy and Management Control Measures for Success! K. Marshall - M. Snygg Business Strategy and MCM – Fit or Misfit
In chapter 4, where the result from the survey are presented, we can see that most of the studied companies have increased their use of MCM. To be able to decide whether the studied companies have made considerable change of MCM group over the past two to three years, we have compared each company’s average use of measures in each perspective two to three years ago with the average use of measures characterising each group of MCM. The three groups of MCM were developed in chapter 6. What characterises each group of MCM can be found in paragraph 6.1 or in appendix 9, where boxplots of the characteristics of each group is presented. Table 8.10 illustrates which group of MCM the different misfit companies belonged to two to three years ago. Table 8.11 illustrate the misfit companies’ present group of MCM. Group 1: Traditional Group 2: Intense Group 3: Simple Companies 1, 16, 30, 11, 42
8, 29, 2, 32, 6 39, 23, 46, 3, 19
Total number of Companies
5 5 5
Table 8.10 The misfit companies MCM group, two to three years ago Group 1: Traditional Group 2: Intense Group 3: Simple Companies 1, 16, 30, 11, 42
8, 29, 2, 32, 6
39, 23, 46, 3, 19
Total number of Companies
5 5 5
Table 8.11 The misfit companies present MCM group In table 8.10 and 8.11 we can see that no company has made a considerable change of MCM group over the past two to three years. Another interesting observation is that many companies have increased their use of non-financial measures. The increase is however not considerable and have not lead to a shift in MCM group for the companies. The largest increase of usage is the use of measures in the Customer perspective. There has been no considerable increase in the use of financial measures.
8.6. Summary
We haven’t found any company that has made a change in business strategy or group of MCM over the past two to three years. The general conclusion must therefore be that we can’t explain misfits between the companies’ management control measures and the companies’ business strategy by changes in their business strategy and/or changes in their management control measures over the past two to three years.
8.7. Further Analysis of High and Low Effective Companies
Table 8.12 illustrates that among companies with standardised products as main products, there are the smallest amount of low effective companies. Among companies that adapt their
- 76 -

Business Strategy and Management Control Measures for Success! K. Marshall - M. Snygg Business Strategy and MCM – Fit or Misfit
products either to each individual customer or to different groups of customer, the spread of low and high effective companies is more equal.
Effectiveness Main products High Low Adapted to each individual customer
17 12
Adapted to different customer groups
5 2
Standard products 11 1 Table 8.12 Comparison of high and low effective companies’ main products As illustrated in table 8.13 the divisions of high and low effective companies are almost equally spread among companies that are subcontractors. However, among companies that aren’t subcontractors the number of low effective companies is much lower, whilst the number of high effective companies is high.
Effectiveness Subcontractor High Low Yes 16 13 No 17 2 Table 8.13 Comparison of companies that are and aren’t subcontractors and their effectiveness Another interesting observation is made if we join parts of the studied companies’ environment and situation in relation to the result in figure 8.1. This is illustrated in figure 8.2
Business strategy Groups of MCM
Cost leader Marketing Customisation Product development
5, 43 45
28
High eff. Traditional
Low eff. 1
16 30, 11, 42
38
47, 34, 21, 35
13, 33, 25, 10, 15, 17, 22, 40
18, 24, 36, 4, 31, 41, 9, 37
High eff. Intense
Low eff. 8
29 2, 32
6
48
12, 14, 20, 27, 26
7, 44
High eff. Simple
Low eff. 39
23, 46, 3
19
Figure 8.2 Division of business strategies and groups of MCM We can see that most low effective companies are subcontractors, independent of business strategy or group of MCM. It is also interesting to note that most low effective companies with a Simple or a Traditional use of MCM are small companies i.e. 100-199 employees. The majority of the low effective companies with an Intense use of MCM are also smaller companies i.e. less than 299 employees.
- 77 -

Business Strategy and Management Control Measures for Success! K. Marshall - M. Snygg Business Strategy and MCM – Fit or Misfit
A comparison of the low effective companies and the branches, in which these companies are active, gave quite interesting results. In table 8.14, we can see that all the studied companies in the Telecom product industry are low effective. A high share of misfit companies is also found in the SNI-groups 29, 34 and 36. It is important to note that the numbers of studied companies in each of the different SNI-groups are too few, to be able to draw any general conclusions.
SNI-group Number of companies in our study
Misfit companies
26. Soil and stone goods industry 3 0 27. Steel and metal industry 4 1 28. Metal goods industry except machines and apparatus
10 1
29. Machine industry that isn’t included in other SNI-groups
13 5
30. Office machinery and computer industry
1 0
31. Other electronic industry 3 1 32. Telecom product industry 2 2 33. Industry for precision-, medical- and optical instruments
3 0
34. Motor vehicle and trailer industry 4 3 35. Other means of transport industry
1 0
36. Furniture industry; other manufacturing industry
4 2
Sum 48 15 Table 8.14 The branches, in which the low effective companies are active
- 78 -
Business Strategy and Management Control Measures for Success! K. Marshall - M. Snygg Results
9. Results In this finial chapter the study’s result and conclusions are presented. Suggestions to further studies are presented at the end of this chapter.
9.1. Summary
This thesis studied the relationship between business strategy and management control measures in Swedish medium sized manufacturing companies. The two framed questions were:
Do companies choose Management Control Measures (MCM) that supports their employed business strategy?
Can misfits between the companies’ management control measures and companies’ business strategy be explained by changes in business strategy and management control measures over the past two to three years?
A further developed typology based on Porter’s typology was used to classify the studied organisation’s business strategy. The companies were classified into one out of four business strategies. We used cluster analysis to create categories (Taxonomy) for the companies’ use of MCM. Three different groups of MCM usage were found. An instrument developed by Govindarajan was used to measure the effectiveness in companies with different combinations of MCM group and business strategy. The studied companies were classified as either high or low effective. A comparison is made between the companies’ business strategy, group of MCM and effectiveness to determine if companies choose MCM that supports their employed business strategy. In high effective companies, we draw the conclusion that there is a form of fit between MCM and business strategy. In low effective companies, we draw the conclusion that there exists a form of misfit between MCM and business strategy. These misfits were further studied to be able to answer the second framed question.
9.2. Conclusion
The analysis of business strategy, MCM and effectiveness showed that the majority of companies choose MCM that best supports the employed business strategy. The general conclusion must therefore be that companies choose MCM that supports their employed business strategy. The study showed that a Traditional use of MCM best supports the Cost leader strategy, i.e. having a larger focus on financial measures is more effective in these companies than having an Intense use of MCM. In all the Differentiation strategies an Intense use of MCM is the most effective use of MCM. A Traditional use of MCM is considered to be less suitable for companies with a Differentiation strategy. Hence it seems like a combination of financial and non-financial MCM is very important among companies with a Differentiation strategy, whilst focusing more on financial measures is more important among companies with a Cost leader strategy. The Simple use of MCM however seems to give a certain support to companies with a Customisation strategy. Taking a closer look at the group Simple use of
- 79 -
Business Strategy and Management Control Measures for Success! K. Marshall - M. Snygg Results
MCM we can see that this group is characterised by a low use of MCM in the financial perspective, the innovation and learning perspective and the internal business perspective. The use of MCM in the customisation perspective is however relatively mediocre. This may explain why a Simple use of MCM seems to give a certain support for companies with a Customisation strategy. Companies with a Simple use of MCM are companies that consider their use of MCM least focusing on factors critical for success compared to companies with other groups of MCM. Companies with 100-199 employees don’t seem to prefer a certain group of MCM, whilst the larger companies prefer the Intense MCM group. In the study we didn’t find any company that had changed business strategy or group of MCM over the past two to three years. The conclusion made is therefore that we can’t explain misfits between the companies’ MCM and their business strategy by changes in the companies’ business strategy and/or changes in their MCM over the past two to three years. Interesting to note is that 12 out of 15 low effective companies are subcontractors.
9.2.1. Other Conceivable Explanations to the Misfits
One explanation to the misfits may be that the condition for adaptation of the MCM according to the employed business strategy isn’t similar for companies in corporations and completely independent companies. Nilsson found in his research that corporation managers’ demand for joint report routines in a corporation could reduce the business units’ opportunity to adapt its MCS to the current situation. The possibility was greater when the corporation employed a portfolio strategy at the corporate level meanwhile the business units employed a Differentiation strategy.170 In our study we have not taken these corporation relations into consideration. We can however see that many of the studied companies are owned by other Swedish or foreign companies and it is possible that corporation managers’ demand for joint report routines could reduce the studied companies’ opportunity to adopt their MCM to the current situation. This could explain some of the misfits. In question B3, the respondents were asked to state which of five financial MCM that regularly is reported to the owner/owners and to what extent these measures affect the internal control. The result form the question showed that the owners often have a large influence on the companies design and use of MCM. Also Bromwich & Bhimani states that external stakeholders have a large influence on companies’ management control.171 Another explanation could be that the misfit companies simply don’t use MCM that reflect their critical success factors. The company thereby risks not knowing how they perform in those areas that are critical for the company’s success, which may lead to that wrong decision, are made. In our survey we asked the respondents to rank the three most important factors for the company’s success, (see question A9 in Appendix 1 and 2). We also asked them to state the five most essential MCM of the companies’ internal control, (see question B4 in Appendix 1 and 2). By comparing these two answers we believe we will get an indication if the misfit companies’ use of MCM that reflect their critical success factors and if they thereby measure the companies’ performance in the different critical success factors. All misfit companies
170 Nilsson 1997 171 Bromwich & Bhimani 1996 in Gyllberg & Svensson 2002
- 80 -
Business Strategy and Management Control Measures for Success! K. Marshall - M. Snygg Results
have stated different financial measures to be the most essential MCM for the company. Amongst the five most essential MCM some respondents have stated at the most one non-financial MCM e.g. scrap, delivery safety. Almost every company has stated that cost effectiveness is an important critical success factor. It is therefore reasonable to use different financial MCM to measure this critical success factor. However, almost every company have stated one or more critical success factor besides cost effectiveness, which can’t or is very difficult to measure with financial MCM. Due to most respondents statement that almost only financial MCM are the most essential MCM and despite the use of critical success factor that can’t or is very difficult to measure with financial MCM, the result must be that misfit companies are poor at using MCM that reflect their CSF. Some of these companies don’t measure their performance in their stated CSF. This result reflect what Johansson et al. found in their study, that many companies have problem focusing their MCS on the companies’ CSF172.
9.3. Is the Study’s Results Reasonable?
We have found support for our study’s results in some earlier studies. The studied companies were classified as one of four business strategies. From the gathered empirical data we also developed three groups of MCM. Different combinations of strategy and MCM group were studied to find the most effective combination for the companies with the different strategies. We found that a traditional use of MCM (high use of financial measures and relatively low use of non-financial measures) were the most effective use of measures in companies with a Cost leader strategy. We can find some support to our classification of business strategies in Gyllberg & Svensson’s study. Their study was conducted on medium sized manufacturing companies in Sweden. Most of their companies were classified as having either a Product development strategy or a Customisation strategy.173 Our classification gave almost similar results among Differentiation strategies. However, Gyllberg & Svensson didn’t find any companies with a Cost leader strategy. Greve found one company with a distinct Cost leader strategy. Further he found some additional companies, which could be classified as Cost leaders. Due to too few companies classified as Cost leaders (in comparison to the total population), Greve didn’t use this strategy.174 We did however find four Cost leader companies amongst the total 48 companies. We can hence find some support of our classification companies with a Cost leader strategy in Greve’s study. Nilsson establishes in his study that financial MCM are important in companies with a Cost leader strategy. The argument for this is that companies that strive to reach the lowest costs need to have an intensive focus on costs. In contrast to this, non-financial measures are assumed to be very important in companies employing a Differentiation strategy. Companies with a Differentiation strategy have a number of critical success factors that are important for the customers to be willing to pay extra for these products. To be able to implement this strategy, these critical success factors need to be measured and followed up by some non-
172 Johansson et al. 1997 173 Gyllberg & Svensson 2002 174 Greve 1999
- 81 -

Business Strategy and Management Control Measures for Success! K. Marshall - M. Snygg Results
financial MCM.175 Also Bruggeman & Van der Stede found that Cost leader strategies require a tight control of costs and revenues, were financial measures are important.176 Perera et al. found that customer focused manufacturing companies have an intense use of non-financial MCM177. In this study we found an Intense use of MCM are most effective in companies with a Differentiation strategy. This Intense use of MCM implies a high use of both financial and non-financial MCM. This result is hence partly supported by Nilsson’s, Bruggeman & Van der Stede’s and Perera’s study. There are studies indicating that financial MCM are important in most companies independent of strategic concentration. Lind studied the use of MCM in real-estate companies with different strategies (either a cost leader or a differentiation strategy). He found that all companies had an intense use of financial MCM, in spite that seven out of eight companies had a differentiation strategy.178 This study is also supported by Simon’s survey study of the relationship between business strategy and financial control. Simon used Miles & Snow’s strategy typology. As mentioned before in paragraph 1.2 and chapter 2, there are distinct similarities between Miles & Snow’s and Porter’s typologies, were a Defender is similar to a Cost leader and a Prospector has some characteristics with the Differentiation strategy. Simons found that Prospectors had a more intense MCS use than the Defenders had.179 We found the same result in our study, where companies with a Differentiation strategy had a more intense use of MCM than companies with a Cost leader strategy. The study’s result also gives an indirect support of the normative literature that has grown forward since the beginning of the 1990’s. In accordance to their line of argument that financial measures are important independent of the employed business strategy,180 we found an intense use of financial MCM was most effective in companies with both a Cost leader and a Differentiation strategy. The companies with a Differentiation strategy had beside the intense use of financial MCM also an intense use of non-financial MCM. However, Kaplan & Norton argues that financial measures should show the effects of non-financial activities and achievements.181 Hence, non-financial MCM are important and often has a connection to the financial MCM. The study’s general conclusion is that companies choose MCM that supports their employed business strategy. Greve found in his study that companies didn’t adapt their MCS in a manner, which implies that the MCS should be viewed as supporting the employed business strategy. Among all companies classified into one of Greve’s three business strategies only companies with a customisation strategy used MCS that supported these companies business strategy.182 Greve used six variables to describe the companies MCS. We have only studied the companies MCM, which could be seen as one variable of a company’s MCS. This could explain the difference between the studies. There are however studies indicating that companies adapt their MCS to the companies’ present situation. Gyllberg & Svensson used three situation factors, among them business strategy. They found that high effective medium
175 Nilsson 1997 176 Bruggeman & Van der Stede 1993 177 Perera et al. 1997 178 Lind 2000 179 Simons 1990 180 Lynch & Cross 1991, Kaplan & Norton 1992 181 Kaplan & Norton 1992 182 Greve 1999
- 82 -
Business Strategy and Management Control Measures for Success! K. Marshall - M. Snygg Results
sized companies adapted their MCS to the companies’ present situation.183 These two studies aren’t directly comparable to our study. Gyllberg & Svensson’s study however gives a certain support to our study, because of the result that some companies adapt their MCS to the companies’ present situation.
9.4. Suggestions to Further Studies
In chapter 5, we tried to classify the studied companies according to both Miles & Snow’s and our own further developed typology based on Porter’s typology. We didn’t get satisfying results when we classified the companies according to Miles & Snow’s typology. It would be interesting to study if Miles and Snow’s typology is too old, doesn’t reflect companies current situation and if it isn’t possible to classify similar companies by using more strategy variables than we did. An interesting observation we made was that Miles & Snow’s Analyzer strategy was very wide and almost consisted of two clusters. It would hence be interesting to further study this strategy, could it be divided into two or more strategies? The study’s result showed distinct differences between smaller medium sized companies (100-199 employees) and larger medium sized companies (200-499 employees) in their use of MCM. We would recommend a study between both medium sized companies and large companies, where the limit for a medium sized company is set at 200-499 employees, because companies with less than 200 employees don’t seem to pay that much attention to the choice of MCM. A question we have asked our selves during the process of writing the thesis is how a taxonomy based on companies’ business strategy would look today. To which extent are companies today competing with logistics and e-commerce for example? Would this result in new strategies compared to the three business strategies once described by Porter? It would also be interesting to investigate if a similar study in other branches would result in similar conclusions. A qualitative study of the companies that were considered to be misfits would be interesting to conduct, to further investigate what the reasons are to the companies being misfits.
9.5. The Authors’ final words
With the following Latin proverb, we would like to finish this thesis.
“Feci guod potui, faciant meliora potentes”
(We have done what we could, may now they, who can, do better)
183 Gyllberg & Svensson 2002
- 83 -
Business Strategy and Management Control Measures for Success! K. Marshall - M. Snygg References
References Abrahamsson, B. & Andersen J. A. (1996) Organisation - att beskriva och förstå
organisationer. Malmö : Liber-Hermods, ISBN 91-23-01761-9
Anthony, R. N. & Govindarajan, V. (2001) Management Control Systems.
Singapore : McGraw-Hill Book Co, ISBN 0-07-118100-8 Aronsson, Å. (1999) SPSS – En introduktion till basmodulen Lund : Studentlitteratur, ISBN 91-44-01129-6 Arwidi, O. & Samuelson, L. A. (1991) Budgetering i industriföretagets styrsystem.
Stockholm : Mekanförbundets Förlag, ISBN 91-524-1112-3 Ax, C., Johansson, C. & Kullvén, H. (2002) Den nya Ekonomistyrningen.
Malmö : Liber Ekonomi, ISBN 91-47-06415-3 Bergström, I. & Lumsden, M. (1993) Ekonomisystem i mindre företag. Luleå : Tekniska Högskolan Luleå, ISSN 0348-8373 : 124D Burlid, H.-P. & Rezai, A. (2003) ”Styrning för framgång” Blekinge : Bachelor thesis at Blekinge Institute of Technology Chenhall, R. H. & Langfield-Smith (1998) The Relationship Between Strategic Priorities,
Management Techniques and Management Accounting: An Empirical Investigation Using a Systems Approach Accounting, Organizations and Society, Vol. 23, no.3, 243-264
Darmer P. & Freytag P. V. (1995) Företagsekonomisk undersökningsmetodik. Lund : Studentlitteratur, ISBN 91-44-49211-1 Dinesh, D. & Palmer, E. (1998) Management by objectives and the Balanced Scorecard: will
Rome fall again? Management Decision, vol. 36, no. 6: 363-369
Emmanuel, C., Otley, D. & Merchant, K. (1990) Accounting for Management Control.
London : Chapman & Hall, ISBN 0-412-37480-3 Ewing, P. & Samuelson, L. A. (1998) Styrning med balans och fokus.
Malmö : Liber Ekonomi, ISBN 91-47-04323-7 Frenckner, P. (1983) Begrepp inom ekonomistyrningen – en översikt.
Lund : Studentlitteratur, ISBN 91-44-43551-7 Ghauri, P. & Grønhaug, K. (2002) Research Methods in Business Studies: A Practical Guide.
Harlow : Pearson Education Limited, ISBN 0-273-65110-2

Business Strategy and Management Control Measures for Success! K. Marshall - M. Snygg References
Govindarajan, V. (1988) A contingency approach to strategy implementation at the business- unit level: Integrating administrative mechanisms with strategy. Academy of Management Journal, Vol. 31, no. 4: 828-853
Greve, J. (1999) Ekonomisystem och affärsstrategier.
Uppsala : Reprocentralen, Ekonomikum, ISSN 1103-8454 Gupta, A. K. & Govindarajan, V. (1984) Business Unit Strategy, Managerial
Characteristics, and Business Unit Effectiveness at Strategy Implementation Academy of Management Journal, Vol. 27, no. 1, 25-41. Gyllberg, H. & Svensson L. (2000) Ekonomistyrsystem och situationstyper i medelstora tillverkande företag - Föreställningar om ekonomistyrningens relevans. Lund : Ekonomihögskolan, Univ. (Lic.-avh.) Gyllberg, H. & Svensson L. (2002) Överensstämmelse mellan situationer och ekonomistyrsystem – en studie av medelstora företag.
Lund : Lund Business Press, ISBN 91-971179-3-5 Hatch, M. J. (2002) Organisationsteori: moderna, symboliska och postmoderna perspektiv.
Lund : Studentlitteratur, ISBN 91-44-02128-3 Hatten, K. J., Schendel, D. E. & Cooper, A. C. (1978) A Strategic Model of the U.S. Brewing
Industry: 1952-1971. Academy of Management Journal, vol 21, no 4 : 592-610
Holme, I. M. & Solvang B. K. (1997), Forskningsmetodik – om kvalitativa och kvantitativa
metoder. Lund : Studentlitteratur, ISBN 91-44-00211-4
Hope, J. & Hope, T. (1997), Competing in the Third Wave.
Boston Mass. : Harvard Business School Press, ISBN 0-87584-807-9 Johansson, C., Nilsson, G., Nilsson, J. & Samuelson L. A. (1997) ”Ekonomistyrning i svenska
börsbolag : en lägesrapport om ekonomistyrningens inriktning, utformning och utveckling”. Stockholm : EFI Research Paper nr 6575, ISSN 0349-4446 : 6575
Johansson, C., & Samuelson, L. A. (1998) “The design and use of management accounts in
small and medium-sized companies”. Stockholm : SSE/EFI Working Paper Series in Business Administration No. 2
Johnson, G. & Scholes, K (2002) Exploring corporate strategy: text and cases.
Harlow : Financial Times Prentice Hall, ISBN 0-273-65112-9 Johnson, T. & Kaplan, R. (1987) The Rise and Fall of Management Accounting
Management Accounting

Business Strategy and Management Control Measures for Success! K. Marshall - M. Snygg References
Kaplan, R. S. & Norton, D. P. (1992) The Balanced Scorecard – Measures That Drive Performance
Harvard Business Review, vol. 70 no. 1 : 71-79 Kaplan, R. S. & Norton, D. P. (1996) Using the Balanced Scorecard as a Strategic
Management System Harvard Business Review, vol. 74 no. 1 : 75-85 Karlöf, B. (1989) Affärstrategi.
Visby : Affärsvärlden Förlag AB, ISBN 91-85804-19-3 Klefsjö, B. & Hellmer, S. (1991) Räkna med slumpen. Lund : Studentlitteratur, ISBN 91-44-32191-0 Kullvén, H. (2001) Ekonomisk styrning : grunder och perspektiv Malmö : Liber ekonomi, ISBN 91-47-06160-X Langfield-Smith, K. (1997) Management Contol Systems and Strategy: A Critical Review Accounting, Organizations and Society, Vol. 22, no. 2. 207-232 Lind, J.-I. & Skärvad, P.-H. (1997) Nya team i organisationernas värld.
Malmö : Liber AB, ISBN 91-47-04042-4 Lind, J. (1996) Ekonomistyrning och verksamhet i utveckling Uppsala : Department of Business Studies, ISSN 1103-8454 Lind, J. (2000) Strategi och ekonomistyrning i fastighetsföretag.
Økonomistyrning & informatik. Jurist- og Økonomforbundet, no 4:285-306 Lundahl, U. & Skärvad, P.-H. (1999) Utredningsmetodik för samhällsvetare och ekonomer. Lund : Studenlitteratur, ISBN 91-44-01003-6 Lynch, R. L. & Cross, K. F. (1991) Measure up! : Yardsticks for Continuous Improvement Oxford : Blackwell, ISBN 1-55786-099-8 Merchant, K. & van der Stede, W (2003) Management Control Systems : Performance
Measurement, Evaluation and Incentives Harlow : Financial Times Prentice Hall, ISBN 0-273-65596-5
Miles, R. E. & Snow C. C. (1978) Organizational Strategy, Structure, and process. New York : McGraw-Hill, ISBN 0-07-041932-9 Miles, R. E., Snow C. C., Meyer, A. D. & Coleman, H. J. (1978) Organizational Strategy,
Structure, and process Academy of Management, no. 3, 546-562 Miles, R. E. & Snow C. C. (2003) Organizational Strategy, Structure, and process.
Stanford : Stanford University Press, ISBN 0-8047-4840-3

Business Strategy and Management Control Measures for Success! K. Marshall - M. Snygg References
Mintzberg, H. (1978) Patterns in Strategy Formation Management Science : journal of the Institute of Management Science, 934-948
Mintzberg, H. (1988) Generic Strategies: Toward a Comprehensive Framework Advances in Strategic Management, no. 5, 1-67 Mintzberg, H. (1994) The Rise and Fall of Strategic Planning. Cornwell : Prentice Hall, ISBN 0-13-781824-6 Nilsson, F. (1997) “Strategi och ekonomisk styrning : en studie av hur ekonomiska styrsystem
utformas och används efter företagsförvärv” Linköping : Linköping studies in science and technology. Diss., ISSN 0345-7524:475
Nutek (1994) Småföretagen - Sveriges framtid? : fakta om svenskt småföretagande Nutek Nutek (1996) Småföretagen i Sverige 1996 Nutek Nørreklit, H. (2000) The balance of the balanced scorecard – a critical analysis of some of its
assumptions Management Accounting Research, no. 11 : 65-88
Olve, N-G., Roy, J. & Wetter, M. (1999) Balanced Scorecard i svensk praktik Malmö : Liber AB, ISBN 91-47-04485-3 Otley, D. T. (1980) The Contingency Theory of Management Accounting: Achievement and
prognosis Accounting, Organizations and Society, vol. 5, no. 4, 413-428
Perera, S., Harrison G. & Poole, M. (1997) Customer-focused manufacturing strategy and the use of operations-based non-financial performance measures: a research note
Accounting, Organizations and Society, vol. 22, no. 6, 557-572 Porter, M. E. (1980) Competitive Strategy: Techniques for Analyzing Industries and
Competitors. New York : The Free Press, ISBN 0-02-925360-8
Rich, P. (1992) The Organizational Taxonomy: Definition and Design The Academy of Management Review, vol. 17, no 4, 758-781 Rohlin, L., Nilsson, S. Å. & Skärvad, P.-H. (1994) Strategiskt Ledarskap i lärsamhället.
Dalby : MiL Publisher, ISBN 91-86312-01-4 Samuelson, L. A. (2001) Controllerhandboken.
Stockholm : VI, Sveriges Verkstadsindustrier, ISBN 91-7548-623-7
Business Strategy and Management Control Measures for Success! K. Marshall - M. Snygg References
Sheridan, T. T (1995) Management Accounting in Global European Corporations; Anglophone and continental viewpoints Management Accounting Research, vol. 6, no. 3, 287-295
Simons, R. (1987) Accounting Control Systems and Business Strategy: an Empirical
Analysis. Accounting, Organizations and Society, 12, no 4: 357-374
Simons, R. (1990) The Role of Management Control Systems in Creating Competitive
Advantage: New Perspectives. Accounting, Organizations and Society, Vol. 15, no. 1, 127-143
Snow, C. C. & Hambrick, D. C.(1980) Measuring Organizational Strategies: Some
Theoretical and Methodological Problem Academy of Management, 10, no 5: 527-538
Svensson, C. & Svensson, L. (1995) Förstå bokslut, budget och redovisning.
Stockholm : Utbildningsförlaget Brevskolan, ISBN 91-574-4451-X Toba, K. (1981) How Japanese and Western Management Differ Dentsu, Japan Marketing, no. 18, 17-20
Vesterlund, C., Lundström, A. & Gandemo, B. (1998) ”Vad har hänt med en grupp
medelstora tillverkningsföretag : Tillväxt, stagnation eller död? Örebro : Forum för småföretagsforskning, FSF 1998:5
Electronic References Affärsdata 2004-03-20 www.ad.se SPSS 11.0 tutorial Statistical software, with included tutorial

Appendix 1 K. Marshall - M. Snygg Survey - Swedish
Företagets namn: Kontaktperson: Kontaktinformation: Företagsnummer: Var vänlig och markera ditt svarsalternativ med fet stil! Företagets Strategi A1 Antal anställda i företaget
1. 100-199 2. 200-299 3. 300-399 4. 400-499
A2 Hur ser företagets huvudsakliga ägarbild ut? (Avser den juridiska enheten)
1. Familjeägt, direkt eller via annat företag 2. Ägt av annat svenskt företag 3. Ägt av annat utländskt företag 4. Annat:_______________________
A3 Företagets produktion sker mot:
1. Order 100% 2. Order/Lager 75%/25% 3. Order/Lager 50%/50% 4. Lager/Order 75%/25% 5. Lager 100%
Företagets produktion sker i:
1. Korta serier 100% 2. Korta/Långa serier 75%/25% 3. Korta/Långa serier 50%/50% 4. Långa/Korta serier 75%/25% 5. Långa serier 100%
A4 Är företaget huvudsakligen underleverantör till annat/andra företag Ja / Nej I vilken utsträckning är företaget beroende av en underleverantör eller ett fåtal underleverantörer? Inget Mycket stort 1 2 3 4 5
- I -

Appendix 1 K. Marshall - M. Snygg Survey - Swedish
A5 Hur stor är företagets marknadsandel på dess huvudmarknad?
1. 0-10% 2. 11-25% 3. 26-50% 4. 51-75% 5. 76-100%
För två till tre år sedan, hur stor var företagets marknadsandel på dess huvudmarknad?
1. 0-10% 2. 11-25% 3. 26-50% 4. 51-75% 5. 76-100%
A6 Vilket av följande påståenden instämmer Ni med när det gäller företagets huvudprodukter?
1. Företagets huvudprodukter är anpassade till varje individuell kund 2. Företagets huvudprodukter är anpassade till olika grupper av kunder 3. Företagets huvudprodukter utgörs av standardprodukter
A7 Vad kännetecknar Ert företag jämfört med andra företag inom samma bransch? Markera nedan för var och en av egenskaperna hur ni bedömer Ert företag skiljer er åt från konkurrenterna. (var vänlig markera med X) Avsevärt
lägre/ smalare
Lika Avsevärt Högre/ bredare
1 2 3 4 5 Behov av specialistkompetens i produktion Behov av flexibel produktionsteknik Försäljningspris Kostnadseffektivitet Effektivitet Grad av centraliserad styrning Andel av oms. som satsas på utveckling av nya produkter
Andel av oms. som satsas på utveckling av befintliga produkter
Andel av oms. som satsas på marknadsföring Produkt kvalitet Specifika produktegenskaper Service runt produkten Företagets marknadssegment Andel produkter som konstrueras i enighet med enskilda kunders kravspecifikation
- II -
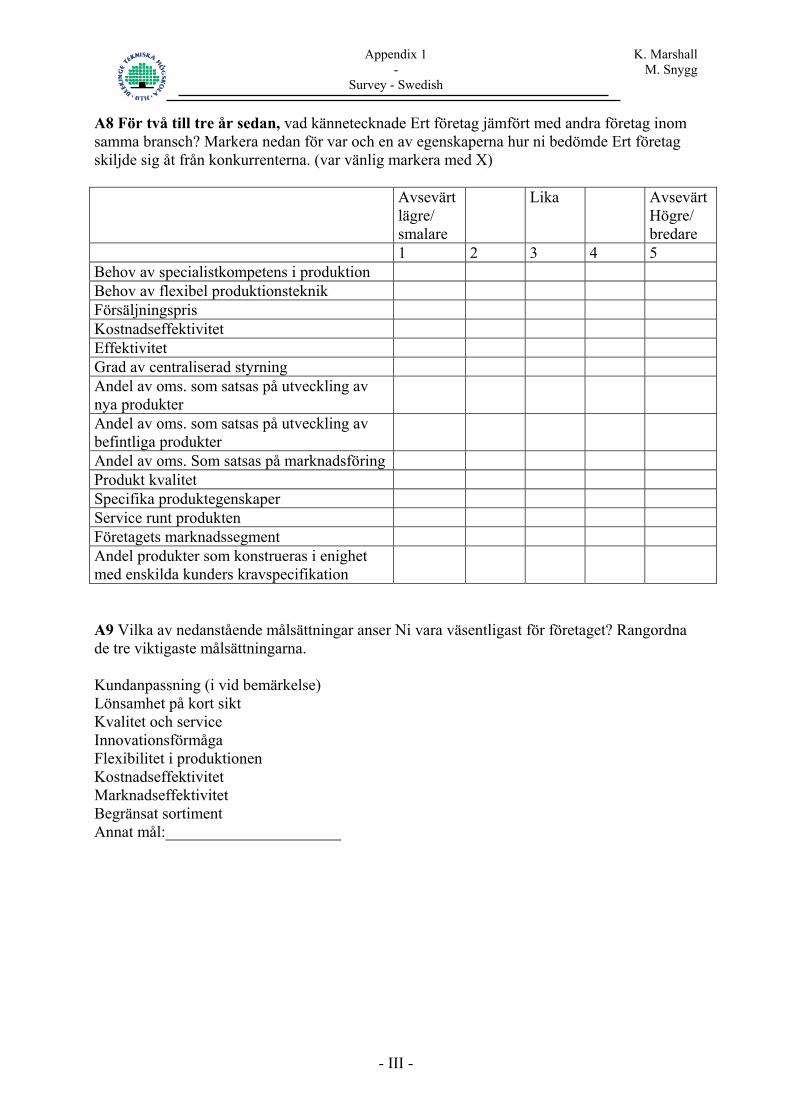
Appendix 1 K. Marshall - M. Snygg Survey - Swedish
A8 För två till tre år sedan, vad kännetecknade Ert företag jämfört med andra företag inom samma bransch? Markera nedan för var och en av egenskaperna hur ni bedömde Ert företag skiljde sig åt från konkurrenterna. (var vänlig markera med X) Avsevärt
lägre/ smalare
Lika Avsevärt Högre/ bredare
1 2 3 4 5 Behov av specialistkompetens i produktion Behov av flexibel produktionsteknik Försäljningspris Kostnadseffektivitet Effektivitet Grad av centraliserad styrning Andel av oms. som satsas på utveckling av nya produkter
Andel av oms. som satsas på utveckling av befintliga produkter
Andel av oms. Som satsas på marknadsföring Produkt kvalitet Specifika produktegenskaper Service runt produkten Företagets marknadssegment Andel produkter som konstrueras i enighet med enskilda kunders kravspecifikation
A9 Vilka av nedanstående målsättningar anser Ni vara väsentligast för företaget? Rangordna de tre viktigaste målsättningarna. Kundanpassning (i vid bemärkelse) Lönsamhet på kort sikt Kvalitet och service Innovationsförmåga Flexibilitet i produktionen Kostnadseffektivitet Marknadseffektivitet Begränsat sortiment Annat mål:______________________
- III -

Appendix 1 K. Marshall - M. Snygg Survey - Swedish
Företagets måttanvändning B1 I vilken omfattning tillämpar företaget följande: (var vänlig markera med X) Tillämpas inte
alls Tillämpas i del av företaget
Tillämpas i hela företaget
Balanced Scorecard (BSC) Budget Prognoser Activity Based Costing (ABC) Target Costing Total Quality Management (TQM) B2 Används nedanstående mått/information i styrningen av företaget, både idag och för två till tre år sedan? Hur ofta rapporteras dessa mått? I kolumnen Nu, syftar vi på den aktuella mått användningen och i kolumnen Då syftar vi på måtten som användes för två till tre år sedan. (var vänlig markera med X)
Regelbundenhet i användningen Mått Aldrig Sällan Årsvis Halvårs-
vis Kvartals-vis
Månat-ligen
Mer frekvent
Nu Då Nu Då Nu Då Nu Då Nu Då Nu Då Nu Då Kundnöjdhet Förlorade kunder Förvärvade kunder Lönsamhet/kund Antal reklamationer
Leveranskvalitet Marknadsandel Kundönskemål Priskänslighet Produktutveckling Personal-omsättning
Personalutbildning Kunskaper hos personalen
Färdigheter hos personalen
Arbetstillfreds-ställelse
Produktkvalitet Kassaktioner Ledtider Ställtider Lagringskostnader
- IV -

Appendix 1 K. Marshall - M. Snygg Survey - Swedish
Aldrig
Sällan Årsvis Halvårs-vis
Kvartals-vis
Månat-ligen
Mer frekvent
Nu Då Nu Då Nu Då Nu Då Nu Då Nu Då Nu Då Stillestånds-frekvens
Budgetavvikelser Kalkylmässiga differenser
Kapacitets-utnyttjande
Avkastning Lönsamhet Miljörelaterade mått
Förmåga att anpassa produkten
Effektivitet Netto försäljning Kassaflöde Likviditet Soliditet Totala tillgångar
B3 Vilka mått/nyckeltal lämnas regelbundet till moderbolaget/ägaren? Tag därefter ställning till måttens påverkan på den egna interna styrningen. Måttens påverkas på den egna styrningen:
Ingen Mycket Ja/Nej alls påverkan 1 2 3 4 5
Avkastningsmått (räntabilitet) Resultatmått Kassaflöde/likviditetsflöde Produktivitetsmått Förädlingsvärde Annat:__________________ B4 Vilka fem mått är de mest väsentliga för den interna styrningen?
1. 2. 3. 4. 5.
- V -
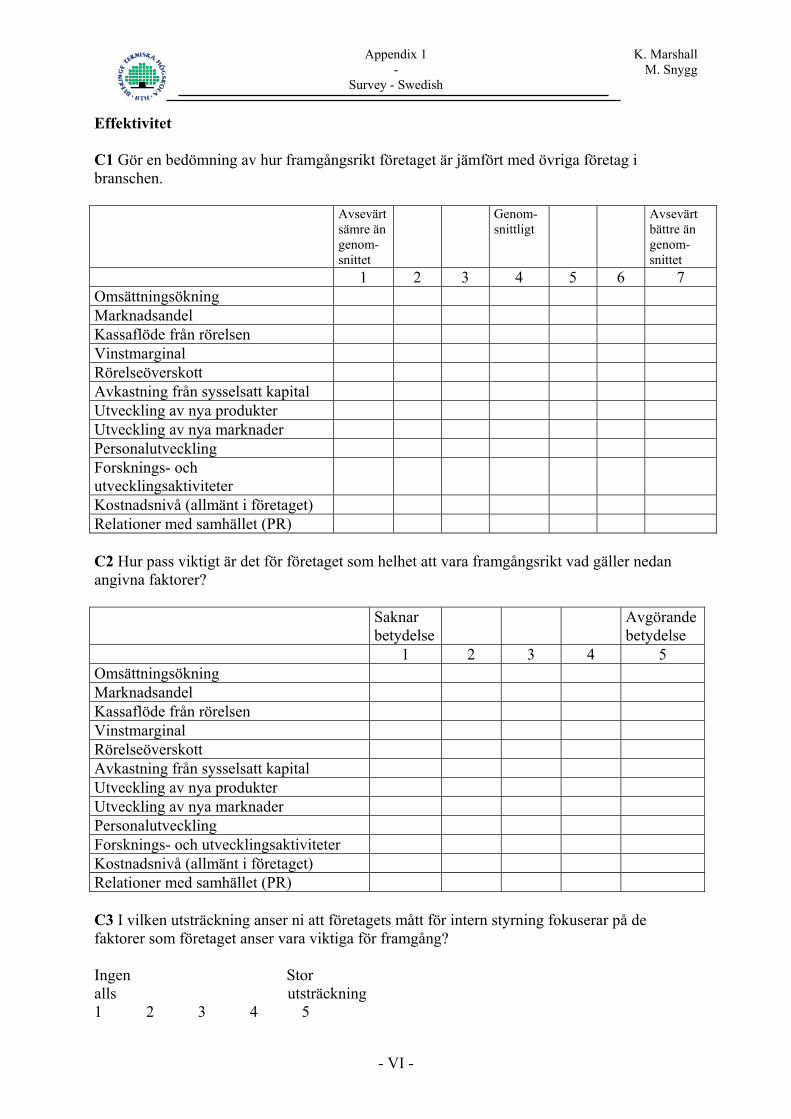
Appendix 1 K. Marshall - M. Snygg Survey - Swedish
Effektivitet C1 Gör en bedömning av hur framgångsrikt företaget är jämfört med övriga företag i branschen. Avsevärt
sämre än genom-snittet
Genom-snittligt
Avsevärt bättre än genom-snittet
1 2 3 4 5 6 7 Omsättningsökning Marknadsandel Kassaflöde från rörelsen Vinstmarginal Rörelseöverskott Avkastning från sysselsatt kapital Utveckling av nya produkter Utveckling av nya marknader Personalutveckling Forsknings- och utvecklingsaktiviteter
Kostnadsnivå (allmänt i företaget) Relationer med samhället (PR) C2 Hur pass viktigt är det för företaget som helhet att vara framgångsrikt vad gäller nedan angivna faktorer? Saknar
betydelse Avgörande
betydelse 1 2 3 4 5 Omsättningsökning Marknadsandel Kassaflöde från rörelsen Vinstmarginal Rörelseöverskott Avkastning från sysselsatt kapital Utveckling av nya produkter Utveckling av nya marknader Personalutveckling Forsknings- och utvecklingsaktiviteter Kostnadsnivå (allmänt i företaget) Relationer med samhället (PR) C3 I vilken utsträckning anser ni att företagets mått för intern styrning fokuserar på de faktorer som företaget anser vara viktiga för framgång? Ingen Stor alls utsträckning 1 2 3 4 5
- VI -

Appendix 2 K. Marshall - M. Snygg Survey - English
Company name: Contact person: Please mark your answer in Bold! Business Strategy A1 Number of employees in the company
1. 100-199 2. 200-299 3. 300-399 4. 400-499
A2 What does the companies’ owner structure look like? (Concerning the legal unit)
1. Family owned, directly or through other company 2. Owned by other Swedish company 3. Owned by other foreign company 4. Other:_______________________
A3 The company’s production is towards:
1. Order 100% 2. Order/Stock 75%/25% 3. Order/Stock 50%/50% 4. Stock/Order 75%/25% 5. Stock 100%
The company’s production is in:
1. Short series 100% 2. Short/long series 75%/25% 3. Short/Long series 50%/50% 4. Long/Short series 75%/25% 5. Long series 100%
A4 Is the company mainly subcontractor to other company/companies? Yes / No To what extent is the company depending of one supplier or a few suppliers? None Very large 1 2 3 4 5
- I -
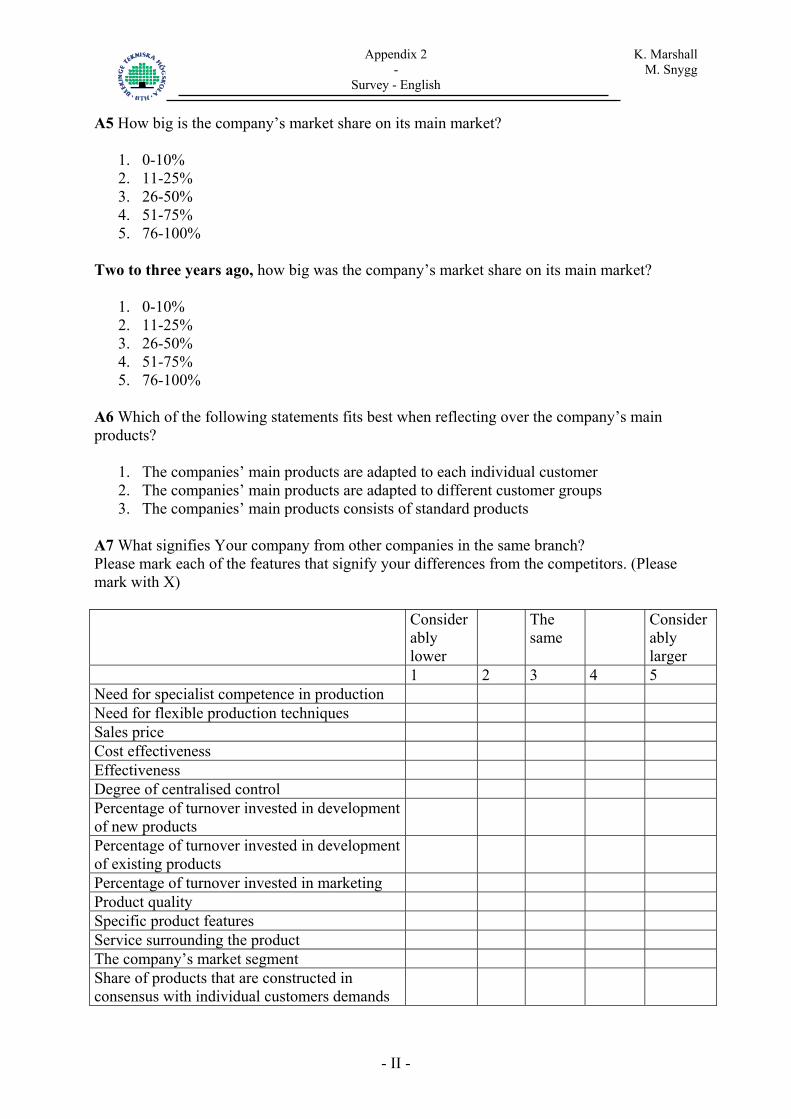
Appendix 2 K. Marshall - M. Snygg Survey - English
A5 How big is the company’s market share on its main market?
1. 0-10% 2. 11-25% 3. 26-50% 4. 51-75% 5. 76-100%
Two to three years ago, how big was the company’s market share on its main market?
1. 0-10% 2. 11-25% 3. 26-50% 4. 51-75% 5. 76-100%
A6 Which of the following statements fits best when reflecting over the company’s main products?
1. The companies’ main products are adapted to each individual customer 2. The companies’ main products are adapted to different customer groups 3. The companies’ main products consists of standard products
A7 What signifies Your company from other companies in the same branch? Please mark each of the features that signify your differences from the competitors. (Please mark with X) Consider
ably lower
The same
Considerably larger
1 2 3 4 5 Need for specialist competence in production Need for flexible production techniques Sales price Cost effectiveness Effectiveness Degree of centralised control Percentage of turnover invested in development of new products
Percentage of turnover invested in development of existing products
Percentage of turnover invested in marketing Product quality Specific product features Service surrounding the product The company’s market segment Share of products that are constructed in consensus with individual customers demands
- II -

Appendix 2 K. Marshall - M. Snygg Survey - English
A8 Two to three years ago, what signified Your company from other companies in the same branch? Please mark each of the features that signified your differences from the competitors. (Please mark with X) Consider
ably lower
The same
Considerably larger
1 2 3 4 5 Need for specialist competence in production Need for flexible production techniques Sales price Cost effectiveness Effectiveness Degree of centralised control Percentage of turnover invested in development of new products
Percentage of turnover invested in development of existing products
Percentage of turnover invested in marketing Product quality Specific product features Service surrounding the product The company’s market segment Share of products that are constructed in consensus with individual customers demands
A9 Which of the factors for success do you consider the most important for the company? Rank the three most important success factors! Customer adaptation (in broad context) Short term profits Quality and service Innovation ability Flexibility in production Cost effectiveness Market effectiveness Limited range of products Other success factor:______________________
- III -

Appendix 2 K. Marshall - M. Snygg Survey - English
The company’s use of management control measures B1 To what extent does the company use the following means of control: (mark with an X) Not applied in
company Applied in part of company
Applied in entire company
Balanced Scorecard (BSC) Budget Forecasts Activity Based Costing (ABC) Target Costing Total Quality Management (TQM) B2 Are the measures below used in the company’s management control, both today and two to three years ago? How often are these measures reported? In the column T0 we refer to the current usage of measures and in the column T1 we refer to the measures used two to three years ago. (Please, mark with an X)
Frequency in use of measures Measures Never Seldom Yearly Every 6
months Quarterly Monthly More
frequent T0 T1 T0 T1 T0 T1 T0 T1 T0 T1 T0 T1 T0 T1 Customer satisfaction
Lost customers New customers Profit/customer Number of complaints
Delivery quality Market share Customer requests Price sensitivity Product development
Staff turnover Staff training Staff knowledge Staff abilities Job satisfaction Product quality Scrap Lead times Change over times Storage costs
- IV -

Appendix 2 K. Marshall - M. Snygg Survey - English
Never Seldom Yearly Every 6 months
Quarterly Monthly More frequent
T0 T1 T0 T1 T0 T1 T0 T0 T1 T0 T1 T0 T1 T0 Standstill frequency
Budget differences Calculation differences
Capacity usage Yields Profitability Environment related measures
Ability to adapt the product
Effectiveness Net sales Cash flow Liquidity Solvency Total assets
B3 Which of the following measures are regularly reported to the parent company/owner? After this is done, state these measures effect on the own management control.
The measures effect on the management control: None Large
Yes/No at all effect 1 2 3 4 5
Yield measures Profitability measures Cash flow Productivity measures Value added Other:__________________ B4 Which five measures are most essential for the management control?
1. 2. 3. 4. 5.
- V -

Appendix 2 K. Marshall - M. Snygg Survey - English
Effectiveness C1 Assess your company’s success in comparison to other companies in the same branch. Consider
ably lower
Average Considerably better
1 2 3 4 5 6 7 Sales growth rate Market share Cash flow from operations Profit to sales ratio Operating profits Return on investment New product development Market development Personnel development R&D activities Cost level Public Relations (PR). C2 How important is it for the company to be successful in the factors stated below? No
importance Essential
for success 1 2 3 4 5 Sales growth rate Market share Cash flow from operations Profit to sales ratio Operating profits Return on investment New product development Market development Personnel development R&D activities Cost level Public Relations (PR). C3 To what extent do you consider that the company’s measures for the management control focuses on the factors that are critical for success? None Large at all extent 1 2 3 4 5
- VI -

Appendix 3 K. Marshall - M. Snygg Survey Results
A1 Number of employees in the company
1. 100-199 29 2. 200-299 9 3. 300-399 7 4. 400-499 3
A2 What does the companies’ owner structure look like? (Concerning the legal unit)
1. Family owned, directly or through other company 8 2. Owned by other Swedish company 18 3. Owned by other foreign company 16 4. Other:_______________________ 6
A3 The company’s production is towards:
1. Order 100% 22 2. Order/Stock 75%/25% 12 3. Order/Stock 50%/50% 4 4. Stock/Order 75%/25% 9 5. Stock 100% 1
The company’s production is in:
1. Short series 100% 18 2. Short/long series 75%/25% 13 3. Short/Long series 50%/50% 6 4. Long/Short series 75%/25% 9 5. Long series 100% 2
A4 Is the company mainly subcontractor to other company/companies? Yes 29 No 19 To what extent is the company depending of one supplier or a few suppliers?
No 1 3 2 6 3 28 4 7
Very large 5 4 A5 How big is the company’s market share on its main market?
1. 0-10% 7 2. 11-25% 14 3. 26-50% 13 4. 51-75% 8 5. 76-100% 6
- I -

Appendix 3 K. Marshall - M. Snygg Survey Results
Two to three years ago, how big was the company’s market share on its main market?
1. 0-10% 8 2. 11-25% 14 3. 26-50% 14 4. 51-75% 6 5. 76-100% 6
A6 Which of the following statements fits best when reflecting over the company’s main products?
1. The companies’ main products are adapted to each individual customer 29 2. The companies’ main products are adapted to different customer groups 7 3. The companies’ main products consists of standard products 12
A7 What signifies Your company from other companies in the same branch? Please mark each of the features that signify your differences from the competitors. (Please mark with X) Consider
ably lower
The same
Considerably larger
1 2 3 4 5 Need for specialist competence in production 1 35 11 1 Need for flexible production techniques 2 27 14 5 Sales price 2 5 23 17 1 Cost effectiveness 2 4 30 11 1 Effectiveness 1 5 28 14 Degree of centralised control 9 24 11 4 Percentage of turnover invested in development of new products
1 9 20 16 2
Percentage of turnover invested in development of existing products
7 30 10 1
Percentage of turnover invested in marketing 5 10 24 7 2 Product quality 1 17 25 5 Specific product features 1 24 15 8 Service surrounding the product 4 18 19 7 The company’s market segment 2 32 12 2 Share of products that are constructed in consensus with individual customers demands
3 3 25 14 3
- II -

Appendix 3 K. Marshall - M. Snygg Survey Results
A8 Two to three years ago, what signified Your company from other companies in the same branch? Please mark each of the features that signified your differences from the competitors. (Please mark with X) Consider
ably lower
The same
Considerably larger
1 2 3 4 5 Need for specialist competence in production 39 7 2 Need for flexible production techniques 2 31 10 5 Sales price 2 4 27 14 1 Cost effectiveness 2 5 30 10 1 Effectiveness 2 7 23 16 Degree of centralised control 8 31 7 2 Percentage of turnover invested in development of new products
3 9 22 12 2
Percentage of turnover invested in development of existing products
1 6 30 10 1
Percentage of turnover invested in marketing 6 9 28 5 Product quality 2 20 24 2 Specific product features 1 26 17 4 Service surrounding the product 3 28 11 6 The company’s market segment 4 34 8 2 Share of products that are constructed in consensus with individual customers demands
3 3 27 15
A9 Which of the factors for success do you consider the most important for the company? Rank the three most important success factors! Most important Customer adaptation (in broad context) 13
Short term profits 1
Quality and service 12
Innovation ability 1
Flexibility in production 7
Cost effectiveness 13
Market effectiveness 1 Second most important Customer adaptation (in broad context) 9 Short term profits 1
Quality and service 13
Innovation ability 4
Flexibility in production 9
Cost effectiveness 8
Market effectiveness 1
Limited range of products 3
- III -

Appendix 3 K. Marshall - M. Snygg Survey Results
Third most important Customer adaptation (in broad context) 8
Short term profits 2
Quality and service 8
Innovation ability 4
Flexibility in production 4
Cost effectiveness 17
Market effectiveness 4
Other Success factor 1
- IV -

Appendix 3 K. Marshall - M. Snygg Survey Results
The company’s use of management control measures B1 To what extent does the company use the following means of control: (mark with an X) Not applied in
company Applied in part of company
Applied in entire company
Balanced Scorecard (BSC) 28 14 6 Budget 1 2 45 Forecasts 1 7 40 Activity Based Costing (ABC) 24 19 5 Target Costing 32 15 1 Total Quality Management (TQM) 15 21 12 B2 Are the measures below used in the company’s management control, both today and two to three years ago? How often are these measures reported? In the column T0 we refer to the current usage of measures and in the column T1 we refer to the measures used two to three years ago. (Please, mark with an X)
Frequency in use of measures Measures Never Seldom Yearly Every 6
months Quarterly Monthly More
frequent T0 T1 T0 T1 T0 T1 T0 T1 T0 T1 T0 T1 T0 T1 Customer satisfaction
3 12 10 14 21 13 5 3 2 1 5 3 2 2
Lost customers 20 21 7 7 3 4 3 1 3 3 8 8 4 4 New customers 9 10 7 8 4 6 3 4 8 5 8 7 9 8 Profit/customer 7 9 2 7 7 8 1 1 8 5 18 13 5 5 Number of complaints
1 1 1 4 1 2 3 6 7 32 27 6 5
Delivery quality 2 2 1 4 1 2 3 4 31 30 10 6 Market share 8 9 7 8 22 20 3 3 3 4 5 4 Customer requests 7 7 6 7 7 6 2 5 3 1 7 7 16 15 Price sensitivity 9 9 9 9 11 11 3 4 4 4 8 8 4 3 Product development
8 8 8 8 2 2 1 10 14 12 10 8 5
Staff turnover 3 3 3 3 15 16 1 6 6 21 19 Staff training 5 5 1 2 16 17 5 4 10 11 10 8 1 1 Staff knowledge 6 8 7 7 18 17 9 8 4 4 2 2 2 2 Staff abilities 10 12 7 7 11 12 10 7 5 5 2 2 3 3 Job satisfaction 4 8 20 22 17 11 3 2 2 3 1 1 1 1 Product quality 1 1 1 2 2 2 3 4 4 20 19 19 18 Scrap 2 3 1 2 3 1 4 4 27 25 13 11 Lead times 3 4 2 2 7 8 8 7 3 3 14 15 11 9 Change over times 6 6 5 9 11 11 6 4 3 3 10 11 7 4 Storage costs 9 10 5 6 10 12 4 3 3 3 14 13 1 1
- V -

Appendix 3 K. Marshall - M. Snygg Survey Results
Never Seldom Yearly Every 6
months Quarterly Monthly More
frequent T0 T1 T0 T1 T0 T1 T0 T0 T1 T0 T1 T0 T1 T0 Standstill frequency
11 11 12 16 1 2 1 4 5 14 10 5 4
Budget differences 1 1 2 3 45 44 Calculation differences
1 7 6 3 4 2 2 7 5 27 28 2 2
Capacity usage 3 3 1 3 1 3 4 4 28 25 11 10 Yields 1 1 2 4 7 7 2 2 7 5 29 29 Profitability 1 2 2 1 2 1 43 42 1 1 Environment related measures
4 6 2 5 13 10 5 6 9 6 14 13 1 2
Ability to adapt the product
18 19 11 12 1 2 5 4 3 4 2 2 8 5
Effectiveness 3 3 3 1 1 1 2 4 2 28 28 11 9 Net sales 1 1 33 33 14 14 Cash flow 7 8 3 5 33 30 5 5 Liquidity 4 4 1 1 4 7 28 25 11 11 Solvency 1 2 17 17 3 4 6 4 20 20 1 1 Total assets 1 2 9 9 2 2 5 5 30 29 1 7
B3 Which of the following measures are regularly reported to the parent company/owner? After this is done, state these measures effect on the own management control.
The measures effect on the management control Not measured None at
all 1
2 3 4 Large effect5
Yield measures 7 7 4 11 11 8Profitability measures 5 11 32
Cash flow 2 1 10 12 12 11Productivity measures 11 2 1 5 14 15Value added 19 4 4 4 8 9 B4 Which five measures are most essential for the management control? (Control question, the results are not presented!)
- VI -

Appendix 3 K. Marshall - M. Snygg Survey Results
Effectiveness C1 Assess your company’s success in comparison to other companies in the same branch. Consider
ably lower
Average Considerably
better 1 2 3 4 5 6 7 Sales growth rate 1 7 16 13 5 6 Market share 3 1 15 14 7 8 Cash flow from operations 2 2 18 17 6 3 Profit to sales ratio 1 10 20 8 7 2 Operating profits 2 10 16 11 7 2 Return on investment 3 8 19 11 6 1 New product development 1 2 4 16 13 8 4 Market development 1 4 7 18 13 2 3 Personnel development 1 2 5 24 11 4 1 R&D activities 1 3 7 20 10 6 1 Cost level 1 2 7 20 11 6 1 Public Relations (PR). 3 3 27 5 10 C2 How important is it for the company to be successful in the factors stated below? No
importance Essential
for success 1 2 3 4 5 Sales growth rate 4 10 27 7 Market share 2 2 11 25 8 Cash flow from operations 3 18 20 7 Profit to sales ratio 1 6 23 18 Operating profits 1 7 23 17 Return on investment 3 2 16 15 12 New product development 6 4 9 13 16 Market development 4 15 23 6 Personnel development 2 18 23 5 R&D activities 2 9 10 21 6 Cost level 5 25 18 Public Relations (PR). 3 7 29 7 2 C3 To what extent do you consider that the company’s measures for the management control focuses on the factors that are critical for success?
None at all 1 2 3 8 4 28
Large extent 5 12
- VII -

Appendix 4 K. Marshall - M. Snygg Miles & Snow - Boxplots
Boxplot concerning the different strategy variables in classifying the studied companies according to Miles & Snow’ typology. 1 on the horizontal axis in the boxplots represents the strategy Analyzer 2 on the horizontal axis in the boxplots represents the strategy Prospector 3 on the horizontal axis in the boxplots represents the strategy Defender Sales price Percentage of turnover invested in development of
new products
41529N =
Ward Method
321
6
5
4
3
2
1
0
_
41529N =
Ward Method
321
6
5
4
3
2
1
0
_
341348
316
39211417223
42111625379
Percentage of turnover invested in Percentage of turnover invested in development of marketing existing products
41529N =
Ward Method
321
6
5
4
3
2
1
0
_
41529N =
Ward Method
321
5,5
5,0
4,5
4,0
3,5
3,0
2,5
2,0
1,5
_
2142123
17
- I -

Appendix 4 K. Marshall - M. Snygg Miles & Snow - Boxplots
Specific product features
41529N =
Ward Method
321
5,5
5,0
4,5
4,0
3,5
3,0
2,5
2,0
1,5
_
313448
- II -
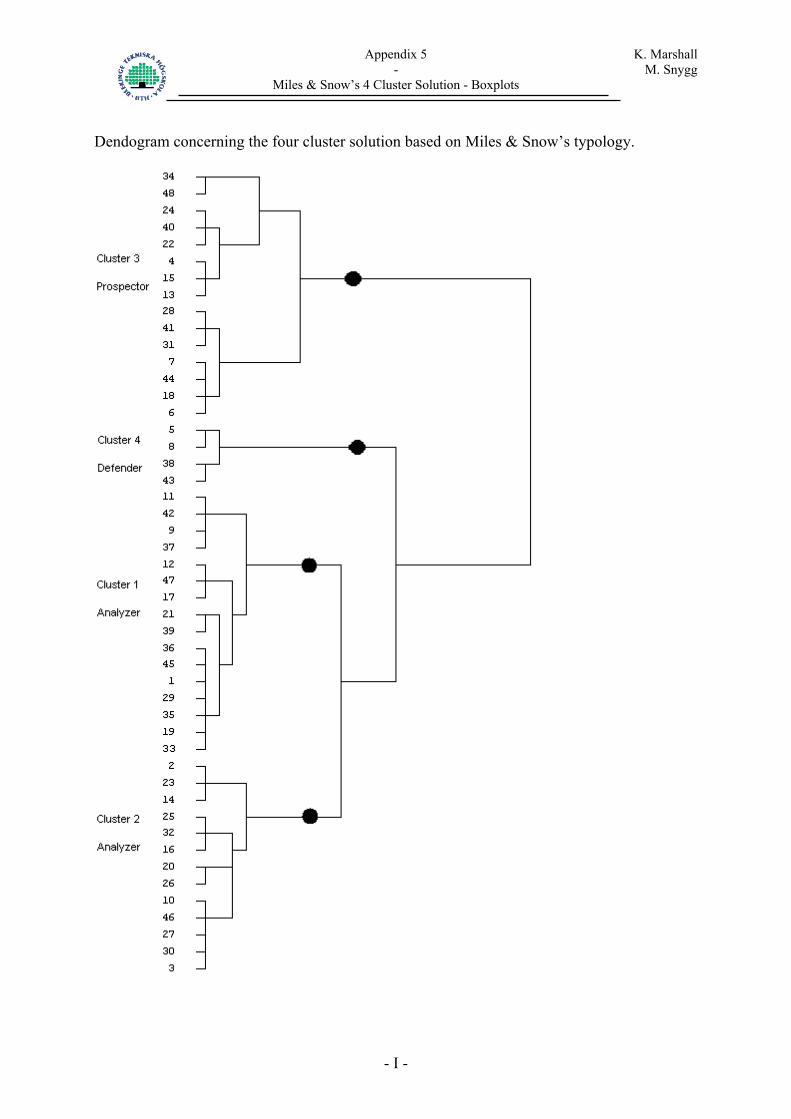
Appendix 5 K. Marshall - M. Snygg Miles & Snow’s 4 Cluster Solution - Boxplots
Dendogram concerning the four cluster solution based on Miles & Snow’s typology.
- I -

Appendix 5 K. Marshall - M. Snygg Miles & Snow’s 4 Cluster Solution - Boxplots
Boxplot concerning the different strategy variables in classifying the studied companies according to the four cluster solution based on Miles & Snow’ typology. 1 on the horizontal axis in the boxplots represents the first cluster of the strategy Analyzer 2 on the horizontal axis in the boxplots represents the second cluster of the strategy Analyzer 3 on the horizontal axis in the boxplots represents the strategy Prospector 4 on the horizontal axis in the boxplots represents the strategy Defender Sales price Percentage of turnover invested in
development of new products
4151316N =
Ward Method
4321
6
5
4
3
2
1
0
_
4151316N =
Ward Method
4321
6
5
4
3
2
1
0
_
341348
316
23214
2516
211739
Percentage of turnover invested in Specific product features development of existing product
4151316N =
Ward Method
4321
5,5
5,0
4,5
4,0
3,5
3,0
2,5
2,0
1,5
_
2321421
17
4151316N =
Ward Method
4321
5,5
5,0
4,5
4,0
3,5
3,0
2,5
2,0
1,5
_
483134
- II -
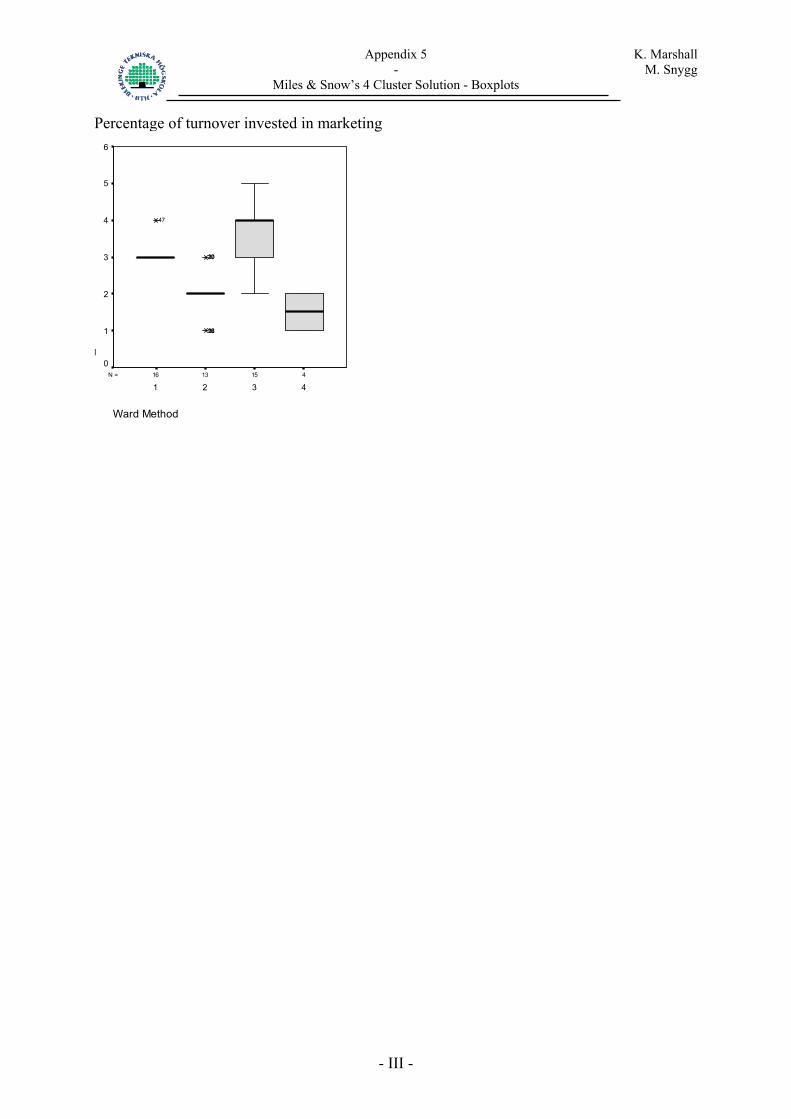
Appendix 5 K. Marshall - M. Snygg Miles & Snow’s 4 Cluster Solution - Boxplots
Percentage of turnover invested in marketing
4151316N =
Ward Method
4321
6
5
4
3
2
1
0
_
322616
271030
47
- III -

Appendix 6 K. Marshall - M. Snygg Our Further Developed Typology based on Porter’s typology - Boxplots
Boxplot concerning the different strategy variables in classifying the studied companies according the further developed typology based on Porter’s typology. 1 on the horizontal axis in the boxplots represents the Marketing strategy 2 on the horizontal axis in the boxplots represents the Customisation strategy 3 on the horizontal axis in the boxplots represents the Product development strategy 4 on the horizontal axis in the boxplots represents the Cost leader strategy Sales price Percentage of turnover invested in
development of new products
417189N =
Ward Method
4321
6
5
4
3
2
1
0
_
417189N =
Ward Method
4321
6
5
4
3
2
1
0
_
30
316
1417223
1625
2139
Percentage of turnover invested in Percentage of turnover invested in marketing development of existing products
417189N =
Ward Method
4321
5,5
5,0
4,5
4,0
3,5
3,0
2,5
2,0
1,5
_
14223
17
21
417189N =
Ward Method
4321
6
5
4
3
2
1
0
_
- I -

Appendix 6 K. Marshall - M. Snygg Our Further Developed Typology based on Porter’s typology - Boxplots
Product quality Specific product features
417189N =
Ward Method
4321
5,5
5,0
4,5
4,0
3,5
3,0
2,5
2,0
1,5
_
1936
2632
39
34
417189N =
Ward Method
4321
5,5
5,0
4,5
4,0
3,5
3,0
2,5
2,0
1,5_
Service surrounding the product
417189N =
Ward Method
4321
5,5
5,0
4,5
4,0
3,5
3,0
2,5
2,0
1,5
_
1726252
- II -

Appendix 7 K. Marshall - M. Snygg Differentiation Strategies -Boxplots
Boxplot concerning the different strategy variables in classifying the studied companies according to the 3 differentiation strategies in the further developed typology based on Porter’s typology. 1 on the horizontal axis in the boxplots represents the Marketing strategy 2 on the horizontal axis in the boxplots represents the Customisation strategy 3 on the horizontal axis in the boxplots represents the Product development strategy Percentage of turnover invested in Percentage of turnover invested in development of new products development of existing products
151910N =
Ward Method
321
5,5
5,0
4,5
4,0
3,5
3,0
2,5
2,0
1,5
_
316
22314
25416
151910N =
Ward Method
321
5,5
5,0
4,5
4,0
3,5
3,0
2,5
2,0
1,5
_
1423221
17
Percentage of turnover invested Product quality in marketing
151910N =
Ward Method
321
6
5
4
3
2
1
0
_
44
151910N =
Ward Method
321
5,5
5,0
4,5
4,0
3,5
3,0
2,5
2,0
1,5
_
401522
1943036
3226
39
1734
- I -

Appendix 7 K. Marshall - M. Snygg Differentiation Strategies -Boxplots
Specific product features Service surrounding the product
151910N =
Ward Method
321
5,5
5,0
4,5
4,0
3,5
3,0
2,5
_
151910N =
Ward Method
321
5,5
5,0
4,5
4,0
3,5
3,0
2,5
2,0
1,5
_
7644
314022
30
25262
- II -

Appendix 8 K. Marshall - M. Snygg Scree Plot
- I -
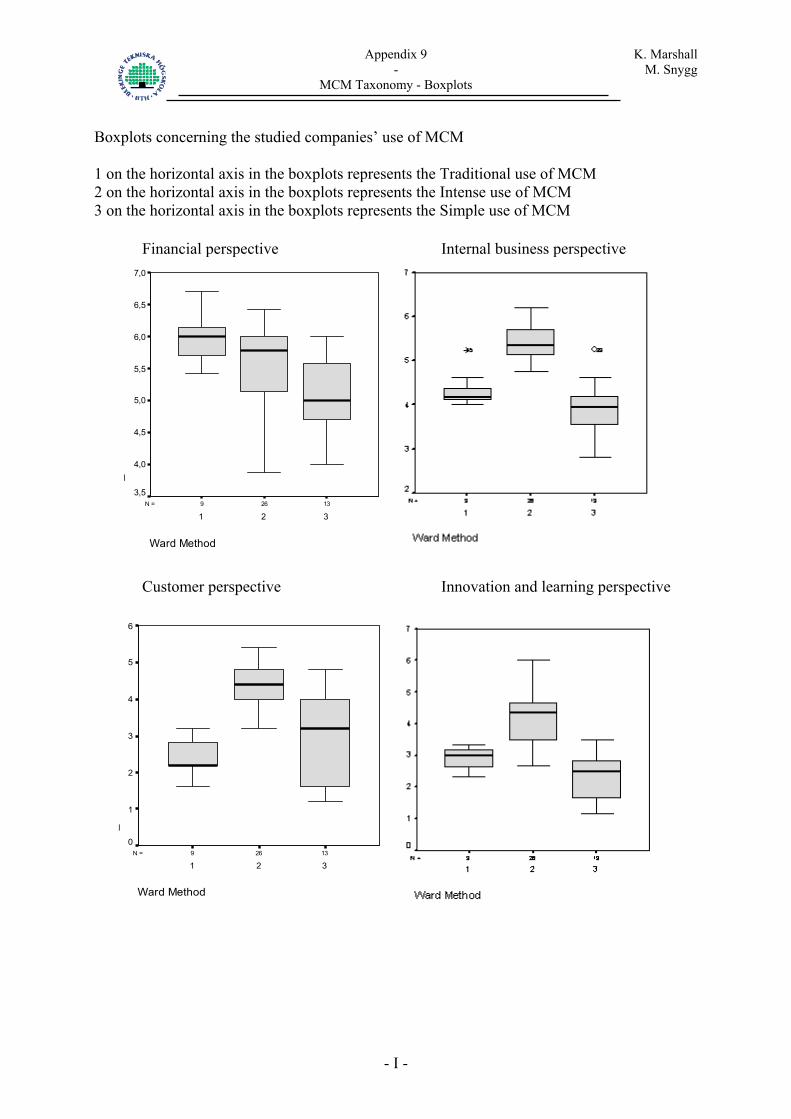
Appendix 9 K. Marshall - M. Snygg MCM Taxonomy - Boxplots Boxplots concerning the studied companies’ use of MCM 1 on the horizontal axis in the boxplots represents the Traditional use of MCM 2 on the horizontal axis in the boxplots represents the Intense use of MCM 3 on the horizontal axis in the boxplots represents the Simple use of MCM
Financial perspective Internal business perspective
13269N =
Ward Method
321
7,0
6,5
6,0
5,5
5,0
4,5
4,0
3,5
_
Customer perspective Innovation and learning perspective
13269N =
Ward Method
321
6
5
4
3
2
1
0
_
- I -

Appendix 10 K. Marshall - M. Snygg Effectiveness Index Calculated effectiveness index and the respondents stated effectiveness
Effectiveness index Stated effectiveness1 4,0 22 3,5 23 4,0 34 5,5 45 5,0 46 3,5 47 4,3 38 3,8 39 4,3 3
10 5,4 411 4,2 312 4,6 413 4,7 314 4,4 315 4,7 316 3,9 417 4,5 318 4,4 319 4,2 320 4,5 421 4,5 222 5,6 423 3,6 324 6,4 425 4,3 326 5,6 327 4,5 328 4,8 329 4,0 330 3,8 131 4,3 332 4,0 333 5,8 434 5,6 435 5,1 436 4,5 337 4,3 338 4,3 339 3,1 240 6,0 441 5,3 442 4,2 343 4,6 444 4,3 345 5,0 246 4,0 347 4,7 348 4,3 3
- I -