Embed Size (px)
Citation preview
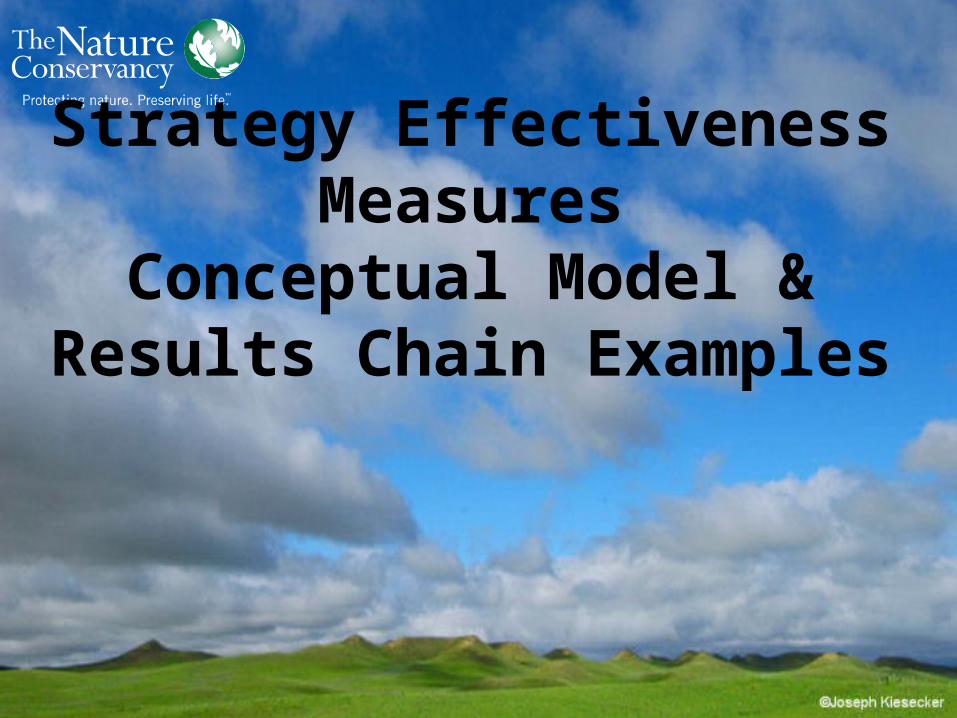
Strategy Effectiveness Measures
Conceptual Model & Results Chain Examples
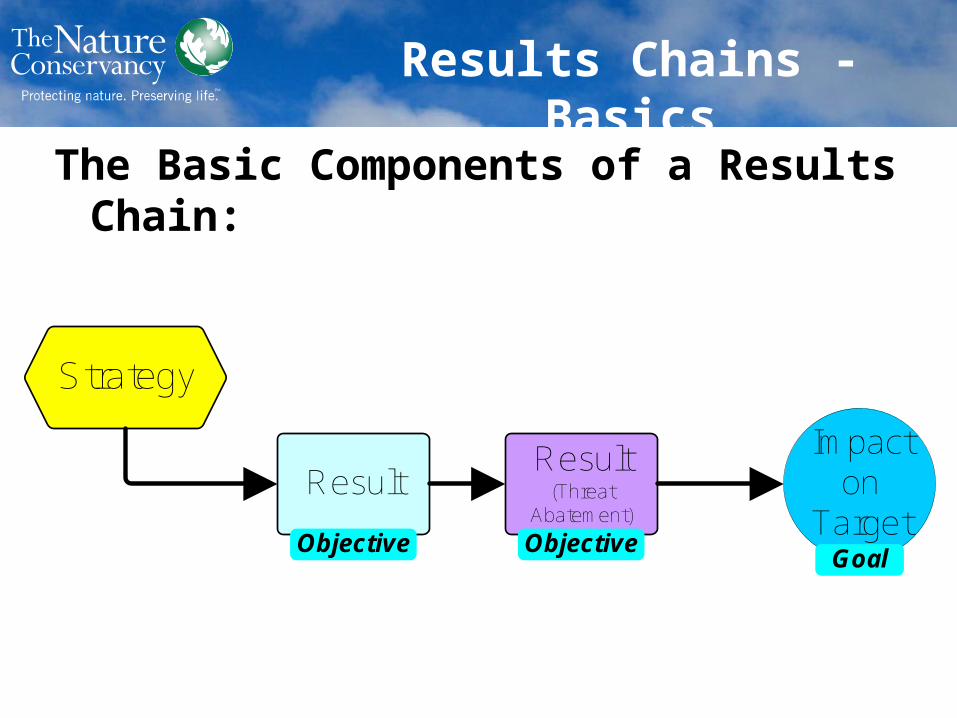
The Basic Components of a Results Chain:
Result(Threat
Abatement)
Result
Strategy
Impact on
TargetObjective Objective
Goal
Results Chains - Basics
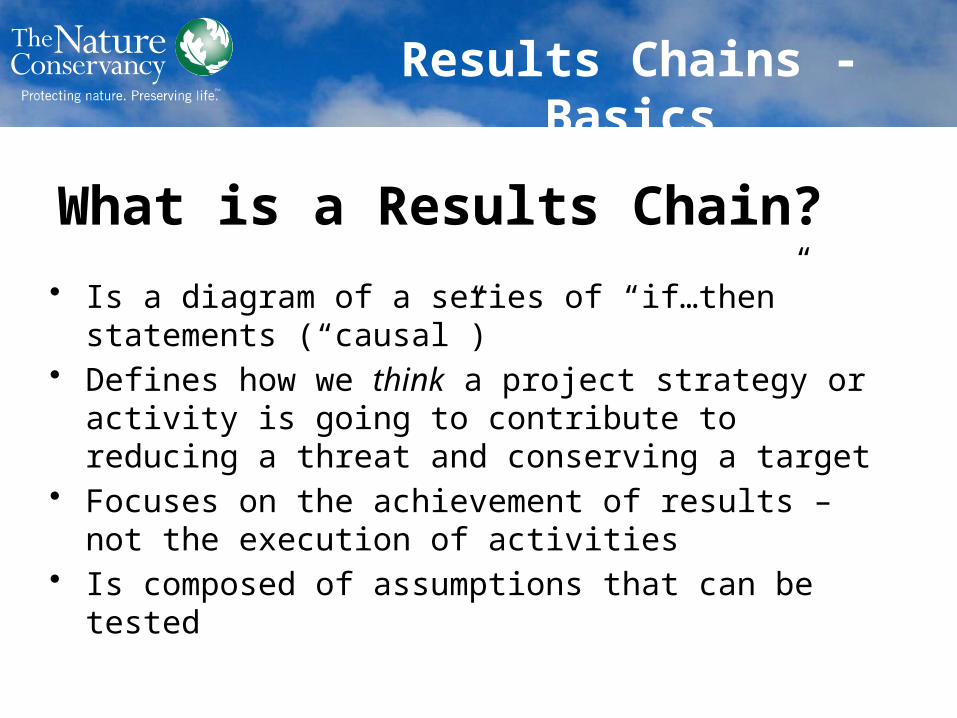
What is a Results Chain?
• Is a diagram of a series of “if…then” statements (“causal”)
• Defines how we think a project strategy or activity is going to contribute to reducing a threat and conserving a target
• Focuses on the achievement of results – not the execution of activities
• Is composed of assumptions that can be tested
Results Chains - Basics
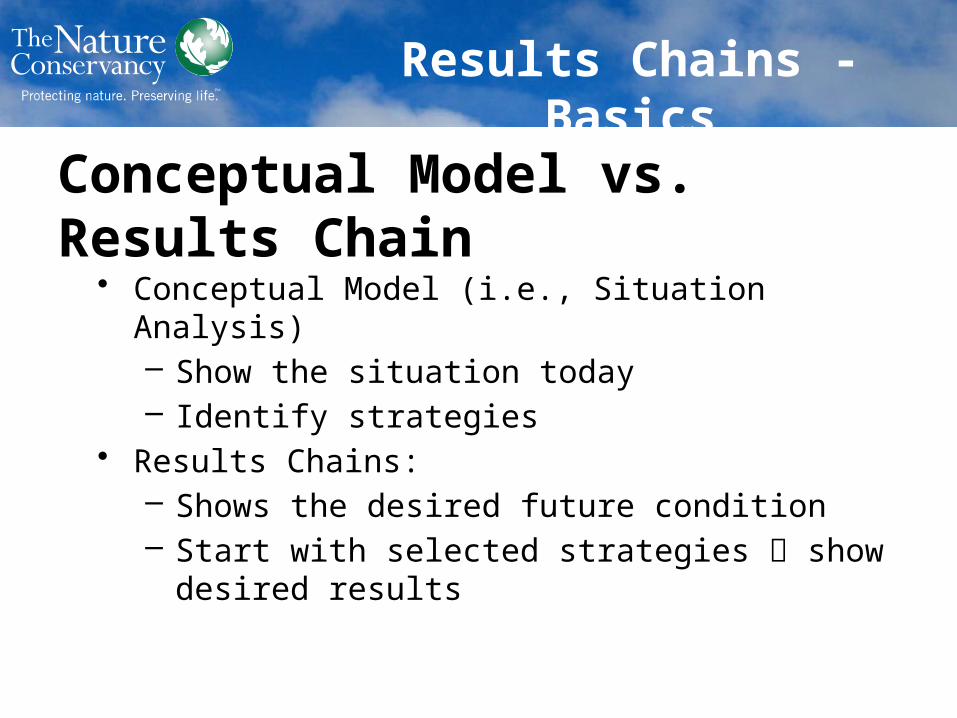
Conceptual Model vs. Results Chain
• Conceptual Model (i.e., Situation Analysis)– Show the situation today– Identify strategies
• Results Chains:– Shows the desired future condition– Start with selected strategies show desired
results
Results Chains - Basics
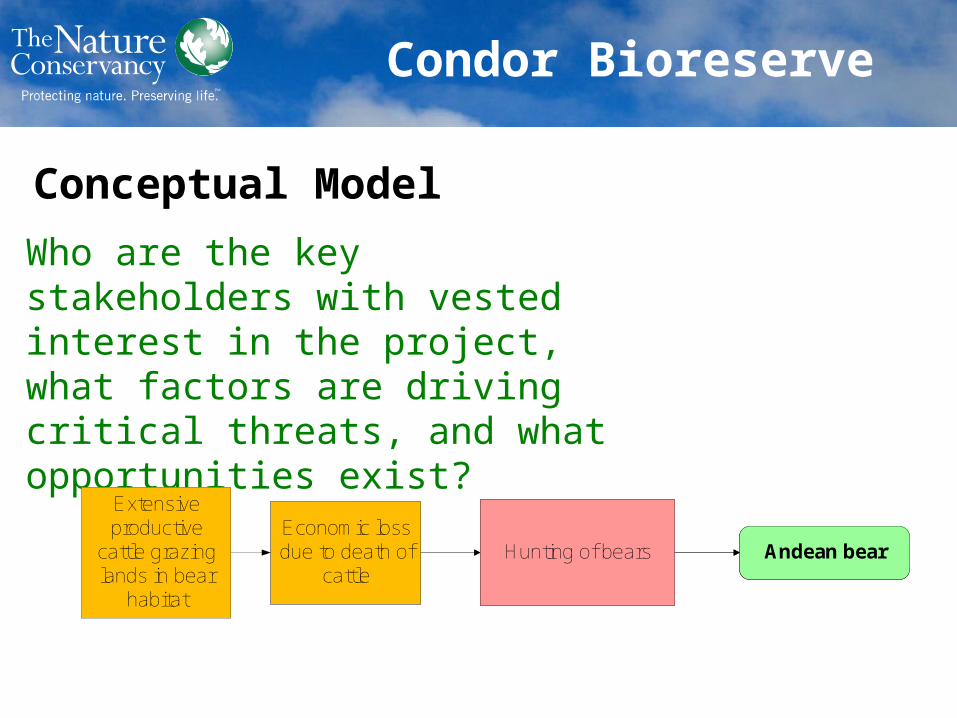
Who are the key stakeholders with vested interest in the project, what factors are driving critical threats, and what opportunities exist?
Andean bearHunting of bears Andean bearHunting of bearsEconomic loss due to death of
cattleAndean bearHunting of bears
Extensive productive
cattle grazing lands in bear
habitat
Economic loss due to death of
cattle
Condor Bioreserve
Conceptual Model
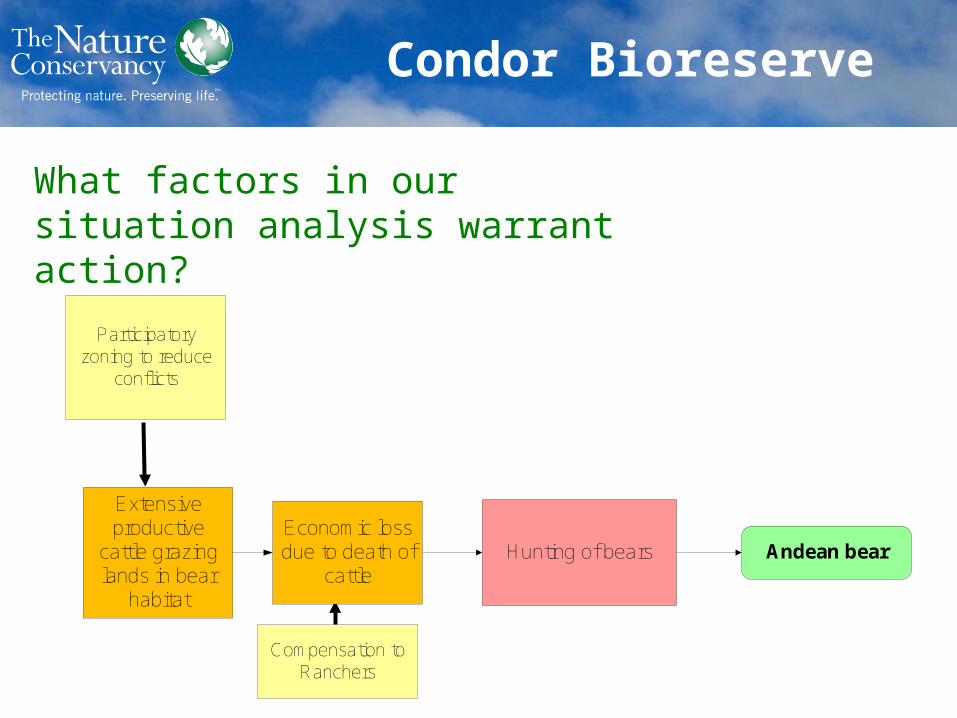
What factors in our situation analysis warrant action?
Participatory zoning to reduce
conflicts
Compensation to Ranchers
Andean bearHunting of bears
Extensive productive
cattle grazing lands in bear
habitat
Economic loss due to death of
cattle
Condor Bioreserve
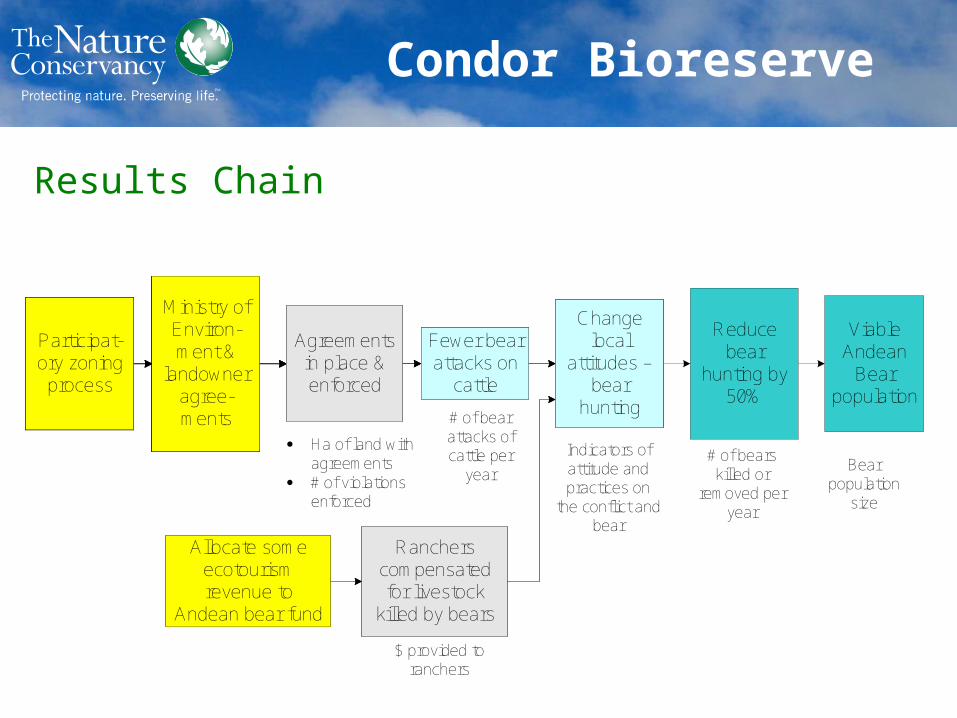
Ministry of Environ-ment &
landowner agree-ments
Participat-ory zoning
process
Agreements in place & enforced
Ministry of Environ-ment &
landowner agree-ments
Participat-ory zoning
process
Fewer bear attacks on
cattle
Agreements in place & enforced
Ministry of Environ-ment &
landowner agree-ments
Participat-ory zoning
process
Fewer bear attacks on
cattle
Agreements in place & enforced
Ministry of Environ-ment &
landowner agree-ments
Participat-ory zoning
process
Change local
attitudes – bear
hunting
Fewer bear attacks on
cattle
Agreements in place & enforced
Ministry of Environ-ment &
landowner agree-ments
Participat-ory zoning
process
Change local
attitudes – bear
hunting
Ranchers compensated for livestock
killed by bears
Allocate some ecotourism revenue to
Andean bear fund
Reduce bear
hunting by 50%
Fewer bear attacks on
cattle
Agreements in place & enforced
Ministry of Environ-ment &
landowner agree-ments
Participat-ory zoning
process
Change local
attitudes – bear
hunting
Viable Andean
Bear population
Ranchers compensated for livestock
killed by bears
Allocate some ecotourism revenue to
Andean bear fund
· Ha of land with agreements
· # of violations enforced
# of bear attacks of cattle per
year
Indicators of attitude and practices on
the conflict and bear
# of bears killed or
removed per year
Bear population
size
$ provided to ranchers
Results Chain
Condor Bioreserve
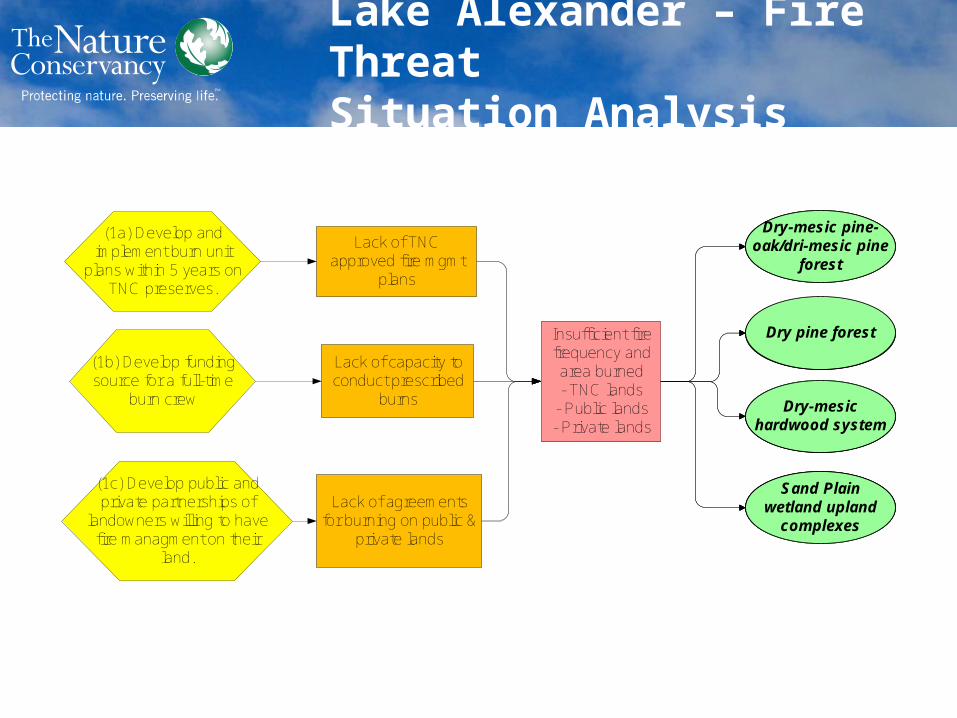
Insufficient fire frequency and area burned- TNC lands
- Public lands- Private lands
Dry-mesic pine-oak/dri-mesic pine
forest
Dry pine forest
Dry-mesic hardwood system
Sand Plain wetland upland
complexes
Lake Alexander – Fire Threat Situation Analysis
Lack of capacity to conduct prescribed
burns
Insufficient fire frequency and area burned- TNC lands
- Public lands- Private lands
Lack of TNC approved fire mgmt
plans
Lack of agreements for burning on public &
private lands
Dry-mesic pine-oak/dri-mesic pine
forest
Dry pine forest
Dry-mesic hardwood system
Sand Plain wetland upland
complexes
Lack of capacity to conduct prescribed
burns
Insufficient fire frequency and area burned- TNC lands
- Public lands- Private lands
(1b) Develop funding source for a full-time
burn crew
(1a) Develop and implement burn unit
plans within 5 years on TNC preserves.
Lack of TNC approved fire mgmt
plans
(1c) Develop public and private partnerships of
landowners willing to have fire managment on their
land.
Lack of agreements for burning on public &
private lands
Dry-mesic pine-oak/dri-mesic pine
forest
Dry pine forest
Dry-mesic hardwood system
Sand Plain wetland upland
complexes
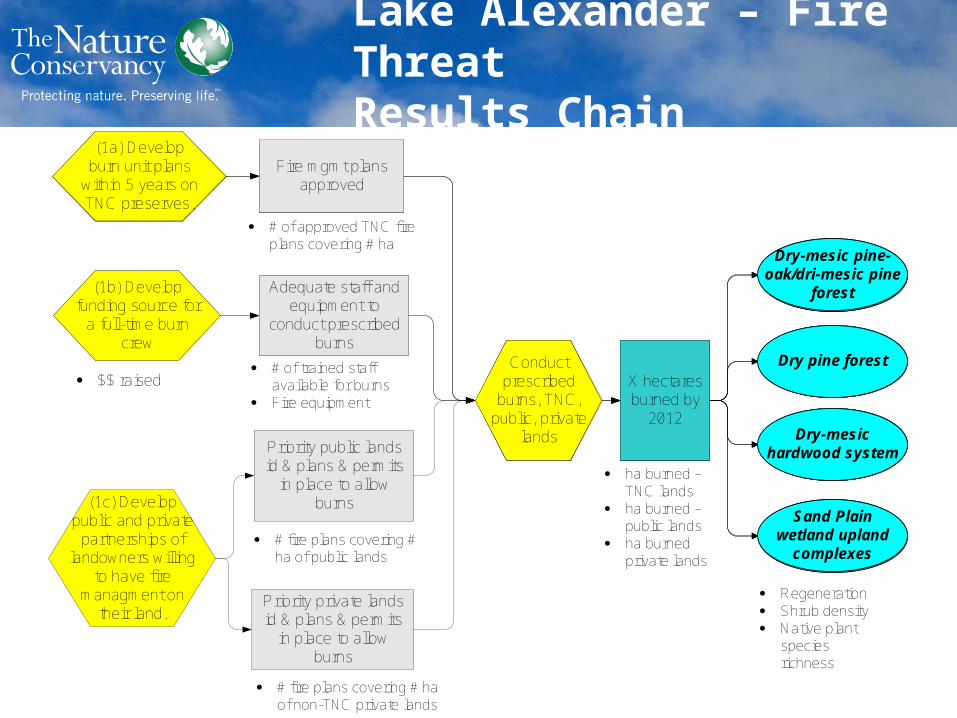
X hectares burned by
2012
Conduct prescribed
burns, TNC, public, private
lands
Dry-mesic pine-oak/dri-mesic pine
forest
Dry pine forest
Dry-mesic hardwood system
Sand Plain wetland upland
complexes
Lake Alexander – Fire Threat Results Chain
· ha burned – TNC lands
· ha burned – public lands
· ha burned private lands
· Regeneration· Shrub density· Native plant
species richness
X hectares burned by
2012
(1a) Develop burn unit plans
within 5 years on TNC preserves.
Fire mgmt plans approved
Conduct prescribed
burns, TNC, public, private
lands
Dry-mesic pine-oak/dri-mesic pine
forest
Dry pine forest
Dry-mesic hardwood system
Sand Plain wetland upland
complexes
· # of approved TNC fire plans covering # ha
Adequate staff and equipment to
conduct prescribed burns
X hectares burned by
2012
(1b) Develop funding source for
a full-time burn crew
(1a) Develop burn unit plans
within 5 years on TNC preserves.
Fire mgmt plans approved
Conduct prescribed
burns, TNC, public, private
lands
Dry-mesic pine-oak/dri-mesic pine
forest
Dry pine forest
Dry-mesic hardwood system
Sand Plain wetland upland
complexes
· # of trained staff available for burns
· Fire equipment
· $$ raised
Adequate staff and equipment to
conduct prescribed burns
X hectares burned by
2012
(1b) Develop funding source for
a full-time burn crew
(1a) Develop burn unit plans
within 5 years on TNC preserves.
Fire mgmt plans approved
(1c) Develop public and private
partnerships of landowners willing
to have fire managment on
their land.
Priority public lands id & plans & permits
in place to allow burns
Priority private lands id & plans & permits
in place to allow burns
Conduct prescribed
burns, TNC, public, private
lands
Dry-mesic pine-oak/dri-mesic pine
forest
Dry pine forest
Dry-mesic hardwood system
Sand Plain wetland upland
complexes· # fire plans covering #
ha of public lands
· # fire plans covering # ha of non-TNC private lands
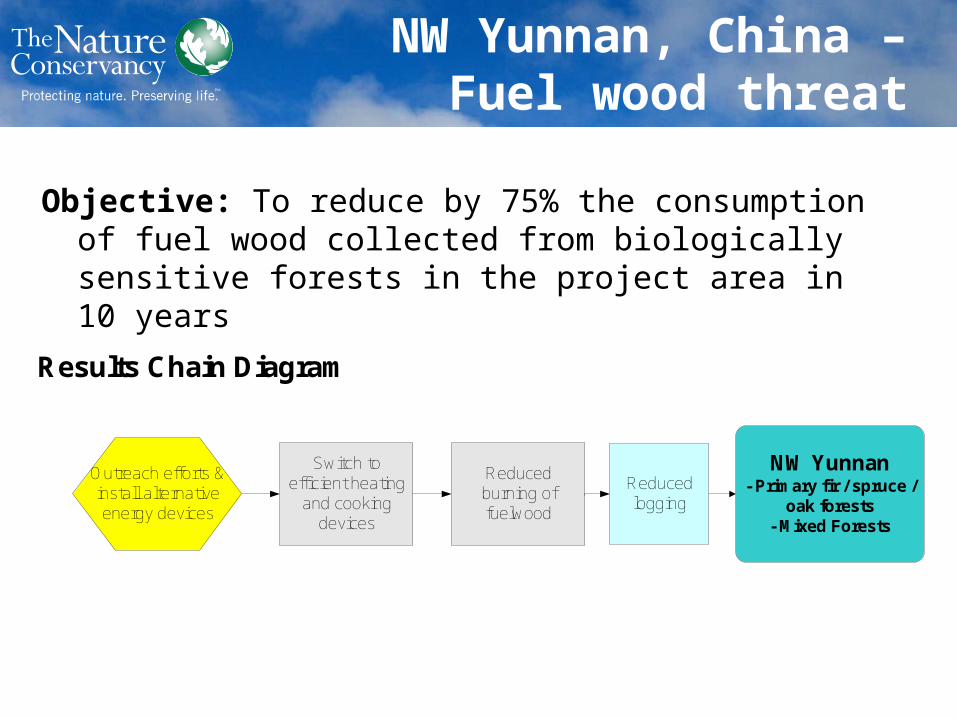
NW Yunnan- Primary fir / spruce /
oak forests- Mixed Forests
Switch to efficient heating
and cooking devices
Reduced logging
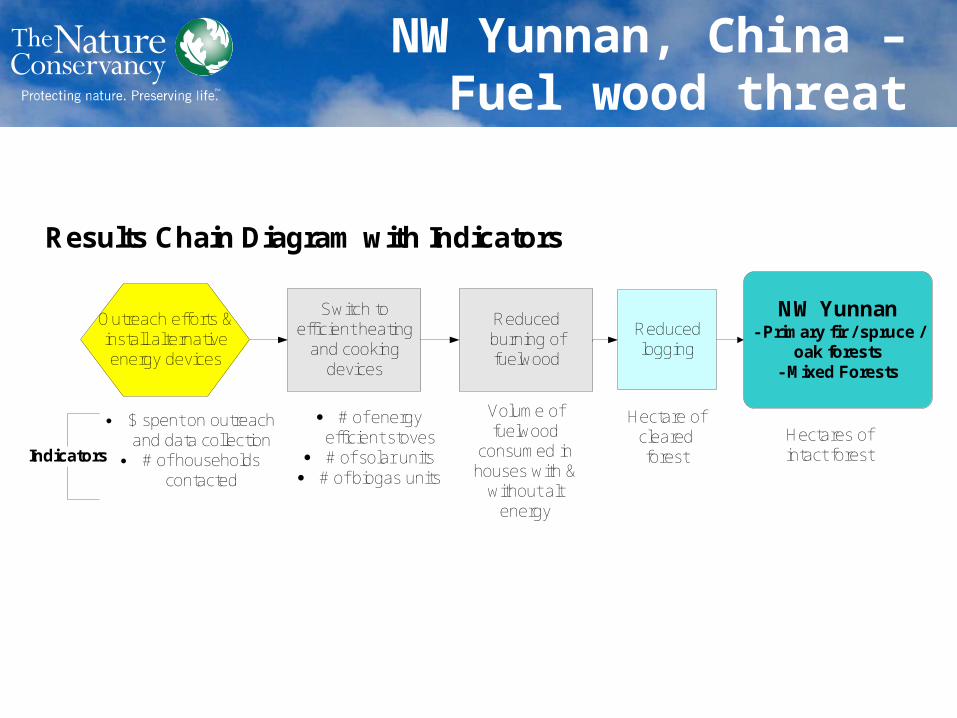
Results Chain Diagram
Outreach efforts & install alternative energy devices
Reduced burning of fuelwood
Objective: To reduce by 75% the consumption of fuel wood collected from biologically sensitive forests in the project area in 10 years
NW Yunnan, China – Fuel wood threat
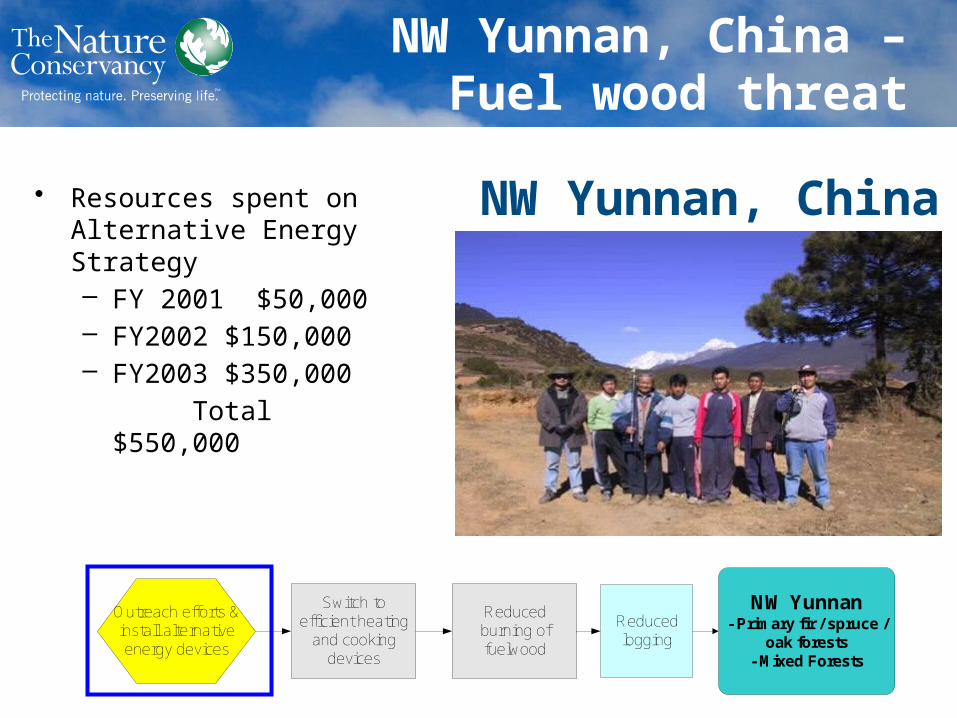
• Resources spent on Alternative Energy Strategy– FY 2001 $50,000– FY2002 $150,000– FY2003 $350,000
Total $550,000
NW Yunnan- Primary fir / spruce /
oak forests- Mixed Forests
Switch to efficient heating
and cooking devices
Reduced logging
Outreach efforts & install alternative energy devices
Reduced burning of fuelwood
NW Yunnan, China
NW Yunnan, China – Fuel wood threat
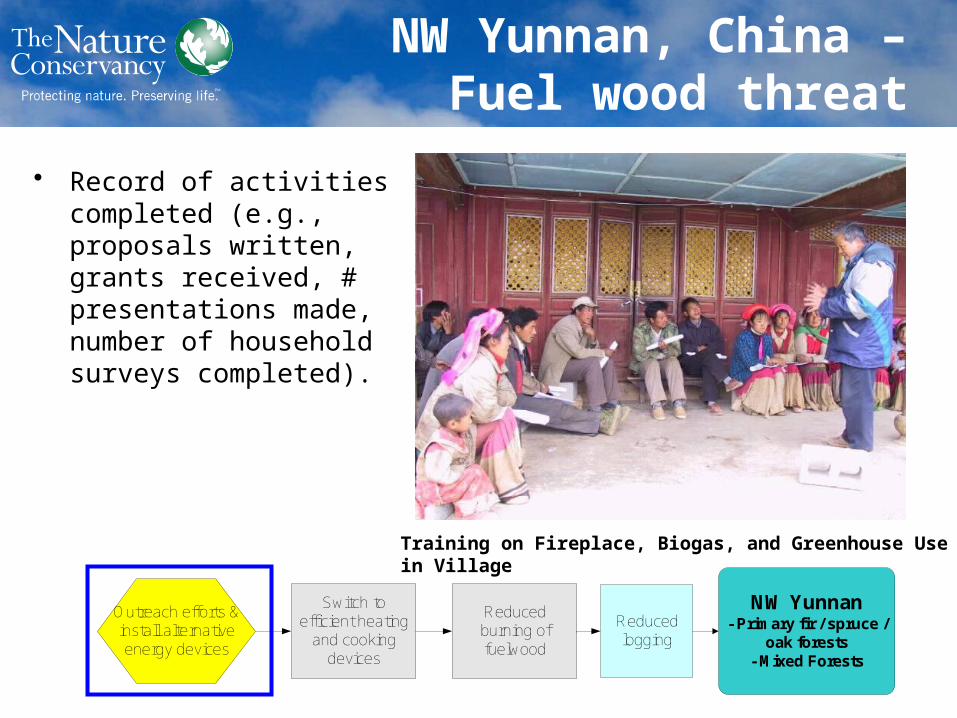
• Record of activities completed (e.g., proposals written, grants received, # presentations made, number of household surveys completed).
Training on Fireplace, Biogas, and Greenhouse Use in Village
NW Yunnan- Primary fir / spruce /
oak forests- Mixed Forests
Switch to efficient heating
and cooking devices
Reduced logging
Outreach efforts & install alternative energy devices
Reduced burning of fuelwood
NW Yunnan, China – Fuel wood threat
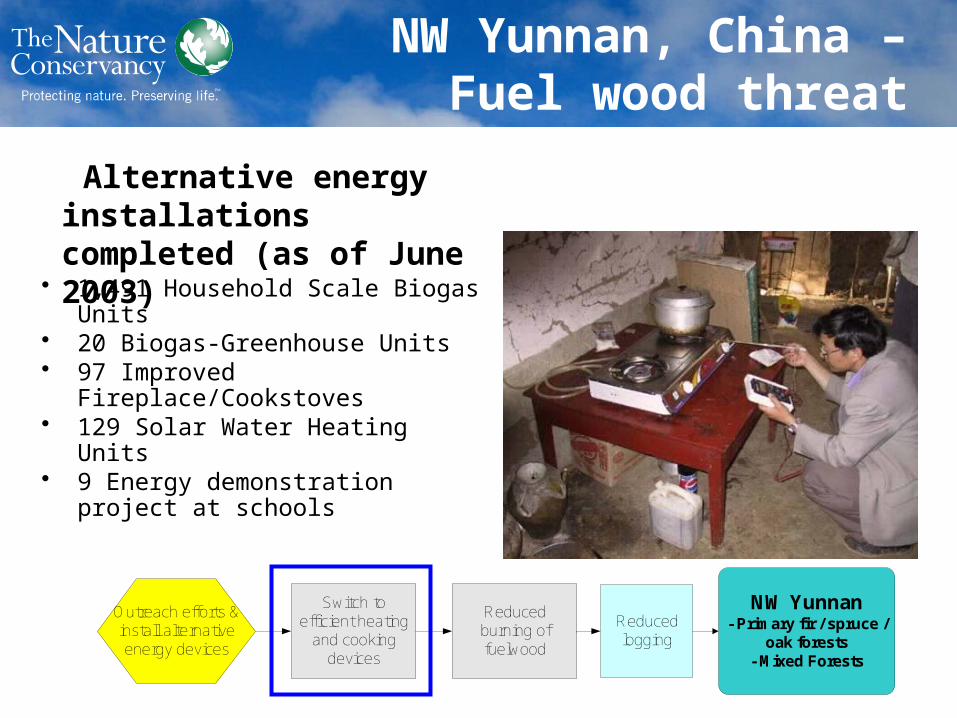
Alternative energy installations completed (as of June 2003)• 1,491 Household Scale Biogas Units
• 20 Biogas-Greenhouse Units• 97 Improved Fireplace/Cookstoves• 129 Solar Water Heating Units• 9 Energy demonstration project at
schools
NW Yunnan- Primary fir / spruce /
oak forests- Mixed Forests
Switch to efficient heating
and cooking devices
Reduced logging
Outreach efforts & install alternative energy devices
Reduced burning of fuelwood
NW Yunnan, China – Fuel wood threat
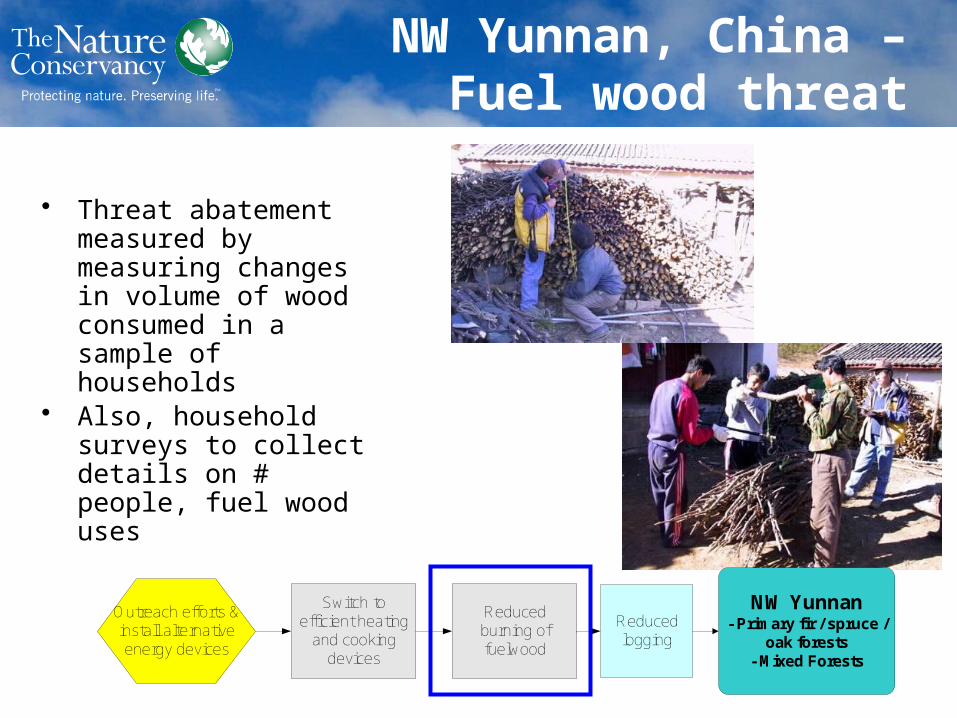
• Threat abatement measured by measuring changes in volume of wood consumed in a sample of households
• Also, household surveys to collect details on # people, fuel wood uses
NW Yunnan- Primary fir / spruce /
oak forests- Mixed Forests
Switch to efficient heating
and cooking devices
Reduced logging
Outreach efforts & install alternative energy devices
Reduced burning of fuelwood
NW Yunnan, China – Fuel wood threat
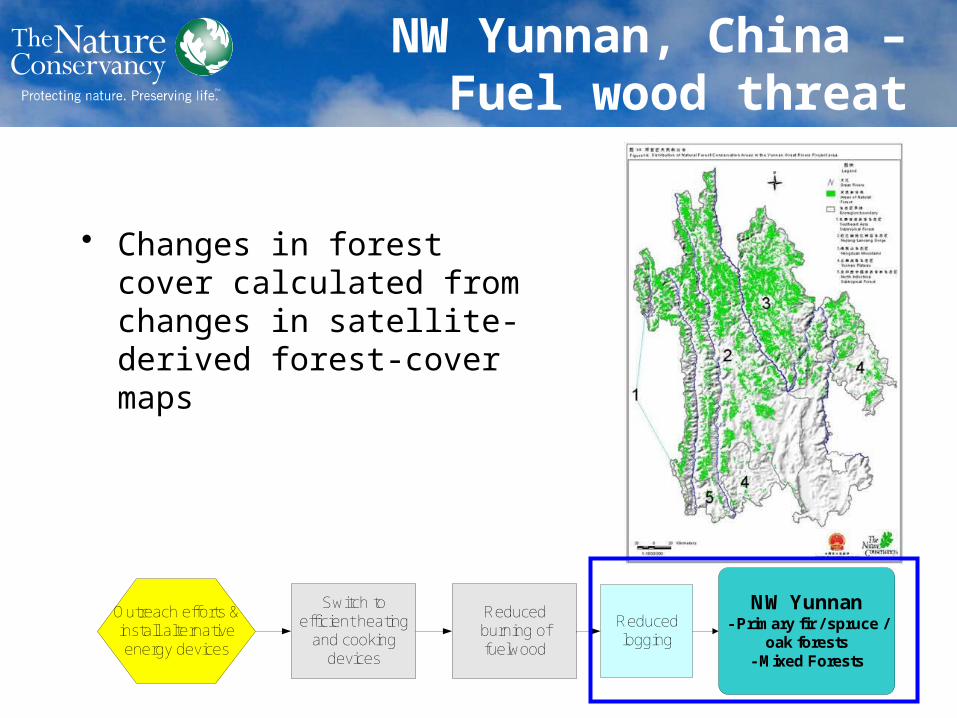
• Changes in forest cover calculated from changes in satellite-derived forest-cover maps
NW Yunnan- Primary fir / spruce /
oak forests- Mixed Forests
Switch to efficient heating
and cooking devices
Reduced logging
Outreach efforts & install alternative energy devices
Reduced burning of fuelwood
NW Yunnan, China – Fuel wood threat
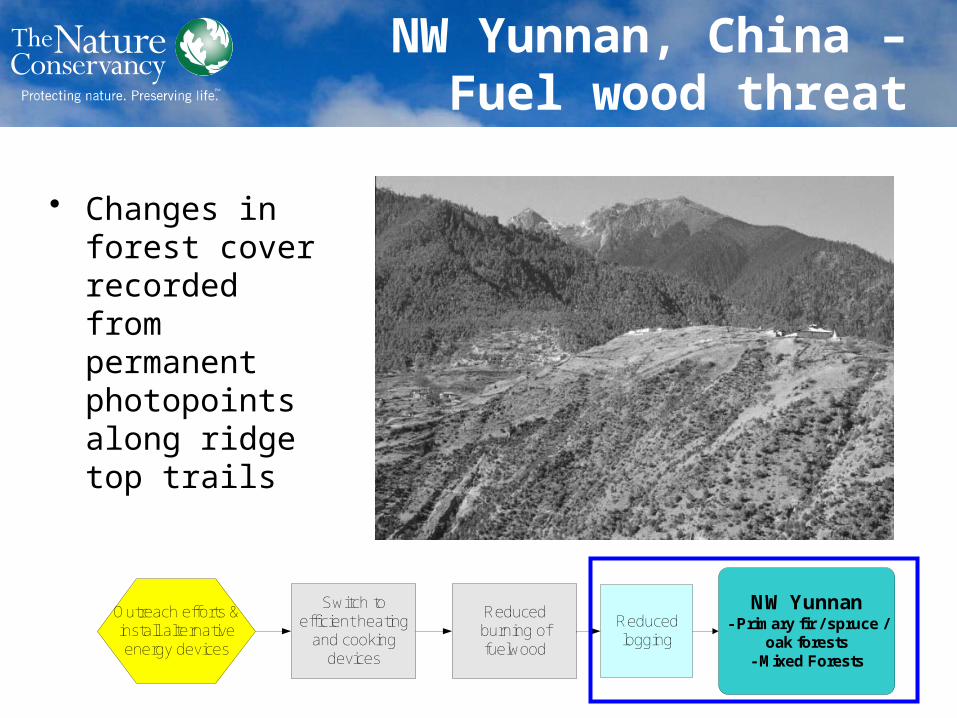
• Changes in forest cover recorded from permanent photopoints along ridge top trails
NW Yunnan- Primary fir / spruce /
oak forests- Mixed Forests
Switch to efficient heating
and cooking devices
Reduced logging
Outreach efforts & install alternative energy devices
Reduced burning of fuelwood
NW Yunnan, China – Fuel wood threat
NW Yunnan- Primary fir / spruce /
oak forests- Mixed Forests
Switch to efficient heating
and cooking devices
Reduced logging
· # of energy efficient stoves
· # of solar units· # of biogas units
Hectares of intact forest
Hectare of cleared forest
Results Chain Diagram with Indicators
Outreach efforts & install alternative energy devices
· $ spent on outreach and data collection
· # of households contacted
Indicators
Reduced burning of fuelwood
Volume of fuelwood
consumed in houses with &
without alt energy
NW Yunnan, China – Fuel wood threat
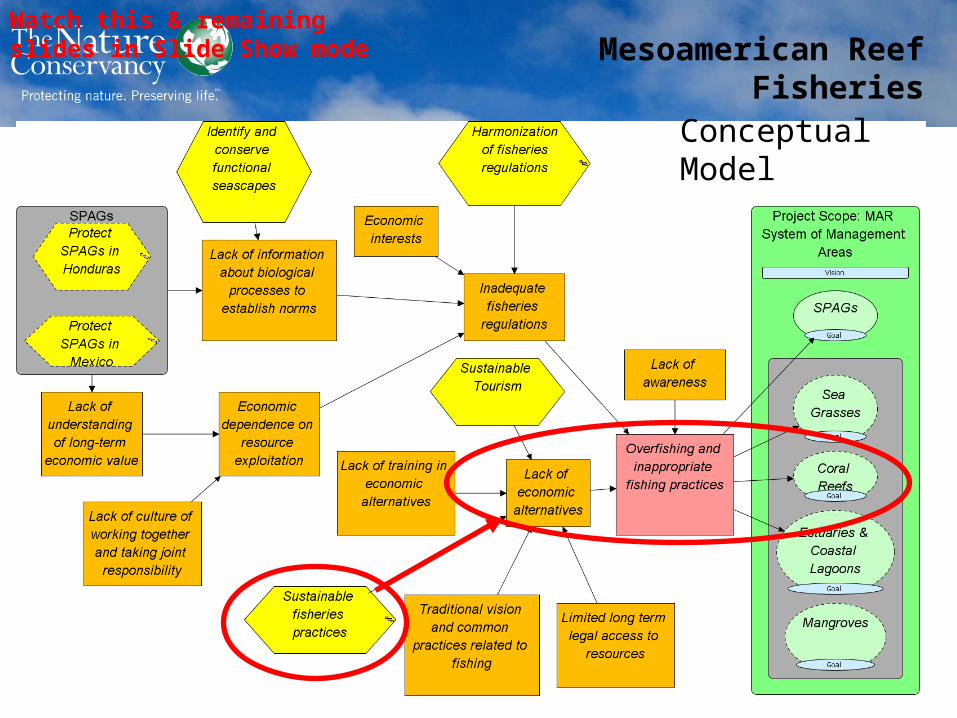
Conceptual Model
Mesoamerican Reef FisheriesWatch this & remaining slides in Slide Show mode
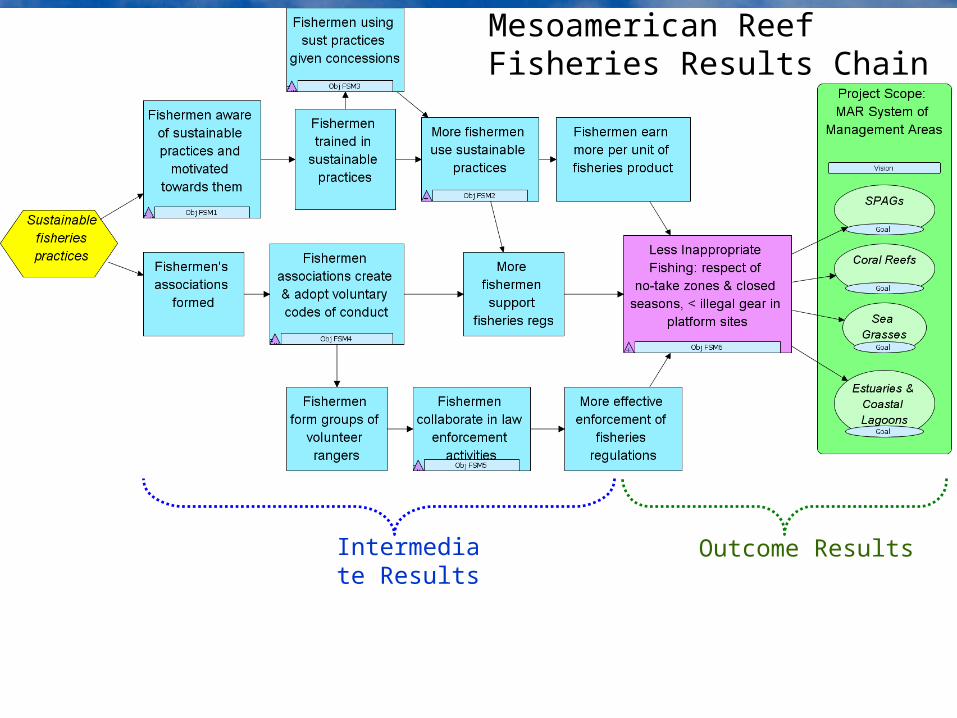
Objective FSM1: By 2011, at least 4 sustainable fisheries practices are identified that could be applied in and around priority sites.
Indicator FSM1-I1: # of sustainable fisheries products identified around priority sites for which there is demand
Objective FSM3: By 2012 there is at least one concession given to fishermen in Honduras using sustainable practices to have exclusive fishing rights to some species / areas in the priority sites.
Indicator FSM3-I1:# of concession agreement drafts prepared and approved by government and the fishermen of the priority sites
Objective FSM2: By 2012 30% of the fishermen in the relevant priority sites are aware of and capable of using the sustainable fishing practices identified in FSM1.
Indicators: FSM2-I1: % of fishermen aware of sustainable fishing practices; FSM2-l2: % of priority sites fishermen trained in sustainable fishing practices
Objective FSM5: By 2017, fishermen are collaborating actively in law enforcement activities in 6 priority sites.
Indicator FSM5-I1: # of law enforcement activities (patrolling, reports of infractions) where participation of fishermen is documented
Objective FSM6: By 2018, at least 80 % of the fishermen in 8 MAR Program priority sites comply with all fishing regulations (no-take zones, closed seasons, gear.
Indicator FSM6-I1: # of infractions; & FSM6-I2: # of law enforcement actions (warnings, fines, confiscation, jail)
Goal: By 2018, all validated and ecologically functional SPAG sites will maintain the conditions necessary to preserve the species (composition, abundance, proportion of sexes) documented during validation.
Indicators: (1) # of species that aggregate in specific periods; (2) # of individuals of each species during the peak of the aggregation period;
Goal: By 2018, more than 25% of all coral reef habitat types in the MAR are effectively conserved.*
Indicators: (1) Abundance of herbivore species; (2) Abundance of surgeon fish and parrot fish
* Working definition of effective conservation exists with multiple components
Mesoamerican Reef Fisheries Results Chain
Outcome ResultsIntermediate Results
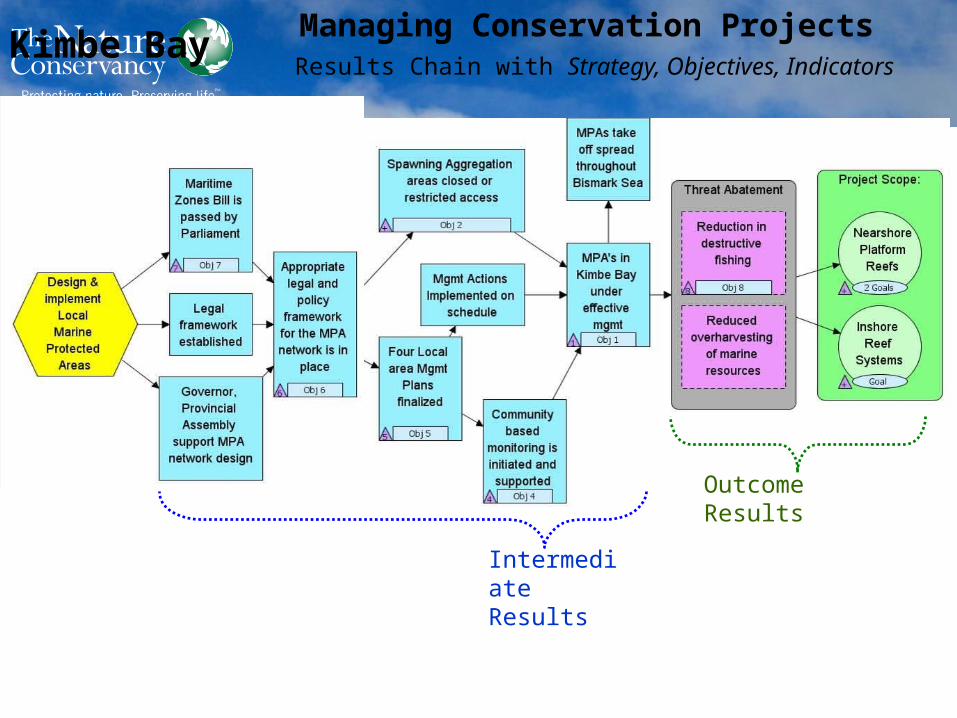
Managing Conservation Projects
Results Chain with Strategy, Objectives, Indicators
Objective: By FY09, Section 38 of the Maritime Zones bill is expanded to establish marine protected areas
Indicator: Bill passed/failed
Objective: By FY 12, live coral cover of reef systems increased to over 50%
Indicator: % cover live coral
Objective: By FY10, design and legally secure a functionally-connected network of LMMAs and MPAs in Kimbe Bay covering 250,000 ha.
Indicator: Area (ha) designated as LMMA
Objective: By FY12, 4 active spawning aggregation sites closed or with restricted fishing practices
Indicator: # of SPAGs closed to fishing
Objective: By FY17, 250,000 ha of LLMA's under effective management in Kimbe Bay
Indicator: ha with acceptable Mgmt Effectiveness Scores
Outcome Results
Intermediate Results
Kimbe Bay
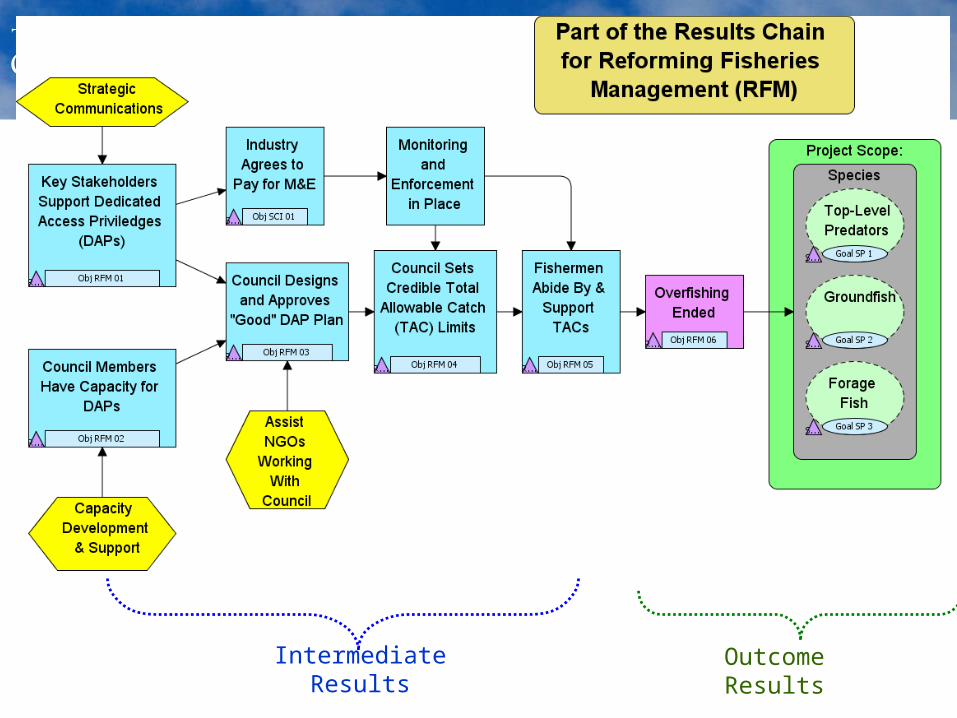
Objective: By the end of 2009, Council staff have the knowledge and capacity to implement a pilot test of DAPs.
Indicator: Assessment of Capacity of Council
Objective: By the end of 2009, the council approves a "good" DAP plan. Criteria include: 1. Comprehensiveness; 2. Minimal Proccessor Quota; 3. Adaptive Management Trust; 4. Gear Switching Provisions
Indicator: Quality of DAP Plan Approved (specific criteria established)
Objective: By 2010, the council has set Total Allowable Catch (TAC) limits for each stock that are within scientifically credible "sustainable" limits.
Indicator: # of Stocks with Credible Catch Limits
Objective: By 2012, there are no more than 10 incidences per year of fishermen violating the TAC Limits.
Indicator: # of Incidences of TAC Violations
Objective: After 2012, all 37 fish stocks in the Ecoregion are fished at levels consistent with an ecolocially sustainable harvest.
Indicator: # of Fish Stocks at Sustainable Limit
Goal: By 2015, have at least 5.0 groundfish per hour from average party boat CPUE measurements.
Indicator: CPUE Levels for Groundfish Outcome ResultsIntermediate Results
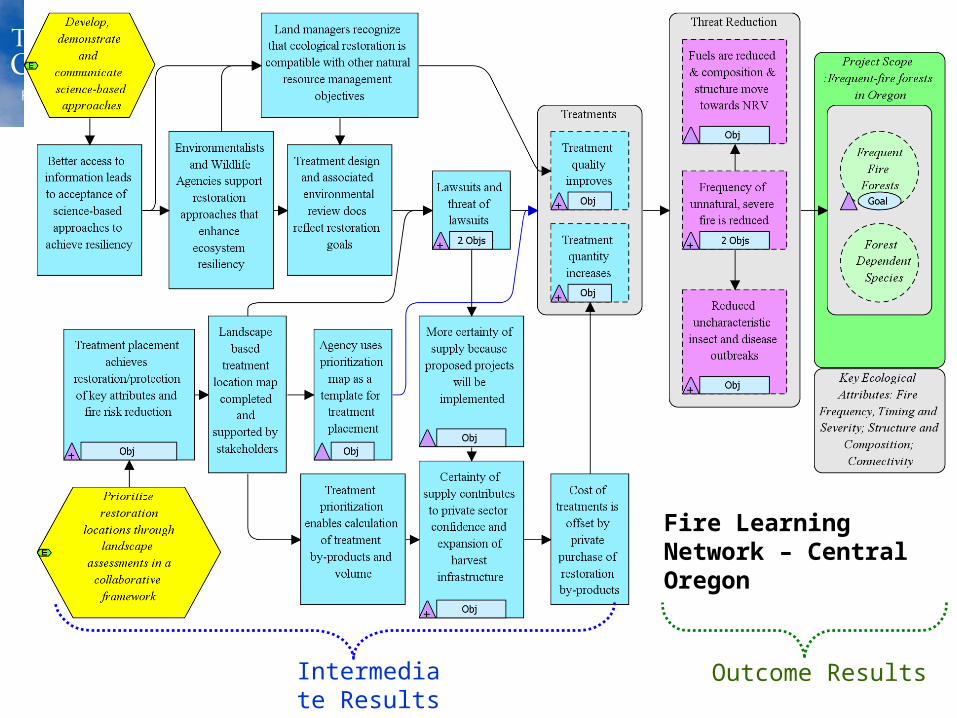
Objective: # of NEPA approved projects increases by a third by 2020.
Indicator: # of NEPA approved projects
Objective: # of acres treated increases by 30% by 2015
Indicator: # of acres treated
Objective: 75% Reduction in acres of severe fire and/or unnatural mortality due to insects and disease by 2030
Indicator: # acres of severe fire and/or unnatural mortality
Goal: 20-30% of Frequent Fire forests on public are in Condition Class I.
Indicator: % Departure from NRV
Objective: By 2020 the percent of restoration projects appealed reduced to 25%.
Indicator: # of appeals/# of projects Outcome ResultsIntermediate Results
Fire Learning Network – Central Oregon
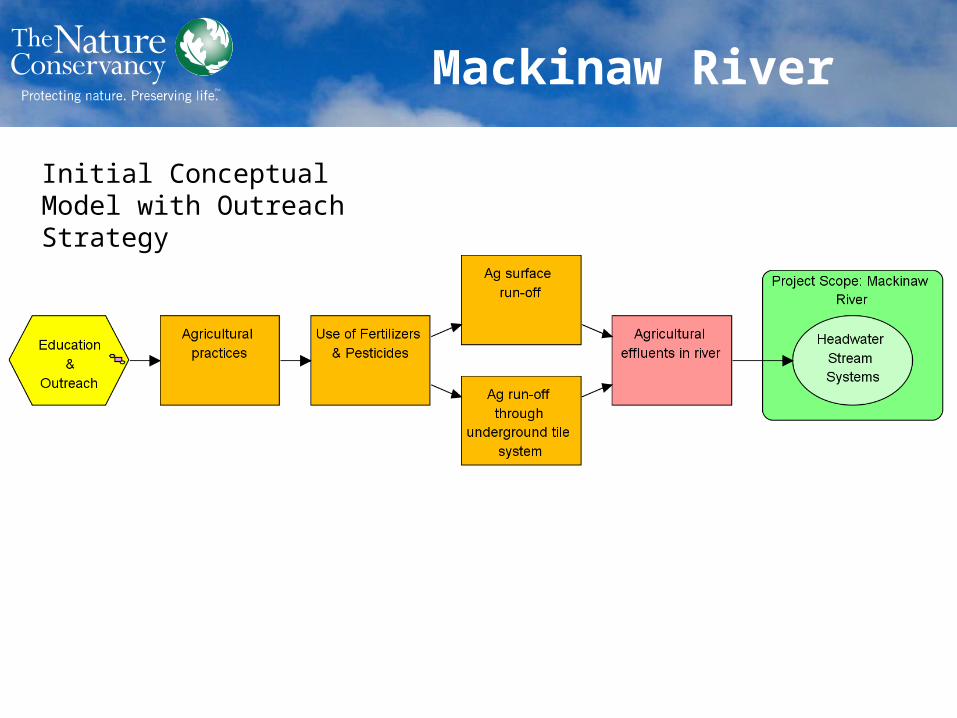
Mackinaw River
Initial Conceptual Model with Outreach Strategy
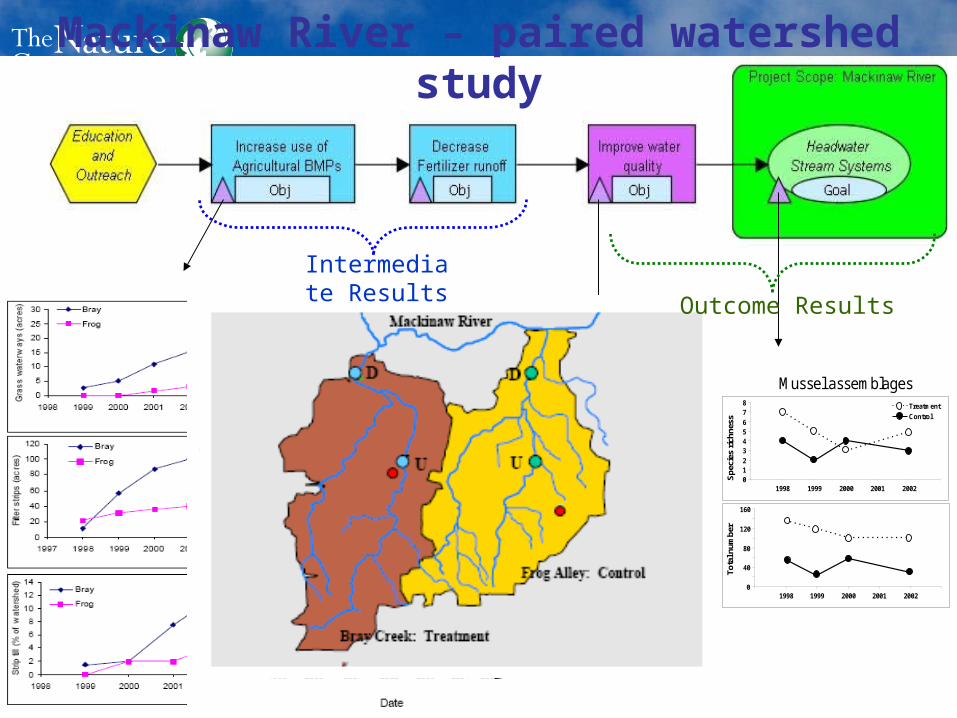
No detectable improvement in water quality or conservation targets in treated watershed as compared to the control.
Results demonstrate increased use of Best Management Practices in the treated watershed as compared to the control
Mackinaw River – paired watershed study
012345678
1998 1999 2000 2001 2002
Spe
cies
ric
hnes
s
0
40
80
120
160
1998 1999 2000 2001 2002
Tot
al n
umbe
r
Mussel assemblagesTreatment
Control
Outcome Results
Intermediate Results

Mackinaw River
Revised Conceptual Model with new Tile-Drainage Abatement Strategy