Embed Size (px)
Citation preview

MONcrHL1C
BUSINBSS RBVIEW FEDERAL RESERVE BANK o F DALLAS Vol. 40, No.7 DALLAS, TEXAS July 1, 1955
PROBLEMS IN SOUTHWESTERN INDUSTRIALIZATION
PHILIP E. COLDWELL, Director of Research
Federal Reserve Bank of Dallas
The cotton-cattle-oil economy of the Southwest in the 1930's has broadened rapidly in the 1940-55 period to include a fourth major producer - industry. In fact, this industrial growth is proving to be one of the most important changes in the structure of the southwestern economy, although recognition of the significance of this new source of income has come slowly. During the past 15 years, industrial growth has been so rapid that the Southwest is now a major producer of chemicals, transportation equipment, steel , aluminum, and magnesium, as well as an important producer -locally or regionally - of many other commodities.
Perhaps even more important are the potentialities of this area for further industrial growth. The Southwest has an abundance of raw materials, a rapidly rising population, an increasing market for all types of industrial products, a comprehensive array of transportation facilities, and an economy that is in the process of shifting from its agricultural heritage. These and other factors provide an environment which lends strength to the industrial future of the area_
However, a number of problems have been created or reemphasized by this industrial growth. In general, insufficient recognition and attention has been given to these problems and their possible solutions. The Southwest has not analyzed its industrial progress adequately, nor the problems resulting from that growth.
In order to understand and appreciate the ' problems of industrialization in the Southwest, it is first necessary to review the growth, extent, and character of that industrialization. Many aspects of this growth - such as its rapidity, concentration in location and type, and particular potentials for the future - have a definite bearing upon the problems created in the Southwest.
Development of Industrialization
Industrial growth in the Southwesl - Arizona, Louisiana, New Mexico, Oklahoma, and Texas - has taken place most
rapidly in the past 15 years. Between 1939 and 1953, value added by manufacturing increased over 600 percent, and manufacturing employment rose from 301,436 to 728,100. During the same period, wages and salaries paid to manufacturing workers increased about 700 percent, while total incon1e payments in this area rose only 364 percent. In 1939 the Southwest accounted for only 3 percent of the Nation's manufacturing employment; now it provides employment for over 5 percent of such workers_
In the postwar period 1947-53, the average rate of growth per year in the Southwest was $359,800,000, or nearly 13 percent, in value added by manufacturing and 36,900, or 7.3 percent, in manufacturing employment. The national rate of growth per year in these indicators was 13 percent in value added and 3.5 percent in manufacturing employment.
Southwestern industrialization has been most noticeable in a relatively small number of areas. In Texas, 59 percent of the manufacturing employment and 64 percent of the total
MANUFACTURING EMPLOYMENT SOUTHWEST AND UNITED STATES
'93t,I '47, ond 19~O-~~ WI LLIONS or p[IiISONS
NIT [ O STA1£S " I 8
• UNITED STATES--. -- /
THOUSANDS or P[IfSONS SQUTHW m
00 9
'" i\.1 " .. I
6 00
4
/ , ... '" "'-1-"'- 7 00
, , ,...../' " " ,
0"" , ..
" .,~ SOUTHWEST
, " ,." ,." ,." ... ' 1939 1950
SOU II C[! S !al •• ", pla ,,,, . .. 1 og .~~i • • · " ogo an d . a la 'y .. o.~ • • I, 19~O· ~~ . U S· Bu •• ou 01 Iht C o ".~. · 0 11 ",oftul oe ' u, I" Q " o' ~"" 19 ~9 Oft G 19 4 ' .
• 00
, 00
4 00
, '"
00
1955
This publication was digitized and made available by the Federal Reserve Bank of Dallas' Historical Library ([email protected])

90 MONTHLY BUSINESS REVIEW
wages and salaries paid to manufacturing workers in 1953 were concentraLed in five counties - Harris, Dallas, Tarrant, Jefferson, and Bexar. In 1953, of the 312 Texas manufactur· ing plants employing more than 250 workers per plant, over 55 percent were located in these five counties. If the number of counties is enlarged to 10, their total accounts for 70 per· cent of the manufacturing employment and 67 percent of the plants employing over 250 workers.
Nevertheless, there has been a movement toward the estab· lishmcnt of small "pockets" of industrialization. In the Eleventh District, there are at least eight such "pockets" where recent industrial development has been particularly evident. For example, the areas of Waco, Rockdale, Tyler. Longview·Gladewater, and Corpus Christi, Texas, all could be classified as rapidly gaining centers of industrial growth.
The industrial growth of the Southwest has been featured by concentrated dcvelopment in a few lines of manufacturing. The maj or increases in employment have occurred in chemicals, petroleum, transportation equipment, primary metals, nonelectrical machinery, and apparel. Gains in employment in these six categories accounted for nearly 57 percent of the total increase in manufacturing employment between 1939 and 1953. The first four accounted for most of the spec tacular gains in employment and for a major portion of the large plant construction expenditures in this period_
Recent estimates indicate that the Southwest has completed recently or has under construction or planned a total of $863,800,000 of chemical facilities.
While it is important to recognize the concentrations of industrial growth as to both location and type of industry, it is also important to observe the emergence of new industries and the changing pattern of the developing industrial complex. Although nondurable goods manufacturing still requires the largest number of workers and contributes the greatest share of the area's value added by manufacturing, there has been a decided increase in the durable goods manufacturing field. In fact, durable goods producers accounted for over 50 percent of the total gain in employment and about 35 percent of the total increase in value added between 1939 and 1953. In the long run, these developments of durable goods industries should be of great importance through the attraclion of industries which expect to serve the local market.
Another feature of the industrial growth of the Southwest has been the development of industries in which a high investment cost per worker is a general characteristic. This is particularly noticeable in the chemicals; petroleum, potash, and copper refining; transportation equipment; and primary steel industries of the area. While there are many small plants in other industries (such as apparel and food establishments)
CONCENTRATIONS OF MANUFACTURING EMPLOYMENT *
ELEVENTH FEDERAL RESERVE DISTRICT
1954
~ 1,000-4,999
~ 5,000-9999 ~ 1
~ 10,000-24,999
lIB 25,000 AND ABOVE
* Covered employment under the voriou$ slale lows.
SOURCE; Stote employment agencies.
MONTHLY BUSINESS REVIEW 91
where investment costs are relatively low, the postwar growth has been led by industries requiring fairly substantial invest· ments in plant and equipment This characteristic emphasizes the development of large plants in the recent industrial growth. In 1953, nearly 50 percent of Texas manufacturing workers were employed in plants hiring more than 250 workers each. Between 1939 and 1953, over 60 percent of the total increase in Texas manufacturing employment oc. curred in such large.scale plants.
Finally, with the exception of aircraft and ordnance plants, most large·scale manufacturers entering the Southwest before 1947 were attracted primarily by abundant supplies of oil, gas, potash, copper, and lignite. However, in recent years a significant movement of industries to the Soutbwest has been occasioned by the desire to serve the growing market of this area. Of course, certain native industries, such as local clay and brick products plants, have been in the area for a long time, but the pressure of rising market demand upon long· distance distributive channels has caused major consumer goods industries to give increasing consideration to the loca· tion of plants in the Southwest
Problems of Growth and Locational Concentration
Many of these characteristics of southwestern industrial growth have led to an intensification of existing problems or to the introdnction of new problems to the Southwest. The speed with which industrial growth has progressed has caused certain areas of the Southwest to concentrate their facilities in a limited number of types of industry. Not only are these areas developing unbalanced manufacturing facilities, but manufacturing is outweighing developments in other lines of economic activity. Such imbalances are evident in the changing sources of income and in the concentrations devel. oping in these areas.
Balanced economic growth may be more of a theoretical than a practical objective. Certainly, it is not economically sound to expect each area to develop industries to supply all of its needs. There are economic advantages which will attract certain industries to a particular locality, and it should be expected that concentrations will develop. This is espe· cially true where raw materials are a dominant factor in the location of a plant. However, the reliance of a community upon a specific type of industrial activity, such as a chemical plant or a group of such plants, may be just as troublesome in periods of declining production as reliance upon a specific agricultural crop, such as cotton, when yields or prices are falling.
The rapidity of growth in industrial plants and the concentration of such plants in a few areas have caused a number of local problems. Such municipal facilities as sewerage, streets, water, power, and police protection have been strained by the sudden influx of large numbers of workers, by the need to service ever-increasing areas of suburban development, and by the requirements of new plants and new industrial areas. Similarly, traffic congestion has multiplied, as new workers crowded into city streets which already were carrying loads far in excess of their normal capacity. Industrial growth also
has a ttracted more workers and their families from the farm to the city. This, in turn, has aggravated postwar housing shortages in the industrial areas. The city officials of the new industrial areas are recognizing problems of zoning and city planning, as well as the new problems of air and water pollution. The establishment of new suburban residential areas and nearby shopping centers is competing with the establishment of new industrial sites, and the price of land has risen rapidly.
Problems of Industrial-type Concentrations
The pattern of industrial growth in the Southwest can be traced through a classification of the industries of the area. In general, there are three types of industries - those locating in the Southwest because of raw material availability, those related to military or defense needs, and those locating in the area to serve the local or regional market. The majority of the larger plants, exclusive of aircraft plants and ordnance works, were brought to the area primarily because of the existence of a large supply of raw materials. While there is no evidence of an imminent reduction in the supply of such materials, it should be remembered in long-range planning that they are subject to depletion.
Similarly, many of these industries require a high fixed investment per worker. This characteristic means the construction of high-cost facilities, including the use of valuable industrial sites, without a substantial addition to manufacturing employment. In many cases, such industries are large water users and must be near several forms of transportation. F or the Southwest, these high fixed investments mean an initially high construction expenditure and, in many instances, a repetitive maintenance which requires considerable flexibility in the labor force. At the same time, the high fixedinvestment plant usually requires highly skilled workers. While it is to the advantage of the Southwest to attract such w01'kers, much of the immediate problem of handling displaced farm workers is not solved by the construction of plants requiring only skilled technicians.
The second group of industries - aircraft, ordnance, and, to some extent, fabricated metals industries - is dependent upon military contracts of the United States Government. These contracts are noted for their fluctuations; and, as was demonstrated in 1954, areas of unemployment may develop if contracts are canceled or military establishments deactivated. Balanced industrial production might have reduced the effect of these changes.
The third group of industries is divided sharply into two segments - first, local industries which have been here for many years and, second, new industries just coming into the area because the market for goods and services is now large enough to warrant their establishment. In general, the new industries attracted by the growing market of the area are locating near the centers of population or in sections where transportation facilities enable them to service the areas adequately. While there will be continued growth in industries attracted by raw materials and, perhaps, some increases

92 MONTHLY BUSINESS REVIEW
in defense-related industries, it is the growth of industries based on the market of this area that gives the most promise for future industrialization of the Southwest_
The industrial complex of the Southwest is sufficiently mature to require consideration of another nationwide problem - that of dispersion versus concentration_ To protect against a complete demolition of industrial facilities by air attack, it would seem logical to disperse future facilities into less populated sections of the Southwest There are a number of excellent economic reasons for the location of industrial facilities in or near existing centers of industrialization, but, with minor adjustruents, some sections not currently industrialized could serve equally well as distribution points for market-based industries_
It should be recognized that the people in the majority of the counties in the southwestern states still receive most of their income from agricultural production_ Only in a few "pockets" of industrialization has there been a substantial mixing of the agricultural and industrial sources of income_ Thus, to most of the Southwest, the problem of industrialization - and, perhaps to all the Southwest, the problem of dispersion - is one of attracting industry to the smaller centers of population and diversifying the economies of these areas.
In the majority of small towns, the problem of attracting industry is largely a lack of knowledge as to where to start and what to do. Several steps are i'h order to start a town toward industrialization. One of the first is to ascertain whether or not the majority of the citizens of the town really are interested in attracting new industry_ If it is found that they are, then the next step is probably one of assessing the advantages and disadvantages of the local economy, with a view toward preparing a brochure to advertise the town. It is important to obtain an accurate and complete evaluation of the resources and facilities of the town_ If there are special conditions, such as a highly skilled labor force, these should be covered in detail.
After preparing the brochure, the town needs to decide upon the type of industry best suited to the advantages offered and best qualified to meet the requirements of the area. Following this decision, the problem becomes one of contact and persuasion_
In recent years, some cities bave created industrial foundations to spearhead the drive for new industry_ Probably the greatest advantage of an industrial foundation is consolidating a city's desire for new industries and providing a working force to prepare brochures and establish industrial contacts. While these foundations have been generally effective, some cities have believed it necessary to go even further and offer free buildings, equipment, and even cash to aUract new industries. Where such inducements go beyond leasing or renting a building to a new industry, the city, in effect, is subsidizing that industry. Such subsidies seldom are warranted and may lead to the establishment of industries which should be located in other areas for most efficient operations. Moreover, these subsidies are unfair to existing manufac-
tnrers and may cause resentruent, which, in the long run , might not be offset by the gain of a new plant.
Special Problems
A special problem affecting nearly the entire Southwest and having a distinct relationship to present and future industrial growth in this area is the complex problem of water supply_ In the eastern sections of the Southwest, there is a potentially ample supply of water, but nearly all the cities in these sections are concerned about their existing supplies. In west Texas, New Mexico, and Arizona, water shortages are common and the potential supply is very smaIL These shortages impose a definite limitation upon both economic and population growth.
To obtain some idea of the magnitude of the prohlem, it might be pointed out that the industrial consumption of water in the Southwest averages in excess of 30 percent of the total consumption of water_ This places industrial consumption second only to irrigation requirements, which, in Texas, account for over 50 percent of its water usage_ Human consumption is gaining rapidly but is probably less than 25 percent in Texas and Louisiana, although somewhat more in the other states of the District.
In Texas the industrial consumption of water was approximately 1,159 hillion gallons in 1953, and the State ranked third in the Nation, following Pennsylvania and Ohio. Tbe Texas chemical industry consumed 752 billion gallons, or 65 percent of the State's industrial requirements_ Other major industrial users were petroleum and coal products manufacturers, 321 billion gallons; primary metal industries, 48 billion gallons; transportation equipment plants, 2 billion gallons; and all other industrial users, 46 billion gallons. Fortunately, a substantial amount of this water can be drawn from the Gulf of Mexico, thus reducing the drain on freshwater supplies in the area_ In addition, some recycling of water is possible in many plants. Such conservation measures will become increasingly important as availahle supplies are utilized more fully.
In some areas of the Southwest, industrial growth already has been restricted because of a shortage of water supply. Other areas face early restrictions unless immediate action is taken to increase the firm supplies of water available for both industrial and human consumption_ It is believed that there is sufficient surface water in most of Texas, Oklahoma, and Louisiana to provide for all present and immediate future needs if conservation of runoff is pursued actively_
Thus, the most pressing aspect of 'the water prohlem is the planning, scheduling, financing, and construction of water conservation projects_ Many plans for such projects have been drawn by various agencies of the state and Federal governments, but no master plan for the full development of southwestern rivers has been devised_ Even if such a plan .. were available, its completion would require at least 10 years_ • Therefore, the Southwest will be faced with shortages for the next decade, and perhaps even longer, if immediate action is not taken. .

MONTHLY BUSINESS REVIEW 93
There are many roadblocks to prompt action on water conservation. Disagreements between various government agencies, as well as intermittent bickerings between towns, have retarded the developmcnt of southwest rivers. In addition, there is no unanimity among the people of the area as to the purposes for which river development should be conducted. Some believe that flood control is still the major reason for dam and reservoir construction, while others insist that water supplies should be the prime reason for such developments. Another difficulty is the controversy over the best approach to conservation - whether to use upstream development, small dams, or large dams.
All these problems are secondary to the job of getting action on a plan for water conservation. Clearly, if the Southwest is to continue its industrial growth, water supplies must be made available. Even if present supplies are utilized most effectively, it is estimated that within 25 years the area must look beyond its borders for additional water to sustain the expected growth in population and industry.
A second special problem for both the present and the future industrialization of the Southwest is the general but multifaceted problem of labor. It is expected that the needed supply of labor, in terms of the total number required, will be drawn from both natural increases in the labor force and population and in-migration from other areas of the country. While isolated industrial centers may suffer temporary labor shortages, the mobility of labor has increased so much that movement between cities or states is now less of a problem than it was 20 years ago. In other words, with a given supply of jobs offering adequate compensation and attractive working conditions, the labor supply can be drawn from nearly any part of the country. While labor availability would tend to diminish as supply tightens, probably only in a period of overfull employment would there be any serious restriction on the availability of labor.
However, in special fields of employment, long-range shortages are in prospect. The increasing mechanization of industrial operations is causing a larger and larger demand for skilled employees. In many cases, the skills required are those obtained only after extensive education and training. To meet the challenge of- providing such skilled workers, the Southwest needs to redouble its efforts to obtain adequate educational and training facilities and to encourage young men to enter these fields of work. In addition, southwestern industry must provide retraining facilities for workers to handle the new jobs created by mechanization of industrial processes. In general, such retraining will mean an upgrading of skills for these workers. As the standards of labor are raised in the Southwest and this area shows itself to be in a position to meet most demands for skilled employees, new industries no longer will bring their highly skilled workers into the area but, instead, will rely upon this area to fill their labor requirements.
Within the general labor problem is the fu,rther difficulty of utilization. A certain amount of flexibility in the labor force is a necessity. There should be sufficient elasticity to allow for withdrawals for training and for the normal turn-
over of workers. Overfull employment means the utilization of less efficient segments of the labor force, as well as costly overtime for the majority of workers. Clearly, there is a definite economic waste in the inefficient use of labor, as of any other factor of production. Seasonal fluctuations requiring large additions to employment and equal decreases at a later time do not encourage an effective utilization of labor resources. This, in turn, brings on the problem of smoothing production schedules to maintain a more constant labor force. Some industries might be able to improve the regularity of production and employment by rotation of products, better scheduling, or more effective utilization of workers.
Finally, the labor problem includes many aspects of labormanagement relations. Such relations can be conducted in a peaceful, stable atmosphere. In order to achieve this environment, problems of education on both sides of the bargaining table will need considerable attention. Neither management nor labor can be expected to learn overnight, but a gradual understanding of and appreciation for the rights and privileges of each other should go a long way toward providin~ an atmosphere of mutual trust and respect.
There are, perhaps, many other problems which will come to the attention of the Southwest as industrial growth continues. Some are problems not yet visualized by even the most farsighted businessmen. Others are just beginning to evoke discussion and study as to their possible effects upon the Southwest. One of the latter is the development of atomic energy. While no def~itive answers can be obtained at present, the consensus among experts in the field is that widespread commercial applications of atomic energy will not be developed for at least 15 to 25 years. It would seem logical that when such applications are made, they will be started in electric-power plants and, perhaps, in the heavier types of industry. Such a starting point for commercial atomic energy is likely because of the need for massive protective shields which can be installed only where space and weight are not at a premium. For this reason, one could not expect the immediate development of atomic-powered automobiles or buses.
Thus, the initial development appears to be the use of atomic energy as a fuel in competition with oil, gas, and coal. This reasoning is the basis for the concern over the effect of atomic energy upon the gas and oil industries of the Southwest. There is little doubt that the technical and cost problems currently retarding atomic developments will be solved eventually. It is, therefore, a matter of time, although some people have ventured the guess that solar energy will be harnessed before atomic energy becomes commercially feasible. However, assuming that atomic energy is available for electricpower generation witllin 25 years, what is likely to be the effect upon the oil and gas industries of the Southwest?
For the oil industry, the initial impact of atomic developments probably will be negligible. Very few generators are powered by oil in the Southwest, and those so powered elsewhere in the country use only a relatively low grade of oil. Thus, it would seem that until atomic energy invades the more lucrative markets for oil, such as the automotive gaso-

94 MONTHLY BUSINESS REVIEW
line area, there should be no real reason for concern about its effect upon the oil industry.
In the gas industry, it is likely to be a somewhat different story, but with approximately the same result. If large num· bers of electric.generating plants adopt atomic energy as fuel, it is possible that natural gas will be displaced. However, because of space limitations, atomic energy probably will be a long time entering the primary market of natural gasthe home· heating market. With a rapidly expanding resi· dential market in this country, it is doubtful if the loss of electric·generating plant demand could be sufficiently serious to affect the total market for natural gas. However, because electric·plant demand is generally an off·season demand, its loss might require the development of storage facilities or other off·season demands to insure continuous operation throughout the year.
There is another aspect of the coming atomic age which could be of considerable importance to southwestern indus· trialization. The possibilities of atomic developments in the Southwest are tremendous, but taking advantage of them presents a number of problems. In the first place, with the exception of installations in New Mexico, there is a notice· able lack of trained physicists and other professional workers necessary for the establishment of atomic plants. Tbis short· age is a nationwide problem but is particularly acute in the Southwest. Second, and equally serious, there is no major producer of electric equipment or o;,lectronics who would be large enough to handle the development of an atomic reactor. Third, and probably a result of the first two, there is an insufficient amount of research and research facilities available in the Southwest. Until these three problems are solved, it is doubtful if the area will contribute much toward the development of commercial atomic energy or be affected greatly by it.
The Outlook
The characteristics and problems of industrial growth in the Southwest suggest a number of directions toward which it would be desirable for future industrialization to grow. To correct some of the imbalances introduced by the rapidity of growth and to reduce the dependence of individual centers upon specific types of manufacturing, future industrial growth near these centers should be based on market attraction, with considerable variety being the prime requirement. On the other hand, to alleviate crowded conditions in the present centers of industrialization, to relieve some of the burden upon municipal facilities in these centers, and to diversify the sources of income of present agricultural centers, new industries should be encouraged to locate in the smaller
towns and rural areas of the Southwest. This is particularly desirable for new industries which continue to be drawn to this area by the supplies of raw materials. Of course, where an overwhelming economic advantage lies in locating in the existing centers of industrialization, the above·mentioned considerations may be of little consequence.
It should be a major objective of the Southwest to attract more industries whose primary reason for coming to the area is to satisfy the local or regional market. These will reduce the dependence upon raw material availability and provide final-product industries to serve the local market.
The smaller towns in the area should make a concerted effort to attract industries that have a steady, but growing, employment need and whose general requirements best fit the resources and facilities of the individual towns. While the attraction of a very large plant would be considered a great achievement, a small to\\'n conld hardly afford the troubles such a plant would bring. Instead, a number of small manufacturing plants brought in as a result of a true evaluation of the town's advantages would seem to be a wiser choice.
In future attempts to attract industry to the Southwest, considerable attention must be given to the water requirements of the individual plant. Until a maximum, efficient utilization of the water resources of this area is assured through the full development of conservation measures, it would appear to be logical to restrict the development of heavy users of water in favor of industries where water is not a major requirement. F or much of the Southwest, any significant growth in population and industrialization is tied to the problem of water supply, and this seems to be a problem which will face the Southwest for many years to come.
Otber foreseeable problems of southwest industrialization probably will resolve themselves in the course of time. Labor problems do not appear to be unsolvable, and commercial use of atomic energy is sufficiently distant to allow time to plan for its development. Certainly, the Southwest needs to look toward a higber technical level of workers and should initiate plans to join in the development of atomic energy.
In fact, industrial growth in the Southwest will be almost assured if tbe area can solve its water problem. If the recent rate of growth continues, by 1965 the Southwest could add 370,000 manufacturing workers and, with its growing market, could establish many industries wbose products currently are purchased in other areas of the country. The area has a bright future - one which can be realized with the support of its people and the efforts of men who can visualize and resolve its problems.

MONTHLY BUSINESS REVIEW 95
REVIEW OF BUSINESS, AGRICULTURAL, AND FINANCIAL CONDITIONS
Department store sales in the Eleventh Federal Reserve District during May continued at a high level which was only 3 percent below the very high
April volume and were 1 0 percent above sales in May of last year. Consumer durable goods sales remained particularly strong. Department store inventories declined seasonally but at the end of May were 6 percent above a year earlier. District furniture store sales continued to show a substantial yearto-year gain, with an 18-percent increase in May.
Recurring rains over the maior part of the District during June improved the outlook for crop production and range feed. Winter wheat production in the maior producing states Qf the District is estimated, as of June 1, at 43,330,000 bushels, down 58 percent from last year. Cash receipts from farm marketings in District states from January through April were 3 percent lower than in the same period in 1954.
Refinery crude runs in the District rose substantially during the last half of May and the first part of June, following an appreciable seasonal reduction in the previous 6 weeks. Crude oil production in June was down moderately to mark the third consecutive monthly decline, and reduced Texas allowables indicate a further decline in July production.
Nonagricultural employment in the District states showed a further gain in May, reaching the highest level for that month of record. A major factor in the increase was the rise in manufacturing employment, but most other industries also reported gains. Unemployment in Texas declined to the lowest level since October 1953.
The value of construction contract awards for residential building in the District reached a near-record level 'during May, but the amount of all other awards declined slightly.
Gross loans of the District's weekly reporting member banks rose 1 percent during the 4 weeks ended June 15, with consumer-type credits and bor-
•
rowings for commercial, industrial, and agricultural purposes weighing heavily in the increase. Investment holdings declined 4 percent, reRecting principally sales or redemptions of Treasury notes and bonds. Deposits were down 1 percent.
The dollar volume of sales at Elev· enth District department stores duro ing May continued at a high levelapproximately 3 percent under the very large April sales - and was 10
percent above the May 1954 volume. Cumulative sales for January through May this year were 11 percent above those in the corresponding period a year ago and were 6 percent more than in the first 5 months of 1953. The seasonally adjusted index of department store sales was the highest for any May of record and 137 percent of the 1947·49 average, compared with 125 in May last year and 131 in May 1953.
Preliminary figures indicate that department store sales in the first 3 weeks in June were running, as usual, somewhat below the May level. Sales for the 3 weeks ended June 18 were 4 percent above those in the same 3 weeks a year ago.
The outstanding feature of District department store trade in May was the continued heavy volume of consumer durable goods sales. Sales of major appliances were 33 percent higher than a year earlier, while sales of both furniture and bedding and domestic floor coverings were up 22 percent. However, sales of television sets declined markedly, falling 14 percent below the level of a year ago.
While the greatest strength was evident in durable goods, some soft goods departments made very favorable showings. Sales of men's and boys' wear were 12 percent higher than a year earlier; sales of women's and misses' dresses were 13 per· cent higher; and household textiles sales were 15 percent higher. On the other hand, sales of women's and misses' coats and suits were 14 percent lower, and piece goods sales were down 6 percent.
RETAIL TRADE STATISTICS
(Percentage change)
NET SALES
Line of trade by area
DEPARTM ENT STORES TOlal Eleventh District • •• .. ..•. ...• Corpus Ch risti •.••••••••.......•• Dallas •.. • •....••.. • . •••••••• • . EI P050 •••• ••• ••• .••• ••• •• , .·· . Fort Worth •••.•••••• • • ••.•. •. • • Houston ••.• •. •••• •••• • ••• • •• ••• San Antonio . . •. •• ...•. •..•.•••• Shreveport, la .• ....•.. • .. .• •. . •. WacO • ... •.•••••.••••••••••••• Other cities ••• •••• •• ••••••• • • •••
FURNITURE STORES Total Eleventh District .. . ... . .. .. . . Auslin • • •••. .. •••••.• . • ..• • •• • • 001105 ••• •• •• • ••••• ••• ••• • •••••
Houston • • ••• ••••• ••••• •• •• • •• • • Port Arthur •••• •••• • •••••••••• • • Son Antonio • ••• • •••• • •• •• ••• ••• Shreveport, LQ ... ............. . . . Other cities •••••• • • • • • • • ••• •• • ••
HOUSEHOLD APPLIANCE STORES Total Eleventh District ••••••. •• •• • • Dallas ••.• •.. . • .••••••••.•••• • •
May 1955 from
May April 1954 1955
10 _3 12 _5 11 -3 6 -11
12 -7 8 1
13 1 9 -2
14 3 7 -6
18 3 3 9 8 _5
36 1 11 _2
5 -5 13 9 17 U
6 4 15 7
5 mo. 1955 compo with
5 mo. 1954
11 18 12 10 11 9
10 7
12 I.
20 19 21 33 11 13 10
8
STOCKS'
May 1955 from
May April 1954 1955
6 -. 19 0 10 - 3 3 -5 3 -5 1 -1 7 -8 8 -1 2 -5 7 -3
12 1 7 6
25 6 21 -1
5 0 -2 -2 17 2 • 1

96 MONTHLY BUSINESS REVIEW
INDEXES OF DEPARTMENT STORE SALES AND STOCKS
(1947-49 = 100)
UNADJUSTED ADJUSTEDl
May April Mar. May May April Mar. May Area 1955 1955 1955 1954 1955 1955 1955 1954
SALES-Daily average Eleventh District • •... . . . ... • 133 136 120 . 121r 137 140 131 125r Oglku .... . ............... 125 129 116 113 127 138 122 115 Houston •••••••••••• • • • • •• • 149 148 133 138 150 152 148 139
STOCKS-End of month Eleventh District •••• ...•...• 13Sp 144 144 131r 137p 136 135 129r
I Adiusted for seasonal variation. r-Revised. p-PreJiminary.
Cumulative sales of consumer durables during the first 5 months of this year were 21 percent above those in the same period last year, as compared with a 7-percent increase in the soft goods lines_
Instalment sales in May continued in heavy volume, exceeding those in May 1954 by 38 percent. Cash sales and charge account sales registered more moderate year-to-year increases of 4 percent and 6 percent, respectively_ The proportions of total sales which the various types of sales comprised did not change significantly during the month_
Instalment account receivables at District department stores rose 1 percent during May, while charge account receivables decreased slightly_ At the end of the month, instalment account and charge account receivables were 13 percent and 8 percent, respectively, higher than a year earlier. Collections on instalment accounts were about the same as in April, while collections on charge accounts increased 4 percent.
Department store stocks declined less than seasonally during May and at the end of the month were 6 percent more than on the comparable date last year. The ordering of fall merchandise appears to have started a little earlier this year, with the marked seasonal rise in orders outstanding beginning in May rather than in June or July, as has been the pattern in previous years_ Orders outstanding at the end of May were up 24 percent from a month earlier and were 36 percent higher than on the corresponding date in 1954. The substantial increase in orders may reflect, in part, the confidence of merchants in a continued high level of sales during the remainder of this year_
Although sales at reporting furniture stores in the District showed a small, less than seasonal increase in May, they were 18 percent above a year ago_ Furniture store inventories increased contraseasonally 1 percent and at the end of May were 12 percent higher than on the same date last year_
Recurring light to h eavy rains over the major portion of the District during June improved the outlook for crop production and range feed. Subsoil moisture supplies increased
and are adequate in the eastern half of the District; a marked improvement occurred in the High Plains and Low Rolling Plains areas of Texas. However, the Lower Valley, parts of
WINTER WHEAT PRODUCTION
Four Southwestern Stales and United Stotes
(In thousond, of bushels)
1955 Indicated AVerage
Area June 1 1954 1944-53
Arizona .•. . . . • .•. • •.......• • 960 588 60' New Mexico •...•..•. • ..•..•• 760 '00 2.867 Ok/a noma • • •• • •• • • • ••• •• • • • • 29,727 70.770 79,304 Texas . .•.. . . • . .. ...... . .. . . 11.883 30,894 55,404
Total •. • ....... • .....•... . 43.330 102,652 138.179 United Stotes . ... . .... . . ... 639.224 790,737 867.390
SOURCE= Uniled Slates Deparlmenl of AgrictlJrure.
south Texas, and the western Trans-Pecos area remain dry. Moisture conditions are poor in south-central and western New Mexico range areas and in most of Arhona_
Hail and heavy rains damaged cotton, sorghums, and small grains in scattered areas of Texas and Oklahoma, necessitating considerable replanting_ The combining of small grains has been moving northwestward slowly, since showers and cool weather hindered field work and slowed ripening of the grain. Feed crop prospects are very favorable except in south Texas, where early dry-land feed crops are maturing with low yields. The corn crop, although somewhat late as a result of replanting due to late-spring freezes, is showing excellent promise. Grain sorghums are making good development, and planting is being rushed to completion in the Plains area of Texas and eastern New Mexico_ Harvesting of irrigated sorghums in the Lower Valley of Texas is progressing rapidly.
Production of all wheat in the United States is indicated, as of June 1, at 845,000,000 bushels, the lowest since 1943. The winter wheat crop is placed at 639,224,000 bushels, down 13,662,000 bushels from the month-earlier forecast. A crop of this size would be 19 percent below last year and 26 ]lercent below the 1944-53 average_
In the four major wheat-producing states of the District, indicated production of winter wheat in 1955 is 43,330,000 bushels, reflecting a decline of over 2,000,000 bushels from the previous forecast. This estimate is 58 percent below the short 1954 crop and 69 percent nnder the 10-year average_ In the June forecast, increases in the expected output in Arizona, New Mexico, and Texas are offset by a decrease in Oklahoma_
FARM COMMODITY PRICES
Top Prices Paid in Local Southwest Markets
Comparable Comparable Week ended week week
Commodity and merkel Unit June 21, 1955 losl month last year
COTTON, Middling 15/16-inch, Dallas •..• lb. $ .3345 $ .3335 $ .3380 WHEAT, No.1 hard, Fort Warlh •. .• ..... b,. 2.64Yz 2.78 2.40 OATS, No.2 white, Fort Warlh •• . .. • ..... b,. 1.00 .98~ 1.01 !A CORN, No.2 yellow, Fort Warlh ... ...... b,. 1.84% 1.84~ 1.92~ SORGHUMS, No.2 yellow, Fort Warlh . ... cwt. 2.50 3.02 2.40 HOGS, Choice, Fori Worth .............. cwl. 21.50 18.50 23.50 SLAUGHTER STEERS, Choice, Fort Worth . .. (wi. 23 .50 24.00 24.50 SLAUGHTER CALVES, Choice, Fort Worth ... cwl. 21.50 22.00 20.00 STOCKER STEERS , Choice, Fori Worth . . ... cwl. 23.00 22.00 21.00 SLAUGHTER SPRING LAMBS, Choice,
Fort Worth ....•.....•.............• cwl. 22.50 22.50 20.00 BROILERS, south Texas ... •.•......... ... lb. .28 .30 .25
•

MONTHLY BUSINESS REVIEW 97
LIVESTOCK RECEIPTS
(Number)
FORT WORTH MARKET SAN ANTONIO MARKET
May May April May May April Class 19" 1954 19'5 1955 1954 1955
Cattle . .. .. . ... . 101,246 79,298 67,378 34,833 37,220 30,60'" Ca lves ......... . 21,506 16,465 13,768 17,902 17,208 15,494 Hogs .•••••..•• • 48,377 40,252 55,629 3,588 2,256 2,844 Sheep . ... . ..... 229,849 171,306 156,860 140,2"'0 135,172 136,305
I Includes gOQts.
Most of the 1955 cotton crop has been seeded, and cultivation to control weeds is active. Moisture conditions are favorable, except in nonirrigated parts of the western Coastal Bend and southern counties of Texas. Cotton is squaring in northern Louisiana; in Arizona and New Mexico, growth continues to be satisfactory, although cool temperatures in early June have retarded optimum development. Throughout the District, early planted cotton is making good progress; the first bale of the 1955 crop was ginned June 8, or a week later than last year. Insect populations are building up, with pink bollworms and boll weevils being reported in the Lower Valley of Texas. In the Blackland and Plains areas of Texas, grasshoppers, aphids, and thrips have been reported causing light to heavy damage in some fields.
The condition of the 1955 Texas orange and grapefruit crops, as of June 1, is about average but considerably below that of a year ago, reports the United States Department of
~ Agriculture. The condition of trees generally is good, but strong, cold winds in late March and a brief cold spell in early April have resulted in an erratic set of fruit. Prospects for the 1955-56 citrus crop in Arizona are fair. The 1955 crop of peaches and pears in all District states except New Mexico will be a near failure as a result of freezing temperatures in the spring; even in the latter State, production will be small.
Harvesting of the Texas commercial vegetable crop continued active throughout June, except in parts of central, eastern, and northern counties, where rains during the first part of the month reduced field work. Tomato harvest is virtually complete in the Lower Valley and is continuing in east Texas. Cantaloupes and watermelons are being shipped from south Texas.
Range conditions and pasture prospects in Oklahoma, Texas, and eastern New Mexico improved during June, as rain increased moisture reserves. However, weeds are competing with desirable grasses on many ranges in parts of northwestern Texas. In south Texas, the western Plateau and Trans·Pecos areas of Texas, and southern New Mexico and Arizona, ranges remain short and supplemental feeding continues.
Farm real estate values remained generally stable to slightly higher in most areas of the country during the 4 months ended
~ March 1, according to the Department of Agriculture. The , dollar value of farm land in the Nation increased 1 percent. In
the District, Oklahoma and Texas showed gains of 3 percent, and Louisiana, 2 percent; but Arizona and New Mcxico recorded declines of 1 percent and 2 percent, respectively.
CASH RECEIPTS FROM FARM MARKETINGS
Five Southwestern States
(In thousands of dollan)
March April January-April
kea 1955 1954 1955 1954 19'5 1954
Arizona ......• •• $ 19,329 19.865 $ 17,650 $ 15,950 $102,682 $108,882 Louisiana ........ 13,323 16,013 20.971 17,192 79,110 91,057 New Mexico • . •. . 7,522 9,272 10,462 8,521 42.941 43,904 Oklahoma .••.•. . 28,747 26,153 26,709 23,211 113,665 114,525 re""al .•... . ... . 95,502 83,633 1 06,086 110,961 436,658 439,605
---Total. ........ 5164,423 $154,936 $181,878 $175.835 $775,056 $797,973
SOURCE: United Statel Department of Agriculture.
Cash receipts from farm marketings in the District states from January through April were down 3 percent from the same period last year; livestock receipts declined 1 percent, and receipts from crops decreased 5 percent. In the Nation, receipts from farm marketings during the first 4 months of 1955 totaled $8,333,549,000 for a decline of 3 percent from a year earlier, the same as in the District states. Crop reo ceipts increased 6 percent, while livestock receipts declined 8 percent.
Between May 18 and June 15, commercial, industrial, and agricultural loans of the District's weekly reporting member banks increased $7 ,830,000 to a total of $1,447,-
306,000, reflecting a gain of $142,445,000 over the comparable year-earlier amount. Wholesale and retail trade establishments, construction firms, sales finance companies, and public utilities increased their borrowings substantially during the 4-week period, while commodity dealers, grain and milling concerns, and "all other" commercial and industrial businesses reduced their indebtedness. During the 51;2 months ended June 15, 1955, commercial, industrial, and agricultural loans declined $2,097,000, as contrasted with an increase of $17,198,000 in the comparable period a year ago, when sub-
CONDITION STATISTICS OF Atl MEMBER BANKS
Eleventh Federel Reserve Districl
(In million. of dollou)
Item
ASSETS Loans and discol,l'lts ..... .. ....... ", .. , .• ,·.·. United States Government obligatiOfIl •.•.... ..• .• Other se(U'fities . ..... .. . . ......•....•......... Reserves with Federal Reserve Bonk •.... ....... .. Cash in vault •....... .......... , .. . ....... , .. . Balances with banks In the United Stat.S . .... ... . . Balanc.s with banks In foreign countrIes •.•. .... . .. Cash it.ms In procen of collectIon .••. ......•... .. Other dssehe .•. . .. • . . . .. . .....•.... .. • . • ... .
TOT At ASSETS· . • ... ....... ........ . .... ...
LIABILITIES AND CAPITAL Demond depaslh of bonks . .•.. . ...... .. . .• . ... Other demand deposits .. ................... . . . TIme deposits . . . .. ...... ..•. . . , . .. .•.. . •. ....
Total deposits .................. , ..•.•. ··· · ·· Borrowings· .•. ....... .. ...........•...... ... Other liabilities • • . •. .... ... •. .. . .............. Total capitol accounh- ..... .. ....... ......... .
TOTAL UABIUTIES AND CAPITAle ... .. . . .. ... .
.-Estlmated.
May 25, 1955
$3,558 2.502
548 968 127 960
2 376 169
9,210
980 6,275 1,223
8,478 24 57
651
9,210
May 26, 1954
$3,134 2,365
478 986 124 983
1 305 143
8,519
934 ',857 1,080
7,871 1
56 591
8519
April 27, 1955
$3,486 2,509
552 1,004
136 999
2 370 176
9,234
1,036 6,248 1,227
8,511 21 61
641
9,234

98 MONTHLY BUSINESS REVIEW
CONDITION STATISTICS OF WEEKLY REPORTING
MEMBER BANKS IN LEADING CITIES
Eleventh Federal Reserve Di strict
(In thouscnds of dolltus)
Item
ASSETS Commercial, lndtnlrial. Clnd agricultural loons •••• loons to brokers and dealers in securities ...... O,h.r loans for purchasing or carrying securities. Real ostat. loans .............. ..• . .•. . .... loons to banks .....•...................... All other loortS •••.••••.• . • . . . .••••.•.••••.
Gross loans .•.........•............. . .. . l ess reserves and unallocated chorge·offs .•
Net loans ....... . .•.. . ...• . ........... .
U. S. Treosury bills •.................... . .. . U. S. Treasury certIAco'.s of indebtednen . .. ... U. S. Treosury notes .•...... ...•....... . .... U. S. Government bonds (inc. gtd. obligationl) . .. Other securities .•..........................
Totallnvestmenls ...... .• ....••..... ... .. Cash items in proten of collection .•.•......... Balances with banks in the United States ....... Balances with banks in foreign countries ..••.... Currency and ~n • • ••••••••••••••••••••••• Resel"les with Federal Reserve Bank • . . " ... ... Other ass.ts ...........................•..
TOTAL ASSETS ........................
LIABILITIES AND CAPITAL Demond deposits
Indi ... iduals, partnerships, and corporatIons .... United State, Goyernment .. • ......•. • ..... States and political,ubdivisJons • •... ..•. . .. Bonks in the United States ................. Bonks in foreign countries ................. Certifl.d and officers' checks, efc ............
TOlal demand deposits ..... .............
Time deposits Individuals, partnerships, and corporations .. .. United States Goyemment .•......•. •..••.. Postal savings . •. ..... •.•. ..•........ .. .. Stat.s and political subdivisions .•. •........ Banks in the U. S. and foreign countrl.s ... .. .
Tolal time deposits • . ........ .. .. .......
Total deposits ........ ...• . •...... ... Bills payable, rediscounts, etc. ...... .......... All other lIabiliti.s . .•....... . .............• Total capitol accounts . •.•................. .
TOTAL LIABILITIES AND CAPITAL. •.....••
June 15, 1955
$1,447,306 17,928
116,937 191,315
10,280 493,256
2,277,022 23,240
2,253,782
57,557 39,204
2B3,957 851,577 251,B62
1,4B4,157 392,627 .435,034
1,419 47,206
570,559 119,672
5,304,456
2,835,506 82,480
185,253 865,974
16,952 66,543
4,052,708
657,165 12,462
452 124,132
1,785
795,996
4,848,704 34,650 43,177
377,925
5,304,456
June 16, 1954
$1,304,861 10,628 84,568
137,967 4,604
397,538
1,940,166 17,043
1,923,123
138,573 123,119 208,905 779,568 223,928
1,47.4,093 308,268 528,892
1,207 44,817
55B,157 93,935
4,932,492
2,683,581 7B,072
165,291 B58,358
9,140 53,318
3,B47;760
564,131 9,809
450 128,092
1,883
704,365
4,552,125 4,500
39,832 336,035
4.932.492
May 18, 1955
$1,439,476 13.753
117.227 186,370
13,530 47B,453
2,248,809 23,377
2,225,432
67,333 41.364
322,237 867,050 249,907
1,547,891 368,102 442,004
1,558 46,948
583,383 117,107
5,332,425
2,805,572 151,213 195,904 848,061
18,125 72,161
4.091,036
655,919 13,662
452 130,276
1,210
801,519
4,892,555 14,400 48,509
376,961
5,332,425
stantial amounts of CCC certificates of interest were added to loan portfolios.
Changes in other categories of loans over the 4 weeks ended June 15 included increases of $14,803,000 in "all other" loans, $4,945,000 in real estate loans, and $3,885,000 in loans for financing security transactions. Loans to banks declined $3,250,000. On balance, gross loans rose $28,213,000 to a total of $2,277,022,000.
Total deposits of the weekly reporting member banks declined $43,851,000 during the 4 weeks, due principally to a rather sharp reduction in deposits of the United States Government and a more moderate decrease in the accounts of states and political subdivisions. In providing for the deposit drain, the banks reduced their investment holdings in the amount of , 63,734,000, with sales or redemptions of Treasury notes ac· counting for $38,280,000 of the total. Moreover, Treasury bill and Government bond portfolios were reduced $9,776,000 and $15,4,73,000, respectively, but holdings of non·Government securi ties rose moderately.
GROSS DEMAND AND TIME DEPOSITS OF MEMBER BANKS
Eleventh Federal Reserve District
{Averages of da il y figures. In thousand, of dollarsl
COMBINED TOTAL RESERVE CITY BANKS COUNTRY BANKS
Dot. Gron
demand TIme Gross
demand Time Gross
demand Time
Moy19S3 .. . . $6,492,848 $ 877;764 $3,053,816 $484,041 $3,439,032 $393,723 May 1954 .•.. 6,752,376 1,073,865 3,263,439 599,299 3,488.937 474,566 Jon. 1955 ..... 7,594,952 1,155,178 3,679,808 644,814 3,9 15,144 510,364 Feb. 1955 ...• 7,329,237 1,170,172 3,504,599 652,808 3,824,638 517,364 March 1955 •.• 7,237,90B 1,202.162 3,485,392 682,916 3,752,516 519,246 April 1955 ••• • 7,388,996 1.219,764 3,626,058 697,44 1 3,762,93B 522,323 May 1955. '" 7,241,268 1,226,177 3,541,867 704,826 3,699,401 521,351
Gross demand deposits of all member banks in the District averaged $7,241,268,000 during May, reflecting a decline of 2 percent from the level prevailing in April but a gain of 7 per· cent as compared with May 1954. Reserve city banks accounted for 57 percent of both the April.to.May reduction and the year-to· year gain. During May, time deposits rose to a record total of $1,226,177,000, up slightly from April and 14 percent above the level of May 1954.
Debits to deposit accounts reported by banks in 24 cities of the District increased 4 percent during May. Banks in 11 of the reporting centers showed gains, but an equal number registered declines. As compared with the year·earlier level, debits in May were up 18 percent, with increases in individual cities ranging from 7 percent for banks in Corsicana to 34. percent for banks in Abilene. The annual rate of turnover of deposits was 19.1 in May, 18.4 in April, and 17.3 in May 1954. f
BANK DEBITS, END-Of·MONTH DEPOSITS
AND ANNUAL RATE OF TURNOVER OF DEPOSITS
(Amounts in thousands of dollars)
DEBITS' DEPOSITS'
Percentage change from Annual rate ofturno ... er
May May April May 31, May May April Ar.a 1955 1954 1955 1955 1955 1954 1955
ARIZONA Tucson • • ••• •• •• •• ••• $ 131,540 26 -1 92,779 16.8 14.5 16.9
LOUISIANA Monroe •.... ...... .. 57,217 14 41,491 16.0 14.2 15"{ Shreveport .... . ..... 235,363 15 177,453 15.8 15.0 15.5
NEW MEXICO Ros ...... U ••••• •••• •••• 27,083 10 -3 2B.381 11 .5 10.2 11.6
TEXAS Abilene ..........•. . 69,523 34 10 59,025 14.2 12.0 13.0 Amarillo ... . ........ 148,334 23 -2 108,318 16.6 14.9 16.7 Austin .•• . .......... . 1.42,176 22 5 116,093 14.6 13.3 14.0 aeaumont .•......... 129,178 16 9 96,558 15.5 14.0 hl.O Corpus Christi . •. .. .. . 160,"41 9 -3 104,034 18.2 15.8 18.6 Corsicana . .....•... . 13,257 7 -5 21,658 7.3 7.2 7.7 Dallas .•............ 1,961,20B 17 4 979,749 24.0 22.2 23.3 El PIUO •.•••.•.•• •. . 214,975 23 _1 127,863 20.0 17.4 20.3 Fort Worth •. . ....... 597,608 lB 6 362,226 20.0 18.4 19.2 Gal ... eston •.......... 77.744 13 -1 70,530 13.3 12.4- 13.3 Houston •............ 1,95B,523 15 7 1,153,833 20.3 lB.O 19.0 laredo .....••.•... . 23,526 25 0 .. 18,897 14.9 12.2 15.0 lubbock ......... ... 120,075 31 -3 96,500 14.6 13.7 15.0 Part Arthur .... ...... 57,639 29 14 42,998 16.2 13.8 14.5 San Angelo .•.. ..•... 44,139 20 0 46,307 11.4 10.4 11.4 San Antonio . . .. .•... .<175,625 25 6 335,444 17.0 14.9 16.1 Texorkano s •••....... 17,397 14 -6 17,242 12.0 10.3 12.7 Tyler . . ............ . 68,253 13 -6 57,584 14.0 12.7 14.9 Waco .............. B2;726 13 -8 67,102 14.5 14.3 15.8 Wichita Falls ......... 93,460 19 2 104,603 10.7 9.6 10.6
Total-24 cities ........ $6,907,010 18 4. $4,326,668 ~ 19.1 17.3 18.4
1 O.bits to demQnd deposit accounts of individuals, partnerships. and corporations and 4 of stat.s and political subdi",'sJons.
, Demond deposit accounts of individuals, partnerships, and corpora lions and of states and political subdivisions.
• These flgur., Include only one bonk in Texarkano, Teltas. Total debits for all bankt in Te)(arkana, Texas-Arkansas, including two banks locot.d in the Eighth District, amounted to $36,283,000 for th. month of May 1955.

MONTHLY BUSINESS REVIEW 99
CONDITION OF THE FEDERAL RESERVE BANK OF DAllAS
lin thousands of dollanl
Item
Total gold cerliAcote reserves ..... . .•. . .... . Discounts for membtH banKS . .•. . .. ••....... Other discounts and advances ... .. . . . . . .... . U. S. Government securities .... .... ...... .. . Total earning assets . ........ . .... . ....... . Member bonk reserve deposits . ..... .. ... .. . Federal Reserve noles in oclua lcirculation •....
June 15, 1955
$741,976 12,550
3,133 944,461 960,144-970,623 709,264
June IS, 1954
$754,266 5,659 I,BaO
978,835 986,374 961,919 717,622
May 15. 1955
816,160 2,800 3,760
950,399 956,959
1,023,655 708,977
BeLween May 15 and June 15, the principal changes in the condition of the Federal Reserve Bank of Dallas were reduc· tions of $74,184,000 in gold certificate reserves and $53,-032,000 in member bank reserve deposits. BOlh of these move. ments were related to a rather substantial outflow of funds from the DistricL slemming from Treasury operations. Total earning assets of the bank rose $3,185,000 during the month, principally becausc of the increase in discounts for member banks; holdings of Government securities declined. On June 15, Federal Reserve notes of this bank in actual circulation totaled $709,264,000, as compared with $708,977,000 on May 15 and $717,622,000 on June 15, 1954.
CHANGES IN FACTORS AFFECTING MEMBER BANK RESERVE BALANCES
Eleventh Federal Reserve District
(In thousands of dollors)
CHANGE!
~ FACTORS Federal Reserve cred it-Iocol ....... .. ......... . Interdistrict commercial and flnancial transaction! .. . . Tr easury operations • .. ...•••• •..• . . . .•..•••..• Currency transactions . . . .. .. • . .... . .. .• . . . ..... Olher deposits at federal Reser ... e Bank •• •• . .. .. . Olher Federal Reserve accounts • ••••••••••••••••
RESERVE 8ALANCES May 18. 1955................ $989,235 June 15,1955. . ............ .. $970,623
1 Sign of change indicates effect on reServe balances.
4 weeks ended June 15, 1955
+$23,393 + 52,071 - 85,932 - 8,508
91 + 455
-$18,612
NEW MEMBER BANK
Dec. 29,1954-June 15, 1955
-$ 4,353 - 170,464 + 99,250 + 34,426
815 + M68
-$ 35,888
The Mercantile National Bank of Corpus Christi, Corpus Christi, Texas, a newly organized institution located in the territory served by the San Antonio Branch of the Federal Reserve Bank of Dallas, opened for business June 27, 1955, as a member a/the Federal Reserve Sys· tem. The new bank has capital of $200,000, surplus of $50,000, and undivided profits of $50,000. The officers are: Lamar Folda, Chairman of the Board; Cecil E. Burney, President; C. W. (Woody) Jones, Executive Vice President; Donald Corley, Assistant Vice Presi· dent; and Robert L. Steel, Assistant Cashier.
Refinery crude runs in both the District and the Nation rose mark· edly during the last half of May and the first part of June, following a sea· sonal cutback in the preceding 6
weeks. National runs in the week ended June 3 were second
CRUDE OIL, DAILY AVERAGE PRODUCTION
(In thousands of borrels)
Change from
May May April May tf5~ Area 19551 19542 19551 1954
ELEVENTH DISTRICT. • •• ••• • • 3,150.6 3.053.1 3,280.9 97.5 -130.3 Texas ............. . ... . 2,808.5 2.735.2 2,940.6 73.3 -132.1
Gulf Coast . .......... . 596,8 598.9 626.2 -2.1 -29.4 West le.os .. . •....... 1,104.2 1,049.0 1.166.8 55.2 -62.6 East Texas {proper) • . ... 212.7 230.2 230.8 -17.5 -18.1 Panhandle .•••• ... . .... 87.7 83 .5 87.1 4.2 .6 Rest of Stote ..... ... ... 807.2 773.6 829.8 33.6 -22.6
Southeastern New Mexico .. 227.3 200.5 226.3 26.8 1.0 Northern louisiana . . .. . . .. 114.8 117.4 114.0 -2.6 .8
OUTSIDE ELEVENTH DISTRICT. 3.513.4 3,417.6 3,540.7 95.8 -27.3 UNITED STATES ............ 6.664.0 6,470.7 6,821.6 193.3 -157.6
SOURCES: 1 Estimated from American Petroleum Institute Weekly reports. 2 United Stotes Bureau of Mines.
only to the record runs in the last week of February. May refinery crude runs - at 7,276,000 barrels per day - were 179,000 barrels higher than in April and 238,000 barrels more than in Maya year ago. Daily average runs in the District in May amounted to 2,170,000 barrels per day, which is 22,000 barrels higher lhan in April and 146,000 barrels above a year earlier.
The substantial increase in refinery runs undoubtedly reflects optimism stemming from the high level of demand, particularly gasoline demand during the past 2 months. During May and the first half of June, demand for gasoline at refineries and bulk terminals was 8 percent higher than in the corresponding period last year; distillate and residual fuel oil demand also was up appreciably. The year·to·year increase in gasoline demand has been running substantially higher than most industry forecasts had anticipated, and there are some doubts as to how long gasoline will continue to show the cur· rent large gains.
With the high level of demand counteracting the increase in refinery runs, the stock situation in the petroleum industry showed no basic change during May and the first part of June. The percentage decline in gasoline stocks during the 7 weeks ended June 17, although larger than last year, was not substantially different from the usual decrease for this time of the year; the increase in light heating oil stocks was only a little larger than usual. At the same time, refined products stocks, except perhaps for residual oils, have tended to be on the high side, and the appreciable increase in refinery runs has not improved this situation. On May 28, crude oil stocks, rising stead· ily since March, reached a high for the year of 281,900,000 barrels but then declined 6,100,000 barrels in the succeeding 3 weeks.
Daily average crude oil production in the District decreased moderately in June, after a marked reduction in May. Produc· tion during the first 17 days of the month averaged 3,117,000 barrels per day, which is down 33,000 barrels from May although 9,000 barrels higher than in June a year ago. A fur· ther decline in District production may be anticipated in July, in view of the reduced Texas daily oil allowables. Production in the Nation durin g the first part of June followed a pattern similar to that of the District, averaging 6,609,000 barrels, or 55,000 barrels less than in May but 109,000 barrels more than in the same month a year ago.

100 MONTHLY BUSINESS REVIEW
Employment increases continue to reflect the rising trend in business and industrial activity. Estimates place total nonagricultural employ· ment in the District states during
May at 3,862,900 for the highest May level of record, or 21,600 higher than in April and 91,000 above a year earlier. As in the preceding month, gains occurred in almost all indus· trial classifications.
Important in the May increase was manuIactu ring employ· ment, which gained 9,400 to total 714,200. In addition to seasonal gai ns in Iood manufacturing, increases were reported in transportation equipment, lumber and wood products, tex· tiles, and apparel manufacturing employment. A further expansion in chemical manufacturing was offset partially by a loss in the allied cotton oil industry.
NONAGRICULTURAL EMPLOYMENT
Five Southwestern Slates 1
Percent chonge Number of persons May 1955 from
May May Type of employment 1955e , 954r
Total nonagricultural wage and salary workers .. 3,B62,900 3,771,900 Manufacturing . ..... .. ..• 714,200 695,100 Nonmonufocturing • •••.•.. 3,138,700 3,076,800
Mining ...•. .. •.•..... . 237,200 233,000 Construction . •••....... 272,300 261,800 T fansportotion Qnd public
utilities ••. •.••••.•••• 387,000 388,100 Trade ....... ....... . . 989,200 966,800 finance . .............. 160,500 154,500 Service • • • •••••••••••• 449,400 444,800 Government . . . ...... .. 653,100 627,800
I Arizona, Louisiana, New Mexico, Oklahoma, and Texas. e-f5timaled. r-R"vised. SOURCeS, State employment agencies.
F.d.ral Roserve Bonk of 001101.
April 1955
May April 1954 1955
3,841,300 2.4 . 6 704,800 2.7 1.3
3,136,500 2.0 .1 235,700 1.8 .6 270,200 4.6 .8
378,000 -.3 2.4 990,200 2.3 - .1 160,000 3.9 .3 447,400 1.0 .4 655,500 4.0 -.4
In Texas, unemployment declined in May to the lowest level since October 1953. Totaling 110,800, unemployment was down 5,700 from the preceding month and ] 7,600 from a year ago,
Construction contract awards in the District during May amounted to $168,169,000, or 7 percent more than in April and 38 percent bigher than in May last year. The month-tomonth gain was accounted for wholly by residential awards, which reached a near-record level of $83,665,000, or 28 percent higher than in the preceding month and 50 percent above a year earlier. All other awards, while 27 percent above May 1954" declined 8 percent from April. The value of total awards
VALUE OF CONSTRUCTION CONTRACTS AWARDED
{In thousands of dollars}
Area and typo
ElEVENTH DiSTRiCT •••• $ Residential .. ...... . All otf\er ..... . .... .
UNITED STATES' ... • .. Residential . . .. .... . All other .......... .
1~5J 168,169
83,665 84,504
2,185,065 1,011 ,310 1,173,755
May 1954
122,254 $ 55,909 66,345
, ,925,253 825,300
1,099,953
1 37 slotes east of the Rocky Mountains. SOURCE; F. W. Dodge Corporation.
April 1955
157,267 $ 65,592 91,675
2,322,085 1,070,129 1,251,956
January-May
1955 1954
732,682 $ 548,747 350,927 261,408 381,755 287,339
9,727,562 7,517,945 4,505,626 3,260,425 5,221,936 4,257,520
BUILDING PERMITS
5 months 1955
Percentage Percentage change in change in
valuation from valuation May 1955 from 5
May April months A,eo Number Valuation 1954 1955 Number Valuation 1954
LOUISIANA Shreveport . . .. 458 $ 2,003,072 17 -76 2,439 16,453,256 93
TeXAS 8,074,954 77 Abilene ...... . 137 1,367,757 122 -23 761
Amarillo • .... . 272 2,427,387 71 32 1,369 11,677,263 56 Austin ... . ... . 380 4,247,868 20 15 1,588 18,390,816 9 Beaumont . .... 355 833,474 71 -32 1,568 4,191,756 5 Corpus Christi . . 461 1,922,764 -41 -51 2,455 14,100,469 13 Dalla' .. ..... . 2,525 13,316,328 19 -4 12,008 77,475,233 39 EI Paso . . ..... 443 2,731,422 22 -28 2,516 16,075,24 1 85 Fort Worth . ... 726 4,189,733 27 -30 4,125 25,205.928 50 Galy.ston .... . 87 324,403 -12 -3 526 1.263,722 -60 Houston •..... . 1,207 17,829,487 51 11 5,756 70,529.654 16 Lubbock ... ... 189 1,958,000 -7 -1 1,330 11,639.060 11 Pori Arthur . ... 169 362,694 16 7' 776 2,223,929 51 San Antonio . .. 1,807 3,902,352 10 -23 9,237 25,497,766 38 Waco ........ 287 865,551 1 -23 1,346 6,390,870 22 Wichita Falls .. . 151 1,214,067 118 -10 774 5,6 11,807 59
Totol-16 cities .. 9,654 $59,496,359 26 -16 48,574 $314,801,724 32
in the District for the first 5 months of this year was up one· third compared with the same period in 1954; residential awards were 34 percent higher, and all other awards, 33 per· cent higher.
In the Nation during May, the value of both total construe· tion contract awards and residential awards declined approxi . mately 6 percent from the April levels. For the first 5 months of 1955, total awards in the Nation were 29 percent above a year earlier; residential awards and all other awards sbowed ~ increases of 38 percent and 23 percent, respectively. ,
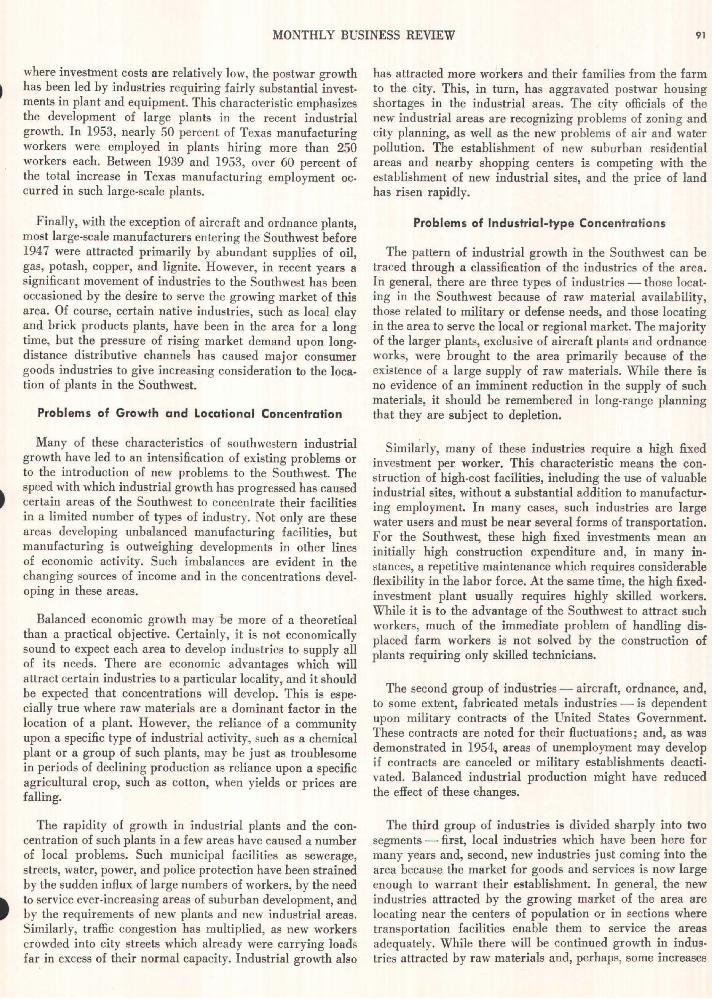
Cement production in Texas during the first 3 months of 1955, although a little below the preceding quarter, was the highest first.quarter output of record and was 20 percent above production in the same period last year. Nevertheless, as a result of the high volume of construction, stocks of cement during the first quarter of 1955 resumed the downward trend evident in the first 9 months of 1954. At the end of March, they were at the lowest level for that date since 1951. Severe short· ages of cement have been reported in some areas oI the District.
PORTLAND CEMENT PRODUCTION, SHIPMENTS. AND STOCKS AT TEXAS MILLS
MILLIONS Of" 1A!tItUS OUlfl" l ~ WI LL IONS or BARREL • 7 7 I
6 SHIPMENTS"".~
~ ,#, 'f"'"' .... .. .! .•• - " ., .' PRODUCTION
" 4
3
Z
<-STOCKS
'f" ~I I , --__ - ..... ----, ~-~-i-·
0 , , 19S2
SOURCE ' U.$ . .!IWrlallot N lft ...
, . 19~3
. • , • . • 19!54
6
• 4
3
z
I
o , , . 1951S


![69 STAT.] PUBLIC LAW 167-JULY 23, 1955 · 69 STAT.] PUBLIC LAW 167-JULY 23, 1955 369 in part westward of the ninety-eighth meridian relating to the owner ship, control, appropriation,](https://img.pdfslide.us/doc/110x75/5b5e60f77f8b9a164b8c5e77/69-stat-public-law-167-july-23-69-stat-public-law-167-july-23-1955-369.jpg)
![STAT.] COl^CURRENT RESOLUTIONS!-JULY 30, 1955 CONCURRENT RESOLUTIONS-JULY 30, 1955 [69 STAT. 0300-449543, Chang, Lee Yen Yuen. 0300-460323, Chang, Jimmy Zung-Tsu. 0300^60324, Chang…](https://img.pdfslide.us/doc/110x75/5ac22fbe7f8b9ae45b8e3fa8/stat-colcurrent-resolutions-july-30-1955-concurrent-resolutions-july-30-1955.jpg)
![8 SURVEY OF CUEEENT BUSINESS July 1955 Income · 2018. 11. 7. · 8 SURVEY OF CUEEENT BUSINESS [Millions of dollars] July 1955 Table 1.—National Income by Line 10 15 16 23 National](https://img.pdfslide.us/doc/110x75/60ce621cf6c8bf0839627550/8-survey-of-cueeent-business-july-1955-income-2018-11-7-8-survey-of-cueeent.jpg)