Embed Size (px)
Citation preview

Business ReportApr. 2014 to Mar. 2015
(FY 03/2015)
Wacom Co., Ltd.
(TSE Sec.1 6727)

All Rights Reserved. Copyright © 2015 Wacom Co., Ltd. 2
Contents Index3-4 FY 03/15 Results Overview5-6 Consolidated P/L by Business Line
7-8 Consolidated Sales/Profit Comparison
9 Operating Expenses Comparison
10 Business Categories
11-18 Business Highlights
19-21 Sales by Product Line
22-24 Sales by Region, Sales Changes for Local Currencies
25-26 Consolidated B/S, C/F
27-30 FY 03/16 Basic Policy, Business Strategies, and Business Segment
31-32 Assumptions for FY 03/16 Forecast
33-39 Forecast of Results for FY 03/16
40-41 Dividend Forecast for FY 03/16, Dividends per Share
42-44 Our Branding
45 Disclaimer

All Rights Reserved. Copyright © 2015 Wacom Co., Ltd. 3
FY03/15 Results OverviewOperating environment Global economy recovery continued led by economic expansion in the U.S. Japan saw a steady
economic recovery after a consumption tax rise triggered a slowdown. On the other hand, there were concerns of a slowdown in the Eurozone due to the Russia-Ukraine conflict. The JPY was weaker than the previous fiscal year.
As cloud computing, mobile products, and SNS rapidly expand, the IT industry faces intensified competition and structural change. The market trends surrounding the company are changing rapidly.
Performance overview In Brand product Business, sales grew steadily and marked a record high for the whole fiscal period
owing to expansion in the Vertical Market Business, sales growth of our mobile products, and favorable sales in Asian markets as well as successful global holiday campaigns.
In Comp. Business, sales for smartphones showed rapid recovery in 3Q from a stagnation caused by the delay in mass production of customers’ new products. However, this decelerated rapidly in March. Sales for tablet devices decreased substantially due to declining orders in major customer models. As a result, overall sales decreased YOY.
OP and NP declined compared to the previous fiscal year due to the decrease in sales, the increase in investment for IT infrastructure, and extraordinary loss.
Dividend per share was JPY 18.00, the payout ratio was 86.3% for FY 03/15 (JPY 17.50, 55.9% for FY 03/14).

All Rights Reserved. Copyright © 2015 Wacom Co., Ltd. 4
Average Forex rate FY03/15 YOY
1 USD 110.03 JPY +10.0% (Weak JPY)
1 EURO 138.68 JPY +3.5% (Weak JPY)
FY03/15 Results Overview Financial Summary
Business Performance FY03/15 YOY
Sales 74.56 bn -5.2%
Operating Profit 6.14 bn -29.1%
Recurring Profit 6.07 bn -26.8%
Net Profit aft. Tax 3.47 bn -33.8%
Financial Indices FY03/15 FY03/14
EPS 20.86 JPY 31.31 JPY
BPS (Book Value per Share) 202 JPY 196 JPY
ROE 10.5% 17.0%
(For reference)
(JPY)

All Rights Reserved. Copyright © 2015 Wacom Co., Ltd. 5
Consolidated P/L FY 03/14 FY 03/15 YOY Change
04/13-03/14 04/14-03/15 Amount Ratio
Sales 78,615 74,557 -4,058 -5.2%
Gross Profit 29,931 30,050 119 0.4%
GPM 38.1% 40.3%
SG&A 21,268 23,908 2,640 12.4%
Operating Profit 8,663 6,143 -2,520 -29.1%
OPM 11.0% 8.2%
Recurring Profit 8,282 6,065 -2,218 -26.8%
Net Profit aft. Tax 5,249 3,473 -1,776 -33.8%
• Effects of Forex exchange for FY:Stronger dollar (10.03 JPY) Sales +4,710 mil, OP +50 milStronger Euro (8.37 JPY) Sales +490 mil, OP +320 mil
• Extraordinary loss:Business structure improvement expenses 167 milLoss on sales of noncurrent assets (company-owned houses) 461 mil:
(Unit: Million JPY)

All Rights Reserved. Copyright © 2015 Wacom Co., Ltd. 6
Consolidated P/L by Business LineFY 03/14 3Q FY 03/15 YOY Change
04/13-03/14 04/14-03/15 Amount Ratio
Sales 78,615 74,557 -4,058 -5.2%
Brand Product biz 38,960 43,625 4,665 12.0%
Component Biz 39,002 30,277 -8,725 -22.4%
Other biz 653 655 2 0.2%
Operating Profit 8,663 6,143 -2,520 -29.1%
Brand Product biz 5,214 5,965 751 14.4%
Component Biz 6,667 4,642 -2,025 -30.4%
Other biz 123 55 -68 -55.0%
Corp. and others -3,340 -4,519 -1,179 35.3%
OPM 11.0% 8.2%
(Unit: Million JPY)

All Rights Reserved. Copyright © 2015 Wacom Co., Ltd. 7
Consolidated Sales Comparison
(Unit: Million JPY)
38,96043,625
39,002 30,277
653655
0
10,000
20,000
30,000
40,000
50,000
60,000
70,000
80,000
FY 03/14 FY 03/15
Brand Product biz Component biz Other biz
+0.2%
+12.0%
-22.4%
-5.2%78,615 74,557
Change
Ratio

All Rights Reserved. Copyright © 2015 Wacom Co., Ltd. 8
Consolidated Profit Comparison
8,663
6,143
8,282
6,065
5,249
3,473
0
1,000
2,000
3,000
4,000
5,000
6,000
7,000
8,000
9,000
FY 03/14 FY 03/15
Operating Profit Recurring Profit Net Profit
-29.1%
-26.8%
-33.8%
(Unit: Million JPY)

All Rights Reserved. Copyright © 2015 Wacom Co., Ltd. 9
Operating Expenses Comparison
FY 03/14 FY 03/15 YOY Change
04/13-03/14 04/14-03/15 Amount Ratio
Personnel 7,271 8,541 1,270 17.5%
R&D 2,863 3,180 317 11.1%
Ad. & Promo. 3,541 3,333 -208 -5.9%
Others 7,593 8,853 1,260 16.6%
Total 21,268 23,908 2,640 12.4%
SG&A Ratio 27.1% 32.1%
Key changes in increases
Expenses for next-generation global IT infrastructure (refer to the next page)
Increase in the number of employees FY 03/14 1,036 FY 03/15 1,072
Others including office relocation, travel expenses, and cost originated with IT investment.
SG&A increased by 930 mil due to higher costs at subsidiaries from forex changes.
(Unit: Million JPY)

All Rights Reserved. Copyright © 2015 Wacom Co., Ltd. 10
Operating Expenses Comparison
FY 03/14 FY 03/15 YOY Change
04/13-04/14 04/14-03/15 Amount
Reconstruction of
global SCM structure304 1,603 1,299
Global HR Project 85 282 197
WILL Project 0 63 63
Total 389 1,948 1,559
Expenses for major projects (Unit: Million JPY)
Reconstruction of global SCM (supply chain management) structure Support of e-commerce and centralization of ordering system, production management, and logistics
management for all Wacom groups Promotion of rapid decision-making by real-time information sharing and global ERP system integration
Global HR project Transition to a global organization by business category and integration of human resource management
system
WILL (Wacom Ink Layer Language) project Establishment of digital ink standard and expansion of the ink application

All Rights Reserved. Copyright © 2015 Wacom Co., Ltd. 11
Business Highlights:
Brand Product Business
Creative Business 36.48 bn +9.4%
Pen Tablet 21.98 bn +6.4%
Intuos Pro was well received for its high value-added features
for professional use, and maintained stable sales especially in
Europe, U.S. and Asia.
Intuos (former Bamboo tablet) showed a recovery from brand
confusion and favorable sales owing to global holiday
campaigns.
Local initiatives drove the expansion of the emerging market
model sales from China to India, etc.
The situation in Russia and Ukraine had a negative impact on
sales in both countires.
43.63 bn +12.0%
Emerging market
model (One)
(Unit: JPY)

All Rights Reserved. Copyright © 2015 Wacom Co., Ltd. 12
Brand Product Business
Creative Business
Mobile 3.91 bn +36.2%
Cintiq Companion and Cintiq Companion Hybrid, Wacom’s first
mobile tablet product maintained steady sales owing to their solid
reputation, but fell short of target.
Launched the next generation Cintiq Companion 2 in February,
which was highly appraised for its QHD display and light body.
Launched Inutos Creative Stylus 2 for iPads in September. Gained
a positive reputation, which contributed to a sales increase.
companion
Business Highlights:
companion hybrid
companion 2
(Unit: JPY)

All Rights Reserved. Copyright © 2015 Wacom Co., Ltd. 13
Brand Product Business
Creative Business
Display 10.59 bn +8.1%
Cintiq 22HD contributed steadily to sales expansion. On the
other hand, Cintiq 13HD lost sales momentum after two years
since its release and sales of Cintiq 24HD also stagnated in the
fourth year after being launched.
Launched large-sized Cintiq 27 QHD in February, which gained
a positive reputation for its high-definition display and full glass
screen as our flagship model for professional use. 13HD
Business Highlights:
27 QHD touch
22HD touch
13HD touch
27 QHD
(Unit: JPY)

All Rights Reserved. Copyright © 2015 Wacom Co., Ltd. 14
Brand Product Business
Consumer 1.55 bn -8.1%
Sales of existing stylus products were impacted by
intensifying price-based competition. Bamboo Pad, a wireless
touch pad for PCs also showed a sales slowdown.
Launched Bamboo Stylus fineline for iPads with advanced
1.9mm thin tip in September, which contributed to sales. The
pen creates the natural writing experience of pen on paper.
The 3rd generation Bamboo Stylus solo & Bamboo Stylus
duo were released, which contributed to sales increase
thanks to their unique carbon fiber nibs and premium design.
Launched Wacom Cloud services.
Business Highlights: (Unit: JPY)
Wacom Cloud Dropzone

All Rights Reserved. Copyright © 2015 Wacom Co., Ltd. 15
DTU-1031DTU-1141
Brand Product Business
Vertical Market Business 5.59 bn +42.1%
Demand for paperless workflow and improved data security
continued to grow globally.
Adoption of the STU series, signature pen tablets, expanded in
credit card transaction and counter services in the financial
sector. The light-weight STU-530 and STU-430 showed
favorable sales.
DTU-1031 for counter services contributed to sales. Launched
DTU-1141 with encryption processing function in March.
Business Highlights:
STU Series
DTH-2242
(Unit: JPY)

All Rights Reserved. Copyright © 2015 Wacom Co., Ltd. 16
Business Highlights:Component Business
Pen Sensor System
for Smartphones 18.33 bn -17.4%
Sales showed a rapid recovery in 3Q owing to favorable shipments
for Samsung’s Galaxy Note 4, which had stagnated due to the
delay in mass production. However, its sales decelerated rapidly in
March.
Pen Sensor System
for Tablets 8.54 bn -23.0%
Pen adoption for Windows tablets and for educational tablets
have both expanded. However, sales decreased substantially
due to declining shipments in major customer models such as
Samsung.
30.27 bn -22.4%
Tablet models
Smartphone models
4Edge
(Unit: JPY)

All Rights Reserved. Copyright © 2015 Wacom Co., Ltd. 17
Component Business
Pen Sensor System
for Notebook PCs 3.40 bn -40.4%
Along with the model shift from notebook PCs to tablets with
removable keyboards, demand for pens also shifted to tablets.
Due to the influence of manufacturer model transitions, our
sales decreased.
Business Highlights:Notebook PC models
Development of Active ES (Electrostatics) Pen Technology
To meet diversifying customer needs for pen technology solutions, Active ES Pen Technology
was developed based on Wacom’s original technology, and began mass production of
customers’ new models.
By incorporating both multi-touch and pen input functions into the touch panel, we eliminated
the need for a dedicated pen sensor board and achieved a low cost solution.
Newly developed one chip controller enables high performance pen functions.
(Unit: JPY)

All Rights Reserved. Copyright © 2015 Wacom Co., Ltd. 18
Business Highlights:
Other Business
CAD software and others 0.66 bn +0.2%
Replacement demand contributed to steady sales.
Along with the sales of major product ECAD dio 2015, we have developed a new product
with key functions targeted toward machinery and robotics.
0.66 bn +0.2%
F&A (Corporate)
Continued to invest in business infrastructure for growth and operational efficiency.
Major projects include development of global SCM system infrastructure for e-
commerce, Global HR system, etc.
Developed WILL (Wacom Ink Layer Language) as a new framework to standardize
digital ink, and started partnership development activities.
Shifted the regional-based organization to a global and customer segment-based one.
The new organization started in April, 2015.
(Unit: JPY)

All Rights Reserved. Copyright © 2015 Wacom Co., Ltd. 19
Sales by Product Line in Brand Product
20,664 21,981
2,8713,909
9,79910,590
1,691
1,5543,935
5,591
0
5,000
10,000
15,000
20,000
25,000
30,000
35,000
40,000
45,000
FY 03/14 FY 03/15
Creative・Pen tablet Creative・Mobile Creative・Display Consumer VM
36.2%
9.4%
8.1%
42.1%
43,625
38,960
+12.0%(Unit: Million JPY)
Change
Ratio
-8.1%
Creative
biz
33,334
Creative
biz
36,480
+9.4%
All Rights Reserved. Copyright © 2015 Wacom Co., Ltd. 20
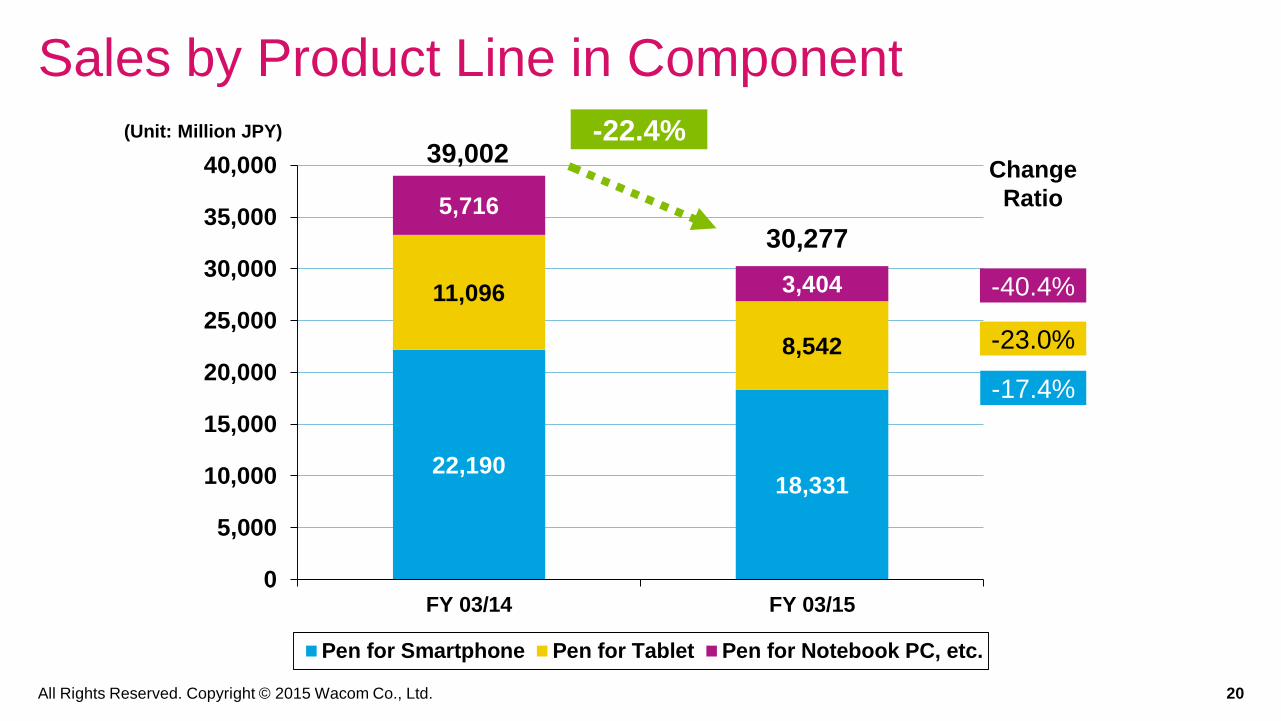
Sales by Product Line in Component
22,19018,331
11,096
8,542
5,716
3,404
0
5,000
10,000
15,000
20,000
25,000
30,000
35,000
40,000
FY 03/14 FY 03/15
Pen for Smartphone Pen for Tablet Pen for Notebook PC, etc.
-40.4%
-23.0%
-17.4%
30,277
39,002-22.4%(Unit: Million JPY)
Change
Ratio

All Rights Reserved. Copyright © 2015 Wacom Co., Ltd. 21
0
5,000
10,000
15,000
20,000
25,000
12/4-6 12/7-9 12/10-12 13/1-3 13/4-6 13/7-9 13/10-12 14/1-3 14/4-6 14/7-9 14/10-12 15/1-3
Professional Creative Consumer(Bamboo tablet, etc.) Consumer(Stylus, etc.) Business(VM) Comp. CAD, etc.
Quarterly Trend by Product Line
10,058
12,684
19,188 19,138
15,414
19,026
23,389
20,786
13,669
18,342
24,954
17,592
(Unit: Million JPY)

All Rights Reserved. Copyright © 2015 Wacom Co., Ltd. 22
Sales by Region
39,00230,277
7,578
7,132
12,493
13,914
12,668
14,532
6,8748,702
0
10,000
20,000
30,000
40,000
50,000
60,000
70,000
80,000
FY 03/14 FY 03/15
Comp. Japan U.S. Germany Asia Oceania
26.6%
11.4%
-5.9%
-22.4%
( 1.0%)
14.7%( 12.6%)
( ) % growth based
on local currency
-5.2%78,615 74,557
(Unit: Million JPY)Change
Ratio
(Note) There are no regional segments in the Component business.
All Rights Reserved. Copyright © 2015 Wacom Co., Ltd. 23
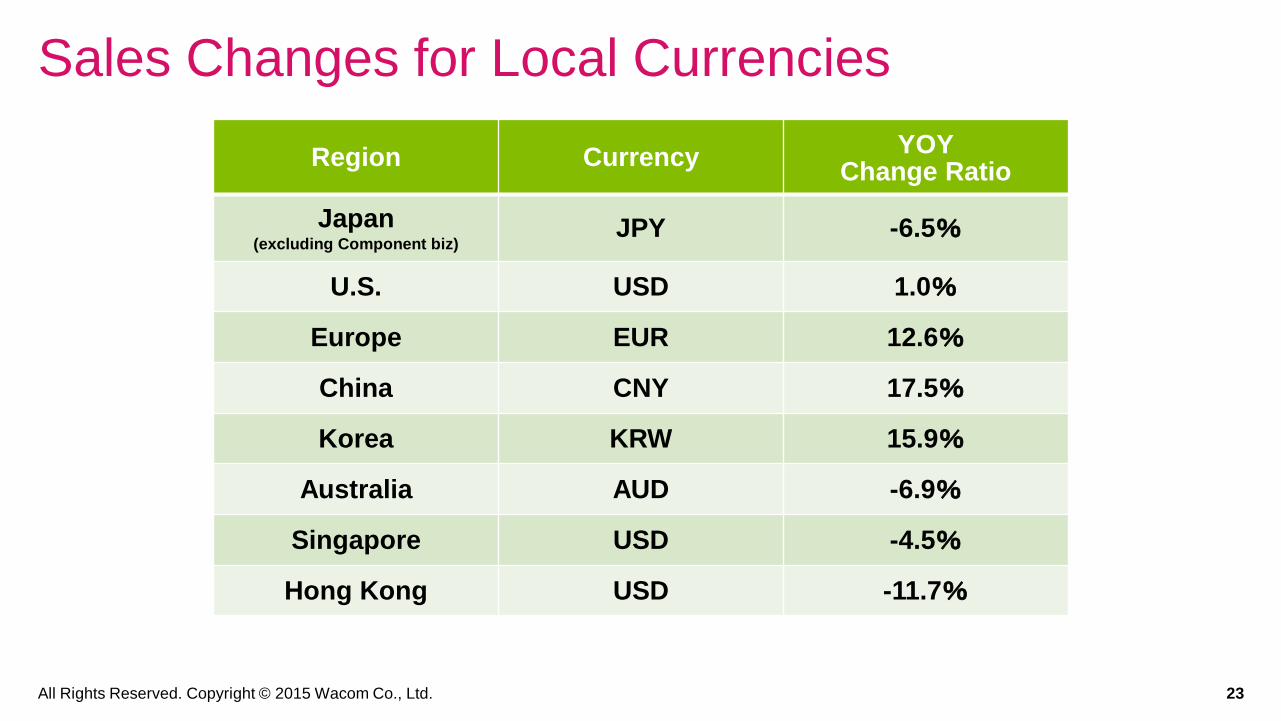
Sales Changes for Local Currencies
Region CurrencyYOY
Change Ratio
Japan(excluding Component biz)
JPY -6.5%
U.S. USD 1.0%
Europe EUR 12.6%
China CNY 17.5%
Korea KRW 15.9%
Australia AUD -6.9%
Singapore USD -4.5%
Hong Kong USD -11.7%

All Rights Reserved. Copyright © 2015 Wacom Co., Ltd. 24
0
5,000
10,000
15,000
20,000
25,000
12/4-6 12/7-9 12/10-12 13/1-3 13/4-6 13/7-9 13/10-12 14/1-3 14/4-6 14/7-9 14/10-12 15/1-3
Comp. Japan U.S. Germany Asia Oceania
Quarterly Trend by Region
10,058
12,684
19,188 19,138
15,414
19,026
23,389
20,786
13,669
18,342
24,954
17,592
(Unit: Million JPY)
(Note) There are no regional segments in the Component business.
All Rights Reserved. Copyright © 2015 Wacom Co., Ltd. 25
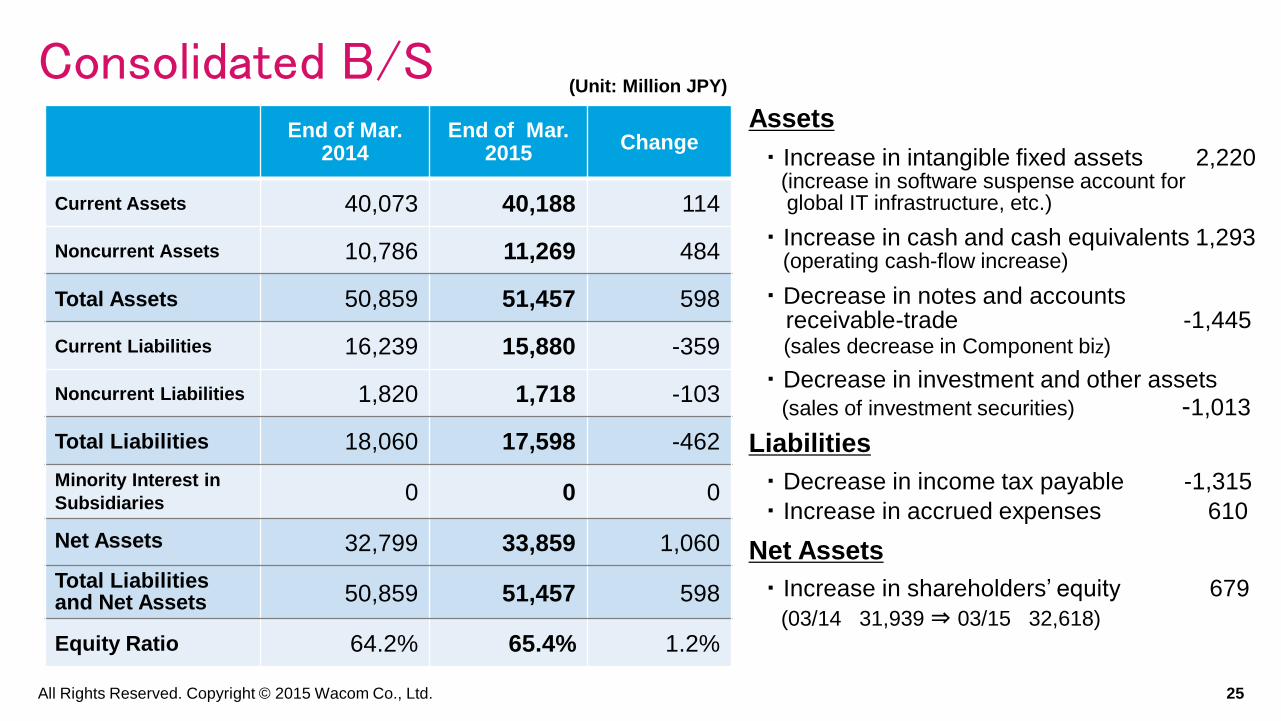
Consolidated B/SAssets
・ Increase in intangible fixed assets 2,220(increase in software suspense account forglobal IT infrastructure, etc.)
・ Increase in cash and cash equivalents 1,293 (operating cash-flow increase)
・ Decrease in notes and accountsreceivable-trade -1,445(sales decrease in Component biz)
・ Decrease in investment and other assets(sales of investment securities) -1,013
Liabilities
・ Decrease in income tax payable -1,315
・ Increase in accrued expenses 610
Net Assets
・ Increase in shareholders’ equity 679
(03/14 31,939 ⇒ 03/15 32,618)
End of Mar. 2014
End of Mar. 2015
Change
Current Assets 40,073 40,188 114
Noncurrent Assets 10,786 11,269 484
Total Assets 50,859 51,457 598
Current Liabilities 16,239 15,880 -359
Noncurrent Liabilities 1,820 1,718 -103
Total Liabilities 18,060 17,598 -462
Minority Interest in
Subsidiaries0 0 0
Net Assets 32,799 33,859 1,060
Total Liabilities and Net Assets 50,859 51,457 598
Equity Ratio 64.2% 65.4% 1.2%
(Unit: Million JPY)

All Rights Reserved. Copyright © 2015 Wacom Co., Ltd. 26
Consolidated C/FMajor Activities in FY03/15
C/F from operating activities
・ Net profit before tax 5,107
・ Increase in depreciation 1,970
・ Decrease in notes and accountsreceivable-trade 1,804
・ Income tax paid -2,457
C/F from investing activities
・ Purchase of fixed assets -3,338(global IT infrastructure, etc.)
C/F from financing activities
・ Cash dividends paid -2,904
FY 03/14 FY 03/15YoY
Change
04/13
-03/14
04/14
-03/15Amount
C/F from operating
activities734 6,782 6,048
C/F from investing
activities-4,416 -3,278 1,138
C/F from financing
activities-3,255 -2,850 406
Effect of change in
exchange rate 735 638 -97
Increase-decrease of
cash & cash equivalent-6,202 1,293 7,495
Beginning balance of
cash & cash equivalent21,596 15,394 -6,202
Ending balance of cash
and cash equivalent15,394 16,687 1,293
(Unit: Million JPY)

FY 03/2016
Basic Policy and
Business Focus

All Rights Reserved. Copyright © 2015 Wacom Co., Ltd. 28
Business Environment for FY 03/16
Despite some uncertainties, the global economy is expected to maintain a recovery trend, led by US economic expansion, financial policies in major countries and low oil price. While Asian countries are expected to maintain their growth rate, the LATAM region is expected to show no growth.
The creative market is expected to continue to expand with acceleration in the mobile product category, 3D design and 3D printing evolution in advanced countries and digital design expansion in emerging markets.
In the UI field, Pen & Ink is expected to gain momentum as the need for personal digital contents increases among mobile consumers.
Integration of Consumer stylus, application and starts to offer new user values.
Mobile workflow and security will become critical in enterprise markets, anddigital signature is expected to expand to the mobile space.
Wearables will start creating a new ecosystem for our products.

All Rights Reserved. Copyright © 2015 Wacom Co., Ltd. 29
Basic Strategies and Initiatives
Drive growth through the new user-centric global business unit.
Integrate branding, marketing and sales for higher customer value.
Extend mobile product offers and reach new users in 3D and emerging markets
Create a new digital stationery category by integrating hardware, software and Cloud.
Establish fully-integrated global business infrastructure.
Establish AES and WILL as the global digital pen and ink standard.
Build a new framework for future innovations in technology and products.
Enhance corporate governance and processes for improving corporate value.

All Rights Reserved. Copyright © 2015 Wacom Co., Ltd. 30
Business Segment by User Category
Technology Solution Business UI technology solutions for mobile systems EMR, AES Components & modules (feelTM)
Other Business Engineering solution・ECAD dio
Consumer business Makes daily lives more creative and enjoyable
Bamboo Stylus, Bamboo Pad, etc.
Business solution Serves society by providing innovative solutions
STU (Signature Tablet), DT (Display Tablet) series, etc.
Creative business Serves the passion of professional and consumer creativity
Intuos, Intuos Pro, Cintiq Companion, Cintiq
Bra
nd
Pro
du
ct
Bu
sin
es
s
Platform &application
Provides
technology,
apps and
platforms
WILL,
Bamboo
Paper,
Sign&
Save

All Rights Reserved. Copyright © 2015 Wacom Co., Ltd. 31
Assumptions for FY 03/16 Forecast
Market demand based on review (mid-April, 2015)
(Note) Due to risks and uncertainties involved in the forecast of market and customer trends of the Technology Solution business (former Component Business), forward-looking statements may materially differ from actual results in the short-term.
• Forex rate assumptions for FY 03/16
1USD = 110 JPY (YOY +0.03 JPY, week JPY)1EURO = 130 JPY (YOY -8.68 JPY, strong JPY)
Forex exchange sensitivity: 12-month forecast
Currencies USD EURO
Unit of sensitivity JPY 1 JPY 1
Sales 550 120
Operating Profit 0 90
*A stronger yen has a negative effect while a weaker yen has a positive effect.
(Unit: Million JPY)

All Rights Reserved. Copyright © 2015 Wacom Co., Ltd. 32
Assumptions for FY 03/16 Forecast
Capital expenditure
5.20 bn (YOY +27.4%)
• Key items: IT systems to form global organizations and molds, etc
Depreciation
2.50 bn (YOY 26.9%)
R&D expense
4.00 bn (YOY 25.8%)
• Key items: Development of new products in Brand business, developmentof next generation ICs, and basic technology research, etc.

All Rights Reserved. Copyright © 2015 Wacom Co., Ltd. 33
Summary for FY 03/16 Forecast1H FY 03/15 1H FY 03/16 YOY
04/14-09/14 04/15-09/15 Growth rate
Sales 32,011 34,800 8.7%
OP 1,826 5.7% 0 0.0% -100%
RP 1,761 5.5% -50 -0.1% -102.8%
NP 1,147 3.6% -50 -0.1% -104.4%
FY 3/15 FY 3/16 YOY
04/14-03/15 04/15-03/16 Growth rate
Sales 74,557 84,000 12.7%
OP 6,143 8.2% 5,500 6.5% -10.5%
RP 6,065 8.1% 5,350 6.4% -11.8%
NP 3,473 4.7% 3,530 4.2% 1.6%
ROE 10.5% 10.4% -0.1%
• We forecast an operating loss
in Q1 but expect OP to break-
even in 1H due to the
increase of SG&A, including
expenses for the launch of
new IT infrastructure and
R&D costs, which will raise
the SG&A ratio.
• We forecast an YOY growth of
OP in 2H owing to higher sales
in both Brand and Technology
Solution businesses driven by
new products and business
seasonality.
• We forecast NP to stay at the
same level as the previous
fiscal year since we are not
currently expecting any
extraordinary losses or gains.
(Unit: Million JPY)

All Rights Reserved. Copyright © 2015 Wacom Co., Ltd. 34
Forecast of Results by Business SegmentFY 3/15
(actual)
FY 3/16
(forecast)YOY Change
04/14-03/15 04/15-03/16 Amount Ratio
Sales 74,557 84,000 9,443 12.7%
Brand Product biz 43,625 50,300 6,675 15.3%
Tech. Solution Biz 30,277 33,000 2,723 9.0%
Other biz 655 700 45 6.9%
Operating Profit 6,143 5,500 -643 -10.5%
Brand Product biz 5,965 9,280 3,315 55.6%
Tech. Solution Biz 4,642 4,570 -72 -1.5%
Other biz 55 60 5 8.8%
Corp. and others -4,519 -8,410 -3,891 86.1%
OPM 8.2% 6.5%
(Unit: Million JPY)

All Rights Reserved. Copyright © 2015 Wacom Co., Ltd. 35
Forecast of Results by Business Segment
The Brand Product business expects the growth in both Sales and Profit with
planned new product launches as well as contribution of the products
launched during FY32. And, it also reflects the reassignment of OP items
between Business Unit and Corporate Functions due to the global
organizational changes.
The Technology Solutions business forecasts sales recovery as smartphone
segment demand at the same level as FY32 and Tablet market expands with
Active ES pen technology shipment. Profitability stays at he level of the
previous fiscal year with higher price pressure across the categories.
Corporate functions expects 2.5B JPY OP increase including 700MJPY
increase due to the start of depreciation of new global IT infrastructure and
related expenses, reassignment of OP items between the Branded Product
business and Corporate functions.

All Rights Reserved. Copyright © 2015 Wacom Co., Ltd. 36
Sales Forecast by Business Segment
43,62550,300
30,277
33,000
655
700
0
10,000
20,000
30,000
40,000
50,000
60,000
70,000
80,000
90,000
FY 03/15 (actual) FY 03/16 (forecast)
Brand Product biz Tech. Solution biz Other biz
+6.9%
+15.3%
+9.0%
12.7%
74,557
84,000(Unit: Million JPY)
Change
Ratio
All Rights Reserved. Copyright © 2015 Wacom Co., Ltd. 37
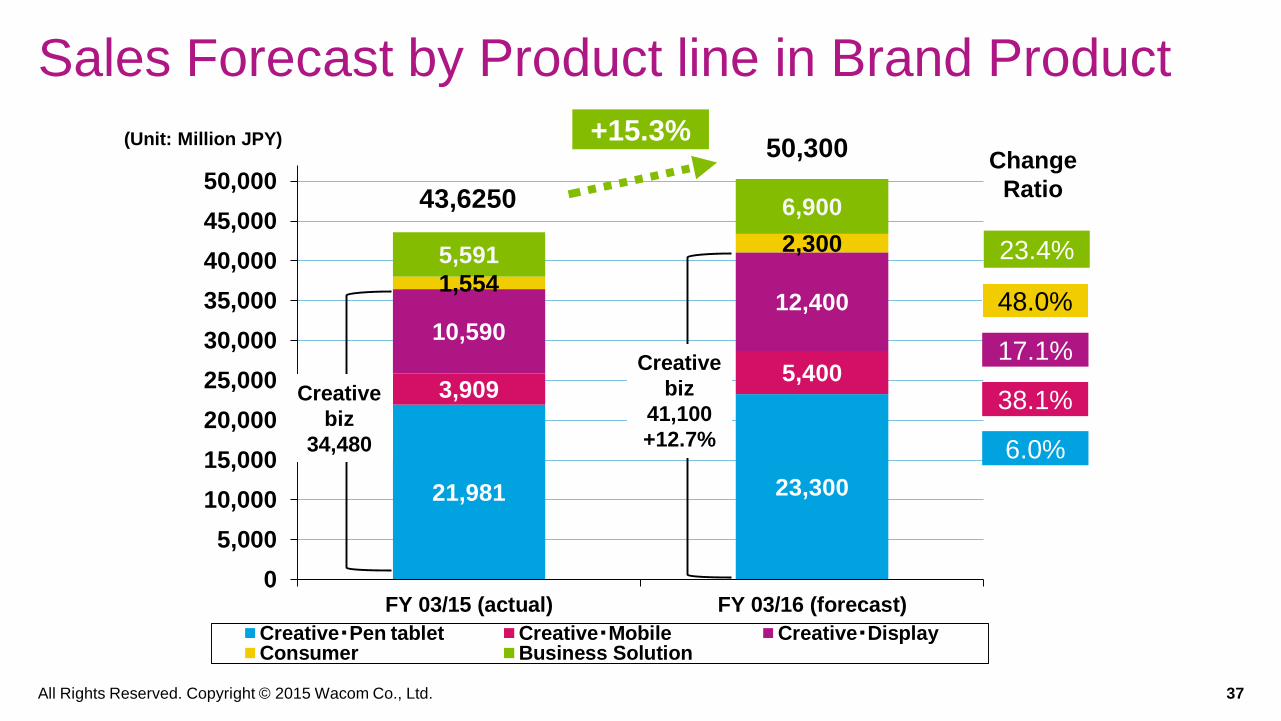
Sales Forecast by Product line in Brand Product
21,981 23,300
3,9095,400
10,590
12,4001,554
2,3005,591
6,900
0
5,000
10,000
15,000
20,000
25,000
30,000
35,000
40,000
45,000
50,000
FY 03/15 (actual) FY 03/16 (forecast)
Creative・Pen tablet Creative・Mobile Creative・DisplayConsumer Business Solution
48.0%
38.1%
6.0%
17.1%
23.4%
50,300
43,6250
+15.3%(Unit: Million JPY)
Change
Ratio
Creative
biz
34,480
Creative
biz
41,100
+12.7%

All Rights Reserved. Copyright © 2015 Wacom Co., Ltd. 38
Sales Forecast by Product line in Tech. Solution
18,331 18,500
8,54210,500
3,404
4,000
0
5,000
10,000
15,000
20,000
25,000
30,000
35,000
FY 03/15 (actual) FY 03/16 (forecast)
Pen for Smartphone Pen for Tablet Pen for Notebook PC, etc.
17.5%
22.9%
0.9%
33,000
30,277
9.0%(Unit: Million JPY)
Change
Ratio

All Rights Reserved. Copyright © 2015 Wacom Co., Ltd. 39
Sales Forecast by Region
30,277 33,000
7,1327,960
13,91416,550
14,532
15,4208,702
11,070
0
10,000
20,000
30,000
40,000
50,000
60,000
70,000
80,000
90,000
FY 03/15 (actual) FY 03/16 (forecast)
Comp. Japan U.S. Germany Asia Oceania
27.2%
18.9%
11.6%
9.0%
6.1%
12.7%
74,557
84,000(Unit: Million JPY)
Change
Ratio
(Note) There are no regional segments in the Component business.

All Rights Reserved. Copyright © 2015 Wacom Co., Ltd. 40
Dividend Forecast for FY 03/16
Dividend policy
Continue steady dividend payout to shareholders while maintaining a stable financial base necessary for future business development.
Target payout ratio maintains approximately 40% or more to attract global investment.
Dividend per share
JPY 18.00 per share for FY 03/16 (JPY 18.00 for FY 03/15)
Payout ratio 85.0% (86.3% for FY 03/15)

All Rights Reserved. Copyright © 2015 Wacom Co., Ltd. 41
Dividends per Share
0.00
2.50
5.00
7.50
10.00
12.50
15.00
17.50
20.00
FY 03/12 FY 03/13 FY 03/14 FY 03/15 FY 03/16
Specialdividend pershare
Ordinaydividend pershare
54.9%
37.7%
55.9%
86.3% 85.0%
Payout ratio
7.50
11.25
18.0017.50 18.00
(Unit: JPY)
(Forecast)
(Forecast)
(Forecast)

All Rights Reserved. Copyright © 2015 Wacom Co., Ltd. 42
our vision

All Rights Reserved. Copyright © 2015 Wacom Co., Ltd. 43our mission

All Rights Reserved. Copyright © 2015 Wacom Co., Ltd. 44
our brand

DisclaimerForward-looking statements regarding future events and
performance contained in this presentation are based on currently
available information and involve risks and uncertainties, including
macroeconomic conditions, trends of the industry in which the
company is engaged and progress in new technologies. Please
note that actual results could materially differ from those expressed
or implied by the forward-looking statements in this presentation
due to these risks and uncertainties.
Investor Relations Inquiries
TEL: +81-3-5337-6502 FAX: +81-3-5337-6519
Wacom Co., Ltd.
Sumitomo Fudosan Shinjuku Grand Tower 31F,
8-17-1 Nishi-Shinjuku, Shinjuku-ku, Tokyo
160-6131, Japan
Wacom Co., Ltd.
http://www.wacom.com