Embed Size (px)
Citation preview
Joint Research Centre Directorate General Research
Business R&D in Europe: Trends inExpenditures, Researcher Numbers and
Related Policies
Alexander Grablowitz, Ana Delicado, Patrice Laget
EUR 22937 EN - 2007
European Commission Joint Research Centre - Institute for Prospective Technological Studies Directorate General Research Contact information Address: Edificio Expo. c/ Inca Garcilaso, s/n. E-41092 Seville (Spain) E-mail: [email protected] Tel.: +34 954488318 Fax: +34 954488300 http://ipts.jrc.ec.europa.eu http://www.jrc.ec.europa.eu http://ec.europa.eu/research/ Legal Notice Neither the European Commission nor any person acting on behalf of the Commission is responsible for the use which might be made of this publication. A great deal of additional information on the European Union is available on the Internet. It can be accessed through the Europa server http://europa.eu/ JRC36219 EUR 22937 ENDOI 10.2791/11432 ISBN 978-92-79-07077-8 ISSN 1018-5593 Luxembourg: Office for Official Publications of the European Communities © European Communities, 2007 Reproduction is authorised provided the source is acknowledged Printed in Spain
Joint Research Centre Directorate General Research
Business R&D in Europe: Trends in expenditures,
researcher numbers and related policies
Alexander Grablowitz, Ana Delicado1 and Patrice Laget2
1 Ana Delicado: University of Lisbon, Institute for Social Sciences, Avenida Professor Aníbal de Bettencourt, 9; 1600-189 LISBOA, Portugal; Telephone: 217 804 700 - Fax: 217 940 274; e-mail: [email protected] 2 Patrice Laget: Research Director; Inserm Unit 646, rue Andre Bocquel, 49000 Angers, France; E-Mail: [email protected]

2
Acknowledgements: This report has benefited from comments and suggestions of Prof. Bertrand Bellon and Prof. Aldo Geuna, who critically reviewed an earlier version. The contributions and comments of Rene van Bavel, Andries Brandsma, Raquel Ortega, Peter Voigt, Paul Desruelle and Antoine Schoen from DG-JRC IPTS and Jan Larosse and Vincent Duchene from DG RTD are also gratefully acknowledged. The English language editing has been performed by Duncan Gilson.
3
TABLE OF CONTENTS Executive Summary ....................................................................................... 1 Chapter 1 Introduction.................................................................................... 5 Chapter 2 The current views on the issue...................................................... 6 Chapter 3 Trends in the execution of industrial R&D 1995-2004 ................. 10
3.1 Trends of business R&D at EU level................................................ 10 3.2 The evolution of business R&D in selected sectors ......................... 14 3.3 The diversity of situations in the EU Member States ....................... 21
Chapter 4 Trends in the public funding of private R&D ................................ 33 Chapter 5 The policy choices of the Member States.................................... 41
5.1 Public funding of the Higher Education sector ................................. 41 5.2 Specific measures to foster business R&D ......................................... 45
Chapter 6 Conclusions ................................................................................. 52
LIST OF ANNEXES
Annex 1 Methodological notes ..................................................................... 57 Annex 2 Additional tables............................................................................. 61
4
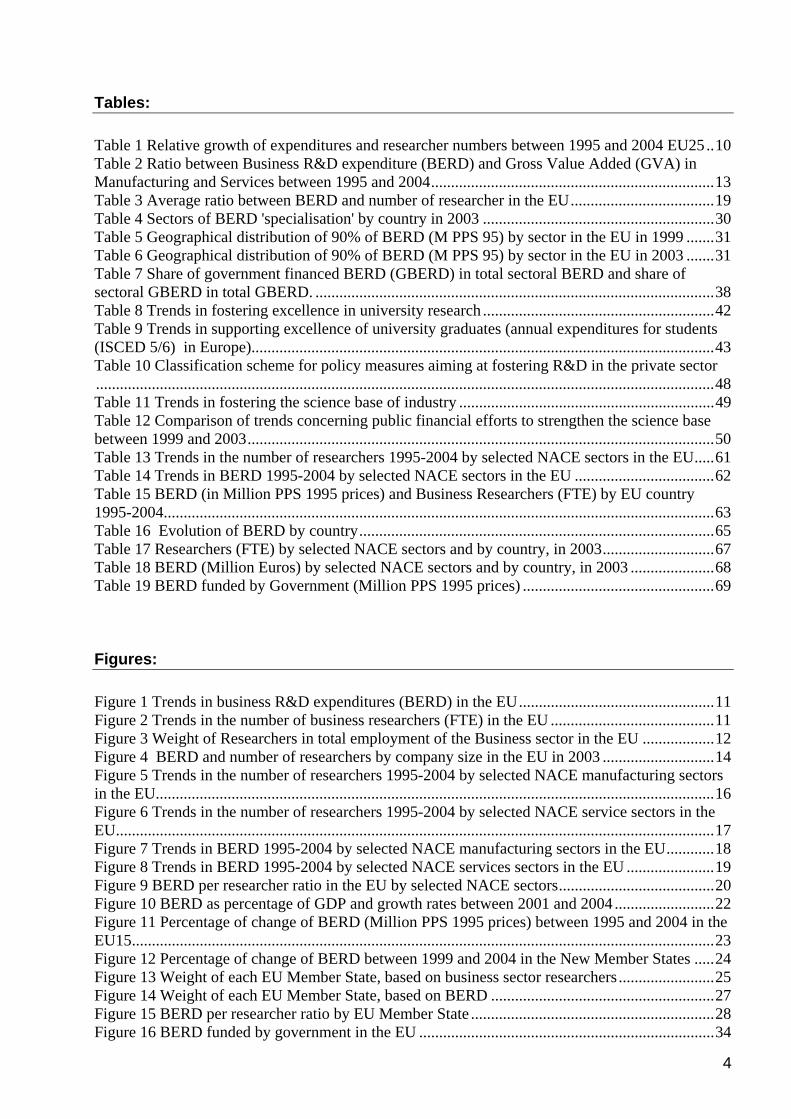
Tables: Table 1 Relative growth of expenditures and researcher numbers between 1995 and 2004 EU25..10 Table 2 Ratio between Business R&D expenditure (BERD) and Gross Value Added (GVA) in Manufacturing and Services between 1995 and 2004.......................................................................13 Table 3 Average ratio between BERD and number of researcher in the EU....................................19 Table 4 Sectors of BERD 'specialisation' by country in 2003 ..........................................................30 Table 5 Geographical distribution of 90% of BERD (M PPS 95) by sector in the EU in 1999 .......31 Table 6 Geographical distribution of 90% of BERD (M PPS 95) by sector in the EU in 2003 .......31 Table 7 Share of government financed BERD (GBERD) in total sectoral BERD and share of sectoral GBERD in total GBERD. ....................................................................................................38 Table 8 Trends in fostering excellence in university research ..........................................................42 Table 9 Trends in supporting excellence of university graduates (annual expenditures for students (ISCED 5/6) in Europe)....................................................................................................................43 Table 10 Classification scheme for policy measures aiming at fostering R&D in the private sector...........................................................................................................................................................48 Table 11 Trends in fostering the science base of industry ................................................................49 Table 12 Comparison of trends concerning public financial efforts to strengthen the science base between 1999 and 2003.....................................................................................................................50 Table 13 Trends in the number of researchers 1995-2004 by selected NACE sectors in the EU.....61 Table 14 Trends in BERD 1995-2004 by selected NACE sectors in the EU ...................................62 Table 15 BERD (in Million PPS 1995 prices) and Business Researchers (FTE) by EU country 1995-2004..........................................................................................................................................63 Table 16 Evolution of BERD by country.........................................................................................65 Table 17 Researchers (FTE) by selected NACE sectors and by country, in 2003............................67 Table 18 BERD (Million Euros) by selected NACE sectors and by country, in 2003 .....................68 Table 19 BERD funded by Government (Million PPS 1995 prices) ................................................69 Figures: Figure 1 Trends in business R&D expenditures (BERD) in the EU.................................................11 Figure 2 Trends in the number of business researchers (FTE) in the EU .........................................11 Figure 3 Weight of Researchers in total employment of the Business sector in the EU ..................12 Figure 4 BERD and number of researchers by company size in the EU in 2003 ............................14 Figure 5 Trends in the number of researchers 1995-2004 by selected NACE manufacturing sectors in the EU............................................................................................................................................16 Figure 6 Trends in the number of researchers 1995-2004 by selected NACE service sectors in the EU......................................................................................................................................................17 Figure 7 Trends in BERD 1995-2004 by selected NACE manufacturing sectors in the EU............18 Figure 8 Trends in BERD 1995-2004 by selected NACE services sectors in the EU ......................19 Figure 9 BERD per researcher ratio in the EU by selected NACE sectors.......................................20 Figure 10 BERD as percentage of GDP and growth rates between 2001 and 2004 .........................22 Figure 11 Percentage of change of BERD (Million PPS 1995 prices) between 1995 and 2004 in the EU15..................................................................................................................................................23 Figure 12 Percentage of change of BERD between 1999 and 2004 in the New Member States .....24 Figure 13 Weight of each EU Member State, based on business sector researchers........................25 Figure 14 Weight of each EU Member State, based on BERD ........................................................27 Figure 15 BERD per researcher ratio by EU Member State .............................................................28 Figure 16 BERD funded by government in the EU ..........................................................................34

5
Figure 17 Share of BERD funded by government by EU Member State in 2003 (%) .....................35 Figure 18 Growth pattern of direct funding of BERD by government (GBERD) in EU Member States between 1995 and 2003 against the EU average ....................................................................36 Figure 19 Share of Government funding performed by the business sector by EU Member State in 2003 (%)............................................................................................................................................39 Figure 20 Annual public expenditures on students in the EU between 1999 and 2003....................44
1
Executive Summary Why look at trends in business R&D? The European R&D investment target adopted in Barcelona back in 2002 called for an R&D intensity of 3% (R&D expenditures per GDP) until 2010 with 2% coming from the business sector. Since then, policy measures and initiatives to foster business R&D investments have been flourishing and have received very high political attention, including the Lisbon strategy's Integrated Guidelines for Growth and Jobs. In order to design and implement appropriate measures, R&D policy makers have to understand the nature, the rationale and the relevant trends of R&D investment decisions made by the business sector. Over the last few years, the European Commission launched a number of initiatives aimed at monitoring and understanding business sector R&D with the EU Industrial R&D Investment Scoreboard being the most prominent publication in this respect3. What questions are addressed in the report? In order to identify trends in business R&D, this report makes use of available, notably those regarding business expenditures on R&D (BERD) and a number of researchers in the business sectors. Moreover, it presents the diverse European business R&D landscape by breaking down BERD and a number of researchers by economic activity (NACE sectors) and by EU Member State. To complete the picture, the report looks at the policy mix of EU Member States in support of business sector R&D and develops a methodology for the identification of policy priorities in this regard. Within the issue of business R&D the following questions are addressed:
• What have the dynamics and trends in business R&D expenditures been over the last few years? What are the trends in numbers of business researchers and what is the balance between manufacturing and services?
• What policy instruments are currently applied to foster private R&D? Can national priorities be identified?
• What direct financial support from government is given to business R&D? Which sectors benefiting most?
This analytical framework that is complementary to existing exercises for monitoring and analysing R&D, is embedded into the ERAWATCH4 intelligence service and provides relevant and original policy information on business R&D. What trends can be observed at EU level? The aggregate EU situation was rather static over the last decade, but………….. During the last decade (1995-2004) business R&D activities in the EU grew in step with the overall performance of the economy. This was true for both expenditures and researcher numbers. Consequently, its intensity expressed in terms of expenditures as a percentage of GDP exhibited slow growth up until 2001 and has since stagnated. Although on the aggregate EU level the situation is fairly static, trends are much more dynamic for both, Member States and sectors. The main R&D growth driver over the last decade has been the 3 http://iri.jrc.es/research/scoreboard.htm 4 http://cordis.europa.eu/erawatch/index.cfm
2
service sector, in particular computer-based services, even during the recent economic downturn – the service sector was also responsible for most of the growth in the number of European researchers. However, manufacturing still accounts for about 80% of total BERD and researcher numbers, making it the core of EU private sector research. Manufacturing R&D was also fairly stable during the recent economic downturn, highlighting the degree of industry's commitment to R&D. However, increasing globalisation and the fact that most manufacturing is performed by large companies (as compared with the service sector) increases the risk of R&D being outsourced to emerging markets outside the EU. Over the last ten years the percentage of business researchers in the total workforce increased by 25%, which clearly demonstrates the trend towards a more knowledge-based economy. However, in the service sector, the ratio of BERD to Gross Value Added (GVA) has remained surprisingly stable over the last decade.
..... especially the service sector showed a highly dynamic growth rate.
What were the trends in the most relevant sectors of the economy?
Only three out of fifteen sectors showed a significant business R&D growth in the last decade, however…… Out of the fifteen sectors selected for a deeper analysis (representing more than 80% of EU- wide BERD), only three sectors showed significant increases in both numbers of researchers and expenditures over the last decade, irrespective of the general economic conditions, namely 'motor vehicles', 'pharmaceuticals' and 'computer and related activities'. The remaining twelve sectors either showed only very limited changes or seemed to be more affected by the general economic conditions, as their growth path changed with the economic downturn in 2001. The ratio of BERD to researcher numbers differs significantly among the sectors analysed: the 'pharmaceuticals' sector has the highest ratio of expenditures per researcher per year, at over € 350,000, whereas the 'computer and related activities' sector only has about € 140,000 per researcher per year. This ratio was variable in some sectors, although mainly in a downward direction. These trends might be caused by stable (or falling) labour costs and by the changing nature of business R&D, which is making more extensive use of ICT, especially in the development phase.
…more researchers are working in the business sector as the ratio between business R&D expenditures and number of researchers in the business sector is generally decreasing.
Do the trends differ significantly among EU Member States?
EU Member States showed very diverse trends in business R&D during the last decade driven by the evolution of their economic and research specialisations, but ….. The significance of BERD as a percentage of GDP varies significantly among Member States, as do the dynamics of BERD growth since the adoption of the Lisbon strategy– clearly some countries are in the process of catching-up (most notably Austria and Spain, but also some New Member States like Cyprus, Malta and Estonia). The service sector was the key driver of BERD growth in some New Member States (the Czech Republic, Slovakia and Lithuania) as well as in the EU-15. As service sector R&D's share in total BERD still remains low (the largest share is still in manufacturing), total BERD masks rapid growth rates in the service sector. In Spain, Ireland and Portugal, in particular, the service sector already accounts for a larger share of BERD than manufacturing. This suggests that the process of catching-up is also associated with a change in private sector R&D, with a slowing down of manufacturing R&D growth and the establishment of

3
unique competencies in the service sector. These findings suggest that national economic and research specialisations play a bigger role than is often assumed. Comparisons of the ratio of BERD to researcher numbers in different Member States revealed the expected diversity, which can be partly explained by differences in labour costs, but also by the differing economic structures. The geographical distribution of R&D activities across the EU on the sectoral level showed that manufacturing remains concentrated in just a handful of countries, but that service sector R&D is already more evenly spread. We might observe two complementary trends – one towards the broadening of R&D capacities across the Member States and another towards the development of a limited number of centres of excellence, which are also able to attract a concentration of private R&D investments.
.….. in nearly all Member States service sector R&D is booming whereas the high concentration of most of the manufacturing R&D in less than 10 Member States remained stable.
To what extent do governments still fund business R&D directly?
An increased use of indirect funding instruments such as tax incentives and the decrease of government funding of BERD on EU level seems to suggest a decreasing relevance of direct funding, but……….. Over the last decade the share of government funding of BERD (GBERD) decreased constantly in the EU as a whole. This is consistent with policy trends which tend to focus more on indirect support to business R&D expenditures, for instance, through tax incentives. The total amount of public funds to support business R&D, however, grew slightly over the last five years. This might be explained by public funds making up, to some extent, for the reduced business financed BERD during the economic downturn. The pattern of GBERD differs significantly among Member States, with a doubling of funding in Spain and Portugal, and an even bigger increase in the Czech Republic between 1995 and 2003, while there were substantial decreases in Germany, Denmark, the Netherlands and Poland. The findings here are consistent with the Member States' stated policy priorities. On the sectoral level, GBERD play a significant role for some sectors and countries. Especially in the new Member States, government funding often represents the majority of total BERD.
…..in reality the total amount GBERD is again growing in the EU and for some sectors direct governmental funding represents the major share of BERD.
Can national R&D policy priorities to foster business R&D be identified based on R&D statistics?
From R&D statistics it seems that funding for 'General Education' and direct support for 'Industrial Production and Technology' are more relevant policy priorities at EU level than tertiary education and basic research at universities, however….. For the analysis of Member States' policy choices, a specific analytical approach was developed. The approach is based on the assumption that growth rates of budget appropriations represent a policy priority, at least to a certain extent. It could be observed that 'General Education (all education levels)' and research in support of the 'Industrial Production and Technology' chapter of GBAORD showed very high growth rates at the EU level. The growth rates for university research ('Research funded from General University Funds' - GUF chapter) and 'Tertiary Education' were lower. These findings suggest that priority is given to direct specific measures in R&D and to a

4
general strengthening of the education system rather than specifically to tertiary education. Again, the situation differs when looking at the national level, where four groups of countries can be distinguished: The first group shows a clear focus on university research (GUF-chapter) and general education (all levels of education). A second group shows a clear focus on universities, in particular on tertiary education and on university research. Of the remaining two groups (each of which include just two countries) the first shows a strong focus on industry research and tertiary education and the other a strong focus on industry related research and with a focus on general education (all education levels). The limits of the analysis presented here are such that no firm conclusions can be drawn on which to base an assessment of national policy priorities. ….on national level priorities differ and allow for the identification of four different groups of Member States.
5
Chapter 1 Introduction There is little doubt that the future of industry5 in Europe occupies a very prominent position on the policy agenda today. Sustainable development, globalisation, and increased competitiveness are among the most often cited challenges in official documents on the future of European industry. In this context, the key role of innovations and technological developments through a bigger effort in R&D, in particular from industry, is also frequently mentioned. Overall the picture of European R&D may seem to be one of stability. For the former EU15, the ratio between Global Expenditures in R&D (GERD) and Gross Domestic Product (GDP) remained almost constant, at around 1.95%, between 1991 and 2004, the period for which EUROSTAT information is available. Moreover, the ratio between Business Expenditures in R&D (BERD) and GERD (Global Expenditures on R&D) also remained constant, at around 64%, during the same period and even before. This apparent stability masks, however, profound changes, which need to be further explored in order to inform the current debate. This is the objective of this report. This report is divided in three parts. The first part deals with the policy discourse and the popular wisdom about the state of play of industrial R&D. It refers to the challenges set by the EU with the Growth and Jobs Strategy (the revised Lisbon agenda), the perceived R&D deficit and the way to address it, the rise of globalisation and the corresponding fear of laboratories and R&D departments to be "offshored" to locations outside Europe. It draws upon the most recent documents produced by the European Commission and the OECD, as well as the available literature and the work of the Knowledge for Growth expert group set up by the Commissioner for Science and Research, Janez Potočnik. The second part focuses on the trends in industrial R&D, using two different measures: the level of expenditures and the number of researchers involved. It analyses the dynamics at work and the prevailing changes along two complementary dimensions: between the Member States and between the industrial sectors. It starts by presenting an aggregate EU picture and then, wherever reliable data is available, provides information on the individual Members States. This part also includes a section on public funding of BERD, as this is the most obvious channel through which public policies support private sector R&D. It is thus possible to see the dynamics or the direct public support to industrial R&D at the EU level and in the majority of the Member States. In addition, available information was collected to describe the division between the main industrial sectors (NACE6 categories). The third part provides a classification of policy measures aimed at strengthening private R&D efforts, both qualitatively and quantitatively. In addition, it aims at using available information to identify trends for the application of certain policy instruments. Its main source of information is the ERAWATCH research inventory7, a large set of harmonised information which was recently compiled by a wide network of institutions working closely with the European Commission. Governments can foster industrial R&D expenditures in many ways, by providing direct (grants and contracts) or indirect (tax incentives, public procurement policies) financial support, improving the framework conditions (higher education, academic research, large infrastructures) or supporting the market for the production of R&D intensive products or processes. Finally, the conclusions try to sum up the large set of information analysed in the three parts.
5 The term industry is used here to encompass both manufacturing and services. 6 NACE: Nomenclature of economic activities 7 http://cordis.europa.eu/erawatch/
6
Chapter 2 The current views on the issue The challenges stemming from economic globalisation and the particular European situation formed the basis for a combined European response, namely the Lisbon strategy. The original Lisbon strategy rested on a number of pillars8, which included preparing the transition towards a knowledge based economy by the creation of a European Research Area (ERA). In order to allow for mutual learning among Member States about effective ways to achieve the Lisbon objectives, the European Council introduced the use of the 'open method of coordination' (OMC) for research policy in 2003. Since then, CREST has set-up and endorsed a number of expert groups which published important documents aiming at laying the foundation for more balanced and evidence based R&D policy making at both the Member State and EU levels9. The Lisbon strategy and its implementation was the subject of an overall assessment by an independent expert group chaired by Wim Kok in 2004. The Kok Report10 underlines that urgent action is needed as the growth gap with the US and Asia has widened, while population growth and ageing represent a combined challenge for Europe. The main conclusions from this assessment were the following:
• There is an urgent need to accelerate employment and productivity growth in order to maintain social cohesion and environmental sustainability
• Social cohesion and environmental sustainability can contribute to growth and employment The Kok report underlines the importance of five areas of policy:
1. The knowledge society, with strong emphasis on R&D as a top priority and the promotion of the use of ICTs
2. The internal market: completion of the internal market and urgent action to create a single market for services
3. The business climate: among other things, improving the quality of legislation, facilitating the rapid start-up of new enterprises and creating an environment more supportive to businesses
4. The labour market: among other things, developing strategies for life-long learning and active ageing
5. Environmental sustainability: spreading eco-innovations and building leadership in eco-industries; pursuing policies which lead to long-term and sustained improvements in productivity through eco-efficiency.
The Kok Report also calls for more investments in technology in order to up-grade traditional manufacturing sectors to make them more competitive. A key objective for all policy measures should be to increase labour productivity in order to catch-up with progress in the US. The argument follows the observation that the US was able to create economic growth and employment by better exploiting the opportunities stemming from innovative use of ICTs, especially in the service sectors. The report puts strong emphasis on the potential of R&D to increase productivity, stating that up to 40% of labour productivity growth is generated from R&D spending and that powerful positive spill-over effects in other areas are possible. Another emphasis of the report lies on the creative use of the opportunities given by ICT, as more and more value creation lies in the distribution, 8 European Council (2000): Presidency conclusions, 23 and 24 March 2000 9 For an overview of relevant CREST OMC groups and their results, please consult: http://European Commission.europa.eu/invest-in-research/coordination/coordination01_en.htm 10 European Communities (2004): Facing the challenge: The Lisbon strategy for growth and employment; report from the high level group chaired by Wim Kok
7
financing, marketing and services rather than in the manufacturing of the original product. Here, the report links the quest of investing more in R&D and ICTs with the completion of the internal market in the service sector. As R&D and Innovation gained increasing importance within the Lisbon strategy, especially within the revised Lisbon strategy (Growth and Jobs Strategy), the European Council (Hampton Court summit) set up an independent expert group under the leadership of Mr. Esko Aho in 2005 with the mandate to elaborate ‘recommendations on ways to accelerate the implementation of planned new initiatives at EU or national level aiming at reinforcing EU research and innovation performance in the context of the revised Lisbon strategy’. The results of the expert group were presented to the European Spring Council in March 200611. The expert group identified the following key recommendations:
1. Setting up of a ‘Pact for research and innovation’, which should include the following three areas:
a. Provision of an innovation-friendly market for its businesses b. Increasing resources for Research towards the target of 3% of GDP, promoting
greater productivity from science and a trebling of structural funds spent on research and innovation
c. Enabling greater mobility of Human Resources, Financial Mobility and mobility of organisations and knowledge
2. Establishment of an independent monitoring panel charged with reporting annually on progress in relation to the pact
The Aho report again stresses the need to close the productivity gap with the US and to capitalise better on the application of ICTs. The report highlights the relevance of private sector R&D investments as a key driver of productivity growth. However, for companies the lack of an innovation friendly market, especially in the knowledge intensive service sectors, is a key barrier for more investment in R&D. Here, public policies should support the creation of lead markets for innovative products and services. Measures should include standard-setting, public procurement, a hospitable regulatory environment and efficient IPR protection. Additionally, the report identifies a number of strategic areas for action where the positive impact on growth and productivity would be high. These areas are e-Health, pharmaceuticals, transport and logistics, the environment, digital content, energy and security. More recently, the "Lisbon expert group" (LEG) published a report on Research and Innovation in the National Reform Programmes12 (NRP's). The expert group analysed Member States NRP’s with respect to Research and Innovation and drew up recommendations for improvements to Member States policies in this area. Most prominently, the report stresses the importance of viewing the interplay between research and innovation in a systemic way – increasing public R&D funding does not lead to more innovations and growth in productivity if the general if supportive framework conditions are not put in place at the same time. Therefore the right ‘policy mix’, which is highly dependent on the national sectoral composition, on the governance system and on the business culture, needs to be identified and the main weaknesses have to be addressed. The documents mentioned above highlight the relevance of R&D for future growth and prosperity – without going into more detail concerning the actual relations between R&D, innovation, productivity growth and increased competitiveness.
11 European Communities (2006): Creating and innovative Europe: Report of the independent expert group on R&D and innovation appointed following the Hampton Court summit and chaired by Mr. Esko Aho 12 European Communities (2006): Research and Innovation in the National Reform Programmes – opportunities for policy learning and co-operation; Report 1of the Lisbon Expert Group, May 2006
8
Available research clearly shows that there is no straightforward relationship between these key elements13. An investment in R&D does not lead automatically to innovations or to an increase in productivity. Nor will productivity growth improve competitiveness right away. A number of specific characteristics in a number of dimensions, from national or regional characteristics to sectoral issues or to macro economic framework conditions and business culture play an important role. For the purposes of the present report, we focus on business or private R&D investments as one enabler of innovation and thus, indirectly, of productivity growth. Companies have to invest in order to innovate and their innovation expenditures can be grouped along a number of dimensions. The most common ones are capital investments, R&D and non-R&D expenditures including training, market research, and IPR costs14. Innovation strategies and corresponding expenditures often include all three dimensions. However, depending on the sector, certain dimensions play a more dominant role than others. In the so called 'low-tech' sectors, process innovations are often acquired through investments in new capital goods such as new machinery, driving productivity gains and new product development. In other sectors, especially pharmaceuticals and motor vehicles, R&D expenditures play a dominant role. In consumer markets such as electronics or cosmetics, the non-R&D related expenditures are more important. The level of R&D investments by companies is determined not only by the sector, but also by the level of competition between companies within the sector. Competition among companies (but also countries) is often described by the level of productivity growth in the sector and/or by the sector's share of the world market15. Public policies to support innovation are based on the observation that positive societal spill-overs or externalities are associated with companies' innovation measures. This is especially true for R&D expenditures, as business R&D is closer than the other dimensions to the public knowledge system, including universities and schools16. Public policies to foster business innovations are a policy mix, including direct measures such as direct funding of business R&D or tax incentives and indirect measures which can address all three dimensions, usually summarised as framework conditions17. Here we find measures such as incentives for capital investments, venture capital provisions or IPR regimes. Often the different policy measures are designed and executed in an independent way, limiting potential synergies. Whereas, in the past, public policies concentrated more on the provision of a well educated workforce and on the public basic research base in universities and other public research institutions, nowadays it is well recognised that public policies can be more effective when simultaneously focusing on measures to increase companies' capacity to make use of research results. Consequently, over the last two decades, technology transfer, cooperative programmes and public-private partnerships have played an increasing role in the public policy instrument mix used to foster business innovations, especially within the R&D policy sphere18. Another prominent trend is the adoption of a new public management philosophy in the R&D policy sphere – leading to substitution of instruments for direct support of private R&D by indirect ones, such as fiscal
13 Aghion, P. and Howitt, P. (2005): Appropriate growth policy: a unifying framework; 2005 Joseph Schumpeter Lecture, delivered to the 20th Annual Congress of the European Economic Association 14 See Keith Smith (2002): What is the knowledge economy? Knowledge intensity and distributed knowledge bases; INTECH discussion paper series 2002-6 15 See for example: EUROPEAN COMMISSION (2005): BEPA: EU competitiveness and industrial location by Reinhilde Veugelers, Mattias Levin and Tassos Belessiotis; 16 see OECD (2006) Going for growth or EUROPEAN COMMISSION (2004): European competitiveness report 2004 or Jean Pisani-Ferry and Andre Sapir: last exit to Lisbon, Bruegel report 17 See also work of CREST – OMC group on Policy Mix: Policy Mix Peer Reviews: Synthesis report of the CREST Policy Mix working group, second cycle, March 2006 18 See also for summary: CREST-OMC: Final Report on the public research base and its links to industry, OMC first cycle, June 2004
9
schemes19. This trend has implications when comparing public R&D expenditures in general and is more marked when comparing direct public funding of private R&D (GBERD), as statistics for public support for private R&D do not usually include the reduced tax income caused by tax incentive schemes20. More recently, the design of supportive framework conditions has come more into the focus of policy makers. The Lisbon strategy recognises the importance of all the described elements and asks Member States to design and execute the different policies in a more coordinated and integrated manner. This report will focus on several issues in this regard. We will look only at the R&D related dimensions of business innovations, as here sufficient qualitative and quantitative information is available. The non-R&D and capital investment dimension will not be addressed here. The report will also not address more general considerations concerning the role of public interventions in fostering business R&D; for more information on these issues, reference can be made to other recent publications21. In general, it is assumed that private sector R&D investments can be influenced by public policies and that ultimately, R&D investments lead to increased competitiveness through their positive impact on productivity, in terms of both labour and Total Factor productivity. These general assumptions of the report are in line with current knowledge22. Within the issue of business R&D we look at the following questions:
• What are the dynamics and trends in private R&D expenditures over the last few years? What are the trends of numbers of business researchers and what is the balance between manufacturing and services?
• What are policy instruments currently applied to foster private R&D? Can we identify national priorities?
• What direct support from government is given to business R&D? Which sectors are benefiting most?
19 OECD (2006): Treatment of tax incentives for R&D expenditures in R&D statistics, DSTI/EAS/STP/NESTI (2006) 20; OECD (2006): OECD Science, technology and Industry outlook 2006 20 EUROPEAN COMMISSION (2006): Expert Group on Fiscal Measures for Research Report submitted to CREST in the context of the Open Method of Co-ordination 21 OECD (2006): Evaluating government financing of business R&D: measuring behavioural additionality – introduction and synthesis 22 See, for example: Alo-Yrkkoe, Jyrki (2005): Impact of public R&D financing on private R&D: does financial constraint matter?, ENEPRI working paper No. 30, February 2005; Parisi, M.L., Schiantarelli, F., Sembenelli, A. (2005): Productivity, Innovation and R&D: Micro evidence for Italy; Griffith, R., Redding, S., van Reenen, J. (2001): Mapping the two faces of R&D: Productivity growth in a panel of OECD industries, IFS studies WP 02/00
10
Chapter 3 Trends in the execution of industrial R&D 1995-2004 In what follows two parameters are used to describe the amount of R&D performed by companies: level of expenditures and number of researchers. It is well known that the situation varies widely in terms of euros per researcher in the different Member States and in the various industrial sectors. Putting the two together provides complementary information and thus a better picture of the situation.
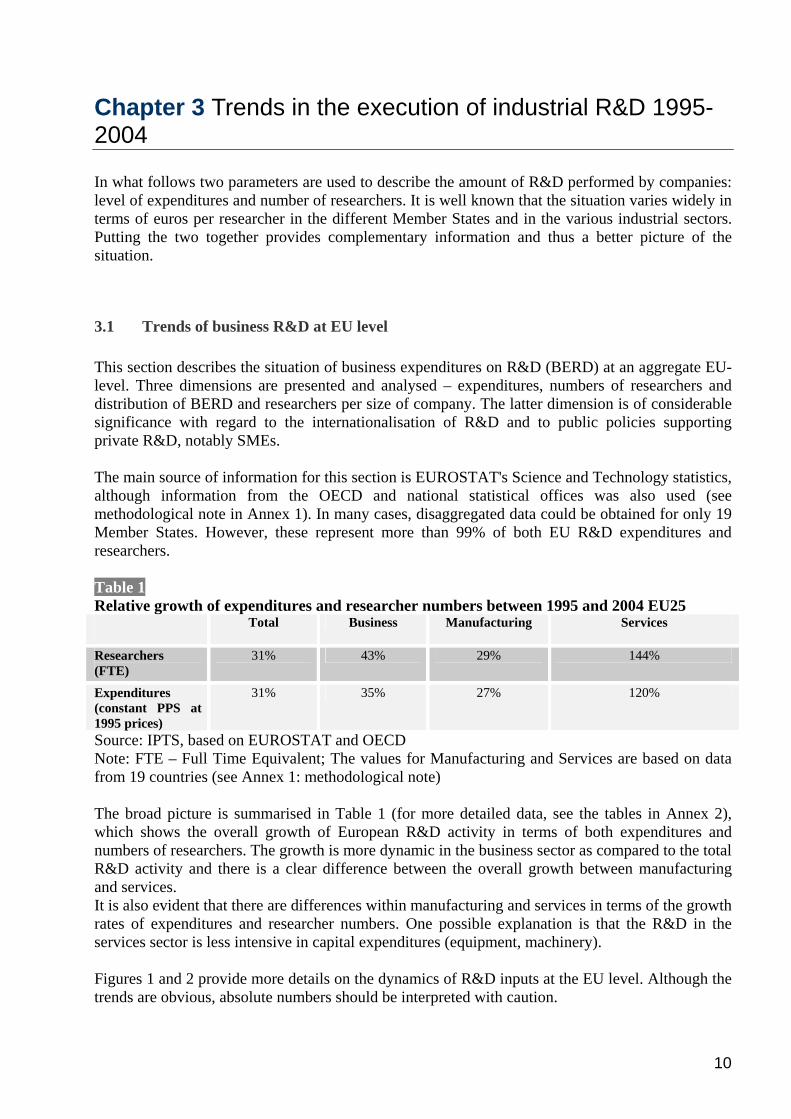
3.1 Trends of business R&D at EU level This section describes the situation of business expenditures on R&D (BERD) at an aggregate EU-level. Three dimensions are presented and analysed – expenditures, numbers of researchers and distribution of BERD and researchers per size of company. The latter dimension is of considerable significance with regard to the internationalisation of R&D and to public policies supporting private R&D, notably SMEs. The main source of information for this section is EUROSTAT's Science and Technology statistics, although information from the OECD and national statistical offices was also used (see methodological note in Annex 1). In many cases, disaggregated data could be obtained for only 19 Member States. However, these represent more than 99% of both EU R&D expenditures and researchers. Table 1 Relative growth of expenditures and researcher numbers between 1995 and 2004 EU25 Total Business Manufacturing Services
Researchers (FTE)
31% 43% 29% 144%
Expenditures (constant PPS at 1995 prices)
31% 35% 27% 120%
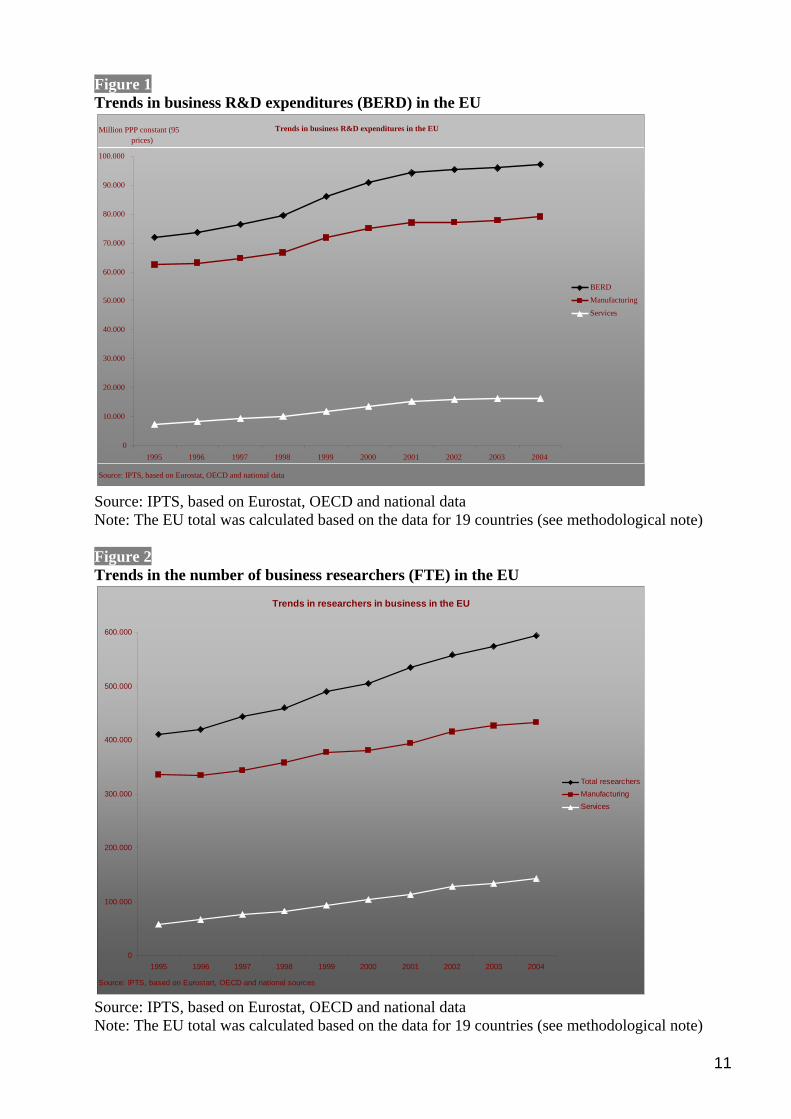
Source: IPTS, based on EUROSTAT and OECD Note: FTE – Full Time Equivalent; The values for Manufacturing and Services are based on data from 19 countries (see Annex 1: methodological note) The broad picture is summarised in Table 1 (for more detailed data, see the tables in Annex 2), which shows the overall growth of European R&D activity in terms of both expenditures and numbers of researchers. The growth is more dynamic in the business sector as compared to the total R&D activity and there is a clear difference between the overall growth between manufacturing and services. It is also evident that there are differences within manufacturing and services in terms of the growth rates of expenditures and researcher numbers. One possible explanation is that the R&D in the services sector is less intensive in capital expenditures (equipment, machinery). Figures 1 and 2 provide more details on the dynamics of R&D inputs at the EU level. Although the trends are obvious, absolute numbers should be interpreted with caution.
11
Figure 1 Trends in business R&D expenditures (BERD) in the EU
Source: IPTS, based on Eurostat, OECD and national data Note: The EU total was calculated based on the data for 19 countries (see methodological note) Figure 2 Trends in the number of business researchers (FTE) in the EU
Trends in researchers in business in the EU
0
100.000
200.000
300.000
400.000
500.000
600.000
1995 1996 1997 1998 1999 2000 2001 2002 2003 2004
Source: IPTS, based on Eurostart, OECD and national sources
Total researchersManufacturingServices
Source: IPTS, based on Eurostat, OECD and national data Note: The EU total was calculated based on the data for 19 countries (see methodological note)
Trends in business R&D expenditures in the EU
0
10.000
20.000
30.000
40.000
50.000
60.000
70.000
80.000
90.000
100.000
1995 1996 1997 1998 1999 2000 2001 2002 2003 2004
Source: IPTS, based on Eurostat, OECD and national data
Million PPP constant (95 prices)
BERD Manufacturing Services
12
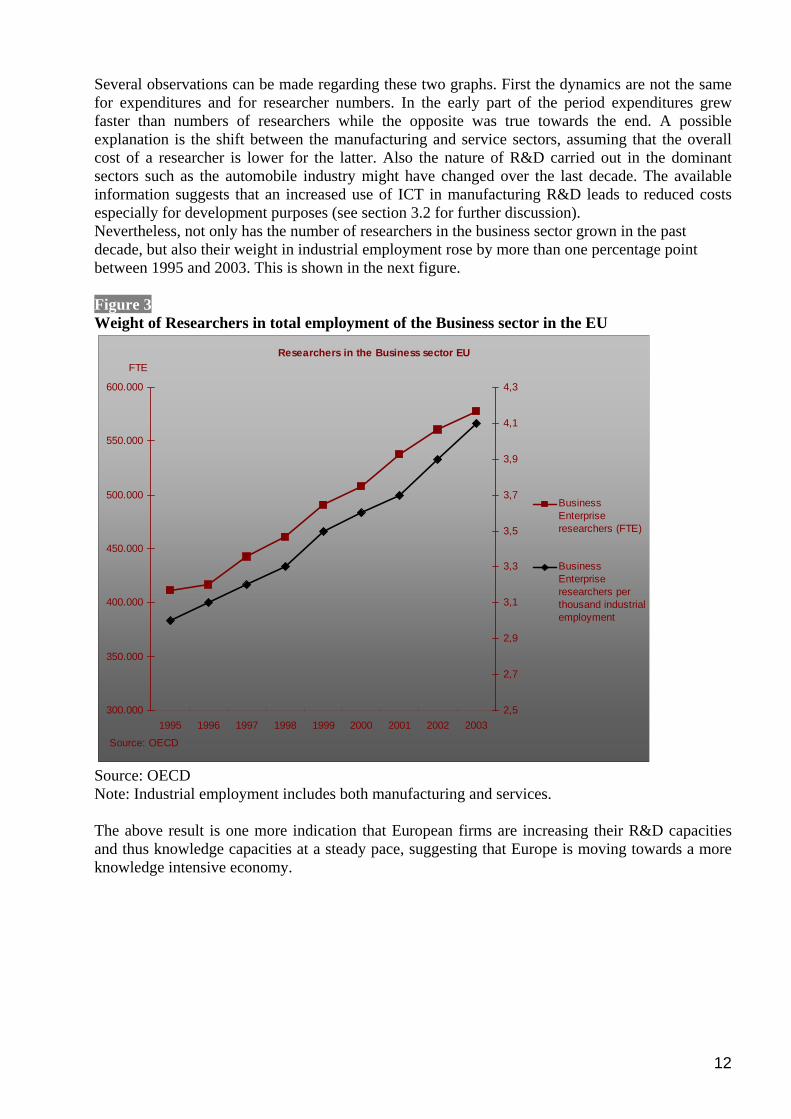
Several observations can be made regarding these two graphs. First the dynamics are not the same for expenditures and for researcher numbers. In the early part of the period expenditures grew faster than numbers of researchers while the opposite was true towards the end. A possible explanation is the shift between the manufacturing and service sectors, assuming that the overall cost of a researcher is lower for the latter. Also the nature of R&D carried out in the dominant sectors such as the automobile industry might have changed over the last decade. The available information suggests that an increased use of ICT in manufacturing R&D leads to reduced costs especially for development purposes (see section 3.2 for further discussion). Nevertheless, not only has the number of researchers in the business sector grown in the past decade, but also their weight in industrial employment rose by more than one percentage point between 1995 and 2003. This is shown in the next figure. Figure 3 Weight of Researchers in total employment of the Business sector in the EU
Researchers in the Business sector EU
300.000
350.000
400.000
450.000
500.000
550.000
600.000
1995 1996 1997 1998 1999 2000 2001 2002 2003
Source: OECD
FTE
2,5
2,7
2,9
3,1
3,3
3,5
3,7
3,9
4,1
4,3
BusinessEnterpriseresearchers (FTE)
BusinessEnterpriseresearchers perthousand industrialemployment
Source: OECD Note: Industrial employment includes both manufacturing and services. The above result is one more indication that European firms are increasing their R&D capacities and thus knowledge capacities at a steady pace, suggesting that Europe is moving towards a more knowledge intensive economy.
13
Table 2 Ratio between Business R&D expenditure (BERD) and Gross Value Added (GVA) in Manufacturing and Services between 1995 and 2004 1995 1996 1997 1998 1999 2000 2001 2002 2003 2004
Manufacturing
GVA 1,273,653 1,311,894 1,390,930 1,445,639 1,479,843 1,580,203 1,600,177 1,602,669 1,579,289 1,633,929
BERD 68,211 70,526 74,156 77,426 84,994 90,875 94,835 97,241 98,179 10,1431
Intensity 5.4 5.4 5.3 5.4 5.7 5.8 5.9 6.1 6.2 6.2
Services
GVA 4,210,521 4,462,662 4,724,384 4,970,467 5,260,493 5,656,679 5,950,102 6,243,694 6,395,184 6,699,343
BERD 8,061 9,260 10,813 11,984 14,009 16,607 18,871 20,111 20,357 20,874
Intensity 0.2 0.2 0.2 0.2 0.3 0.3 0.3 0.3 0.3 0.3
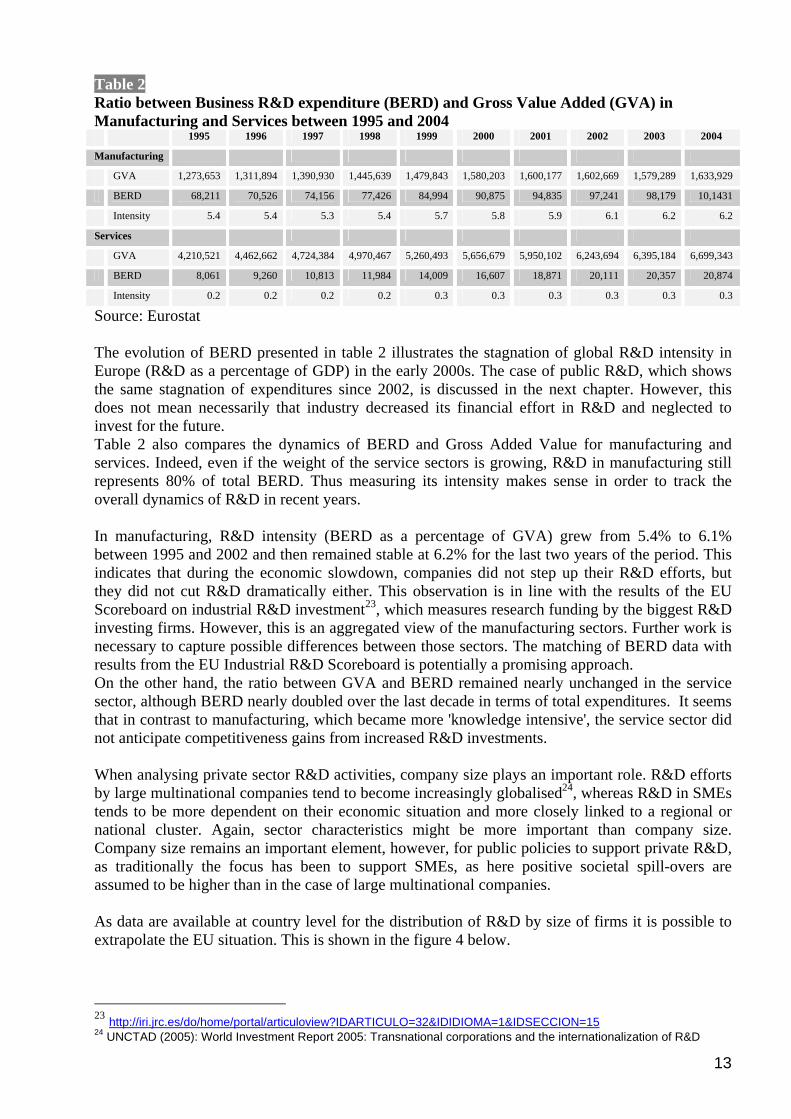
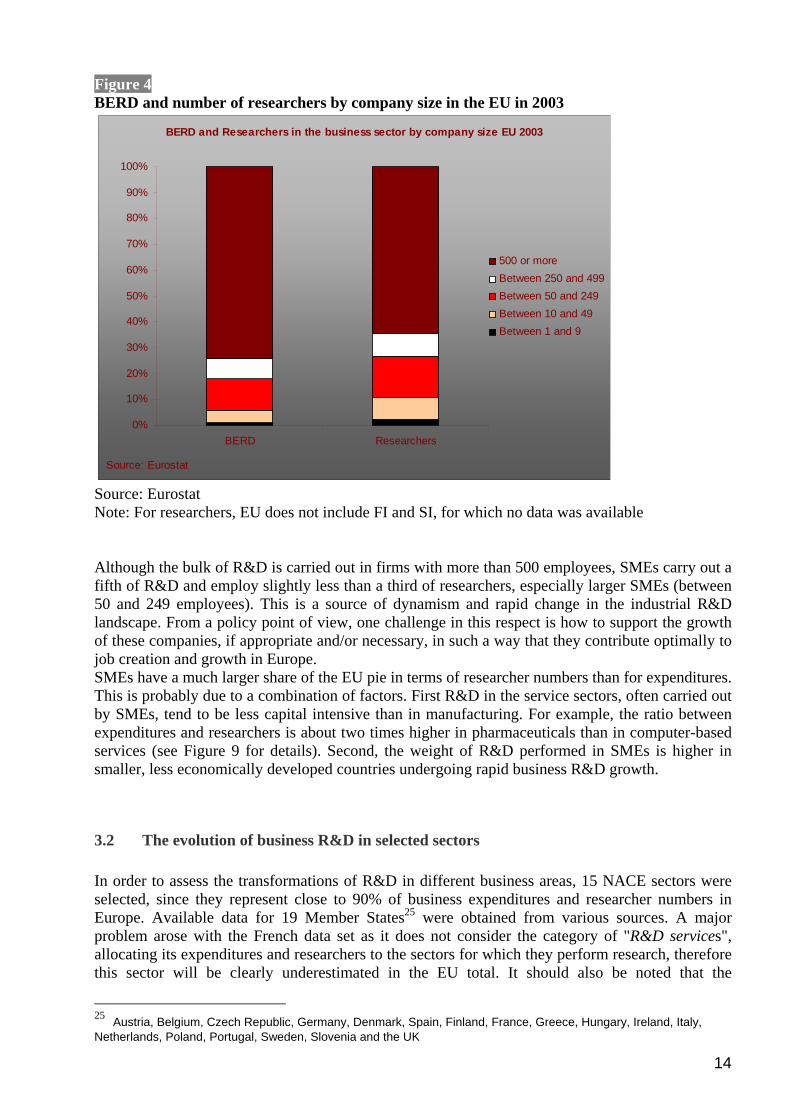
Source: Eurostat The evolution of BERD presented in table 2 illustrates the stagnation of global R&D intensity in Europe (R&D as a percentage of GDP) in the early 2000s. The case of public R&D, which shows the same stagnation of expenditures since 2002, is discussed in the next chapter. However, this does not mean necessarily that industry decreased its financial effort in R&D and neglected to invest for the future. Table 2 also compares the dynamics of BERD and Gross Added Value for manufacturing and services. Indeed, even if the weight of the service sectors is growing, R&D in manufacturing still represents 80% of total BERD. Thus measuring its intensity makes sense in order to track the overall dynamics of R&D in recent years. In manufacturing, R&D intensity (BERD as a percentage of GVA) grew from 5.4% to 6.1% between 1995 and 2002 and then remained stable at 6.2% for the last two years of the period. This indicates that during the economic slowdown, companies did not step up their R&D efforts, but they did not cut R&D dramatically either. This observation is in line with the results of the EU Scoreboard on industrial R&D investment23, which measures research funding by the biggest R&D investing firms. However, this is an aggregated view of the manufacturing sectors. Further work is necessary to capture possible differences between those sectors. The matching of BERD data with results from the EU Industrial R&D Scoreboard is potentially a promising approach. On the other hand, the ratio between GVA and BERD remained nearly unchanged in the service sector, although BERD nearly doubled over the last decade in terms of total expenditures. It seems that in contrast to manufacturing, which became more 'knowledge intensive', the service sector did not anticipate competitiveness gains from increased R&D investments. When analysing private sector R&D activities, company size plays an important role. R&D efforts by large multinational companies tend to become increasingly globalised24, whereas R&D in SMEs tends to be more dependent on their economic situation and more closely linked to a regional or national cluster. Again, sector characteristics might be more important than company size. Company size remains an important element, however, for public policies to support private R&D, as traditionally the focus has been to support SMEs, as here positive societal spill-overs are assumed to be higher than in the case of large multinational companies. As data are available at country level for the distribution of R&D by size of firms it is possible to extrapolate the EU situation. This is shown in the figure 4 below.
23 http://iri.jrc.es/do/home/portal/articuloview?IDARTICULO=32&IDIDIOMA=1&IDSECCION=15 24 UNCTAD (2005): World Investment Report 2005: Transnational corporations and the internationalization of R&D
14
Figure 4 BERD and number of researchers by company size in the EU in 2003
BERD and Researchers in the business sector by company size EU 2003
0%
10%
20%
30%
40%
50%
60%
70%
80%
90%
100%
BERD Researchers
Source: Eurostat
500 or moreBetween 250 and 499Between 50 and 249Between 10 and 49Between 1 and 9
Source: Eurostat Note: For researchers, EU does not include FI and SI, for which no data was available Although the bulk of R&D is carried out in firms with more than 500 employees, SMEs carry out a fifth of R&D and employ slightly less than a third of researchers, especially larger SMEs (between 50 and 249 employees). This is a source of dynamism and rapid change in the industrial R&D landscape. From a policy point of view, one challenge in this respect is how to support the growth of these companies, if appropriate and/or necessary, in such a way that they contribute optimally to job creation and growth in Europe. SMEs have a much larger share of the EU pie in terms of researcher numbers than for expenditures. This is probably due to a combination of factors. First R&D in the service sectors, often carried out by SMEs, tend to be less capital intensive than in manufacturing. For example, the ratio between expenditures and researchers is about two times higher in pharmaceuticals than in computer-based services (see Figure 9 for details). Second, the weight of R&D performed in SMEs is higher in smaller, less economically developed countries undergoing rapid business R&D growth.
3.2 The evolution of business R&D in selected sectors In order to assess the transformations of R&D in different business areas, 15 NACE sectors were selected, since they represent close to 90% of business expenditures and researcher numbers in Europe. Available data for 19 Member States25 were obtained from various sources. A major problem arose with the French data set as it does not consider the category of "R&D services", allocating its expenditures and researchers to the sectors for which they perform research, therefore this sector will be clearly underestimated in the EU total. It should also be noted that the
25 Austria, Belgium, Czech Republic, Germany, Denmark, Spain, Finland, France, Greece, Hungary, Ireland, Italy, Netherlands, Poland, Portugal, Sweden, Slovenia and the UK
15
assessment of expenditures and personnel in the R&D services sector varies widely between countries and from one year to the next (most likely due to a change in classifications). Some countries allocate them to the sectors for which research is performed (e.g. Pharmaceuticals, machinery). Whereas in some countries R&D services performed by public research organisations are treated as public sector R&D, in others they are counted as business expenditures, e.g. in Austria where the public research organisations has been privatised recently. Since no data were available for aeronautics and telecommunication services in several countries, we used broader categories that also include the manufacturing of other transport equipment and various forms of transport, respectively. The values for some sectors in some countries in some years also had to be estimated (see annex 1 - methodological note).
Beside the data-related limitations of the comparison, it should be kept in my mind that trends in R&D investments are sensitive to a number of factors, including country-specific factors. When comparing average R&D intensities of a number of sectors across OECD countries, a substantive variation can be observed26. R&D expenditures are sensitive to the availability of internal and external finance and to the level of competition27 among other factors; consequently the determinants of expenditures and their development over the last decade depend on a number of variables which are not captured by the simple numbers, and which currently remain obscure. As a result, the diversity of funding trends over the last decade in the selected sectors cannot easily be explained by the information available. Nevertheless, it is possible to distinguish clear differences in the global trends at the EU level (see also tables in Annex 2). Indeed, if there is a margin of error for the extrapolation of one specific sector in one particular Member State, the overall picture remains precise enough to identify the main trends.
26 OECD (2003): Targeting R&D: economic and policy implications of increasing R&D spending (STI working paper 2003/8) 27 For recent information on the determinants of business R&D expenditures, see: Jaumotte, F. and Pain, N. (2005): From ideas to development: The determinants of R&D and patenting, OECD Economics department working papers No. 457; McGuckin, R.H, Inklaar, R. and van Ark, B. (2004): The structure of business R&D: recent trends and measurement implications, The Conference Board Economics program working paper series #04-01
16
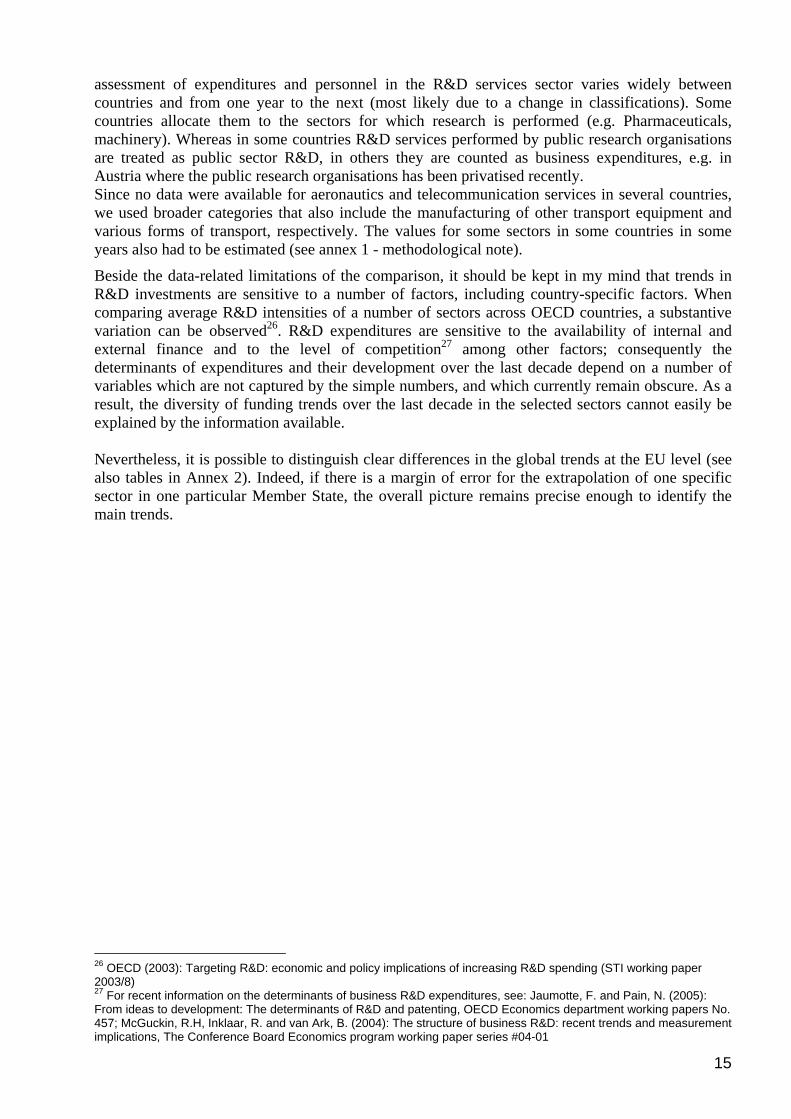
Figure 5 Trends in the number of researchers 1995-2004 by selected NACE manufacturing sectors in the EU
Researchers by Manufacturing sector EU
0,0
10000,0
20000,0
30000,0
40000,0
50000,0
60000,0
70000,0
80000,0
90000,0
100000,0
1995 1996 1997 1998 1999 2000 2001 2002 2003 2004
FTE
Food products
Chemicals
Pharmaceuticals
Fabricated metalproducts
Machinery andequipment
Office machinery andcomputers
Electrical machinery
Radio, television andcommunicationequipment Medical, precision andoptical instruments
Motor vehicles
Other transportequipment
Source: IPTS, based on Eurostat, OECD and national data Note: EU total was calculated based on the data for 19 countries (see methodological note)28 Figure 5 clearly shows that the 'manufacturing of motor vehicles' is nowadays the leading sector for employing researchers in private R&D. On the other hand, 'manufacturing of television and communication equipments', which used to be the strongest, has been declining since 2001.
28 the "other transport equipment" relates mostly to aeronautics, but includes also ships, trains and motorcycles
17
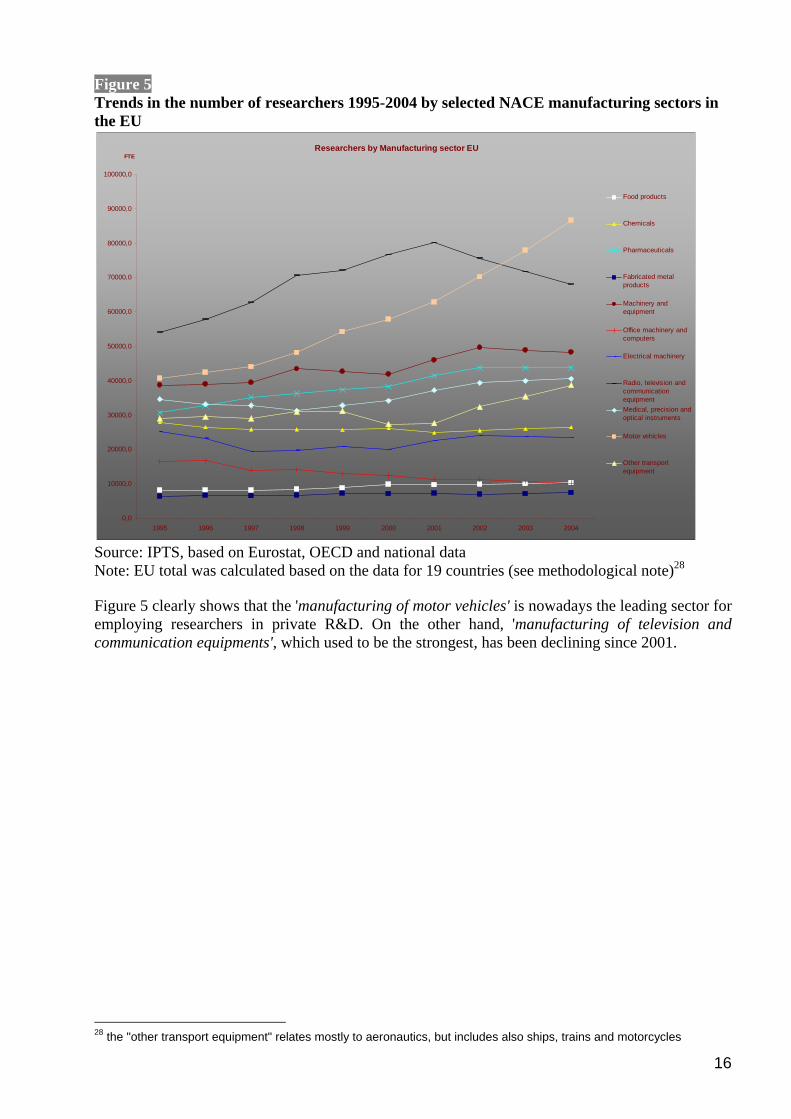
Figure 6 Trends in the number of researchers 1995-2004 by selected NACE service sectors in the EU
Researchers by services sectors
0,0
10000,0
20000,0
30000,0
40000,0
50000,0
60000,0
70000,0
1995 1996 1997 1998 1999 2000 2001 2002 2003 2004
FTE
Transport, post andtelecommunications
Computer and relatedactivities
Research and development
Other business activities
Source: IPTS, based on Eurostat, OECD and national data Note: The EU total was calculated based on the data for 19 countries (see methodological note)29 As regards the growth of researchers in the service sector, figure 6 shows that R&D in 'computer based services' has grown rapidly in recent years. If this trend continues it may overtake motor vehicle manufacturing (see Figure 5). Since this is a high added value sector, this could lead to strong exports, even if European companies offshore some of their centres of operation. The peculiar situation of the 'R&D services' sector is also worth noting as explained earlier. It is partly the result of arbitrary statistical classification schemes whereby some countries tend to reclassify companies previously in R&D services according to the sectors for which they perform contract R&D. For example, a large part of this sector in Denmark, which dropped during the 2000s in parallel to a rise in pharmaceuticals, focused on biotechnology. But, there might be also the effect of the maturing of companies that began as pure providers of R&D for other firms (thus put in the category Research and Development) then developed internal projects and ended up producing their own goods or services.
29 the "other business activities" sector includes legal activities, accountancy, consultancy, advertising, management, market research, architectural and engineering activities, technical testing and analysis, labour recruitment, security, industrial cleaning, packaging, secretarial and translation activities, photographic activities, call centres.
18
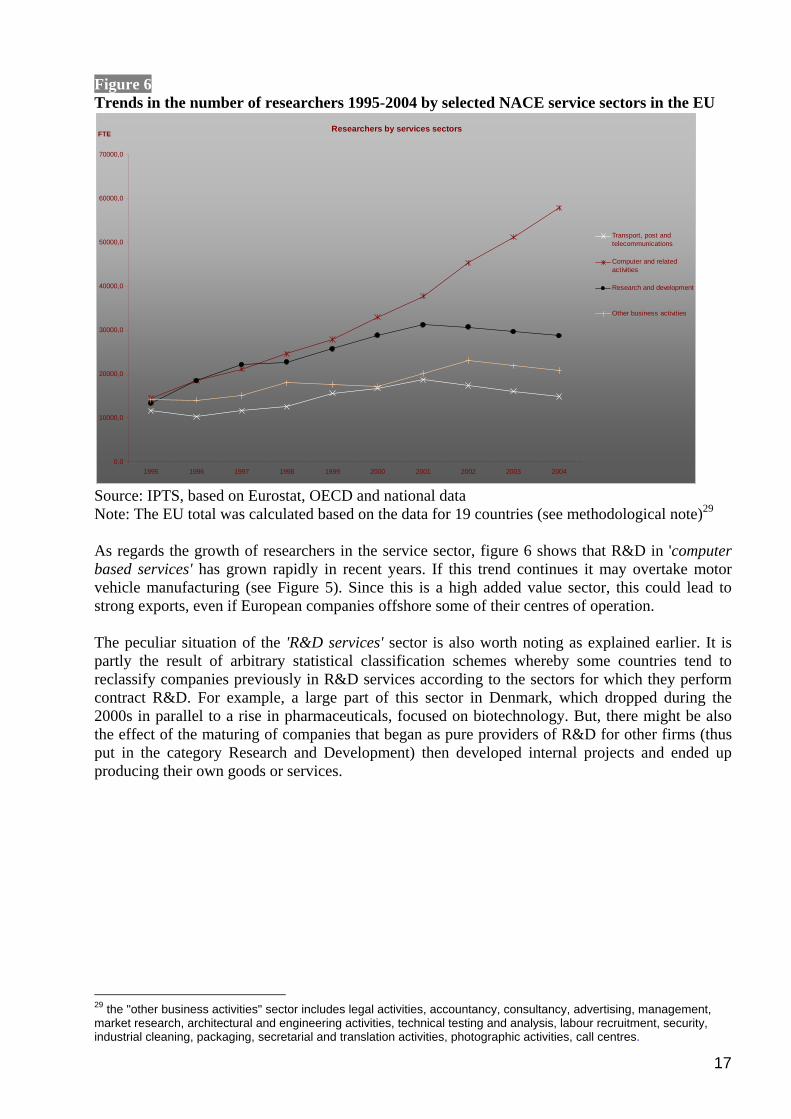
Figure 7 Trends in BERD 1995-2004 by selected NACE manufacturing sectors in the EU
BERD by Manufacturing sectors
0,0
2000,0
4000,0
6000,0
8000,0
10000,0
12000,0
14000,0
16000,0
18000,0
20000,0
1995 1996 1997 1998 1999 2000 2001 2002 2003 2004
M PPS 95 Food products
Chemicals
Pharmaceuticals
Fabricated metalproducts
Machinery andequipment
Office machinery andcomputers
Electrical machinery
Radio, television andcommunicationequipment Medical, precision andoptical instruments
Motor vehicles
Other transportequipment
Source: IPTS, based on Eurostat, OECD and national data Note: The EU total was calculated based on the data for 19 countries (see methodological note) The development of R&D expenditures shown in Figure 7 follows roughly the same trends as those for numbers of researchers, with manufacturing of motor vehicles being the key sector and with a obviously declining importance of the 'manufacturing of television and communication equipment' sector. The major exception is the 'pharmaceuticals' sector, which showed very strong growth in expenditures but not in researcher numbers.
19
Figure 8 Trends in BERD 1995-2004 by selected NACE services sectors in the EU
BERD in Services sectors
0,0
1000,0
2000,0
3000,0
4000,0
5000,0
6000,0
7000,0
1995 1996 1997 1998 1999 2000 2001 2002 2003 2004
M PPS 95
Transport, post andtelecommunications
Computer and relatedactivities
Research anddevelopment
Other businessactivities
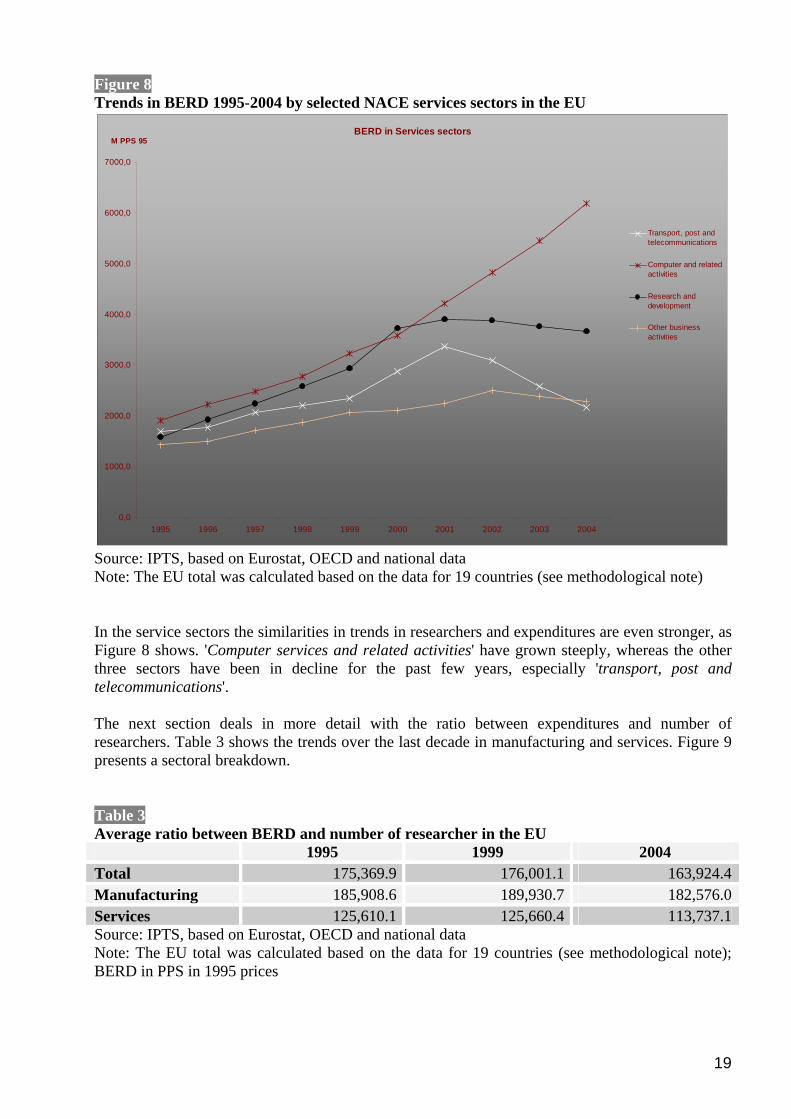
Source: IPTS, based on Eurostat, OECD and national data Note: The EU total was calculated based on the data for 19 countries (see methodological note) In the service sectors the similarities in trends in researchers and expenditures are even stronger, as Figure 8 shows. 'Computer services and related activities' have grown steeply, whereas the other three sectors have been in decline for the past few years, especially 'transport, post and telecommunications'. The next section deals in more detail with the ratio between expenditures and number of researchers. Table 3 shows the trends over the last decade in manufacturing and services. Figure 9 presents a sectoral breakdown. Table 3 Average ratio between BERD and number of researcher in the EU 1995 1999 2004 Total 175,369.9 176,001.1 163,924.4Manufacturing 185,908.6 189,930.7 182,576.0Services 125,610.1 125,660.4 113,737.1Source: IPTS, based on Eurostat, OECD and national data Note: The EU total was calculated based on the data for 19 countries (see methodological note); BERD in PPS in 1995 prices
20
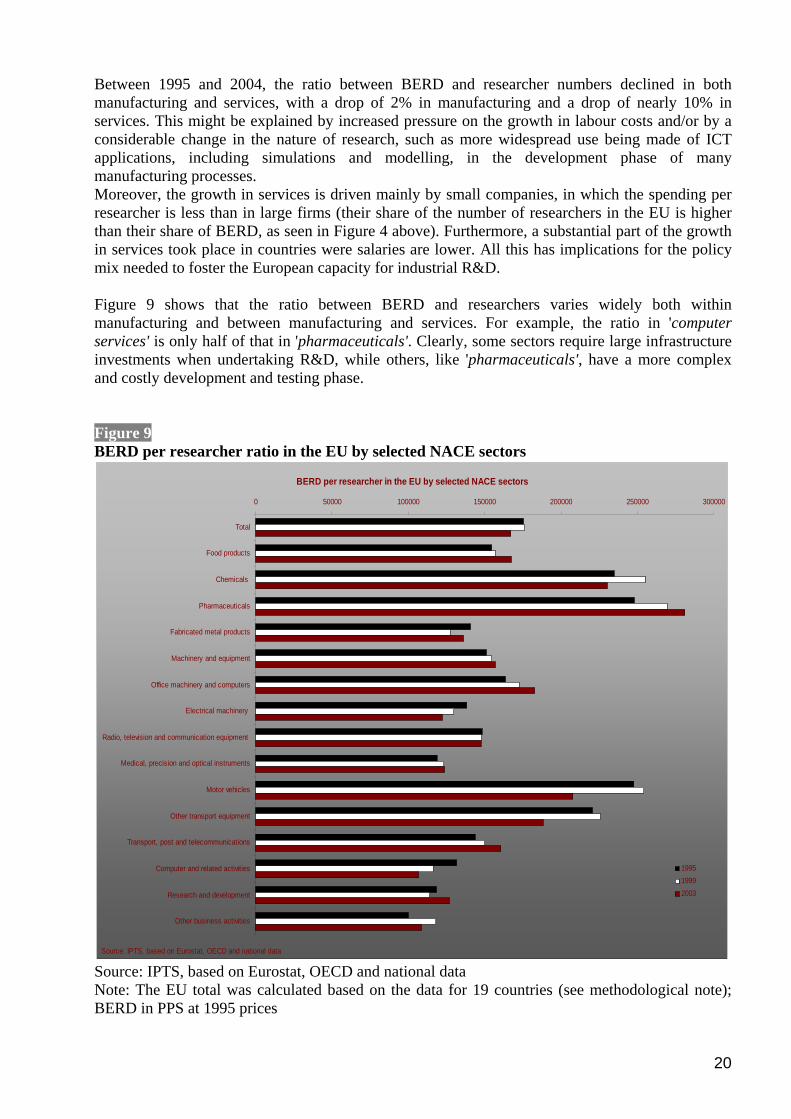
Between 1995 and 2004, the ratio between BERD and researcher numbers declined in both manufacturing and services, with a drop of 2% in manufacturing and a drop of nearly 10% in services. This might be explained by increased pressure on the growth in labour costs and/or by a considerable change in the nature of research, such as more widespread use being made of ICT applications, including simulations and modelling, in the development phase of many manufacturing processes. Moreover, the growth in services is driven mainly by small companies, in which the spending per researcher is less than in large firms (their share of the number of researchers in the EU is higher than their share of BERD, as seen in Figure 4 above). Furthermore, a substantial part of the growth in services took place in countries were salaries are lower. All this has implications for the policy mix needed to foster the European capacity for industrial R&D. Figure 9 shows that the ratio between BERD and researchers varies widely both within manufacturing and between manufacturing and services. For example, the ratio in 'computer services' is only half of that in 'pharmaceuticals'. Clearly, some sectors require large infrastructure investments when undertaking R&D, while others, like 'pharmaceuticals', have a more complex and costly development and testing phase. Figure 9 BERD per researcher ratio in the EU by selected NACE sectors
BERD per researcher in the EU by selected NACE sectors
0 50000 100000 150000 200000 250000 300000
Total
Food products
Chemicals
Pharmaceuticals
Fabricated metal products
Machinery and equipment
Office machinery and computers
Electrical machinery
Radio, television and communication equipment
Medical, precision and optical instruments
Motor vehicles
Other transport equipment
Transport, post and telecommunications
Computer and related activities
Research and development
Other business activities
Source: IPTS, based on Eurostat, OECD and national data
199519992003
Source: IPTS, based on Eurostat, OECD and national data Note: The EU total was calculated based on the data for 19 countries (see methodological note); BERD in PPS at 1995 prices
21
Besides the general variation in the ratio between expenditures and researcher numbers, Figure 9 highlights another area of diversity. While the overall cost of a researcher (or more precisely, the ratio between BERD and researcher numbers) is more or less stable in five sectors ('Chemicals', 'Machinery', 'Radio, TV and communication equipment', 'Fabricated metal products' and 'Medical and precision instruments') there is a sharp decline (more than 10%) in three sectors ('Electrical machinery', 'Motor vehicles', 'other transport equipment'). Only 'food products', 'pharmaceuticals' and 'office machinery' and 'telecommunications' in the services sectors showed constant growth in the ratio between BERD and numbers of researchers. In the case of the 'motor vehicles' sector, which is the main contributor to R&D in manufacturing, the growth in researcher numbers was 20% higher than growth in expenditures (see Figures 5 and 7). This probably reflects a genuine transition in the type of R&D performed in classical manufacturing towards a model that is increasingly based on more intensive use of ICTs (for instance computer modelling). This might be supported by the fact that in recent years there has been a shift within total R&D personnel towards a higher proportion of researchers30. This can be observed across the countries where manufacturing of motor vehicles accounts for a significant share of industrial R&D and in other sectors in which there was an apparent decline in the overall spending per researcher (data not shown). On the other hand, the explanation seems to be different in the case of services. First, there was a drop in the ratio observed in three out of the four sectors that are part of this analysis. Moreover there is no obvious trend in the shift between different categories of personnel in the countries where these sectors are the more developed (data not shown here). On the other hand, the ratio between expenditures and researchers varies substantially between countries. Also, this growth was often higher in countries where the ratio is smaller. The shift in geographical distribution goes some way towards explaining the decoupling of the growth rates of expenditures and researcher numbers. This leads to an interesting question as to the comparative advantage of service sector R&D systems, which seem to be more flexible than manufacturing ones in terms of their location.
3.3 The diversity of situations in the EU Member States This section deals with the dynamics of BERD across the EU Member States. The section looks in particular at the national dynamics since the adoption of the Lisbon strategy in 2000, the different dynamics of manufacturing BERD and service BERD, also with regard to expenditures per researcher and finally explores the relative weights of Member States within Europe with respect to researchers and expenditures. The data used are mainly from EUROSTAT. There is a wide variety of situation among the 25 Member States, concerning not only R&D but also other structural indicators31. This is not only due to their sizes but also to historical factors and past choices made by governments in terms of both R&D and industrial policies. The difference can be measured along two axes: the current position vis-à-vis the EU average; and the recent trends in industrial R&D expenditures, notably since the adoption of the Lisbon strategy. This is shown in the graph below.
30 Based on available EUROSTAT data (scientific and non-scientific R&D personnel) 31 See, for example, the relevant EU structural indicators at http://forum.europa.eu.int/Public/irc/dsis/structind/library?l=/general_information/annual_synthesis&vm=detailed&sb=Title
22
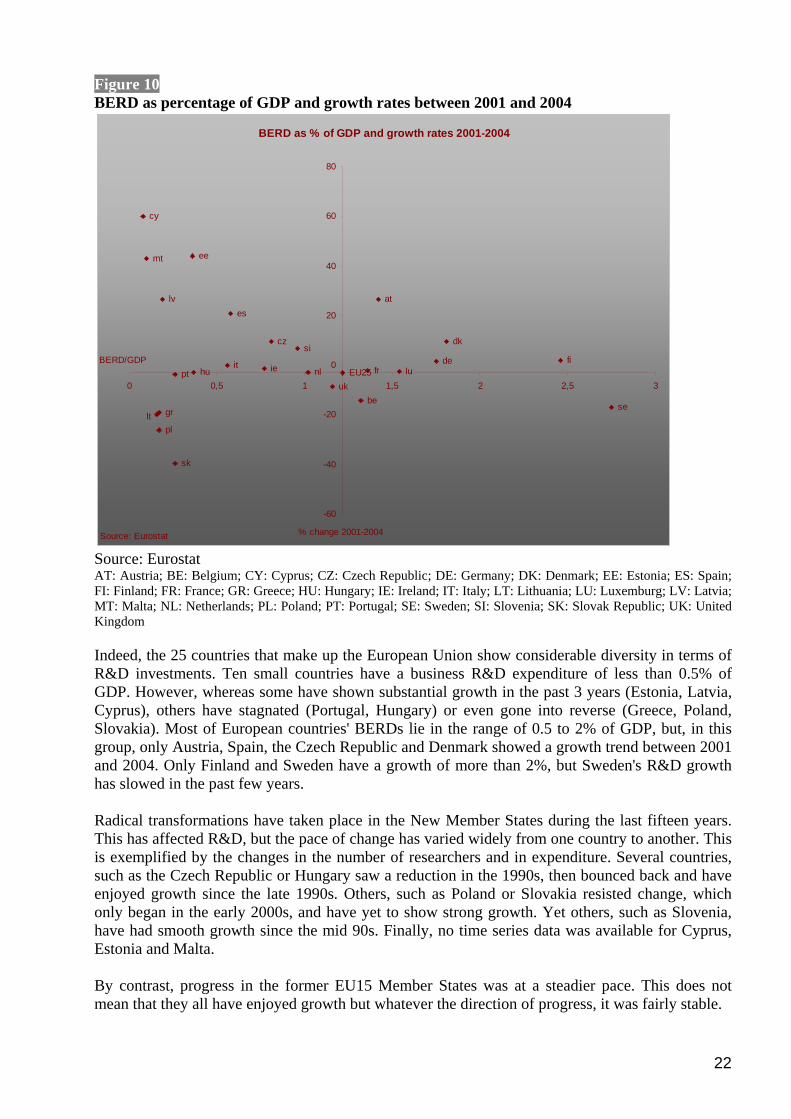
Figure 10 BERD as percentage of GDP and growth rates between 2001 and 2004
BERD as % of GDP and growth rates 2001-2004
cy
mt ee
lv
pt hu
lt gr
pl
sk
it
es
cz
ie nl
at
dk
EU25uk
be
fr lude fi
se
si
-60
-40
-20
0
20
40
60
80
0 0,5 1 1,5 2 2,5 3
BERD/GDP
% change 2001-2004Source: Eurostat Source: Eurostat AT: Austria; BE: Belgium; CY: Cyprus; CZ: Czech Republic; DE: Germany; DK: Denmark; EE: Estonia; ES: Spain; FI: Finland; FR: France; GR: Greece; HU: Hungary; IE: Ireland; IT: Italy; LT: Lithuania; LU: Luxemburg; LV: Latvia; MT: Malta; NL: Netherlands; PL: Poland; PT: Portugal; SE: Sweden; SI: Slovenia; SK: Slovak Republic; UK: United Kingdom Indeed, the 25 countries that make up the European Union show considerable diversity in terms of R&D investments. Ten small countries have a business R&D expenditure of less than 0.5% of GDP. However, whereas some have shown substantial growth in the past 3 years (Estonia, Latvia, Cyprus), others have stagnated (Portugal, Hungary) or even gone into reverse (Greece, Poland, Slovakia). Most of European countries' BERDs lie in the range of 0.5 to 2% of GDP, but, in this group, only Austria, Spain, the Czech Republic and Denmark showed a growth trend between 2001 and 2004. Only Finland and Sweden have a growth of more than 2%, but Sweden's R&D growth has slowed in the past few years. Radical transformations have taken place in the New Member States during the last fifteen years. This has affected R&D, but the pace of change has varied widely from one country to another. This is exemplified by the changes in the number of researchers and in expenditure. Several countries, such as the Czech Republic or Hungary saw a reduction in the 1990s, then bounced back and have enjoyed growth since the late 1990s. Others, such as Poland or Slovakia resisted change, which only began in the early 2000s, and have yet to show strong growth. Yet others, such as Slovenia, have had smooth growth since the mid 90s. Finally, no time series data was available for Cyprus, Estonia and Malta. By contrast, progress in the former EU15 Member States was at a steadier pace. This does not mean that they all have enjoyed growth but whatever the direction of progress, it was fairly stable.
23
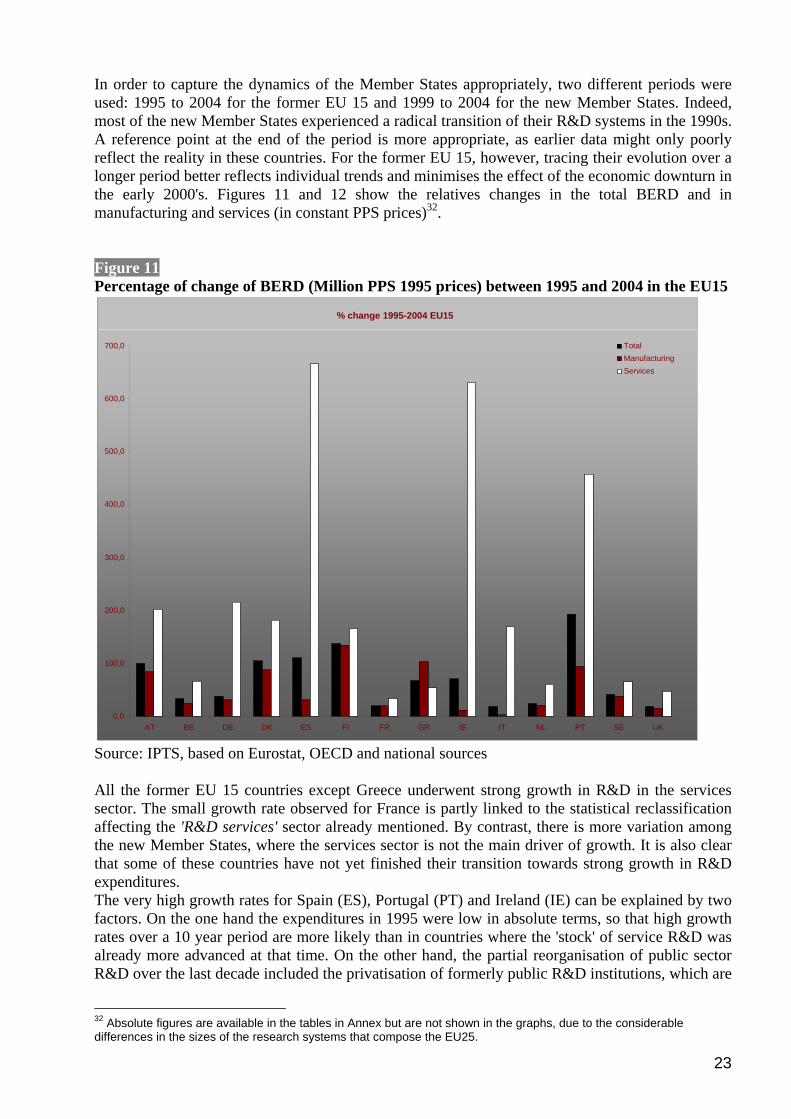
In order to capture the dynamics of the Member States appropriately, two different periods were used: 1995 to 2004 for the former EU 15 and 1999 to 2004 for the new Member States. Indeed, most of the new Member States experienced a radical transition of their R&D systems in the 1990s. A reference point at the end of the period is more appropriate, as earlier data might only poorly reflect the reality in these countries. For the former EU 15, however, tracing their evolution over a longer period better reflects individual trends and minimises the effect of the economic downturn in the early 2000's. Figures 11 and 12 show the relatives changes in the total BERD and in manufacturing and services (in constant PPS prices)32. Figure 11 Percentage of change of BERD (Million PPS 1995 prices) between 1995 and 2004 in the EU15
Source: IPTS, based on Eurostat, OECD and national sources All the former EU 15 countries except Greece underwent strong growth in R&D in the services sector. The small growth rate observed for France is partly linked to the statistical reclassification affecting the 'R&D services' sector already mentioned. By contrast, there is more variation among the new Member States, where the services sector is not the main driver of growth. It is also clear that some of these countries have not yet finished their transition towards strong growth in R&D expenditures. The very high growth rates for Spain (ES), Portugal (PT) and Ireland (IE) can be explained by two factors. On the one hand the expenditures in 1995 were low in absolute terms, so that high growth rates over a 10 year period are more likely than in countries where the 'stock' of service R&D was already more advanced at that time. On the other hand, the partial reorganisation of public sector R&D over the last decade included the privatisation of formerly public R&D institutions, which are
32 Absolute figures are available in the tables in Annex but are not shown in the graphs, due to the considerable differences in the sizes of the research systems that compose the EU25.
% change 1995-2004 EU15
0,0
100,0
200,0
300,0
400,0
500,0
600,0
700,0
AT BE DE DK ES FI FR GR IE IT NL PT SE UK
TotalManufacturingServices
24
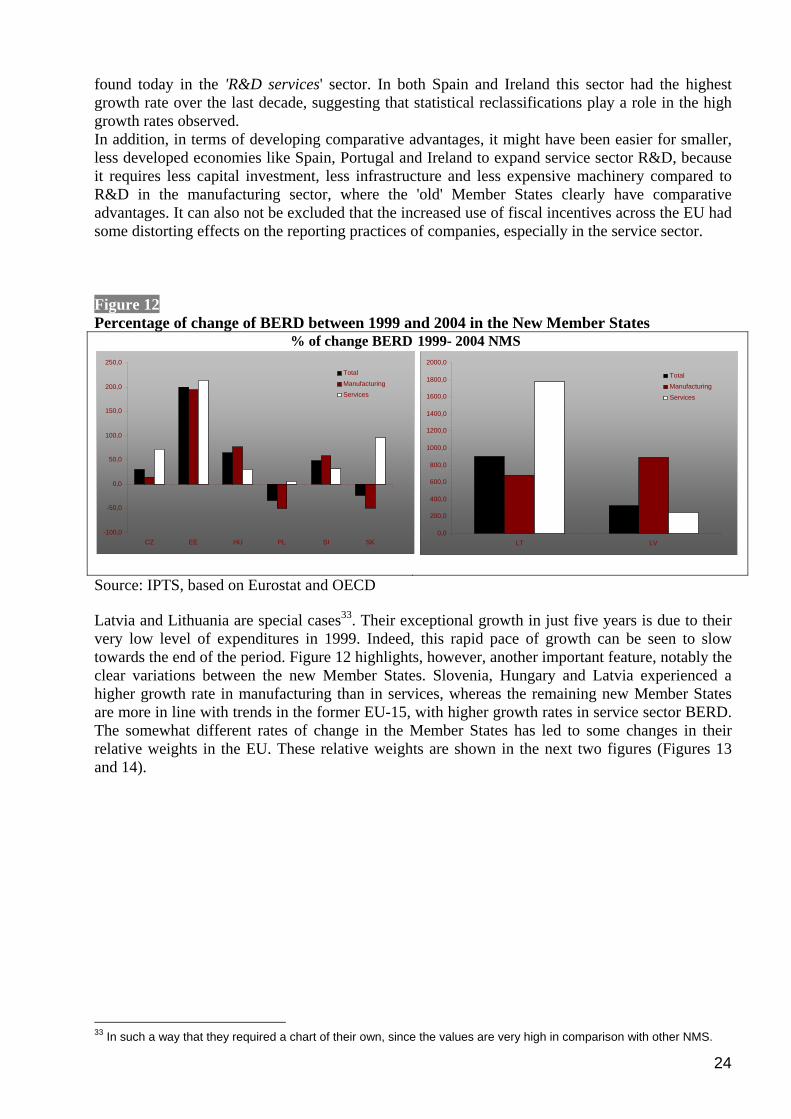
found today in the 'R&D services' sector. In both Spain and Ireland this sector had the highest growth rate over the last decade, suggesting that statistical reclassifications play a role in the high growth rates observed. In addition, in terms of developing comparative advantages, it might have been easier for smaller, less developed economies like Spain, Portugal and Ireland to expand service sector R&D, because it requires less capital investment, less infrastructure and less expensive machinery compared to R&D in the manufacturing sector, where the 'old' Member States clearly have comparative advantages. It can also not be excluded that the increased use of fiscal incentives across the EU had some distorting effects on the reporting practices of companies, especially in the service sector. Figure 12 Percentage of change of BERD between 1999 and 2004 in the New Member States
% of change BERD
1999- 2004 NMS
Source: IPTS, based on Eurostat and OECD Latvia and Lithuania are special cases33. Their exceptional growth in just five years is due to their very low level of expenditures in 1999. Indeed, this rapid pace of growth can be seen to slow towards the end of the period. Figure 12 highlights, however, another important feature, notably the clear variations between the new Member States. Slovenia, Hungary and Latvia experienced a higher growth rate in manufacturing than in services, whereas the remaining new Member States are more in line with trends in the former EU-15, with higher growth rates in service sector BERD. The somewhat different rates of change in the Member States has led to some changes in their relative weights in the EU. These relative weights are shown in the next two figures (Figures 13 and 14).
33 In such a way that they required a chart of their own, since the values are very high in comparison with other NMS.
-100,0 -50,0
0,0 50,0
100,0 150,0 200,0 250,0
CZ EE HU PL SI SK
TotalManufacturingServices
0,0
200,0
400,0
600,0
800,0
1000,0
1200,0
1400,0
1600,0
1800,0
2000,0
LT LV
TotalManufacturing
Services
25
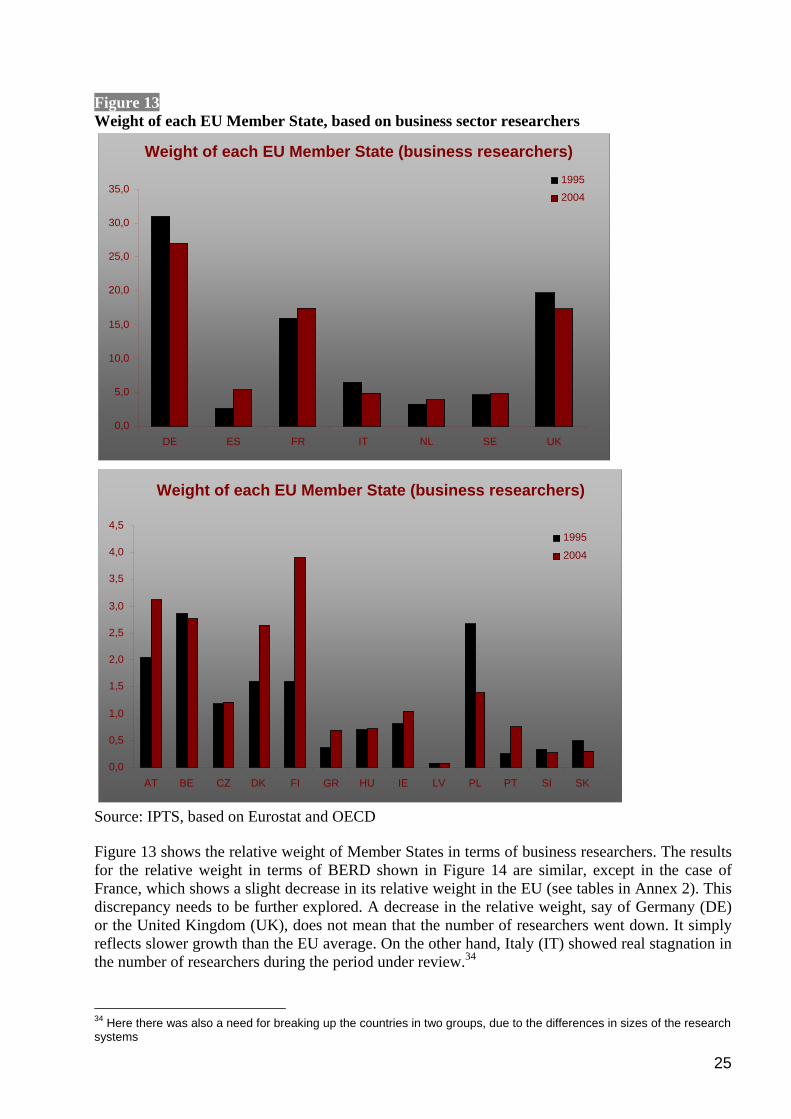
Figure 13 Weight of each EU Member State, based on business sector researchers
Source: IPTS, based on Eurostat and OECD Figure 13 shows the relative weight of Member States in terms of business researchers. The results for the relative weight in terms of BERD shown in Figure 14 are similar, except in the case of France, which shows a slight decrease in its relative weight in the EU (see tables in Annex 2). This discrepancy needs to be further explored. A decrease in the relative weight, say of Germany (DE) or the United Kingdom (UK), does not mean that the number of researchers went down. It simply reflects slower growth than the EU average. On the other hand, Italy (IT) showed real stagnation in the number of researchers during the period under review.34
34 Here there was also a need for breaking up the countries in two groups, due to the differences in sizes of the research systems
Weight of each EU Member State (business researchers)
0,0
5,0
10,0
15,0
20,0
25,0
30,0
35,0
DE ES FR IT NL SE UK
1995 2004
Weight of each EU Member State (business researchers)
0,0
0,5
1,0
1,5
2,0
2,5
3,0
3,5
4,0
4,5
AT BE CZ DK FI GR HU IE LV PL PT SI SK
1995 2004

26
Given Italy's stagnation and Spain's rapid growth, Spain now has more researchers in the private sector than Italy. Italy still leads on BERD, however, because of the difference in industrial structure. Spain's recent efforts have been concentrated in the services sector (in particular in 'R&D services') for which the ratio between expenditures and researchers is higher.
27
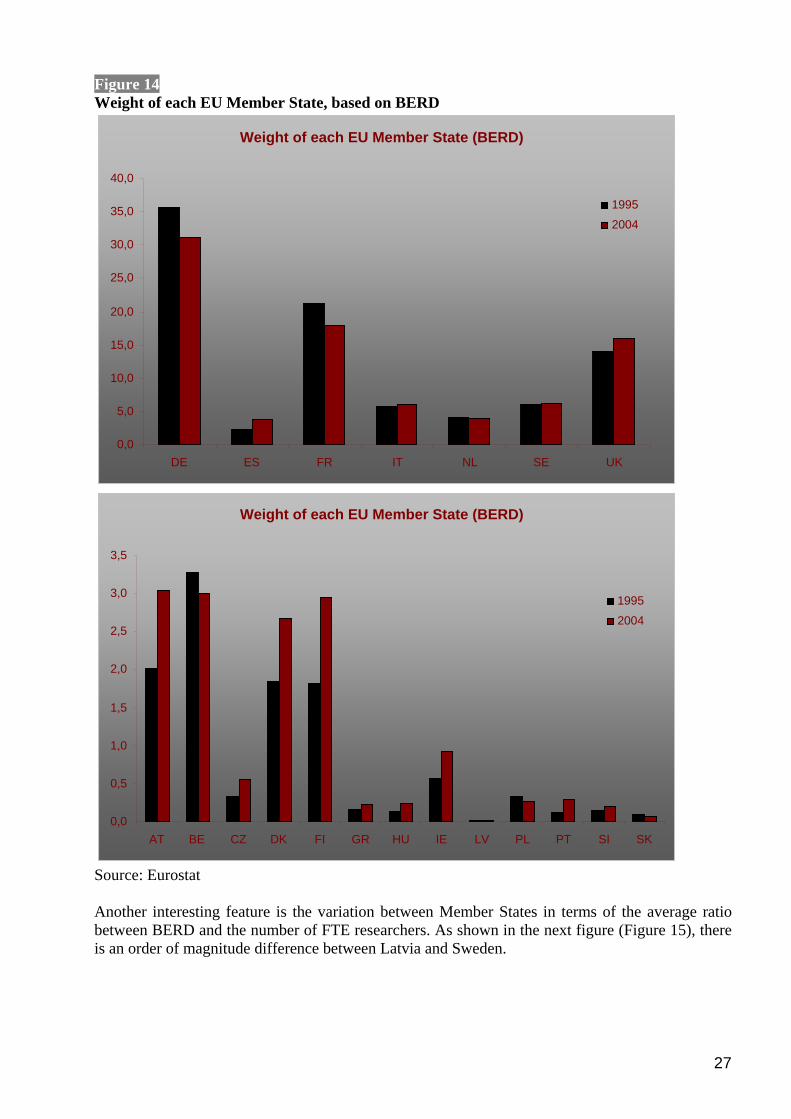
Figure 14 Weight of each EU Member State, based on BERD
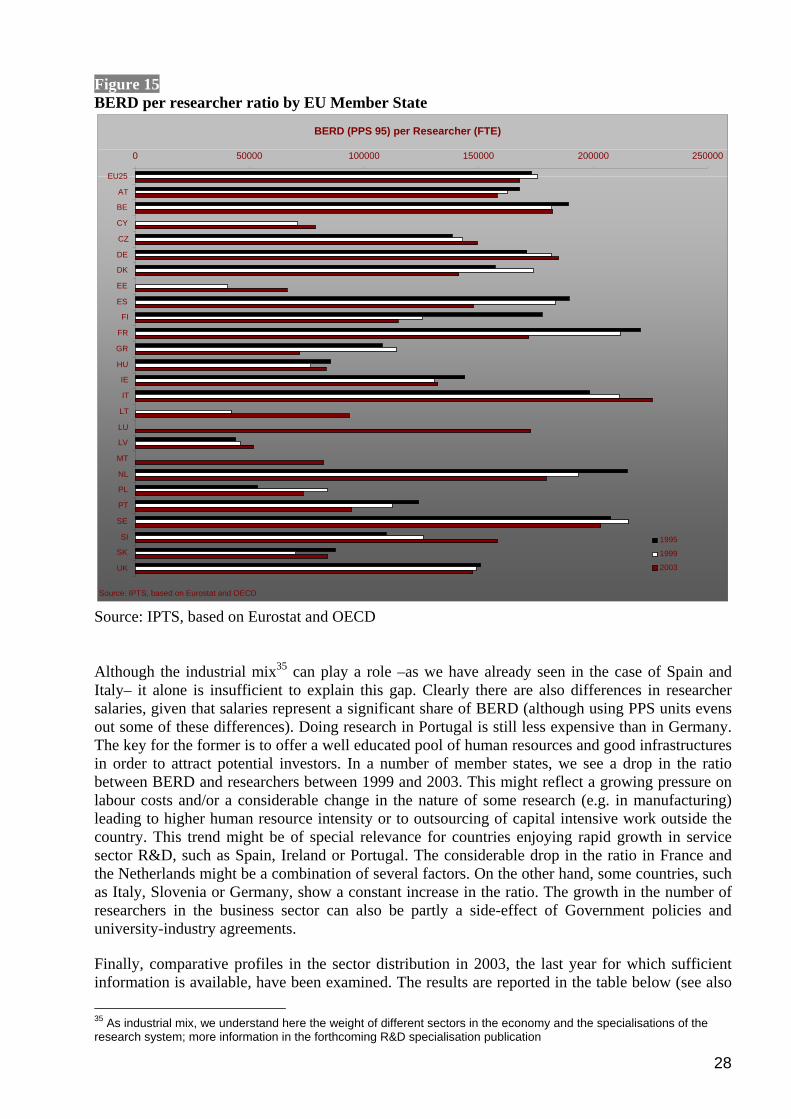
Source: Eurostat Another interesting feature is the variation between Member States in terms of the average ratio between BERD and the number of FTE researchers. As shown in the next figure (Figure 15), there is an order of magnitude difference between Latvia and Sweden.
Weight of each EU Member State (BERD)
0,0
5,0
10,0
15,0
20,0
25,0
30,0
35,0
40,0
DE ES FR IT NL SE UK
1995 2004
Weight of each EU Member State (BERD)
0,0
0,5
1,0
1,5
2,0
2,5
3,0
3,5
AT BE CZ DK FI GR HU IE LV PL PT SI SK
1995 2004
28
Figure 15 BERD per researcher ratio by EU Member State
Source: IPTS, based on Eurostat and OECD Although the industrial mix35 can play a role –as we have already seen in the case of Spain and Italy– it alone is insufficient to explain this gap. Clearly there are also differences in researcher salaries, given that salaries represent a significant share of BERD (although using PPS units evens out some of these differences). Doing research in Portugal is still less expensive than in Germany. The key for the former is to offer a well educated pool of human resources and good infrastructures in order to attract potential investors. In a number of member states, we see a drop in the ratio between BERD and researchers between 1999 and 2003. This might reflect a growing pressure on labour costs and/or a considerable change in the nature of some research (e.g. in manufacturing) leading to higher human resource intensity or to outsourcing of capital intensive work outside the country. This trend might be of special relevance for countries enjoying rapid growth in service sector R&D, such as Spain, Ireland or Portugal. The considerable drop in the ratio in France and the Netherlands might be a combination of several factors. On the other hand, some countries, such as Italy, Slovenia or Germany, show a constant increase in the ratio. The growth in the number of researchers in the business sector can also be partly a side-effect of Government policies and university-industry agreements. Finally, comparative profiles in the sector distribution in 2003, the last year for which sufficient information is available, have been examined. The results are reported in the table below (see also 35 As industrial mix, we understand here the weight of different sectors in the economy and the specialisations of the research system; more information in the forthcoming R&D specialisation publication
BERD (PPS 95) per Researcher (FTE)
0 50000 100000 150000 200000 250000
EU25
AT
BE CY CZ DE DK EE ES
FI
FR
GR HU IE
IT
LT
LU LV
MT NL PL
PT
SE SI
SK UK
Source: IPTS, based on Eurostat and OECD
1995
1999
2003

29
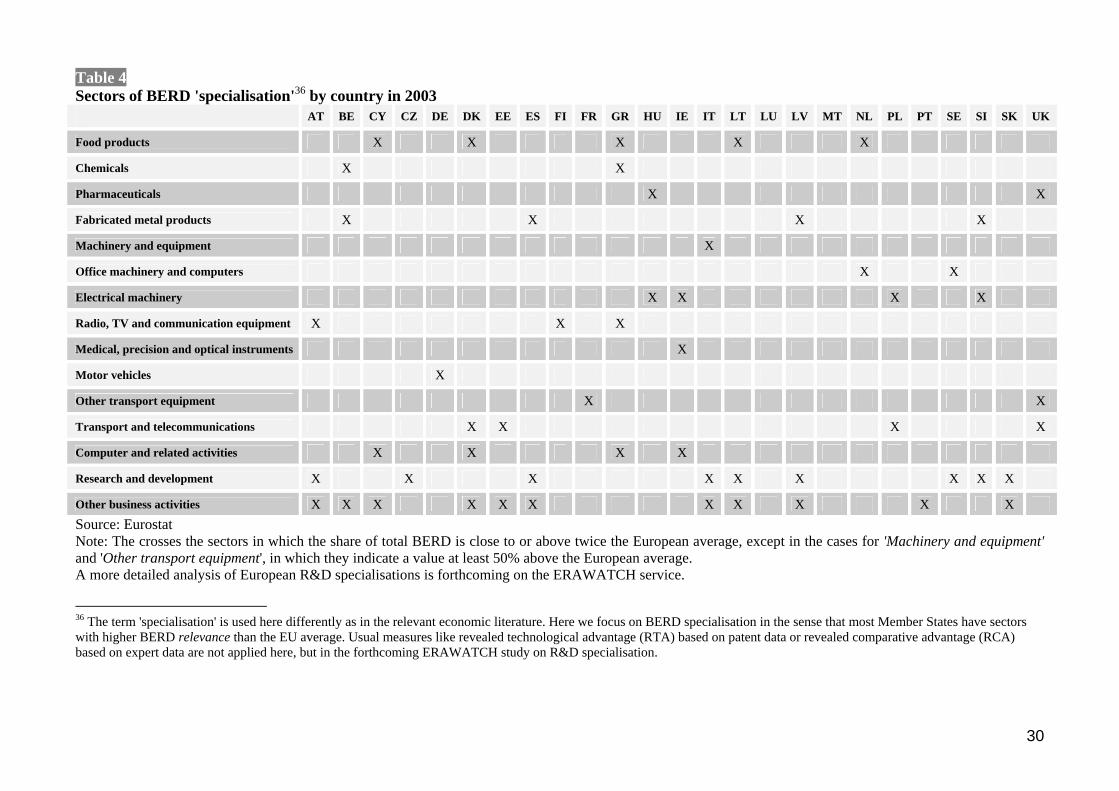
annex 2 for more information) The table should be interpreted as follows: sector's which account for a significant portion of a country's total national BERD, i.e. about twice the EU average, are marked with a cross (in the cell at the intersection of the country column and sector row). For example, on the EU level, the R&D services sector represents 4.5% of BERD, in Austria, however, it has greater significance as it accounts for 9.2 % of BERD. The only two exceptions are the sectors 'machinery and equipment' and 'other 'transport equipment' sectors, where we set the threshold at only 50% more than the EU average, as otherwise no specialisation could be observed. This table shows that every Member State has some sectors which seem to play a much more important role in BERD nationally than in the EU average. It is also likely to be possible to identify the national champions which are responsible for the high relevance of these sectors with the help of the EU Scoreboard. Except for 'motor vehicles', which is clearly dominated by Germany, all other sectors have several countries for which the national importance for BERD is considerably higher than the EU average.
30
Table 4 Sectors of BERD 'specialisation'36 by country in 2003
AT BE CY CZ DE DK EE ES FI FR GR HU IE IT LT LU LV MT NL PL PT SE SI SK UK
Food products X X X X X
Chemicals X X
Pharmaceuticals X X
Fabricated metal products X X X X
Machinery and equipment X
Office machinery and computers X X
Electrical machinery X X X X
Radio, TV and communication equipment X X X
Medical, precision and optical instruments X
Motor vehicles X
Other transport equipment X X
Transport and telecommunications X X X X
Computer and related activities X X X X
Research and development X X X X X X X X X
Other business activities X X X X X X X X X X X Source: Eurostat Note: The crosses the sectors in which the share of total BERD is close to or above twice the European average, except in the cases for 'Machinery and equipment' and 'Other transport equipment', in which they indicate a value at least 50% above the European average. A more detailed analysis of European R&D specialisations is forthcoming on the ERAWATCH service.
36 The term 'specialisation' is used here differently as in the relevant economic literature. Here we focus on BERD specialisation in the sense that most Member States have sectors with higher BERD relevance than the EU average. Usual measures like revealed technological advantage (RTA) based on patent data or revealed comparative advantage (RCA) based on expert data are not applied here, but in the forthcoming ERAWATCH study on R&D specialisation.
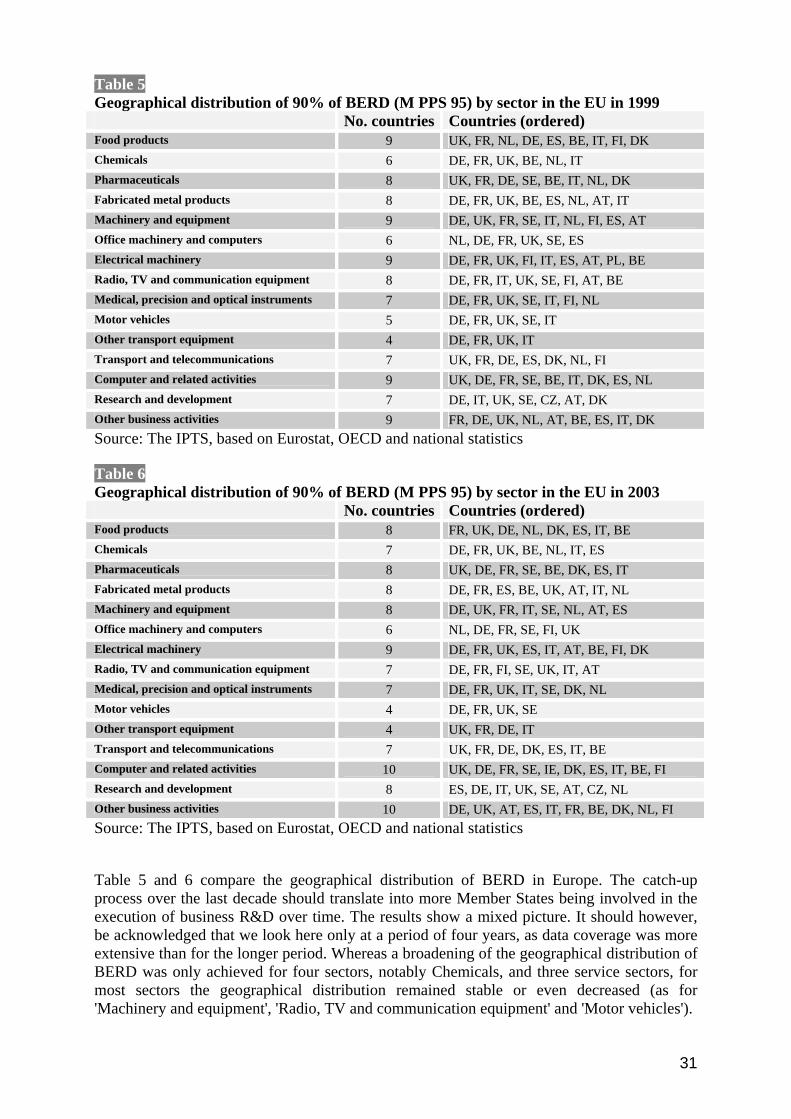
31
Table 5 Geographical distribution of 90% of BERD (M PPS 95) by sector in the EU in 1999 No. countries Countries (ordered) Food products 9 UK, FR, NL, DE, ES, BE, IT, FI, DK Chemicals 6 DE, FR, UK, BE, NL, IT Pharmaceuticals 8 UK, FR, DE, SE, BE, IT, NL, DK Fabricated metal products 8 DE, FR, UK, BE, ES, NL, AT, IT Machinery and equipment 9 DE, UK, FR, SE, IT, NL, FI, ES, AT Office machinery and computers 6 NL, DE, FR, UK, SE, ES Electrical machinery 9 DE, FR, UK, FI, IT, ES, AT, PL, BE Radio, TV and communication equipment 8 DE, FR, IT, UK, SE, FI, AT, BE Medical, precision and optical instruments 7 DE, FR, UK, SE, IT, FI, NL Motor vehicles 5 DE, FR, UK, SE, IT Other transport equipment 4 DE, FR, UK, IT Transport and telecommunications 7 UK, FR, DE, ES, DK, NL, FI Computer and related activities 9 UK, DE, FR, SE, BE, IT, DK, ES, NL Research and development 7 DE, IT, UK, SE, CZ, AT, DK Other business activities 9 FR, DE, UK, NL, AT, BE, ES, IT, DK Source: The IPTS, based on Eurostat, OECD and national statistics Table 6 Geographical distribution of 90% of BERD (M PPS 95) by sector in the EU in 2003 No. countries Countries (ordered) Food products 8 FR, UK, DE, NL, DK, ES, IT, BE Chemicals 7 DE, FR, UK, BE, NL, IT, ES Pharmaceuticals 8 UK, DE, FR, SE, BE, DK, ES, IT Fabricated metal products 8 DE, FR, ES, BE, UK, AT, IT, NL Machinery and equipment 8 DE, UK, FR, IT, SE, NL, AT, ES Office machinery and computers 6 NL, DE, FR, SE, FI, UK Electrical machinery 9 DE, FR, UK, ES, IT, AT, BE, FI, DK Radio, TV and communication equipment 7 DE, FR, FI, SE, UK, IT, AT Medical, precision and optical instruments 7 DE, FR, UK, IT, SE, DK, NL Motor vehicles 4 DE, FR, UK, SE Other transport equipment 4 UK, FR, DE, IT Transport and telecommunications 7 UK, FR, DE, DK, ES, IT, BE Computer and related activities 10 UK, DE, FR, SE, IE, DK, ES, IT, BE, FI Research and development 8 ES, DE, IT, UK, SE, AT, CZ, NL Other business activities 10 DE, UK, AT, ES, IT, FR, BE, DK, NL, FI Source: The IPTS, based on Eurostat, OECD and national statistics Table 5 and 6 compare the geographical distribution of BERD in Europe. The catch-up process over the last decade should translate into more Member States being involved in the execution of business R&D over time. The results show a mixed picture. It should however, be acknowledged that we look here only at a period of four years, as data coverage was more extensive than for the longer period. Whereas a broadening of the geographical distribution of BERD was only achieved for four sectors, notably Chemicals, and three service sectors, for most sectors the geographical distribution remained stable or even decreased (as for 'Machinery and equipment', 'Radio, TV and communication equipment' and 'Motor vehicles').

32
For manufacturing, Germany is the main player - except for pharmaceuticals and other transport equipment (which corresponds mainly to aeronautics), where the UK is the main player. For the service sectors, the very good position of Spain in the same area reflects the capacity of its firms to work under contractual arrangements for other companies, possibly from outside the country.
33
Chapter 4 Trends in the public funding of private R&D This chapter deals with the direct public support of private sector R&D (GBERD), i.e. the public funds spent on business R&D. Public policy uses a variety of instruments to leverage private R&D. However, measuring the effects and the impacts of these instruments has proven to be very difficult. The most obvious instrument used by Member States to support business R&D is the direct funding of BERD by government, the so called GBERD. It should be noted, however, that the direct funding of private R&D is increasingly being replaced in a number of Member States by indirect measures, notably tax incentives. The OECD recently presented an overview showing that –particularly in smaller economies– tax incentives make up a considerable fraction of all government support to business R&D – often exceeding direct government funding37. However, as tax incentives are not targeted on specific sectors, an analysis of GBERD data still provides useful information about the sectoral priorities of public action. However, the expenditures actually measured no longer correspond to the real public support for private R&D. Governments usually use competitive R&D programmes, for the direct funding of private R&D, requiring that applicant companies cooperate with public research activities, either in universities or other public research organisations. Cooperation programmes are often directed towards the needs of SMEs. Another frequently used instrument, in particular for defence-related research, is contract research, whereby governments buy research services from a company. Here, no formal cooperation with public research is required. As regards the direct funding of private sector R&D, information is available on both the sectors benefiting most from public support and on the relative importance of this support as a percentage of business expenditures on R&D (BERD) in the respective sectors. Over the last two decades, the relative weight of public funds for BERD has declined constantly38, reflecting on the one hand (at least for Europe) the declining importance of defence-related research and on the other a change in the governance of public R&D. Two changes should be mentioned here: a shift towards more technology-oriented and less sector-oriented R&D policy39 on the one hand and the substitution of direct funds with indirect, tax incentives schemes mentioned earlier, on the other.
37 OECD (2006): OECD Science, technology and industry outlook 2006 38 OECD (2002): STI Review – Special issue on new Science and technology Indicators, pp 147-181 39 See also: Dosi, G.; llerena, P.; Labini, M.S.: Evaluating and comparing the innovation performance of the United States and the European Union; Expert report for the TrendChart Policy workshop 2005
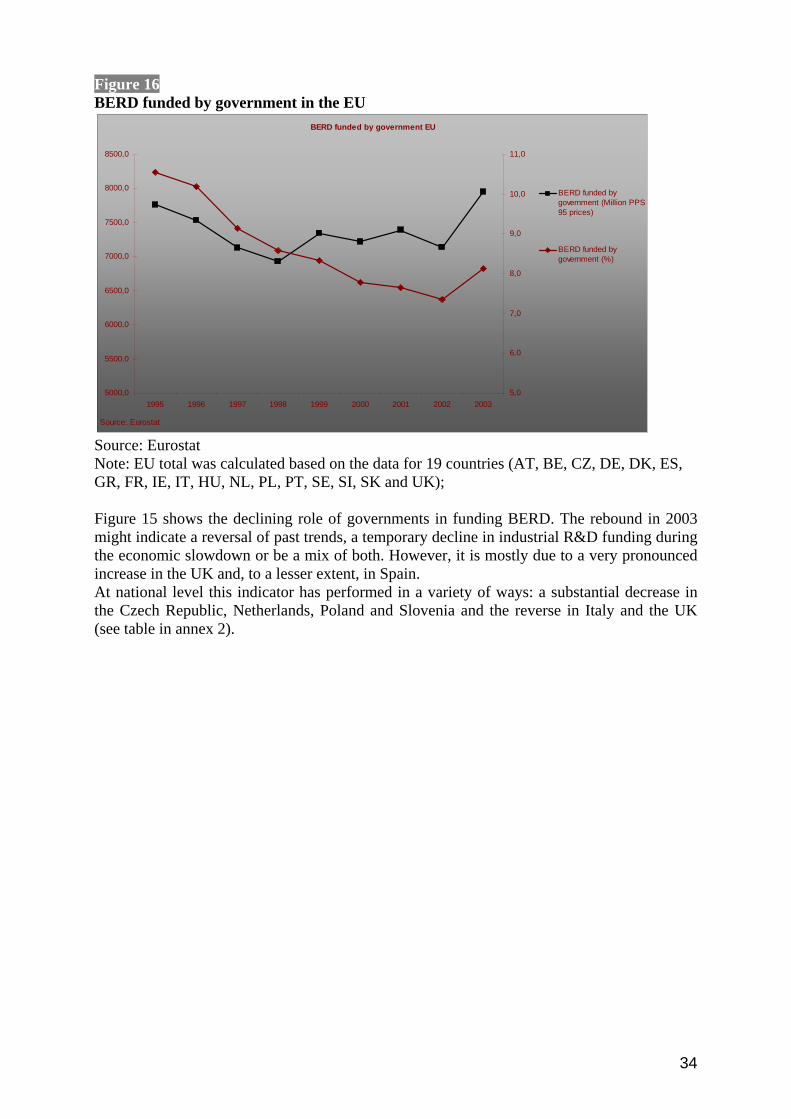
34
Figure 16 BERD funded by government in the EU
BERD funded by government EU
5000,0
5500,0
6000,0
6500,0
7000,0
7500,0
8000,0
8500,0
1995 1996 1997 1998 1999 2000 2001 2002 2003
Source: Eurostat
5,0
6,0
7,0
8,0
9,0
10,0
11,0
BERD funded bygovernment (Million PPS95 prices)
BERD funded bygovernment (%)
Source: Eurostat Note: EU total was calculated based on the data for 19 countries (AT, BE, CZ, DE, DK, ES, GR, FR, IE, IT, HU, NL, PL, PT, SE, SI, SK and UK); Figure 15 shows the declining role of governments in funding BERD. The rebound in 2003 might indicate a reversal of past trends, a temporary decline in industrial R&D funding during the economic slowdown or be a mix of both. However, it is mostly due to a very pronounced increase in the UK and, to a lesser extent, in Spain. At national level this indicator has performed in a variety of ways: a substantial decrease in the Czech Republic, Netherlands, Poland and Slovenia and the reverse in Italy and the UK (see table in annex 2).
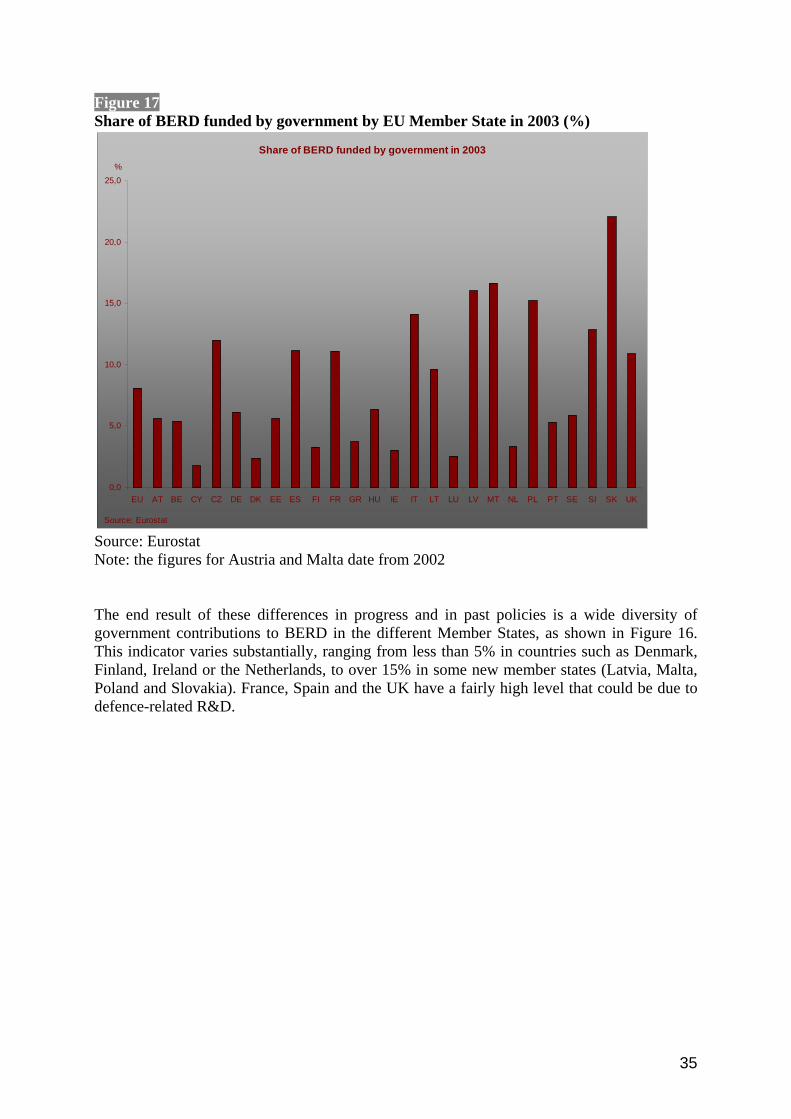
35
Figure 17 Share of BERD funded by government by EU Member State in 2003 (%)
Share of BERD funded by government in 2003
0,0
5,0
10,0
15,0
20,0
25,0
EU AT BE CY CZ DE DK EE ES FI FR GR HU IE IT LT LU LV MT NL PL PT SE SI SK UK
Source: Eurostat
%
Source: Eurostat Note: the figures for Austria and Malta date from 2002 The end result of these differences in progress and in past policies is a wide diversity of government contributions to BERD in the different Member States, as shown in Figure 16. This indicator varies substantially, ranging from less than 5% in countries such as Denmark, Finland, Ireland or the Netherlands, to over 15% in some new member states (Latvia, Malta, Poland and Slovakia). France, Spain and the UK have a fairly high level that could be due to defence-related R&D.
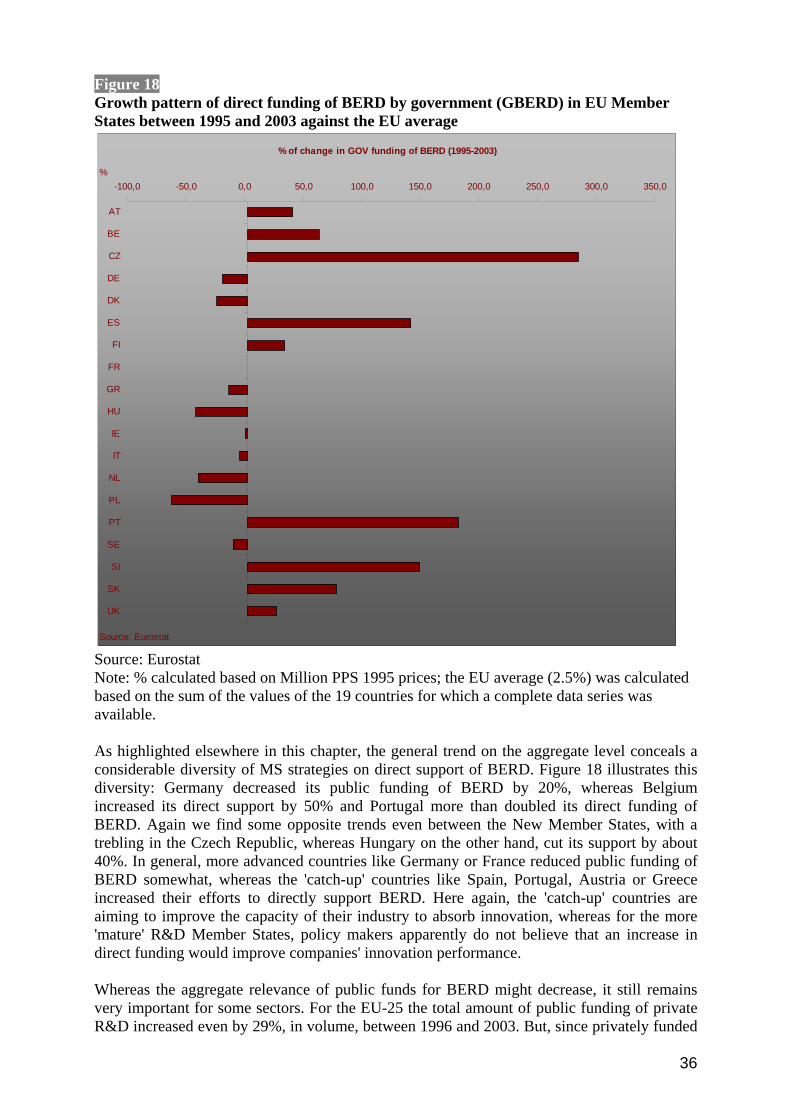
36
Figure 18 Growth pattern of direct funding of BERD by government (GBERD) in EU Member States between 1995 and 2003 against the EU average
% of change in GOV funding of BERD (1995-2003)
-100,0 -50,0 0,0 50,0 100,0 150,0 200,0 250,0 300,0 350,0
AT
BE
CZ
DE
DK
ES
FI
FR
GR
HU
IE
IT
NL
PL
PT
SE
SI
SK
UK
%
Source: Eurostat Source: Eurostat Note: % calculated based on Million PPS 1995 prices; the EU average (2.5%) was calculated based on the sum of the values of the 19 countries for which a complete data series was available. As highlighted elsewhere in this chapter, the general trend on the aggregate level conceals a considerable diversity of MS strategies on direct support of BERD. Figure 18 illustrates this diversity: Germany decreased its public funding of BERD by 20%, whereas Belgium increased its direct support by 50% and Portugal more than doubled its direct funding of BERD. Again we find some opposite trends even between the New Member States, with a trebling in the Czech Republic, whereas Hungary on the other hand, cut its support by about 40%. In general, more advanced countries like Germany or France reduced public funding of BERD somewhat, whereas the 'catch-up' countries like Spain, Portugal, Austria or Greece increased their efforts to directly support BERD. Here again, the 'catch-up' countries are aiming to improve the capacity of their industry to absorb innovation, whereas for the more 'mature' R&D Member States, policy makers apparently do not believe that an increase in direct funding would improve companies' innovation performance. Whereas the aggregate relevance of public funds for BERD might decrease, it still remains very important for some sectors. For the EU-25 the total amount of public funding of private R&D increased even by 29%, in volume, between 1996 and 2003. But, since privately funded

37
BERD grew faster than public R&D funding of BERD, the relative contribution of public funds to BERD has declined. The data coverage for the sectoral breakdown is limited – not all Member States break down their funding of BERD by sectors. Data are available for AT, CY (partly), CZ, DK (1998), EE (partly), FI, FR, DE (1999), HU, IT, PL, PO (2001), SK, SI (partly), ES, SE, UK (1999). France, Germany and the UK provide almost two thirds of total EU government support for BERD (in line with their respective contribution to EU expenditures). Yet a disproportionate share goes to defence and/or aerospace. The following table (Table 7) shows (for the countries for which data were available) the four main sectors in terms of the share of public funds within the sector's total BERD and in relation to the share of sectoral GBERD within total public GBERD. The data show a wide variation between countries.
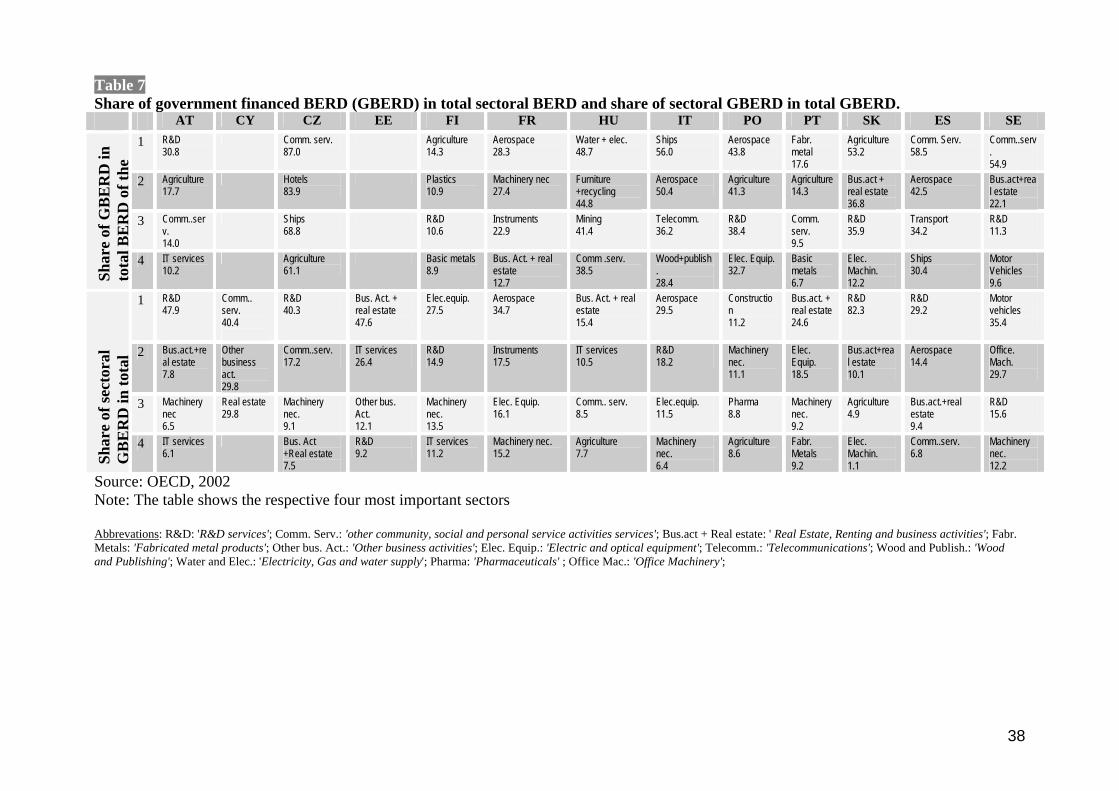
38
Table 7 Share of government financed BERD (GBERD) in total sectoral BERD and share of sectoral GBERD in total GBERD. AT CY CZ EE FI FR HU IT PO PT SK ES SE
1 R&D 30.8
Comm. serv. 87.0
Agriculture 14.3
Aerospace 28.3
Water + elec. 48.7
Ships 56.0
Aerospace 43.8
Fabr. metal 17.6
Agriculture 53.2
Comm. Serv. 58.5
Comm..serv. 54.9
2 Agriculture 17.7
Hotels 83.9
Plastics 10.9
Machinery nec 27.4
Furniture +recycling 44.8
Aerospace 50.4
Agriculture 41.3
Agriculture 14.3
Bus.act + real estate 36.8
Aerospace 42.5
Bus.act+real estate 22.1
3 Comm..serv. 14.0
Ships 68.8
R&D 10.6
Instruments 22.9
Mining 41.4
Telecomm. 36.2
R&D 38.4
Comm. serv. 9.5
R&D 35.9
Transport 34.2
R&D 11.3
Shar
e of
GB
ER
D in
to
tal B
ER
D o
f the
4 IT services 10.2
Agriculture 61.1
Basic metals 8.9
Bus. Act. + real estate 12.7
Comm .serv. 38.5
Wood+publish. 28.4
Elec. Equip. 32.7
Basic metals 6.7
Elec. Machin. 12.2
Ships 30.4
Motor Vehicles 9.6
1 R&D 47.9
Comm.. serv. 40.4
R&D 40.3
Bus. Act. + real estate 47.6
Elec.equip. 27.5
Aerospace 34.7
Bus. Act. + real estate 15.4
Aerospace 29.5
Construction 11.2
Bus.act. + real estate 24.6
R&D 82.3
R&D 29.2
Motor vehicles 35.4
2 Bus.act.+real estate 7.8
Other business act. 29.8
Comm..serv. 17.2
IT services 26.4
R&D 14.9
Instruments 17.5
IT services 10.5
R&D 18.2
Machinery nec. 11.1
Elec. Equip. 18.5
Bus.act+real estate 10.1
Aerospace 14.4
Office. Mach. 29.7
3 Machinery nec 6.5
Real estate 29.8
Machinery nec. 9.1
Other bus. Act. 12.1
Machinery nec. 13.5
Elec. Equip. 16.1
Comm.. serv. 8.5
Elec.equip. 11.5
Pharma 8.8
Machinery nec. 9.2
Agriculture 4.9
Bus.act.+real estate 9.4
R&D 15.6
Shar
e of
sect
oral
G
BE
RD
in to
tal
4 IT services 6.1
Bus. Act +Real estate 7.5
R&D 9.2
IT services 11.2
Machinery nec. 15.2
Agriculture 7.7
Machinery nec. 6.4
Agriculture 8.6
Fabr. Metals 9.2
Elec. Machin. 1.1
Comm..serv. 6.8
Machinery nec. 12.2
Source: OECD, 2002 Note: The table shows the respective four most important sectors Abbrevations: R&D: 'R&D services'; Comm. Serv.: 'other community, social and personal service activities services'; Bus.act + Real estate: ' Real Estate, Renting and business activities'; Fabr. Metals: 'Fabricated metal products'; Other bus. Act.: 'Other business activities'; Elec. Equip.: 'Electric and optical equipment'; Telecomm.: 'Telecommunications'; Wood and Publish.: 'Wood and Publishing'; Water and Elec.: 'Electricity, Gas and water supply'; Pharma: 'Pharmaceuticals' ; Office Mac.: 'Office Machinery';
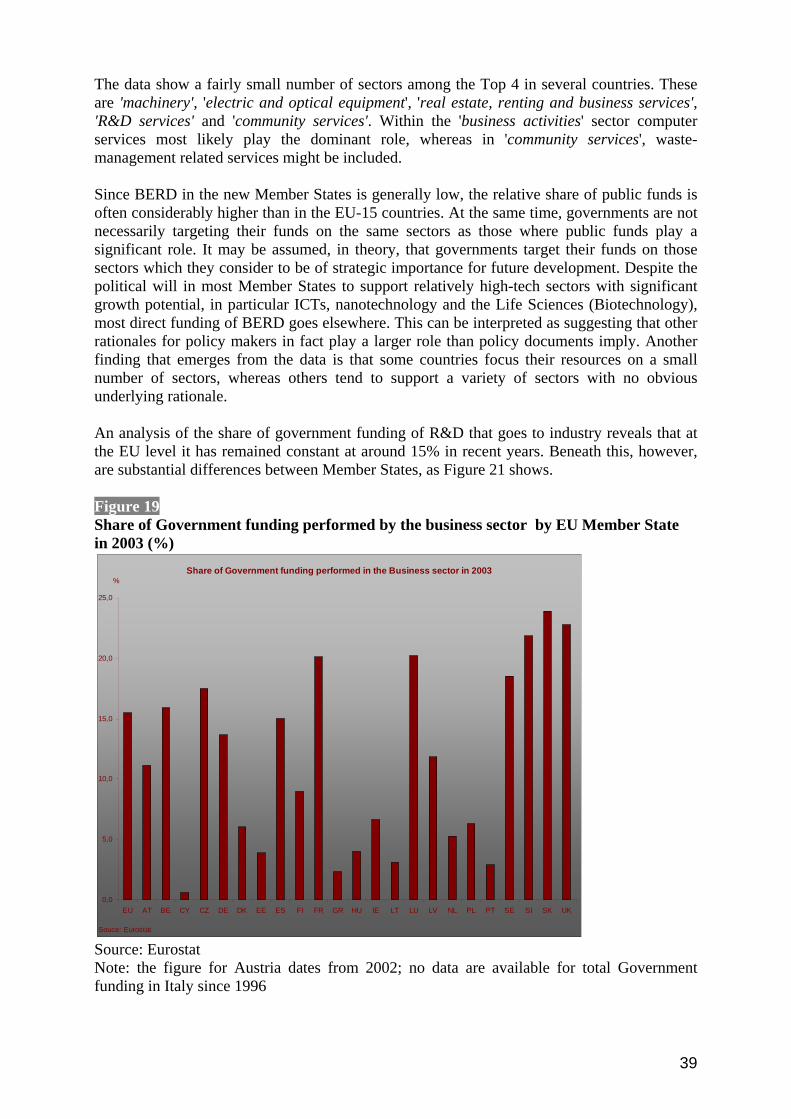
39
The data show a fairly small number of sectors among the Top 4 in several countries. These are 'machinery', 'electric and optical equipment', 'real estate, renting and business services', 'R&D services' and 'community services'. Within the 'business activities' sector computer services most likely play the dominant role, whereas in 'community services', waste-management related services might be included. Since BERD in the new Member States is generally low, the relative share of public funds is often considerably higher than in the EU-15 countries. At the same time, governments are not necessarily targeting their funds on the same sectors as those where public funds play a significant role. It may be assumed, in theory, that governments target their funds on those sectors which they consider to be of strategic importance for future development. Despite the political will in most Member States to support relatively high-tech sectors with significant growth potential, in particular ICTs, nanotechnology and the Life Sciences (Biotechnology), most direct funding of BERD goes elsewhere. This can be interpreted as suggesting that other rationales for policy makers in fact play a larger role than policy documents imply. Another finding that emerges from the data is that some countries focus their resources on a small number of sectors, whereas others tend to support a variety of sectors with no obvious underlying rationale. An analysis of the share of government funding of R&D that goes to industry reveals that at the EU level it has remained constant at around 15% in recent years. Beneath this, however, are substantial differences between Member States, as Figure 21 shows. Figure 19 Share of Government funding performed by the business sector by EU Member State in 2003 (%)
Share of Government funding performed in the Business sector in 2003
0,0
5,0
10,0
15,0
20,0
25,0
EU AT BE CY CZ DE DK EE ES FI FR GR HU IE LT LU LV NL PL PT SE SI SK UK
Souce: Eurostat
%
Source: Eurostat Note: the figure for Austria dates from 2002; no data are available for total Government funding in Italy since 1996
40
Considerable differences between countries can, indeed, be seen regarding the share of Government R&D funding that is performed by the business sector. This share is less than 5% in Cyprus, Estonia, Greece, Hungary, Lithuania and Portugal but over 15% in Belgium, Czech Republic, France, Sweden, Slovakia and the UK. Again the high level of funding in France and the UK is largely due to defence-related R&D. Moreover, the German situation corresponds to a high level of investment in the aerospace industry. Because of the relative weight of these countries in Europe, this significantly reduces the figure for overall direct government support to industrial R&D. This fact needs to be kept in mind when analysing the policy mix intended to increase business R&D expenditure. Finally, while changes over time are barely noticeable on the EU25 level, there has been a slight increase in this indicator in Austria, Spain and the UK, a slight decrease in Belgium, Germany, Hungary and the Netherlands, and a more substantial decrease in Poland and Slovakia (data not shown). All in all, direct support to industrial R&D has remained relatively stable and non-focused at the EU aggregate level, and it seems to play a significant role only for a small number of old and new Member States.

41
Chapter 5 The policy choices of the Member States This chapter deals with public policies that aim at encouraging private R&D investments and/or enhancing the capacity of the private sector to absorb and make use of research results. Governments use a variety of channels to support private sector innovation and R&D activities40, including: 1. Public funding of the Higher Education sector and other public research organisations, 2. Provision of skills through the Higher Education System 3. Specific measures designed to foster private R&D. The first two channels are very closely related, as the provision of skilled people is highly dependent of the quality of the public research base, at least as concerns the quality of graduates working in companies' R&D departments. As most graduates are trained in universities (Higher Education sector), the public resources for research at universities can be used as an indicator of policy-makers' priorities in this area. A complementary indicator is the level of public resources devoted to tertiary education (that is education in Higher Education institutions) as the ratio between these two gives an idea of policy choices, either towards excellence in research and/or excellence in education. EUROSTAT provides quantitative information for both indicators. The third channel, the 'specific measures to foster private R&D' is much more difficult to analyse quantitatively. Besides the available data on GBERD (see chapter 4), the other source of data is the 'Government Budget Appropriations or outlays on R&D' (GBOARD), which includes all planned public sector expenditures (national, regional and local level) according to a number of socio-economic objectives defined by the NABS chapters41. This data set is available for all EU Member States, but its usefulness is limited as usually there are differences between the planned expenditures in the public budgets and the actual expenditures. Secondly, the allocation of the planned expenditures across the 13 socio-economic objectives includes a certain degree of fuzziness. At the end of the chapter we combine the available information on the three channels and identify national priorities for one of the presented channels, where possible.
5.1 Public funding of the Higher Education sector Traditionally, public funding of basic research in the university sector and in other public research organisations was the key task of R&D policy. Over the last few decades, however, the scope of R&D policy has changed substantially42, but the funding of research at universities and other public research organisations remains at the core of R&D policy. In 2005 the GBOARD chapter on research funded from general university funds (GUF chapter43) represented 32% of total public R&D appropriations in Europe. For the EU-15, its relevance within Total appropriations grew only slowly between 1995 and 2005, from 31.6% to 32.1%. This slow growth does not mean that universities received only 2% more public resources for their research, as in their role as R&D performers, universities also benefit from public resources devoted to other NABS-chapters, such as environmental protection, health,
40 EUROPEAN COMMISSION (2006): Policies to foster R&D and Innovation (forthcoming) 41 NABS = Nomenclature for the analysis and comparison of scientific programmes and budgets 42 For an historical overview, see: Benoit Godin: Research and Development: How the 'D' got into R&D; Science and Public Policy, February 2006, pp 59-76 43 The GUF chapter includes all non-directed research at universities, i.e. basic research performed by universities with no thematic or sectorial steering from policy. It represents therefore the bulk of the 'curiosity-driven research' undertaken by universities.

42
energy and so on as well as funding from private sector sources or from abroad. A more detailed analysis of actual expenditures by the Higher Education sector (HERD) can be found elsewhere44. In order to obtain a better comparison with educational expenditures for tertiary education we concentrate below on developments between 1999 and 2003. The growth of the GUF chapter between 1999 and 2003 was lower than growth in Total Budget appropriations over the same period, showing that on an aggregate level, excellence in university research did not gain in political relevance. However, national diversity across Europe is substantial. Table 8 Trends in fostering excellence in university research % Growth of
GUF chapter between 1999
and 2003
% Growth of Total Budget
appropriations 1999-2003
Percentage of Total Budget
appropriations in 1999
Percentage of Total Budget
appropriations in 2003
EU-15 28.0 31.4 31.6 32.1 Belgium 17.0 26.5 19.4 17.9 Denmark 24.0 9.7 35.7 42.7 Germany 9.9 9.7 38.3 38.9 Greece 28.0 46.3 48.9 49.2 Spain 64.2 116.5 25.7 24.9 France 66.8 21.1 18.2 24.4 Ireland 170.6 135.6 24.3 38.8 Italy 24.5 37.1 47.3 - Netherlands 15.8 16.4 44.8 45.6 Austria 7.8 24.3 65.1 61.9 Portugal 16.9 46.5 35.0 34.8 Finland 19.8 24.4 25.4 27.1 Sweden 30.8 53.8 50.9 44.3 United Kingdom 44.2 39.8 18.7 19.8 Source: Eurostat Note: All data based on M-PPS; EU-15 budget appropriations represented 96.5% of EU-25 budget appropriations in 2005; Data for LU not available. Table 8 shows the different national priorities in this area. University research (as measured by the growth rate of the GUF chapter of GBOARD) gained obvious relevance (as compared to total GBOARD growth) for countries like Denmark, France and Ireland. Some countries did not change their strategy significantly, such as Germany, the United Kingdom, the Netherlands and Finland. A third group of countries, however, exhibit another strategy, notably slower growth as compared to total appropriations – examples of this here are Belgium, Italy, Spain, Sweden, Greece, Portugal and Austria.
44 Forthcoming IPTS report on research at universities: changes and challenges.
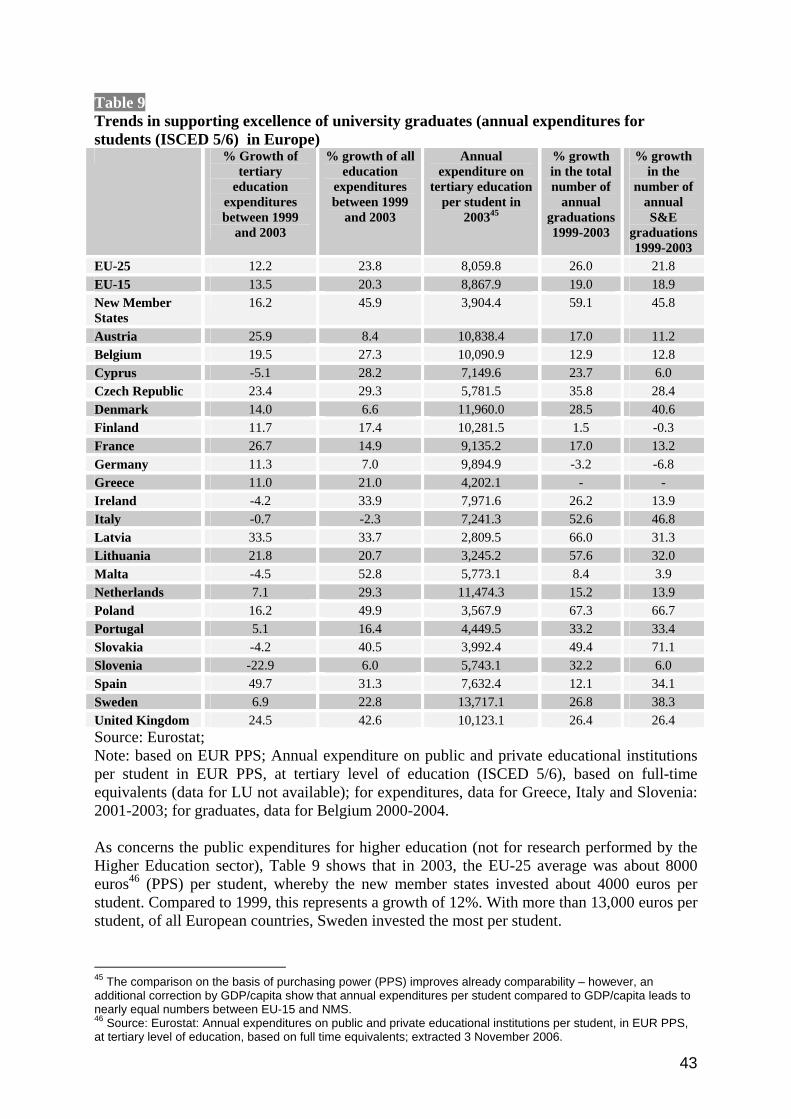
43
Table 9 Trends in supporting excellence of university graduates (annual expenditures for students (ISCED 5/6) in Europe)
% Growth of tertiary
education expenditures between 1999
and 2003
% growth of all education
expenditures between 1999
and 2003
Annual expenditure on
tertiary education per student in
200345
% growth in the total number of
annual graduations 1999-2003
% growth in the
number of annual S&E
graduations 1999-2003
EU-25 12.2 23.8 8,059.8 26.0 21.8 EU-15 13.5 20.3 8,867.9 19.0 18.9 New Member States
16.2 45.9 3,904.4 59.1 45.8
Austria 25.9 8.4 10,838.4 17.0 11.2 Belgium 19.5 27.3 10,090.9 12.9 12.8 Cyprus -5.1 28.2 7,149.6 23.7 6.0 Czech Republic 23.4 29.3 5,781.5 35.8 28.4 Denmark 14.0 6.6 11,960.0 28.5 40.6 Finland 11.7 17.4 10,281.5 1.5 -0.3 France 26.7 14.9 9,135.2 17.0 13.2 Germany 11.3 7.0 9,894.9 -3.2 -6.8 Greece 11.0 21.0 4,202.1 - - Ireland -4.2 33.9 7,971.6 26.2 13.9 Italy -0.7 -2.3 7,241.3 52.6 46.8 Latvia 33.5 33.7 2,809.5 66.0 31.3 Lithuania 21.8 20.7 3,245.2 57.6 32.0 Malta -4.5 52.8 5,773.1 8.4 3.9 Netherlands 7.1 29.3 11,474.3 15.2 13.9 Poland 16.2 49.9 3,567.9 67.3 66.7 Portugal 5.1 16.4 4,449.5 33.2 33.4 Slovakia -4.2 40.5 3,992.4 49.4 71.1 Slovenia -22.9 6.0 5,743.1 32.2 6.0 Spain 49.7 31.3 7,632.4 12.1 34.1 Sweden 6.9 22.8 13,717.1 26.8 38.3 United Kingdom 24.5 42.6 10,123.1 26.4 26.4 Source: Eurostat; Note: based on EUR PPS; Annual expenditure on public and private educational institutions per student in EUR PPS, at tertiary level of education (ISCED 5/6), based on full-time equivalents (data for LU not available); for expenditures, data for Greece, Italy and Slovenia: 2001-2003; for graduates, data for Belgium 2000-2004. As concerns the public expenditures for higher education (not for research performed by the Higher Education sector), Table 9 shows that in 2003, the EU-25 average was about 8000 euros46 (PPS) per student, whereby the new member states invested about 4000 euros per student. Compared to 1999, this represents a growth of 12%. With more than 13,000 euros per student, of all European countries, Sweden invested the most per student.
45 The comparison on the basis of purchasing power (PPS) improves already comparability – however, an additional correction by GDP/capita show that annual expenditures per student compared to GDP/capita leads to nearly equal numbers between EU-15 and NMS. 46 Source: Eurostat: Annual expenditures on public and private educational institutions per student, in EUR PPS, at tertiary level of education, based on full time equivalents; extracted 3 November 2006.
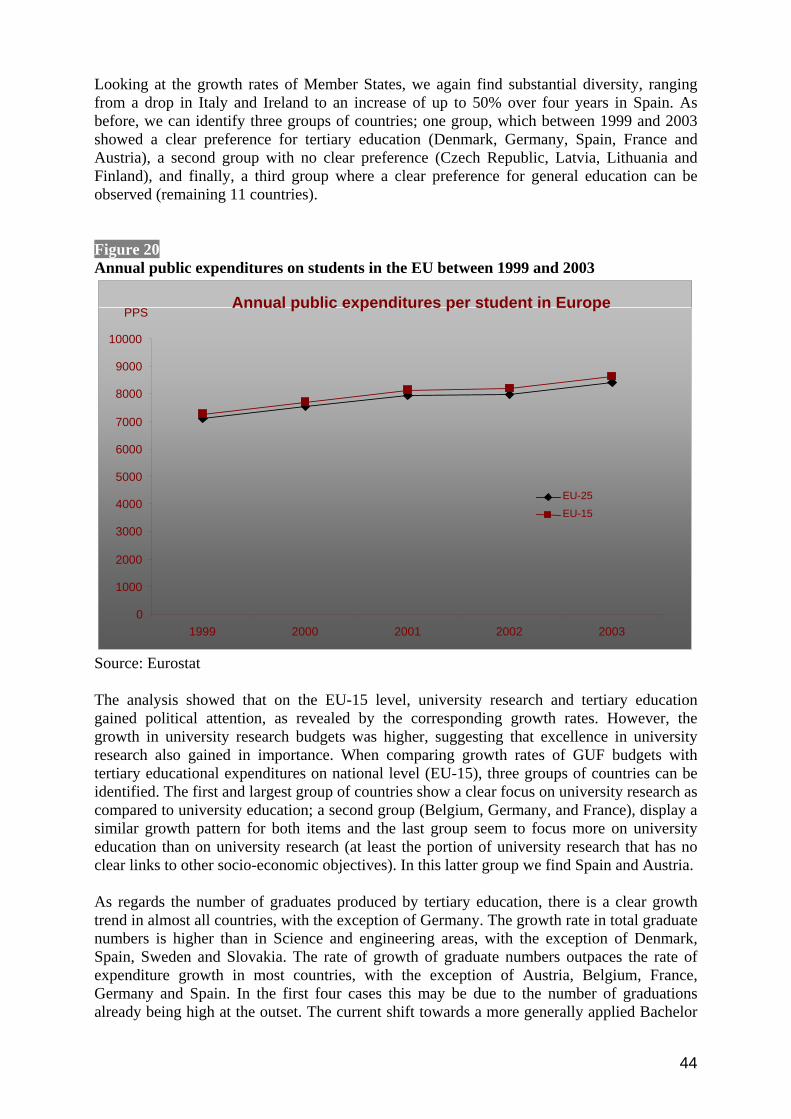
44
Looking at the growth rates of Member States, we again find substantial diversity, ranging from a drop in Italy and Ireland to an increase of up to 50% over four years in Spain. As before, we can identify three groups of countries; one group, which between 1999 and 2003 showed a clear preference for tertiary education (Denmark, Germany, Spain, France and Austria), a second group with no clear preference (Czech Republic, Latvia, Lithuania and Finland), and finally, a third group where a clear preference for general education can be observed (remaining 11 countries). Figure 20 Annual public expenditures on students in the EU between 1999 and 2003
Source: Eurostat The analysis showed that on the EU-15 level, university research and tertiary education gained political attention, as revealed by the corresponding growth rates. However, the growth in university research budgets was higher, suggesting that excellence in university research also gained in importance. When comparing growth rates of GUF budgets with tertiary educational expenditures on national level (EU-15), three groups of countries can be identified. The first and largest group of countries show a clear focus on university research as compared to university education; a second group (Belgium, Germany, and France), display a similar growth pattern for both items and the last group seem to focus more on university education than on university research (at least the portion of university research that has no clear links to other socio-economic objectives). In this latter group we find Spain and Austria. As regards the number of graduates produced by tertiary education, there is a clear growth trend in almost all countries, with the exception of Germany. The growth rate in total graduate numbers is higher than in Science and engineering areas, with the exception of Denmark, Spain, Sweden and Slovakia. The rate of growth of graduate numbers outpaces the rate of expenditure growth in most countries, with the exception of Austria, Belgium, France, Germany and Spain. In the first four cases this may be due to the number of graduations already being high at the outset. The current shift towards a more generally applied Bachelor
Annual public expenditures per student in Europe
0
1000
2000
3000
4000
5000
6000
7000
8000
9000
10000
1999 2000 2001 2002 2003
PPS
EU-25 EU-15
45
and Master system, as promoted by the Bologna process47, will boost the number of graduates, particularly in those Member States where degree courses are structured differently, such as Germany or Austria.
5.2 Specific measures to foster business R&D Whereas in the past, public policies have concentrated mainly on providing a well educated workforce and ensuring a public basic research base in universities and other public research institutions, nowadays it is well recognised that public policies can be more effective when simultaneously focusing on policy measures to enhance the companies' ability to make use of research results (their so-called "absorptive capacity"). Consequently, over the last two decades, technology transfer, cooperative programmes and public-private partnerships have played an increasing role in the public policy instrument mix used to foster business innovations, and in particular, private sector R&D. More recently, the design of supportive framework conditions, including tax incentive schemes for R&D expenditures in the private sector48, has increasingly come into policy makers' focus. The Lisbon strategy recognises the importance of all these factors and is asking Member States to design and execute the different policies in a more coordinated and integrated manner. There is a long tradition of these specific measures across the Member States, which are based on the generally accepted idea that there is a market failure leading to sub-optimal levels of private sector R&D. The central argument is that the private returns to the investing company are low compared to the larger societal spill-overs/returns49. Public action is therefore perceived as desirable. There is, however, an on-going debate about the most effective policy instruments to overcome this identified market failure. Direct financial support, in particular, runs the risk of 'crowding out' private-sector investments rather than enhancing them. As illustrated in the preceding chapters, general trends at the EU level conceal significant diversity at the national level and at the sectoral level. This should be kept in mind when comparing Member States' policy choices. Different national and sectoral settings might require different 'policy mixes' and the same policy instruments might have a different impact according to the respective national setting50. The policy measures described are limited to R&D policy measures aiming at directly or indirectly influencing private R&D investments. Policy measures from other policy domains are only covered when they play a key role within the respective national policy mix. The principal information of this section is based on the ERAWATCH research inventory.
47 For more information about the Bologna process, please see http://European Commission.europa.eu/education/policies/educ/bologna/bologna_en.html
48 For a recent overview on fiscal incentive schemes in the EU see the Report of the CREST OMC expert group on Evaluation and design of R&D tax incentives 49 Clemmons, R. & Adams, James D. (2006): Science and Industry: Tracing the Flow of Basic Research through Manufacturing and Trade; NBER working paper 12459 50 UNU-MERIT (2006): Monitoring and analysis of policies and public financing instruments conducive to higher levels of R&D investments: The policy mix project
46
In order to better understand the R&D policy mix, it is necessary to develop a classification scheme that groups the policy mix. There are a number of existing classifications of public innovation/research policies. The most common are classifications with regard to
• Target audience (SMEs, large firms) • Target sector • Type of policy (direct funding, cooperative research grants, tax breaks, etc.) • General policy goals (increase productivity of R&D, increase markets for R&D
intensive products, etc.)51 Out of the existing classifications, we focus on the different types of policies, as here the ERAWATCH research inventory provides most of the relevant information. The 'target audience' of the policy measures will be included as information is available, and as it is a key to understanding the potential impacts of a policy measure. The target audience includes the following groups:
• SMEs: o New companies performing R&D (SMEs) o Companies already performing R&D o Non-R&D performing companies (SMEs)
• Non SME: o Companies already performing R&D (large companies) o Foreign R&D performers
Typically, the R&D policy mix is described according to the following types of policies52:
• Direct Financial R&D measures: include all direct transfers of financial support for R&D from the public to the private sector via grants or conditional loans
• Indirect fiscal R&D measures: include all forms of reduced tax requirements from companies for approved R&D investment behaviour
• Catalytic financial R&D measures: include all measures enabling and/or facilitating access to external financial resources for R&D performing companies, usually in the form of venture capital or loan and equity guarantee measures.
It is, however, necessary to distinguish further between those measures directed towards the creation of knowledge and other measures that aim to improve the up-take of knowledge by the private sector. In a number of Member States, a third category of measures plays a dominant role that combines the two elements, notably so called 'bridging measures' that link financial support for private sector R&D to a collaboration with public sector R&D, which thereby aims to improve the absorptive capacity of the private sector. Looking specifically at the policy measures aiming at fostering private sector R&D, the list of alternatives is basically as follows:
• Direct support for private sector knowledge creation: o Financial support for private sector R&D projects, including grants, loans,
capital investments and guarantee mechanisms o Financial support for R&D programmes conducted by business consortia o Tax incentives o Venture and seed capital provisions, support to business angel networks.
51 Anthony Arundel and Hugo Hollanders: Policy, Indicators and Targets: measuring the impacts of innovation policies; European TrendChart on Innovation report 52 EUROPEAN COMMISSION (2003): Raising EU R&D Intensity: Improving the effectiveness of the mix of public support mechanisms for private sector Research and Development: Report to the European Commission by an independent expert group.
47
• Support for private sector knowledge use: o Financial support for HEI to support private sector R&D (including
Technology Transfer for universities, polytechnics, the 'third mission' for universities, spin-off programmes)
o Life-long learning programmes o Direct support of uptake of knowledge by companies, like business support
structures, specific SME programmes, seed investment provisions, science parks,
• Bridging measures between the public and private sector: o Programmes of collaboration between public and private sector knowledge
creators o Mobility programmes to enable researchers to move between the private and
public sector o Cluster programmes bringing together public and private knowledge creators
and users (both thematic and regional) The following table combines these classifications of the national R&D policy mix used to foster private sector R&D. The crosses highlight the most important target audience of the policy measure. As often, policy measures tend to target a variety of audiences, so the differentiation is not clear-cut.
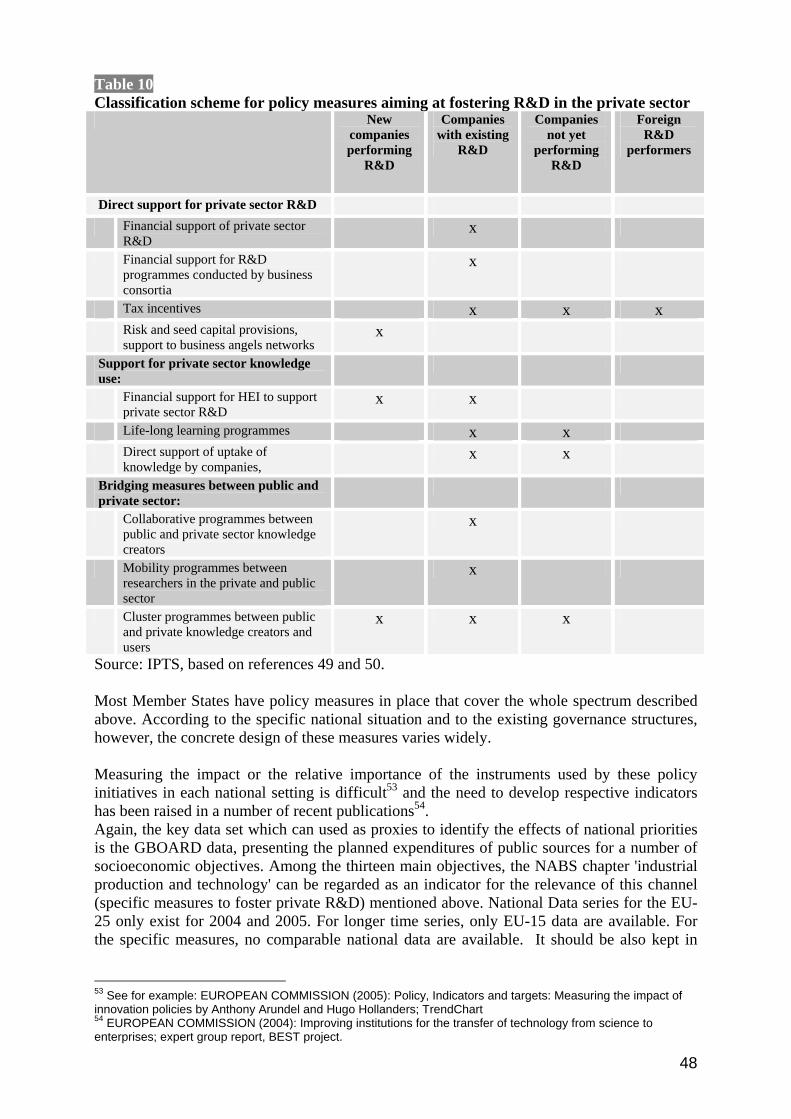
48
Table 10 Classification scheme for policy measures aiming at fostering R&D in the private sector New
companies performing
R&D
Companies with existing
R&D
Companies not yet
performing R&D
Foreign R&D
performers
Direct support for private sector R&D Financial support of private sector
R&D x
Financial support for R&D programmes conducted by business consortia
x
Tax incentives x x x Risk and seed capital provisions,
support to business angels networks x
Support for private sector knowledge use:
Financial support for HEI to support private sector R&D
x x
Life-long learning programmes x x Direct support of uptake of
knowledge by companies, x x
Bridging measures between public and private sector:
Collaborative programmes between public and private sector knowledge creators
x
Mobility programmes between researchers in the private and public sector
x
Cluster programmes between public and private knowledge creators and users
x x x
Source: IPTS, based on references 49 and 50. Most Member States have policy measures in place that cover the whole spectrum described above. According to the specific national situation and to the existing governance structures, however, the concrete design of these measures varies widely. Measuring the impact or the relative importance of the instruments used by these policy initiatives in each national setting is difficult53 and the need to develop respective indicators has been raised in a number of recent publications54. Again, the key data set which can used as proxies to identify the effects of national priorities is the GBOARD data, presenting the planned expenditures of public sources for a number of socioeconomic objectives. Among the thirteen main objectives, the NABS chapter 'industrial production and technology' can be regarded as an indicator for the relevance of this channel (specific measures to foster private R&D) mentioned above. National Data series for the EU-25 only exist for 2004 and 2005. For longer time series, only EU-15 data are available. For the specific measures, no comparable national data are available. It should be also kept in
53 See for example: EUROPEAN COMMISSION (2005): Policy, Indicators and targets: Measuring the impact of innovation policies by Anthony Arundel and Hugo Hollanders; TrendChart 54 EUROPEAN COMMISSION (2004): Improving institutions for the transfer of technology from science to enterprises; expert group report, BEST project.
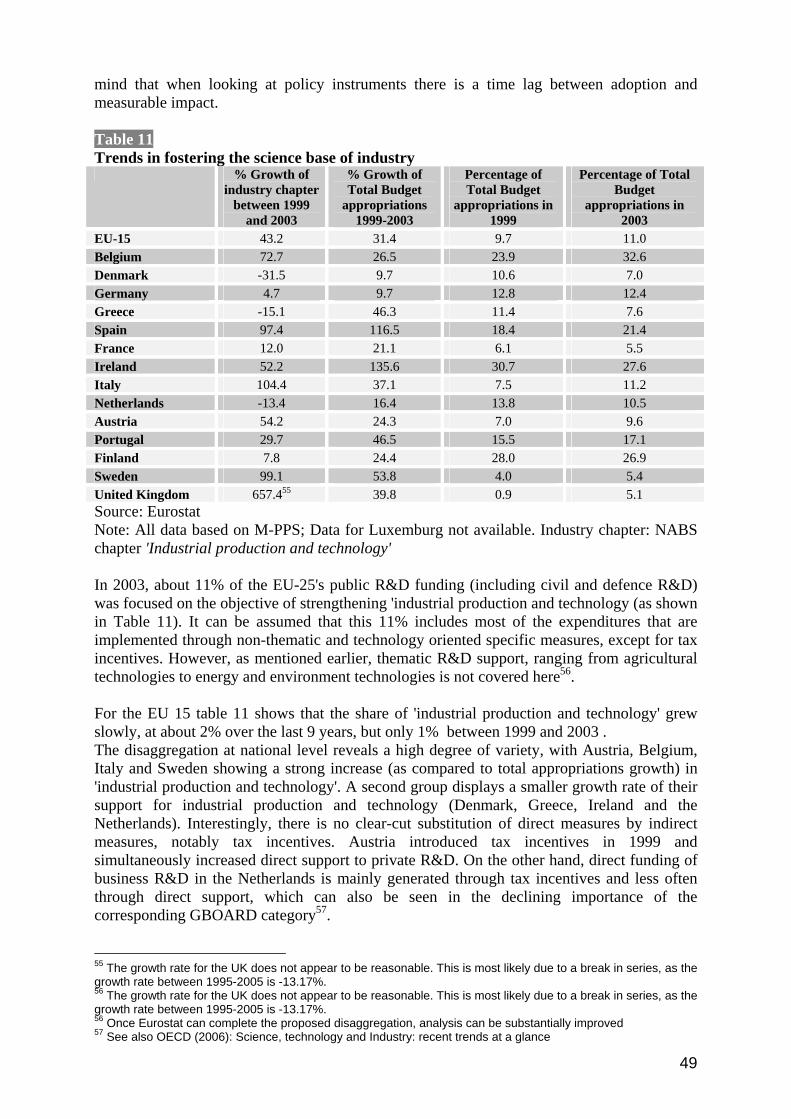
49
mind that when looking at policy instruments there is a time lag between adoption and measurable impact. Table 11 Trends in fostering the science base of industry
% Growth of industry chapter
between 1999 and 2003
% Growth of Total Budget
appropriations 1999-2003
Percentage of Total Budget
appropriations in 1999
Percentage of Total Budget
appropriations in 2003
EU-15 43.2 31.4 9.7 11.0 Belgium 72.7 26.5 23.9 32.6 Denmark -31.5 9.7 10.6 7.0 Germany 4.7 9.7 12.8 12.4 Greece -15.1 46.3 11.4 7.6 Spain 97.4 116.5 18.4 21.4 France 12.0 21.1 6.1 5.5 Ireland 52.2 135.6 30.7 27.6 Italy 104.4 37.1 7.5 11.2 Netherlands -13.4 16.4 13.8 10.5 Austria 54.2 24.3 7.0 9.6 Portugal 29.7 46.5 15.5 17.1 Finland 7.8 24.4 28.0 26.9 Sweden 99.1 53.8 4.0 5.4 United Kingdom 657.455 39.8 0.9 5.1 Source: Eurostat Note: All data based on M-PPS; Data for Luxemburg not available. Industry chapter: NABS chapter 'Industrial production and technology' In 2003, about 11% of the EU-25's public R&D funding (including civil and defence R&D) was focused on the objective of strengthening 'industrial production and technology (as shown in Table 11). It can be assumed that this 11% includes most of the expenditures that are implemented through non-thematic and technology oriented specific measures, except for tax incentives. However, as mentioned earlier, thematic R&D support, ranging from agricultural technologies to energy and environment technologies is not covered here56. For the EU 15 table 11 shows that the share of 'industrial production and technology' grew slowly, at about 2% over the last 9 years, but only 1% between 1999 and 2003 . The disaggregation at national level reveals a high degree of variety, with Austria, Belgium, Italy and Sweden showing a strong increase (as compared to total appropriations growth) in 'industrial production and technology'. A second group displays a smaller growth rate of their support for industrial production and technology (Denmark, Greece, Ireland and the Netherlands). Interestingly, there is no clear-cut substitution of direct measures by indirect measures, notably tax incentives. Austria introduced tax incentives in 1999 and simultaneously increased direct support to private R&D. On the other hand, direct funding of business R&D in the Netherlands is mainly generated through tax incentives and less often through direct support, which can also be seen in the declining importance of the corresponding GBOARD category57. 55 The growth rate for the UK does not appear to be reasonable. This is most likely due to a break in series, as the growth rate between 1995-2005 is -13.17%. 56 The growth rate for the UK does not appear to be reasonable. This is most likely due to a break in series, as the growth rate between 1995-2005 is -13.17%. 56 Once Eurostat can complete the proposed disaggregation, analysis can be substantially improved 57 See also OECD (2006): Science, technology and Industry: recent trends at a glance
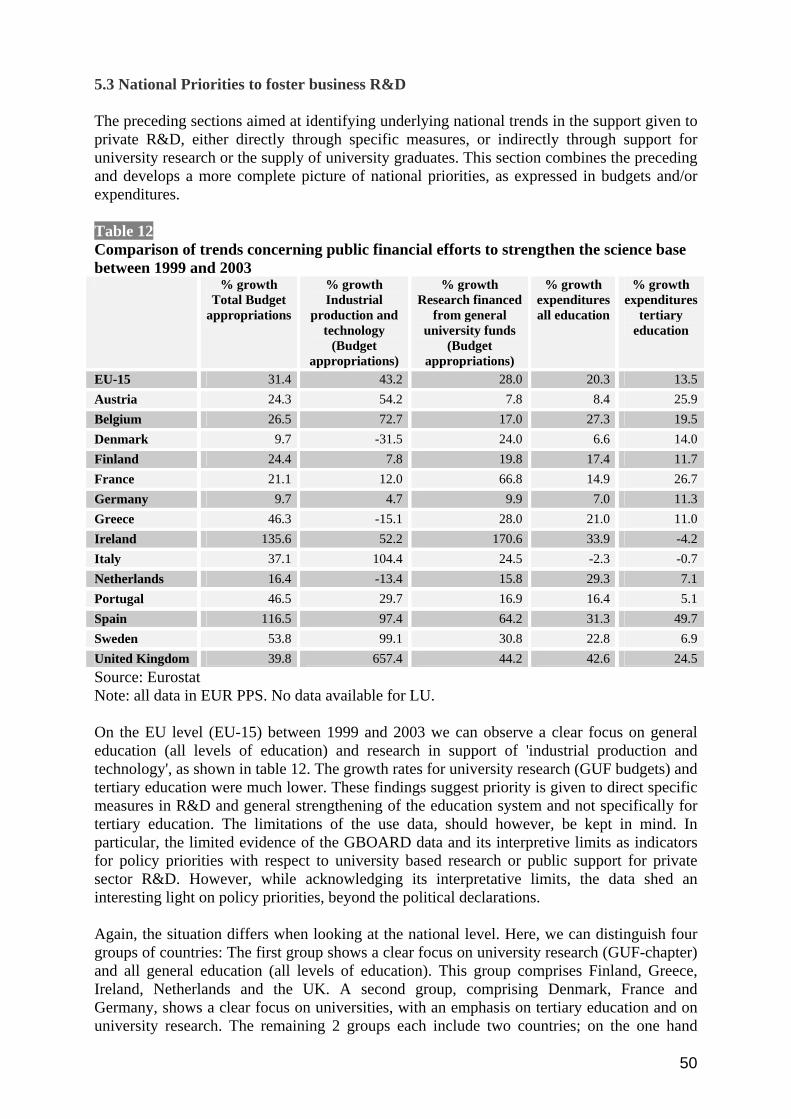
50
5.3 National Priorities to foster business R&D The preceding sections aimed at identifying underlying national trends in the support given to private R&D, either directly through specific measures, or indirectly through support for university research or the supply of university graduates. This section combines the preceding and develops a more complete picture of national priorities, as expressed in budgets and/or expenditures. Table 12 Comparison of trends concerning public financial efforts to strengthen the science base between 1999 and 2003
% growth Total Budget
appropriations
% growth Industrial
production and technology
(Budget appropriations)
% growth Research financed
from general university funds
(Budget appropriations)
% growth expenditures all education
% growth expenditures
tertiary education
EU-15 31.4 43.2 28.0 20.3 13.5 Austria 24.3 54.2 7.8 8.4 25.9 Belgium 26.5 72.7 17.0 27.3 19.5 Denmark 9.7 -31.5 24.0 6.6 14.0 Finland 24.4 7.8 19.8 17.4 11.7 France 21.1 12.0 66.8 14.9 26.7 Germany 9.7 4.7 9.9 7.0 11.3 Greece 46.3 -15.1 28.0 21.0 11.0 Ireland 135.6 52.2 170.6 33.9 -4.2 Italy 37.1 104.4 24.5 -2.3 -0.7 Netherlands 16.4 -13.4 15.8 29.3 7.1 Portugal 46.5 29.7 16.9 16.4 5.1 Spain 116.5 97.4 64.2 31.3 49.7 Sweden 53.8 99.1 30.8 22.8 6.9 United Kingdom 39.8 657.4 44.2 42.6 24.5 Source: Eurostat Note: all data in EUR PPS. No data available for LU. On the EU level (EU-15) between 1999 and 2003 we can observe a clear focus on general education (all levels of education) and research in support of 'industrial production and technology', as shown in table 12. The growth rates for university research (GUF budgets) and tertiary education were much lower. These findings suggest priority is given to direct specific measures in R&D and general strengthening of the education system and not specifically for tertiary education. The limitations of the use data, should however, be kept in mind. In particular, the limited evidence of the GBOARD data and its interpretive limits as indicators for policy priorities with respect to university based research or public support for private sector R&D. However, while acknowledging its interpretative limits, the data shed an interesting light on policy priorities, beyond the political declarations. Again, the situation differs when looking at the national level. Here, we can distinguish four groups of countries: The first group shows a clear focus on university research (GUF-chapter) and all general education (all levels of education). This group comprises Finland, Greece, Ireland, Netherlands and the UK. A second group, comprising Denmark, France and Germany, shows a clear focus on universities, with an emphasis on tertiary education and on university research. The remaining 2 groups each include two countries; on the one hand
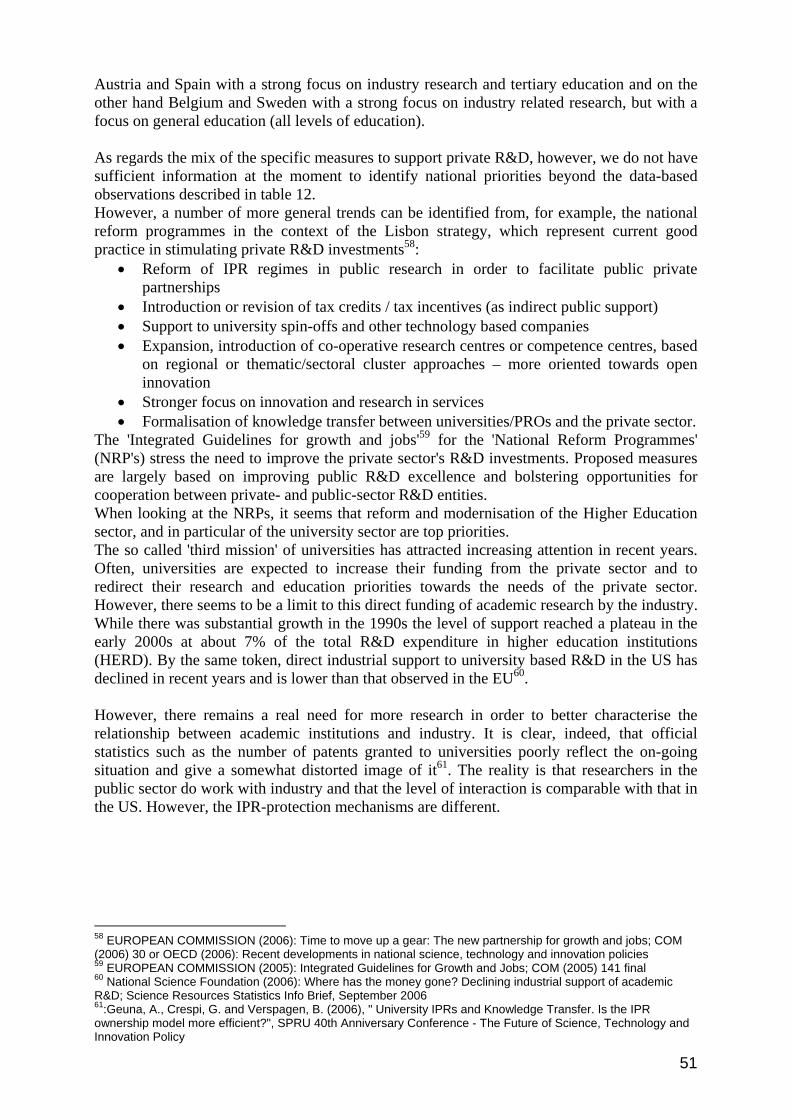
51
Austria and Spain with a strong focus on industry research and tertiary education and on the other hand Belgium and Sweden with a strong focus on industry related research, but with a focus on general education (all levels of education). As regards the mix of the specific measures to support private R&D, however, we do not have sufficient information at the moment to identify national priorities beyond the data-based observations described in table 12. However, a number of more general trends can be identified from, for example, the national reform programmes in the context of the Lisbon strategy, which represent current good practice in stimulating private R&D investments58:
• Reform of IPR regimes in public research in order to facilitate public private partnerships
• Introduction or revision of tax credits / tax incentives (as indirect public support) • Support to university spin-offs and other technology based companies • Expansion, introduction of co-operative research centres or competence centres, based
on regional or thematic/sectoral cluster approaches – more oriented towards open innovation
• Stronger focus on innovation and research in services • Formalisation of knowledge transfer between universities/PROs and the private sector.
The 'Integrated Guidelines for growth and jobs'59 for the 'National Reform Programmes' (NRP's) stress the need to improve the private sector's R&D investments. Proposed measures are largely based on improving public R&D excellence and bolstering opportunities for cooperation between private- and public-sector R&D entities. When looking at the NRPs, it seems that reform and modernisation of the Higher Education sector, and in particular of the university sector are top priorities. The so called 'third mission' of universities has attracted increasing attention in recent years. Often, universities are expected to increase their funding from the private sector and to redirect their research and education priorities towards the needs of the private sector. However, there seems to be a limit to this direct funding of academic research by the industry. While there was substantial growth in the 1990s the level of support reached a plateau in the early 2000s at about 7% of the total R&D expenditure in higher education institutions (HERD). By the same token, direct industrial support to university based R&D in the US has declined in recent years and is lower than that observed in the EU60. However, there remains a real need for more research in order to better characterise the relationship between academic institutions and industry. It is clear, indeed, that official statistics such as the number of patents granted to universities poorly reflect the on-going situation and give a somewhat distorted image of it61. The reality is that researchers in the public sector do work with industry and that the level of interaction is comparable with that in the US. However, the IPR-protection mechanisms are different.
58 EUROPEAN COMMISSION (2006): Time to move up a gear: The new partnership for growth and jobs; COM (2006) 30 or OECD (2006): Recent developments in national science, technology and innovation policies 59 EUROPEAN COMMISSION (2005): Integrated Guidelines for Growth and Jobs; COM (2005) 141 final 60 National Science Foundation (2006): Where has the money gone? Declining industrial support of academic R&D; Science Resources Statistics Info Brief, September 2006 61:Geuna, A., Crespi, G. and Verspagen, B. (2006), " University IPRs and Knowledge Transfer. Is the IPR ownership model more efficient?", SPRU 40th Anniversary Conference - The Future of Science, Technology and Innovation Policy
52
Chapter 6 Conclusions This report has aimed to characterise the trends in business R&D and related public policies over the last decade. Trends in business R&D were captured by compiling and analysing statistical data on business expenditures on R&D (BERD) and researchers in the private sector. Our efforts have focused on analysing BERD and researcher information according to industrial sectors and according to EU Member States. Related public policies were analysed by assuming three main channels are used for public action to support private-sector R&D. Some conclusions can be drawn from the information and data presented here. Although the situation over the last decade appears to be fairly static on the aggregate EU level (with respect to the data presented), in spite of all political efforts of national and European measures within the Lisbon strategy, considerable changes have nevertheless taken place at both Member State and sectoral level. As the large Member States like Germany and France have remained fairly stable in recent years, the efforts of smaller Member States, particularly Spain, Greece and Portugal, have tended to go unnoticed when looking at the aggregate EU level. A key conclusion here is that a catch-up process can be observed in Europe, with a broadening of the private sector science base. However, broadening the science base does not necessarily mean that as a result innovation, productivity and competitiveness are developing at the same pace. The interrelations between these dimensions are more complex and often dependent on contextual characteristics such as the sector and its main innovation pattern or the general cultural traditions of the member states. However, throughout the report, we see research investments as one enabler of innovation and productivity growth. Based on the EU-level data presented, the following key conclusions can be drawn:
• A main R&D growth driver over the last decade has been the service sector, in particular computer based services, even during the recent economic downturn – the service sector was also responsible for most growth in numbers of European researchers – this calls for new thinking about the qualifications of private sector researchers, given that researchers in the service sectors might need different skills than those working in manufacturing.
• R&D in the service sector is often performed by SMEs (especially as regards researchers), which are less flexible about the location of their R&D activities than large multinational companies. Here new policy measures should be based on a better understanding of service sector R&D activities and the needs for researcher training and qualifications. However, there also needs to be improved cooperation between the public research base and the service sector.
• There is still an open issue with the definition of what R&D is in the service sector, in particular as regards what is to be included under the heading of "R&D services". This category is not identified as such in some Member States, the corresponding activities being spread over other categories. Finally, there is an issue with the evolution of the type of R&D carried out in classical, well defined NACE sectors. For example, R&D in the automobile industry, which has grown dramatically over the last ten years, and has also changed in nature with more focus on ICTs, new materials, etc. Nevertheless the overall trend of a shift towards services is clear.
• Manufacturing still accounts for about 80% of total BERD and researcher numbers, making it the core of the EU's private sector research – manufacturing R&D also remained fairly stable during the recent economic downturn, which shows the commitment of business to R&D. However, increasing globalisation and the fact that most manufacturing is performed by large companies (as compared with the more
53
fragmented service sector) increases the risk of outsourcing R&D to emerging markets outside the EU. However, globalisation also represents advantages for Europe, as seen by the increasing importance of foreign affiliates in EU private sector R&D. Currently, there is no clear answer to these issues at the policy level62. Clearly, rising demand for R&D intensive products and processes within the EU would contribute to sustaining both domestic and foreign private R&D investments in Europe63.
• Over a period of 10 years the percentage of business researchers within the total employment population increased by 25%, which can be regarded as a promising sign for the further realisation of the knowledge economy; again more efforts are required to better understand this rapid change in the nature of employment and the role of R&D here. Particularly, it is essential to understand the repercussions on the education system, as well as on the research world, in order to exploit opportunities for sustained growth and job creation.
A more detailed look at the sectoral trends in business R&D over the last decade led to the following conclusions:
• Fifteen sectors account for more than 90% of total business R&D expenditures and researchers. However, these sectors do not represent 90% of European GDP or jobs64 – when aiming at creating growth and jobs, it needs to be recognised that growth and jobs do not only depend on R&D investments by the private sector. Nevertheless, it should be kept in mind that even the sectors not investing significantly in R&D will benefit indirectly when they buy technology (capital investments) resulting from R&D investments in other sectors.
• Three sectors showed significant increases in both researcher numbers and expenditures over the last decade, irrespective of the general economic conditions, namely 'motor vehicles', 'pharmaceuticals' and 'computer and related activities'. The 'Motor vehicles' sector doubled the number of researchers over the period observed and the 'computer and related activities sector' tripled its expenditures and quadrupled its number of researchers. This, in particular, is good news for Europe as this may signal that this sector is catching up with its counterpart in the US, where it was an important factor in GDP and productivity growth over the nineties.
• The remaining twelve sectors (out of the 15 analysed) showed either only very limited changes over the last decade or seemed to be more affected by the general economic conditions, as their growth path changed with the economic downturn in 2001. More analysis is needed, especially when comparing the BERD data with the EU scoreboard data, in order to understand whether the observed stability is caused by a general static behaviour of the sector or whether or to what extent it is caused by a high sectoral dynamic, taking place outside of the EU and so not captured by looking solely at BERD data and EU researchers.
• Expenditure per researcher and year (or the ratio between BERD and researcher numbers) varies significantly across the sectors analysed – the 'pharmaceuticals' sector has the highest ratio of expenditure per researcher at over 350,000 euros, whereas the 'computer and related activities' sector has an expenditure of only about 140,000 euros per researcher. The dynamics of this ratio were significant in some sectors, but mainly
62 See also Foray, Dominique: Knowledge for growth group; as a part the IPTS work on the EU Industrial R&D scoreboard, more analytical work is foreseen to better understand company behaviour and its determinants. Results from this work will significantly improve the knowledge base in this respect. 63 In fact this plea constitutes the core of the Aho report conclusions 64 The observed 15 sectors represented in 2004 about 40% of gross-value added (at basic prices) and about 20% of employment in Europe (source; Euroststat)
54
downwards, which basically means more researchers per euro. These dynamics might be caused by (stable or falling) labour costs and by a shift from industrial R&D to more extensive use of ICT, especially in the development phase. These data call for a more sector specific design of public measures to support private sector R&D.
A more detailed look at the diversity among member states leads to the following conclusions:
• The weight of BERD as a percentage of GDP varies significantly among member states, as does the dynamics of BERD growth since the adoption of the Lisbon strategy– clearly some countries are in the process of catching-up, (notably Austria and Spain, but also some new member states such as Cyprus, Malta and Estonia). These well known facts suggest that the European Research Area comprises 25 diverse national settings, where R&D plays different roles with respect to growth and jobs. Balanced policy needs to reflect this diversity and, at the same time, aim to increasing the knowledge share of all 25 economies and all sectors, as this will be of key relevance for ensuring prosperity in the long term. The increased significance of research and innovation in the new guidelines for the structural funds appears to be a promising step in this direction.
• The service sector was the key driver of BERD growth in all EU 15 member states and also for some new member states (the Czech Republic, Slovakia and Lithuania). As its share in total BERD still remains low (the largest part is still in manufacturing), total BERD growth masks the enormous growth rates in the service sector. Especially in the case of Spain, Ireland and Portugal, the lion's share of BERD is already accounted for by the service sector. This suggests that the process of catching-up is also associated with a change of private sector R&D, in particular, with manufacturing falling behind, while unique competencies are developing in the service sector. These findings suggest that national economic and research specialisations play a bigger role than expected and should be reflected in the design of European policies (ERAWATCH will soon publish a substantive analysis of national R&D specialisations).
• Comparing the ratio of BERD to researcher numbers in the different member states revealed the expected diversity, which can be explained partly by differences in labour costs, but also by the diverse economic structure. It may be assumed that countries with a high share of service sector R&D display, in general, a lower ratio between expenditures and number of researchers than countries with a higher share of manufacturing. The differences in labour costs and the availability of trained researchers might be one important background influence on the significant increases in the relative weight of R&D expenditures by affiliates of foreign multinationals. In Hungary and Ireland, more than 70% of BERD is already performed by foreign affiliates. National and European policy makers should watch these trends carefully in order to better understand how private sector R&D could be supported in the most effective way. Attracting foreign affiliates' R&D investments or strengthening national absorptive capacity might be complementary strategies in an increasingly globalised world of R&D investments. More also needs to be done to include these member states and those sectors that benefit only indirectly through technology purchases (capital investments) from R&D activities in the design of policy measures.
• The geographical distribution of R&D activities across the EU on the sectoral level showed that manufacturing remains concentrated in just a handful of countries, but that service sector R&D is already spread more evenly. Between 1999 and 2003, the distribution of most of the manufacturing sectors remained stable or even declined,
55
whereas geographical catch-up was most visible in the service sectors, where there is a predominance of SMEs, which show a lesser tendency to offshore than the large companies dominated manufacturing sectors. In fact, we might observe two complementary trends – one towards the broadening of R&D capacities across the Member States and towards the development of a limited number of centres of excellence where private-sector R&D investments are also concentrated.
The analysis of the direct funding of private R&D (the so-called GBERD category) came to the following conclusions:
• At the aggregate EU level, the share of government funding of BERD fell constantly over the last decade. This observation is consistent with policy trends which tend to focus more on indirect support of private sector R&D, for example, through tax incentives, and on knowledge transfer issues and putting more emphasis on improved cooperation between the public and the private sector. The total amount invested, however, showed some growth over the last five years, which might be explained by a certain substitution of reduced business financed BERD during the economic downturn by public funds. The pattern of direct BERD support among member states differs significantly, with a doubling of support in Spain and Portugal, and an even bigger increase in the Czech Republic between 1995 and 2003, to substantial decreases in Germany, Denmark, Netherlands and Poland. The findings here are consistent with the identified policy priorities of Member States. The countries with decreases in GBERD showed, on the other hand, a clear trend towards increased excellence of the science base instead of supporting 'industrial production and technology'.
• On the sectoral level, GBERD play a significant role for some sectors and some countries. In the new member states, in particular, government funding accounts for a larger share than the private sector. In France, about one third of BERD in the aerospace sector and in the machinery sector is financed by the government. On the other hand, national strategies also differ greatly – some countries focus their resources on a small number of apparently strategically important sectors, whereas other countries, especially the new member states, support a broad variety of sectors without any obvious industrial policy strategy.
• A specific analytical approach was developed to analyse Member States' policy choices. This reached the following conclusions: General education (all levels of education) and research to support 'industrial production and technology' were the most important priorities on the EU level when comparing the three channels by which public policies can support private sector R&D. The growth rates for university research (GUF budgets) and tertiary education were much lower. These findings suggest priority is placed on direct specific measures in R&D and for a general strengthening of the education system and not specifically on tertiary education. Again, the situation differs when looking at the national level. Here, we can distinguish four groups of countries: The first group shows a clear focus on university research (GUF-chapter) and all general education (all levels of education). This group comprises Finland, Greece, Ireland, the Netherlands and the UK. A second group, consisting of Denmark, France and Germany, shows a clear focus on universities, with the emphasis on tertiary education and university research. The remaining 2 groups each include two countries; on the one hand Austria and Spain, with a strong focus on industry research and tertiary education, and on the other hand Belgium and Sweden with a strong focus both on industry related research and on general education (all

56
levels of education). The limits of the analysis presented do not allow strong conclusions to be drawn with regard to assessing national policy priorities. It is clear that the crude level of aggregation of GBOARD does not allow for detailed analysis – however, these data can be very useful when comparing relative trends. The aim is for the combination of different data sets to produce insightful information about the impacts of past policies on the situation to date. In research policy, priorities are eventually translated into budgets, so that a budget analysis reflects past policy priorities. It would be interesting to analyse in more detail how the observed groups of countries align and/or differ in terms of general economic conditions or their governance structures so as to potentially identify determinants of policy decisions, which should be the ultimate goal for this kind of analysis.
57
Annex 1 Methodological notes Although Eurostat was used throughout this report as the main source of statistical information, the lack of complete time series data for some countries has meant that in some cases we have relied upon data from the OECD and from national statistical agencies. In some cases there was also the need to make estimates that, although statistically questionable, offer the only means for observing trends. The procedures for joining data from different sources and estimating missing values are detailed bellow. Since in most cases the total for the 25 EU countries was not available, a sum of the values for all the available countries was used as a proxy (most frequently the 19 countries - AT, BE, CZ, DE, DK, ES, GR, FR, IE, IT, HU, NL, PL, PT, SE, SI, SK and UK – which, according to Eurostat, in 2003 represent 99% of BERD). Due to the differences between countries in terms of the interval at which data is collected, values for the missing years had to be estimated. In the case of Austria these estimates were based on the growth rate between the years for which data were available (1993, 1998 and 2002). In the case of Germany, Denmark, Portugal and Sweden, the estimates for most of the even years were based on the average of the values (or of the relative weight of sectors, whenever the total was available) of the odd years. 2003 was chosen as reference year in several tables and charts because it is the latest available data for the majority of countries. Regarding the data for BERD, information by sector in 2004 was estimated in most cases (except BE and SI) based on the percentages of each sector in the two preceding years and the total for the country. The EU total by sector was calculated based on the weight of each sector in the two previous years and the growth of the total between 2003 and 2004. In the case of BERD in manufacturing and services, the EU trend was based on the sum of values from 19 countries. Due to the lack of complete time series in Eurostat (data extracted on the 17th October 2006), the relative weight of manufacturing and services from OECD databases was applied to the total BERD figures from Eurostat for BE (1995-1997), CZ (2004), DE (1995-2000), DK (1995-2001), ES (1995-2001), FI (1995-2001) and FR (1995-2001), GR (1995-2002), IE (1995-1998), IT (all years except 2003), NL (1995-2001), PT (1995-2000), SE (1995-2002), SK (2004) and UK (1995-2001). Data from the national statistical office was used for the UK (2004). The values for 2004 had to be estimated based on the trend in the relative weight of manufacturing and services over the two previous years, applied to the official total, in 10 countries (DK, ES, FI, FR, IE, NL, PL, PT,SE). Estimates had also to be made regarding even years in Ireland (2000, 2002) and Sweden (1996, 1998, 2000, 2002), based on the relative weight of manufacturing and services in the odd years. In the case of Austria, estimates for missing years (1995 -1997, 1999-2001, 2003 and 2004) were based on the growth rate between the available years: 1993, 1998 and 2002. On the whole, estimates represent 8.7% of the values of this variable. In order to assess the accuracy of the estimates, a linear model was devised and applied to the available official data to estimate the missing values. In all 11 countries for which estimates were made, the total difference from the linear model was less than or equal to 1%.
58
The 15 NACE sectors mentioned in several tables and charts were selected because they represent around 90% of the EU BERD and business researchers in 2003. The values of BERD in these 15 sectors for the EU are based on the sum of values from 19 countries. Given the absence of a complete time series in Eurostat (data extracted on the 17th October 2006), the relative weight of sectors from OECD databases was applied to the total BERD figures from Eurostat for AU (1993 and 1998), BE (1995-1997), CZ (2004), DE (1995, 1997, 1999, 2004), DK (1995-1999, 2001), ES (1995-2001), FI (1995-2001), FR (1995-2001), GR (1995-1997, 1999, 2001), HU (2004), IE (1995, 1997), IT (all years except 2003), NL (1995-2001), PL (2001), PT (1995, 1996-1998), SE (1995, 1997, 1999, 2001) and the UK (1995-2001). Data from national sources was used in the case of France (only for the telecommunications sector, 1995-2003) and the UK (2004). Some sectors in some countries also had to be disaggregated: sectors 30 to 32 in FI (1997-2004; based on the 1996 ratio); sectors 30 to 33 in NL (1995-2001; based on the 2002 ratio); sectors 30 to 33 in SE (2003; based on the 2001 ratio). Due to the differences between countries in the periodicity in which data is collected, values for missing years had to be estimated. In the case of Austria these estimates were based on the growth rate between the available years: 1993, 1998 and 2002. In the case of Germany, Greece, Ireland and Sweden, the estimates for most of the even years were based on the average of the relative weight of sectors in the odd years, applied to the total (available in official figures for most cases). The values for 2004 for 10 countries (DK, ES, FI, FR, GR, NL, PL, PT, SE and SK) were estimated using a formula that combined the weight of each sector in the past two years and the total number of researchers. On the whole, estimates represent 19.7% of the values of this variable. In order to assess the accuracy of the estimates, a linear model was devised and applied to the available official data to estimate missing values. In 11 of the 13 countries for which estimates were made, the total difference from the linear model was less than or equal to 2%. Only in the Netherlands and Slovakia did the linear model prove unsatisfactory for comparison, since it estimated negative values in several sectors. Regarding researchers by sector in 2004, data were available for almost half the countries (BE, CZ, ES, FI, HU, IE, LV, NL, PL, SI and SK), so the remaining ones were estimated following the procedure described above for BERD. The EU total by sector was calculated based on the weight of each sector in the two previous years and the growth of the total between 2003 and 2004. In order to reconstitute the trends in researcher numbers in manufacturing and services in the EU, values from 19 countries were added. Eurostat data (extracted on 16th October 2006) were supplemented with OECD data in the case of DE (1995 and 1997), DK (1995, 1997-1999), ES (1995-1999), FI (1995-2003), FR (1995-2001), GR (2001), IT (1995-2000), NL (1998-2001) and PT (1995, 1997, 1999). In some cases, the weights of the manufacturing and services sectors were estimated based on the sum of selected individual sectors (see below): BE (1995-1998), GR and IE (1995-2000) and NL (1995-1997). In the case of the UK (1995-2001, 2004), data from national sources were used. The values for 2004 had to be estimated based on the trend in the relative weight of manufacturing and services in the two previous years, applied to the official total, in 6 countries (DE, FR, GR, IT, NL, PT,SE). Estimates also had to be made regarding even years in Germany (1996-2002), Denmark (1996, 2000), Finland (1996), Greece (2002), Ireland (2002), Portugal (1996, 1998) and Sweden (1996, 1998, 2000, 2002), based on the relative
59
weight of manufacturing and services in the odd years. The same procedure was used to estimate the values for Italy in 1997, 2001 and 2002. In the case of Austria, estimates for missing years (1995 -1997, 1999-2001, 2003 and 2004) were based on the growth rate between the available years: 1993, 1998 and 2002. On the whole, estimates represent 20.9% of the values of this variable. In order to assess the accuracy of the estimates, a linear model was devised and applied to the available official data to estimate missing values. In 9 of the 12 countries for which estimates were made, the total difference from the linear model was less than or equal to 2%. In Belgium, Greece and Ireland, the linear model proved unsatisfactory for comparison, since it estimated negative values (Greece) or the sum of manufacturing and services was higher than the official total. The EU trend for researchers in the 15 NACE sectors (selected as representing close to 90% of researchers and R&D expenditure), was based on the sum of values from 19 countries. Due to the lack of a complete time series in Eurostat (data extracted on 16th October 2006), OECD data was used for some countries and some years: AU (1998), DE (1995, 1997), DK (1995-2001), ES (1995-1999), FI (1995-2003; using university graduates in businesses as a proxy for researchers65), FR (1995-2002) GR (2001), IT (1995-2000), NL (1998-1999), PT (1995, 1997, 1999) and SE (1995-2001; using university graduates in business companies as proxy for researchers). Data from national sources was used in the case of France (2002, 2003), the UK (1995-2001) and Italy (2004) 66. Due to the differences between countries in the periodicity in which data is collected, values for missing years had to be estimated. In the case of Austria these estimates were based on the growth rate between the years for which data was available (1993, 1998 and 2002). In the case of Germany, Denmark, Portugal and Sweden, the estimates for most of the even years were based on the average of the relative weight of sectors of the odd years, applied to the total (available in official figures for most cases). Some estimates were also made based on sectoral BERD data and on the BERD/FTE ratio of the closest year: BE (1995-1998), GR and IE (1995-2000) and NL (1995-1997). The 2004 values for 6 countries (AU, DE, FR, GR, PT, SE) were estimated using a formula that combined the weight of each sector in the previous two years and the total number of researchers. Finally, some sectors in some countries had to be disaggregated: sectors 30 to 32 in FI (1996-2004; based on the 1995 ratio, the only one available); sectors 30 to 33 in NL (1995-2000; based on the 2001 ratio); sectors 30 to 33 in SE (1999-2003; based on the 1997 ratio) and sectors 34 and 35 in SE (assuming the first represented 95% of the value). The EU total for some sectors, such as 244 (pharmaceuticals), was based on less than 19 countries, since, for confidentiality reasons, not all countries (e.g. Finland and Portugal) disclose any values. On the whole, estimates represent 25.8% of the values of this variable. In order to assess the accuracy of the estimates, a linear model was devised and applied to the available official data to estimate missing values. In 10 of the 12 countries for which estimates were made, the total difference from the linear model was less than or equal to 3%. In Greece and Ireland, the 65 S&E graduates would have been a more accurate proxy, since graduates in other areas usually do not perform R&D in companies, but this was the only indicator available at OECD. 66 For France, the Bureau des études statistiques sur la recherche et l'innovation, part of the Ministère de l'éducation nationale, de l'ensignement supérieur et de la recherche (http://cisad.adc.education.fr); for the UK, National Statistics, 2006, "Research and Development in UK Businesses, 2004" ; for Italy Istat, 2006 "La ricerca e sviluppo in Italia. Consuntivo 2002 – Previsione 2003-2004"

60
linear model proved unsatisfactory for comparison, since it estimated negative values in several sectors.
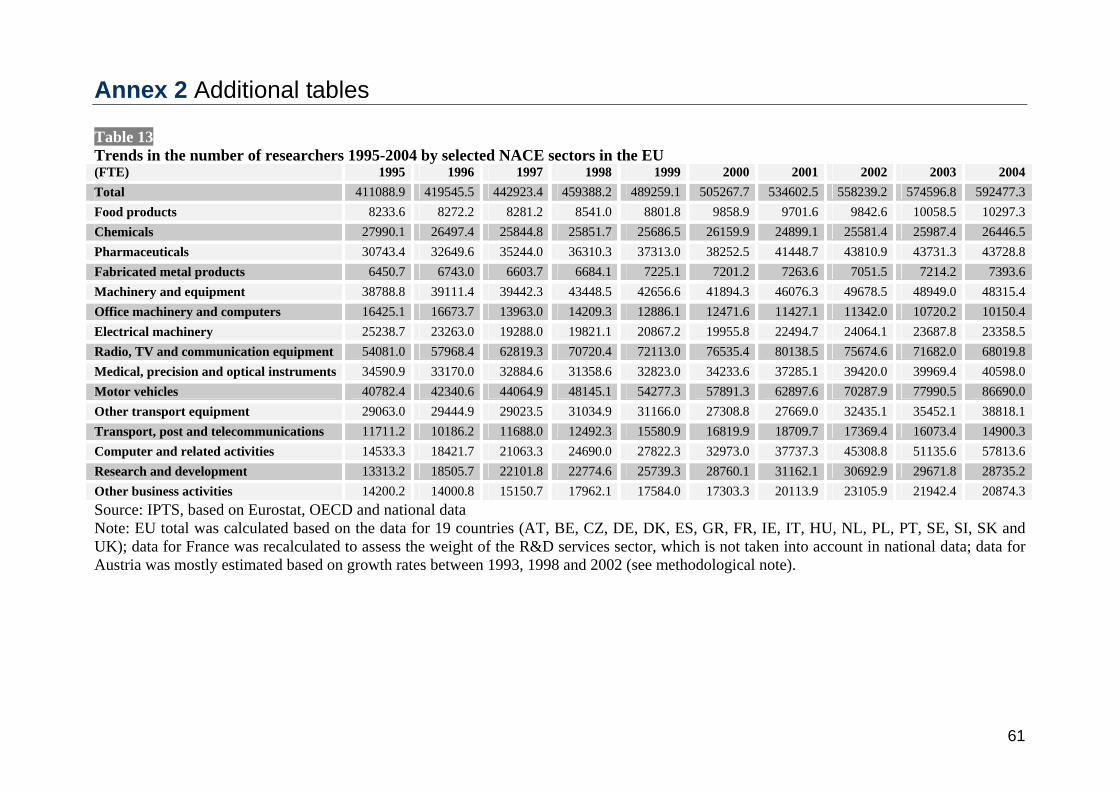
61
Annex 2 Additional tables Table 13 Trends in the number of researchers 1995-2004 by selected NACE sectors in the EU (FTE) 1995 1996 1997 1998 1999 2000 2001 2002 2003 2004 Total 411088.9 419545.5 442923.4 459388.2 489259.1 505267.7 534602.5 558239.2 574596.8 592477.3 Food products 8233.6 8272.2 8281.2 8541.0 8801.8 9858.9 9701.6 9842.6 10058.5 10297.3 Chemicals 27990.1 26497.4 25844.8 25851.7 25686.5 26159.9 24899.1 25581.4 25987.4 26446.5 Pharmaceuticals 30743.4 32649.6 35244.0 36310.3 37313.0 38252.5 41448.7 43810.9 43731.3 43728.8 Fabricated metal products 6450.7 6743.0 6603.7 6684.1 7225.1 7201.2 7263.6 7051.5 7214.2 7393.6 Machinery and equipment 38788.8 39111.4 39442.3 43448.5 42656.6 41894.3 46076.3 49678.5 48949.0 48315.4 Office machinery and computers 16425.1 16673.7 13963.0 14209.3 12886.1 12471.6 11427.1 11342.0 10720.2 10150.4 Electrical machinery 25238.7 23263.0 19288.0 19821.1 20867.2 19955.8 22494.7 24064.1 23687.8 23358.5 Radio, TV and communication equipment 54081.0 57968.4 62819.3 70720.4 72113.0 76535.4 80138.5 75674.6 71682.0 68019.8 Medical, precision and optical instruments 34590.9 33170.0 32884.6 31358.6 32823.0 34233.6 37285.1 39420.0 39969.4 40598.0 Motor vehicles 40782.4 42340.6 44064.9 48145.1 54277.3 57891.3 62897.6 70287.9 77990.5 86690.0 Other transport equipment 29063.0 29444.9 29023.5 31034.9 31166.0 27308.8 27669.0 32435.1 35452.1 38818.1 Transport, post and telecommunications 11711.2 10186.2 11688.0 12492.3 15580.9 16819.9 18709.7 17369.4 16073.4 14900.3 Computer and related activities 14533.3 18421.7 21063.3 24690.0 27822.3 32973.0 37737.3 45308.8 51135.6 57813.6 Research and development 13313.2 18505.7 22101.8 22774.6 25739.3 28760.1 31162.1 30692.9 29671.8 28735.2 Other business activities 14200.2 14000.8 15150.7 17962.1 17584.0 17303.3 20113.9 23105.9 21942.4 20874.3 Source: IPTS, based on Eurostat, OECD and national data Note: EU total was calculated based on the data for 19 countries (AT, BE, CZ, DE, DK, ES, GR, FR, IE, IT, HU, NL, PL, PT, SE, SI, SK and UK); data for France was recalculated to assess the weight of the R&D services sector, which is not taken into account in national data; data for Austria was mostly estimated based on growth rates between 1993, 1998 and 2002 (see methodological note).
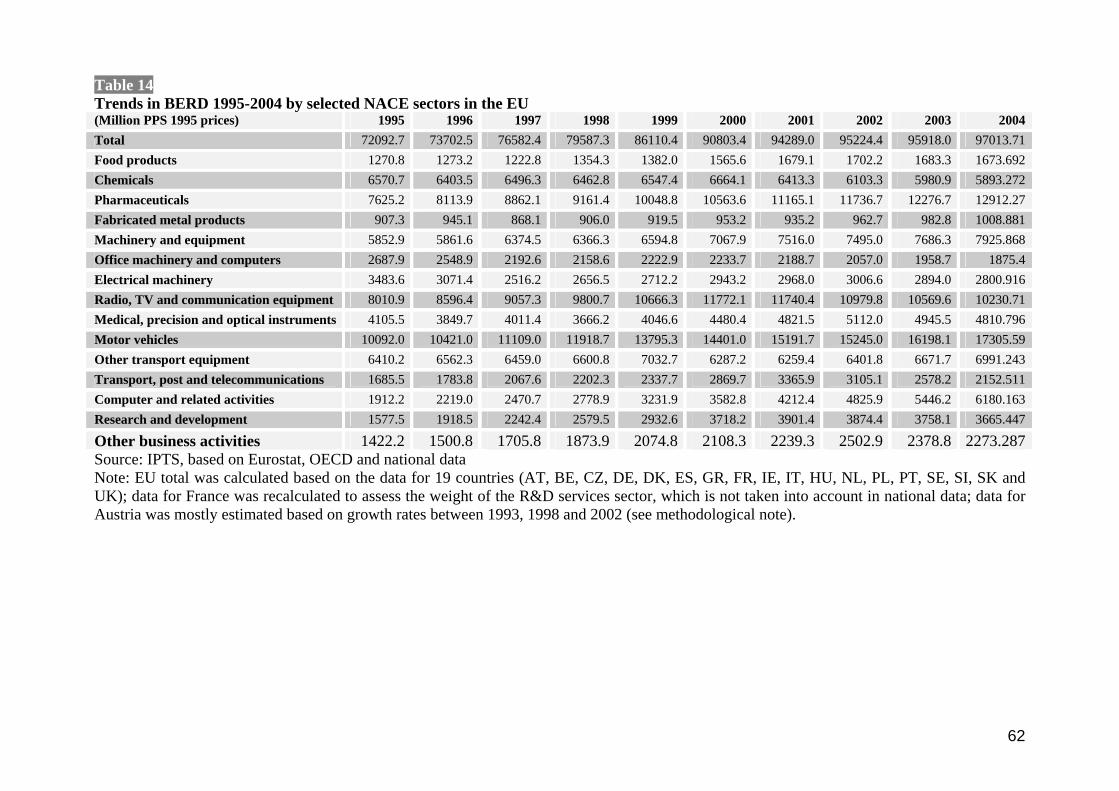
62
Table 14 Trends in BERD 1995-2004 by selected NACE sectors in the EU (Million PPS 1995 prices) 1995 1996 1997 1998 1999 2000 2001 2002 2003 2004 Total 72092.7 73702.5 76582.4 79587.3 86110.4 90803.4 94289.0 95224.4 95918.0 97013.71 Food products 1270.8 1273.2 1222.8 1354.3 1382.0 1565.6 1679.1 1702.2 1683.3 1673.692 Chemicals 6570.7 6403.5 6496.3 6462.8 6547.4 6664.1 6413.3 6103.3 5980.9 5893.272 Pharmaceuticals 7625.2 8113.9 8862.1 9161.4 10048.8 10563.6 11165.1 11736.7 12276.7 12912.27 Fabricated metal products 907.3 945.1 868.1 906.0 919.5 953.2 935.2 962.7 982.8 1008.881 Machinery and equipment 5852.9 5861.6 6374.5 6366.3 6594.8 7067.9 7516.0 7495.0 7686.3 7925.868 Office machinery and computers 2687.9 2548.9 2192.6 2158.6 2222.9 2233.7 2188.7 2057.0 1958.7 1875.4 Electrical machinery 3483.6 3071.4 2516.2 2656.5 2712.2 2943.2 2968.0 3006.6 2894.0 2800.916 Radio, TV and communication equipment 8010.9 8596.4 9057.3 9800.7 10666.3 11772.1 11740.4 10979.8 10569.6 10230.71 Medical, precision and optical instruments 4105.5 3849.7 4011.4 3666.2 4046.6 4480.4 4821.5 5112.0 4945.5 4810.796 Motor vehicles 10092.0 10421.0 11109.0 11918.7 13795.3 14401.0 15191.7 15245.0 16198.1 17305.59 Other transport equipment 6410.2 6562.3 6459.0 6600.8 7032.7 6287.2 6259.4 6401.8 6671.7 6991.243 Transport, post and telecommunications 1685.5 1783.8 2067.6 2202.3 2337.7 2869.7 3365.9 3105.1 2578.2 2152.511 Computer and related activities 1912.2 2219.0 2470.7 2778.9 3231.9 3582.8 4212.4 4825.9 5446.2 6180.163 Research and development 1577.5 1918.5 2242.4 2579.5 2932.6 3718.2 3901.4 3874.4 3758.1 3665.447
Other business activities 1422.2 1500.8 1705.8 1873.9 2074.8 2108.3 2239.3 2502.9 2378.8 2273.287 Source: IPTS, based on Eurostat, OECD and national data Note: EU total was calculated based on the data for 19 countries (AT, BE, CZ, DE, DK, ES, GR, FR, IE, IT, HU, NL, PL, PT, SE, SI, SK and UK); data for France was recalculated to assess the weight of the R&D services sector, which is not taken into account in national data; data for Austria was mostly estimated based on growth rates between 1993, 1998 and 2002 (see methodological note).
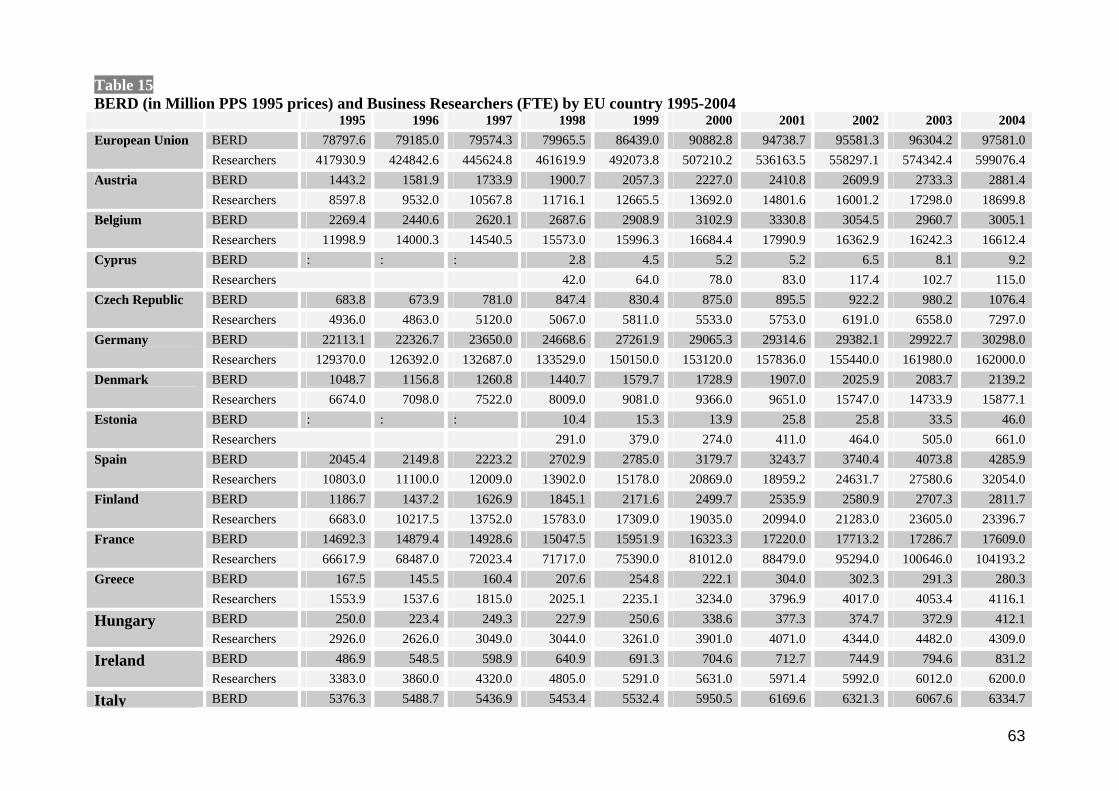
63
Table 15 BERD (in Million PPS 1995 prices) and Business Researchers (FTE) by EU country 1995-2004 1995 1996 1997 1998 1999 2000 2001 2002 2003 2004
BERD 78797.6 79185.0 79574.3 79965.5 86439.0 90882.8 94738.7 95581.3 96304.2 97581.0 European Union Researchers 417930.9 424842.6 445624.8 461619.9 492073.8 507210.2 536163.5 558297.1 574342.4 599076.4 BERD 1443.2 1581.9 1733.9 1900.7 2057.3 2227.0 2410.8 2609.9 2733.3 2881.4 Austria Researchers 8597.8 9532.0 10567.8 11716.1 12665.5 13692.0 14801.6 16001.2 17298.0 18699.8 BERD 2269.4 2440.6 2620.1 2687.6 2908.9 3102.9 3330.8 3054.5 2960.7 3005.1 Belgium Researchers 11998.9 14000.3 14540.5 15573.0 15996.3 16684.4 17990.9 16362.9 16242.3 16612.4 BERD : : : 2.8 4.5 5.2 5.2 6.5 8.1 9.2 Cyprus Researchers 42.0 64.0 78.0 83.0 117.4 102.7 115.0 BERD 683.8 673.9 781.0 847.4 830.4 875.0 895.5 922.2 980.2 1076.4 Czech Republic Researchers 4936.0 4863.0 5120.0 5067.0 5811.0 5533.0 5753.0 6191.0 6558.0 7297.0 BERD 22113.1 22326.7 23650.0 24668.6 27261.9 29065.3 29314.6 29382.1 29922.7 30298.0 Germany Researchers 129370.0 126392.0 132687.0 133529.0 150150.0 153120.0 157836.0 155440.0 161980.0 162000.0 BERD 1048.7 1156.8 1260.8 1440.7 1579.7 1728.9 1907.0 2025.9 2083.7 2139.2 Denmark Researchers 6674.0 7098.0 7522.0 8009.0 9081.0 9366.0 9651.0 15747.0 14733.9 15877.1 BERD : : : 10.4 15.3 13.9 25.8 25.8 33.5 46.0 Estonia Researchers 291.0 379.0 274.0 411.0 464.0 505.0 661.0 BERD 2045.4 2149.8 2223.2 2702.9 2785.0 3179.7 3243.7 3740.4 4073.8 4285.9 Spain Researchers 10803.0 11100.0 12009.0 13902.0 15178.0 20869.0 18959.2 24631.7 27580.6 32054.0 BERD 1186.7 1437.2 1626.9 1845.1 2171.6 2499.7 2535.9 2580.9 2707.3 2811.7 Finland Researchers 6683.0 10217.5 13752.0 15783.0 17309.0 19035.0 20994.0 21283.0 23605.0 23396.7 BERD 14692.3 14879.4 14928.6 15047.5 15951.9 16323.3 17220.0 17713.2 17286.7 17609.0 France Researchers 66617.9 68487.0 72023.4 71717.0 75390.0 81012.0 88479.0 95294.0 100646.0 104193.2 BERD 167.5 145.5 160.4 207.6 254.8 222.1 304.0 302.3 291.3 280.3 Greece Researchers 1553.9 1537.6 1815.0 2025.1 2235.1 3234.0 3796.9 4017.0 4053.4 4116.1 BERD 250.0 223.4 249.3 227.9 250.6 338.6 377.3 374.7 372.9 412.1 Hungary Researchers 2926.0 2626.0 3049.0 3044.0 3261.0 3901.0 4071.0 4344.0 4482.0 4309.0 BERD 486.9 548.5 598.9 640.9 691.3 704.6 712.7 744.9 794.6 831.2 Ireland Researchers 3383.0 3860.0 4320.0 4805.0 5291.0 5631.0 5971.4 5992.0 6012.0 6200.0
Italy BERD 5376.3 5488.7 5436.9 5453.4 5532.4 5950.5 6169.6 6321.3 6067.6 6334.7
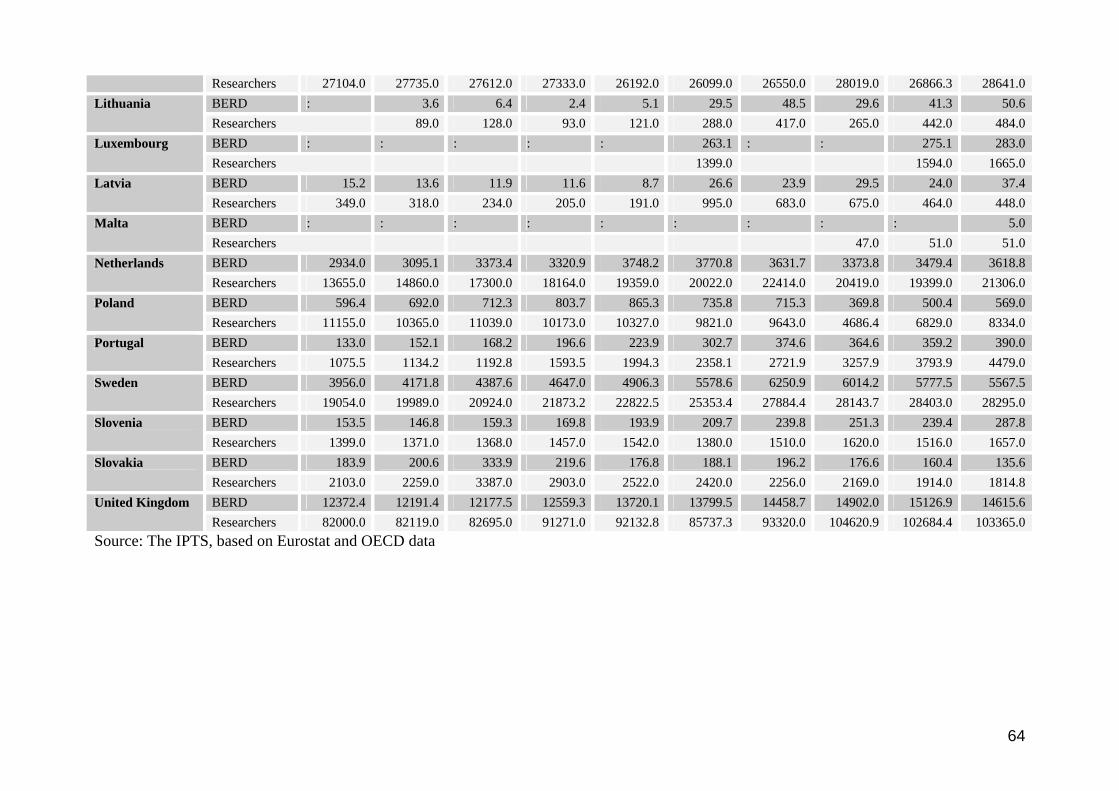
64
Researchers 27104.0 27735.0 27612.0 27333.0 26192.0 26099.0 26550.0 28019.0 26866.3 28641.0 BERD : 3.6 6.4 2.4 5.1 29.5 48.5 29.6 41.3 50.6 Lithuania Researchers 89.0 128.0 93.0 121.0 288.0 417.0 265.0 442.0 484.0 BERD : : : : : 263.1 : : 275.1 283.0 Luxembourg Researchers 1399.0 1594.0 1665.0 BERD 15.2 13.6 11.9 11.6 8.7 26.6 23.9 29.5 24.0 37.4 Latvia Researchers 349.0 318.0 234.0 205.0 191.0 995.0 683.0 675.0 464.0 448.0 BERD : : : : : : : : : 5.0 Malta Researchers 47.0 51.0 51.0 BERD 2934.0 3095.1 3373.4 3320.9 3748.2 3770.8 3631.7 3373.8 3479.4 3618.8 Netherlands Researchers 13655.0 14860.0 17300.0 18164.0 19359.0 20022.0 22414.0 20419.0 19399.0 21306.0 BERD 596.4 692.0 712.3 803.7 865.3 735.8 715.3 369.8 500.4 569.0 Poland Researchers 11155.0 10365.0 11039.0 10173.0 10327.0 9821.0 9643.0 4686.4 6829.0 8334.0 BERD 133.0 152.1 168.2 196.6 223.9 302.7 374.6 364.6 359.2 390.0 Portugal Researchers 1075.5 1134.2 1192.8 1593.5 1994.3 2358.1 2721.9 3257.9 3793.9 4479.0 BERD 3956.0 4171.8 4387.6 4647.0 4906.3 5578.6 6250.9 6014.2 5777.5 5567.5 Sweden Researchers 19054.0 19989.0 20924.0 21873.2 22822.5 25353.4 27884.4 28143.7 28403.0 28295.0 BERD 153.5 146.8 159.3 169.8 193.9 209.7 239.8 251.3 239.4 287.8 Slovenia Researchers 1399.0 1371.0 1368.0 1457.0 1542.0 1380.0 1510.0 1620.0 1516.0 1657.0 BERD 183.9 200.6 333.9 219.6 176.8 188.1 196.2 176.6 160.4 135.6 Slovakia Researchers 2103.0 2259.0 3387.0 2903.0 2522.0 2420.0 2256.0 2169.0 1914.0 1814.8 BERD 12372.4 12191.4 12177.5 12559.3 13720.1 13799.5 14458.7 14902.0 15126.9 14615.6 United Kingdom Researchers 82000.0 82119.0 82695.0 91271.0 92132.8 85737.3 93320.0 104620.9 102684.4 103365.0
Source: The IPTS, based on Eurostat and OECD data

65
Table 16 Evolution of BERD by country 1995 1999 2004
M PPS 95 % M PPS 95 % M PPS 95 % Total 1443.2 2057.3 2881.4 Manufacturing 1098.3 76.1 1543.0 75.0 2017.0 70.0
Austria
Services 267.0 18.5 473.2 23.0 806.8 28.0 Total 2269.4 2908.9 3005.1 Manufacturing 1908.6 84.1 2381.8 81.9 2355.6 78.4
Belgium
Services 322.3 14.2 432.8 14.9 535.7 17.8 Total 683.8 830.4 1076.4 Manufacturing 516.9 75.6 581.6 70.0 658.8 61.2
Czech Republic
Services 150.6 22.0 230.6 27.8 397.2 36.9 Total 22113.1 27261.9 30298.0 Manufacturing 21073.8 95.3 24781.1 90.9 27631.8 91.2
Germany
Services 796.1 3.6 2235.5 8.2 2514.7 8.3 Total 1048.7 1579.7 2139.2 Manufacturing 712.0 67.9 954.1 60.4 1327.4 62.1
Denmark
Services 328.2 31.3 620.8 39.3 676.1 31.6 Total 15.3 46.0 Manufacturing 5.3 34.6 15.5 33.7
Estonia
Services 9.6 62.7 30.2 65.7 Total 2045.4 2785.0 4285.9 Manufacturing 1599.5 78.2 2166.7 77.8 2087.0 48.7
Spain
Services 263.9 12.9 509.7 18.3 2022.3 47.2 Total 1186.7 2171.6 2811.7 Manufacturing 975.5 82.2 1776.4 81.8 2284.4 81.2
Finland
Services 186.3 15.7 343.1 15.8 494.3 17.6 Total 14692.3 15951.9 17609.0 Manufacturing 12976.7 88.3 13673.5 85.7 15501.4 88.0
France
Services 1050.2 7.1 1445.7 9.1 1390.4 7.9 Total 167.5 254.8 280.3 Manufacturing 94.7 56.5 135.0 53.0 192.2 68.6
Greece
Services 58.5 34.9 82.0 32.2 89.7 32.0 Total 250.0 250.6 412.1 Manufacturing 190.7 76.3 188.8 75.3 331.4 80.4
Hungary
Services 11.2 4.5 56.0 22.3 72.5 17.6 Total 486.9 691.3 831.2 Manufacturing 437.2 89.8 518.1 74.9 485.2 58.4
Ireland
Services 46.3 9.5 170.3 24.6 338.0 40.7 Total 5376.3 5532.4 6334.7 Manufacturing 4645.1 86.4 4370.6 79.0 4738.3 74.8
Italy
Services 575.3 10.7 1034.6 18.7 1545.7 24.4 Total 5.1 50.6 Manufacturing 4.0 78.4 29.9 59.1
Lithuania
Services 1.1 21.6 14.2 28.0 Total 15.2 8.7 37.4 Manufacturing 1.1 12.6 10.9 29.1
Latvia
Services 7.6 87.4 26.1 69.8
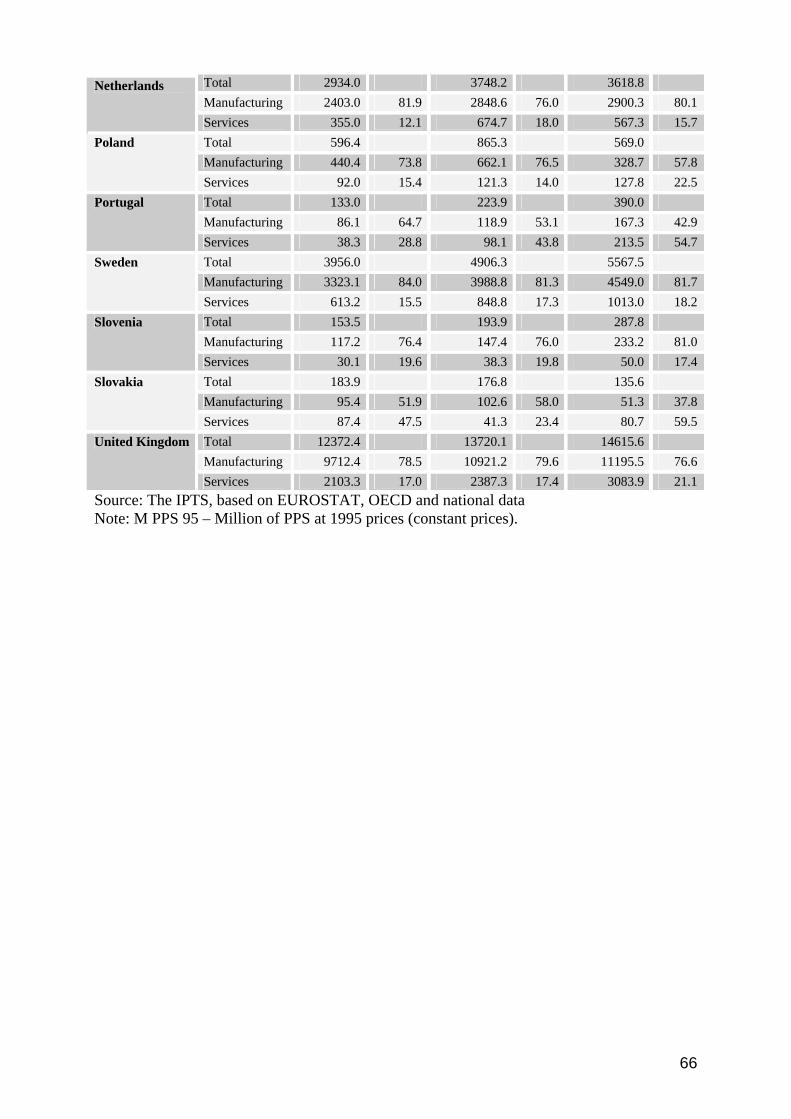
66
Total 2934.0 3748.2 3618.8 Manufacturing 2403.0 81.9 2848.6 76.0 2900.3 80.1
Netherlands
Services 355.0 12.1 674.7 18.0 567.3 15.7 Total 596.4 865.3 569.0 Manufacturing 440.4 73.8 662.1 76.5 328.7 57.8
Poland
Services 92.0 15.4 121.3 14.0 127.8 22.5 Total 133.0 223.9 390.0 Manufacturing 86.1 64.7 118.9 53.1 167.3 42.9
Portugal
Services 38.3 28.8 98.1 43.8 213.5 54.7 Total 3956.0 4906.3 5567.5 Manufacturing 3323.1 84.0 3988.8 81.3 4549.0 81.7
Sweden
Services 613.2 15.5 848.8 17.3 1013.0 18.2 Total 153.5 193.9 287.8 Manufacturing 117.2 76.4 147.4 76.0 233.2 81.0
Slovenia
Services 30.1 19.6 38.3 19.8 50.0 17.4 Total 183.9 176.8 135.6 Manufacturing 95.4 51.9 102.6 58.0 51.3 37.8
Slovakia
Services 87.4 47.5 41.3 23.4 80.7 59.5 Total 12372.4 13720.1 14615.6 Manufacturing 9712.4 78.5 10921.2 79.6 11195.5 76.6
United Kingdom
Services 2103.3 17.0 2387.3 17.4 3083.9 21.1 Source: The IPTS, based on EUROSTAT, OECD and national data Note: M PPS 95 – Million of PPS at 1995 prices (constant prices).
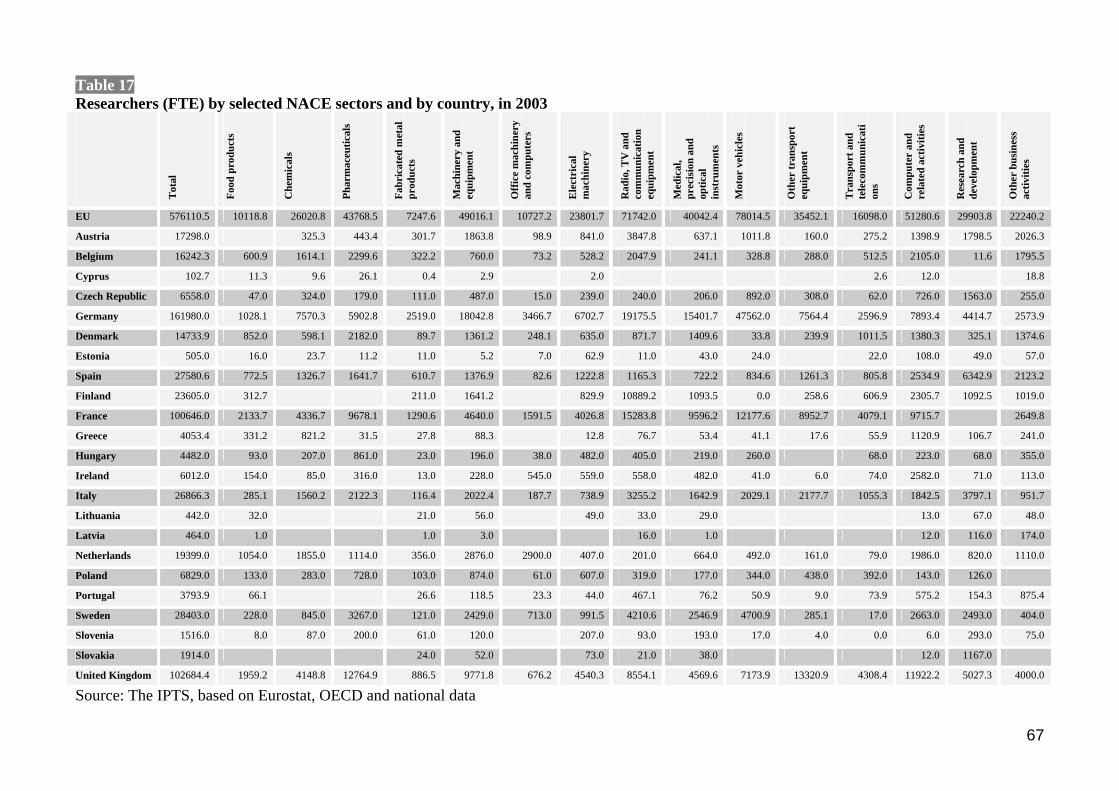
67
Table 17 Researchers (FTE) by selected NACE sectors and by country, in 2003
Tot
al
Food
pro
duct
s
Che
mic
als
Phar
mac
eutic
als
Fabr
icat
ed m
etal
pr
oduc
ts
Mac
hine
ry a
nd
equi
pmen
t
Off
ice
mac
hine
ry
and
com
pute
rs
Ele
ctri
cal
mac
hine
ry
Rad
io, T
V a
nd
com
mun
icat
ion
equi
pmen
t
Med
ical
, pr
ecis
ion
and
optic
al
inst
rum
ents
Mot
or v
ehic
les
Oth
er tr
ansp
ort
equi
pmen
t
Tra
nspo
rt a
nd
tele
com
mun
icat
ion
s
Com
pute
r an
d re
late
d ac
tiviti
es
Res
earc
h an
d de
velo
pmen
t
Oth
er b
usin
ess
activ
ities
EU 576110.5 10118.8 26020.8 43768.5 7247.6 49016.1 10727.2 23801.7 71742.0 40042.4 78014.5 35452.1 16098.0 51280.6 29903.8 22240.2
Austria 17298.0 325.3 443.4 301.7 1863.8 98.9 841.0 3847.8 637.1 1011.8 160.0 275.2 1398.9 1798.5 2026.3
Belgium 16242.3 600.9 1614.1 2299.6 322.2 760.0 73.2 528.2 2047.9 241.1 328.8 288.0 512.5 2105.0 11.6 1795.5
Cyprus 102.7 11.3 9.6 26.1 0.4 2.9 2.0 2.6 12.0 18.8
Czech Republic 6558.0 47.0 324.0 179.0 111.0 487.0 15.0 239.0 240.0 206.0 892.0 308.0 62.0 726.0 1563.0 255.0
Germany 161980.0 1028.1 7570.3 5902.8 2519.0 18042.8 3466.7 6702.7 19175.5 15401.7 47562.0 7564.4 2596.9 7893.4 4414.7 2573.9
Denmark 14733.9 852.0 598.1 2182.0 89.7 1361.2 248.1 635.0 871.7 1409.6 33.8 239.9 1011.5 1380.3 325.1 1374.6
Estonia 505.0 16.0 23.7 11.2 11.0 5.2 7.0 62.9 11.0 43.0 24.0 22.0 108.0 49.0 57.0
Spain 27580.6 772.5 1326.7 1641.7 610.7 1376.9 82.6 1222.8 1165.3 722.2 834.6 1261.3 805.8 2534.9 6342.9 2123.2
Finland 23605.0 312.7 211.0 1641.2 829.9 10889.2 1093.5 0.0 258.6 606.9 2305.7 1092.5 1019.0
France 100646.0 2133.7 4336.7 9678.1 1290.6 4640.0 1591.5 4026.8 15283.8 9596.2 12177.6 8952.7 4079.1 9715.7 2649.8
Greece 4053.4 331.2 821.2 31.5 27.8 88.3 12.8 76.7 53.4 41.1 17.6 55.9 1120.9 106.7 241.0
Hungary 4482.0 93.0 207.0 861.0 23.0 196.0 38.0 482.0 405.0 219.0 260.0 68.0 223.0 68.0 355.0
Ireland 6012.0 154.0 85.0 316.0 13.0 228.0 545.0 559.0 558.0 482.0 41.0 6.0 74.0 2582.0 71.0 113.0
Italy 26866.3 285.1 1560.2 2122.3 116.4 2022.4 187.7 738.9 3255.2 1642.9 2029.1 2177.7 1055.3 1842.5 3797.1 951.7
Lithuania 442.0 32.0 21.0 56.0 49.0 33.0 29.0 13.0 67.0 48.0
Latvia 464.0 1.0 1.0 3.0 16.0 1.0 12.0 116.0 174.0
Netherlands 19399.0 1054.0 1855.0 1114.0 356.0 2876.0 2900.0 407.0 201.0 664.0 492.0 161.0 79.0 1986.0 820.0 1110.0
Poland 6829.0 133.0 283.0 728.0 103.0 874.0 61.0 607.0 319.0 177.0 344.0 438.0 392.0 143.0 126.0
Portugal 3793.9 66.1 26.6 118.5 23.3 44.0 467.1 76.2 50.9 9.0 73.9 575.2 154.3 875.4
Sweden 28403.0 228.0 845.0 3267.0 121.0 2429.0 713.0 991.5 4210.6 2546.9 4700.9 285.1 17.0 2663.0 2493.0 404.0
Slovenia 1516.0 8.0 87.0 200.0 61.0 120.0 207.0 93.0 193.0 17.0 4.0 0.0 6.0 293.0 75.0
Slovakia 1914.0 24.0 52.0 73.0 21.0 38.0 12.0 1167.0
United Kingdom 102684.4 1959.2 4148.8 12764.9 886.5 9771.8 676.2 4540.3 8554.1 4569.6 7173.9 13320.9 4308.4 11922.2 5027.3 4000.0
Source: The IPTS, based on Eurostat, OECD and national data
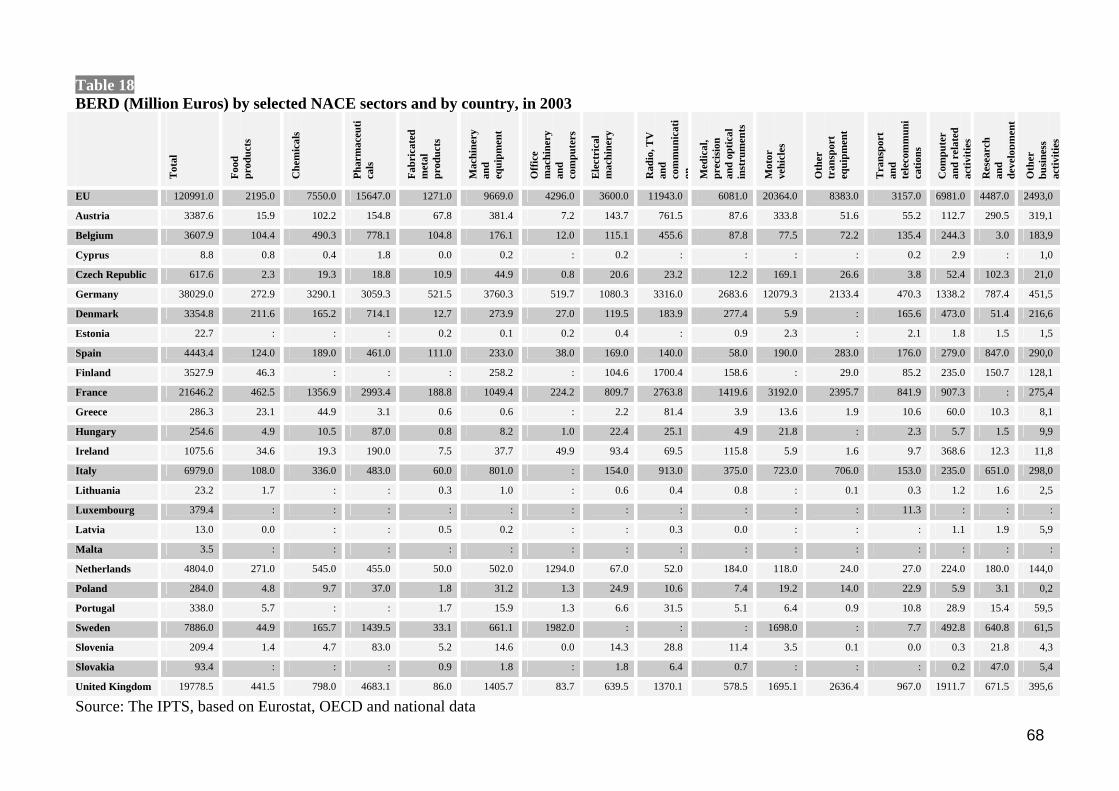
68
Table 18 BERD (Million Euros) by selected NACE sectors and by country, in 2003
Tot
al
Food
pr
oduc
ts
Che
mic
als
Phar
mac
euti
cals
Fabr
icat
ed
met
al
prod
ucts
Mac
hine
ry
and
equi
pmen
t
Off
ice
mac
hine
ry
and
com
pute
rs
Ele
ctri
cal
mac
hine
ry
Rad
io, T
V
and
com
mun
icat
ion M
edic
al,
prec
isio
n an
d op
tical
in
stru
men
ts
Mot
or
vehi
cles
Oth
er
tran
spor
t eq
uipm
ent
Tra
nspo
rt
and
tele
com
mun
ica
tions
Com
pute
r an
d re
late
d ac
tiviti
es
Res
earc
h an
d de
velo
pmen
t
Oth
er
busi
ness
ac
tiviti
es
EU 120991.0 2195.0 7550.0 15647.0 1271.0 9669.0 4296.0 3600.0 11943.0 6081.0 20364.0 8383.0 3157.0 6981.0 4487.0 2493,0
Austria 3387.6 15.9 102.2 154.8 67.8 381.4 7.2 143.7 761.5 87.6 333.8 51.6 55.2 112.7 290.5 319,1
Belgium 3607.9 104.4 490.3 778.1 104.8 176.1 12.0 115.1 455.6 87.8 77.5 72.2 135.4 244.3 3.0 183,9
Cyprus 8.8 0.8 0.4 1.8 0.0 0.2 : 0.2 : : : : 0.2 2.9 : 1,0
Czech Republic 617.6 2.3 19.3 18.8 10.9 44.9 0.8 20.6 23.2 12.2 169.1 26.6 3.8 52.4 102.3 21,0
Germany 38029.0 272.9 3290.1 3059.3 521.5 3760.3 519.7 1080.3 3316.0 2683.6 12079.3 2133.4 470.3 1338.2 787.4 451,5
Denmark 3354.8 211.6 165.2 714.1 12.7 273.9 27.0 119.5 183.9 277.4 5.9 : 165.6 473.0 51.4 216,6
Estonia 22.7 : : : 0.2 0.1 0.2 0.4 : 0.9 2.3 : 2.1 1.8 1.5 1,5
Spain 4443.4 124.0 189.0 461.0 111.0 233.0 38.0 169.0 140.0 58.0 190.0 283.0 176.0 279.0 847.0 290,0
Finland 3527.9 46.3 : : : 258.2 : 104.6 1700.4 158.6 : 29.0 85.2 235.0 150.7 128,1
France 21646.2 462.5 1356.9 2993.4 188.8 1049.4 224.2 809.7 2763.8 1419.6 3192.0 2395.7 841.9 907.3 : 275,4
Greece 286.3 23.1 44.9 3.1 0.6 0.6 : 2.2 81.4 3.9 13.6 1.9 10.6 60.0 10.3 8,1
Hungary 254.6 4.9 10.5 87.0 0.8 8.2 1.0 22.4 25.1 4.9 21.8 : 2.3 5.7 1.5 9,9
Ireland 1075.6 34.6 19.3 190.0 7.5 37.7 49.9 93.4 69.5 115.8 5.9 1.6 9.7 368.6 12.3 11,8
Italy 6979.0 108.0 336.0 483.0 60.0 801.0 : 154.0 913.0 375.0 723.0 706.0 153.0 235.0 651.0 298,0
Lithuania 23.2 1.7 : : 0.3 1.0 : 0.6 0.4 0.8 : 0.1 0.3 1.2 1.6 2,5
Luxembourg 379.4 : : : : : : : : : : : 11.3 : : :
Latvia 13.0 0.0 : : 0.5 0.2 : : 0.3 0.0 : : : 1.1 1.9 5,9
Malta 3.5 : : : : : : : : : : : : : : :
Netherlands 4804.0 271.0 545.0 455.0 50.0 502.0 1294.0 67.0 52.0 184.0 118.0 24.0 27.0 224.0 180.0 144,0
Poland 284.0 4.8 9.7 37.0 1.8 31.2 1.3 24.9 10.6 7.4 19.2 14.0 22.9 5.9 3.1 0,2
Portugal 338.0 5.7 : : 1.7 15.9 1.3 6.6 31.5 5.1 6.4 0.9 10.8 28.9 15.4 59,5
Sweden 7886.0 44.9 165.7 1439.5 33.1 661.1 1982.0 : : : 1698.0 : 7.7 492.8 640.8 61,5
Slovenia 209.4 1.4 4.7 83.0 5.2 14.6 0.0 14.3 28.8 11.4 3.5 0.1 0.0 0.3 21.8 4,3
Slovakia 93.4 : : : 0.9 1.8 : 1.8 6.4 0.7 : : : 0.2 47.0 5,4
United Kingdom 19778.5 441.5 798.0 4683.1 86.0 1405.7 83.7 639.5 1370.1 578.5 1695.1 2636.4 967.0 1911.7 671.5 395,6
Source: The IPTS, based on Eurostat, OECD and national data
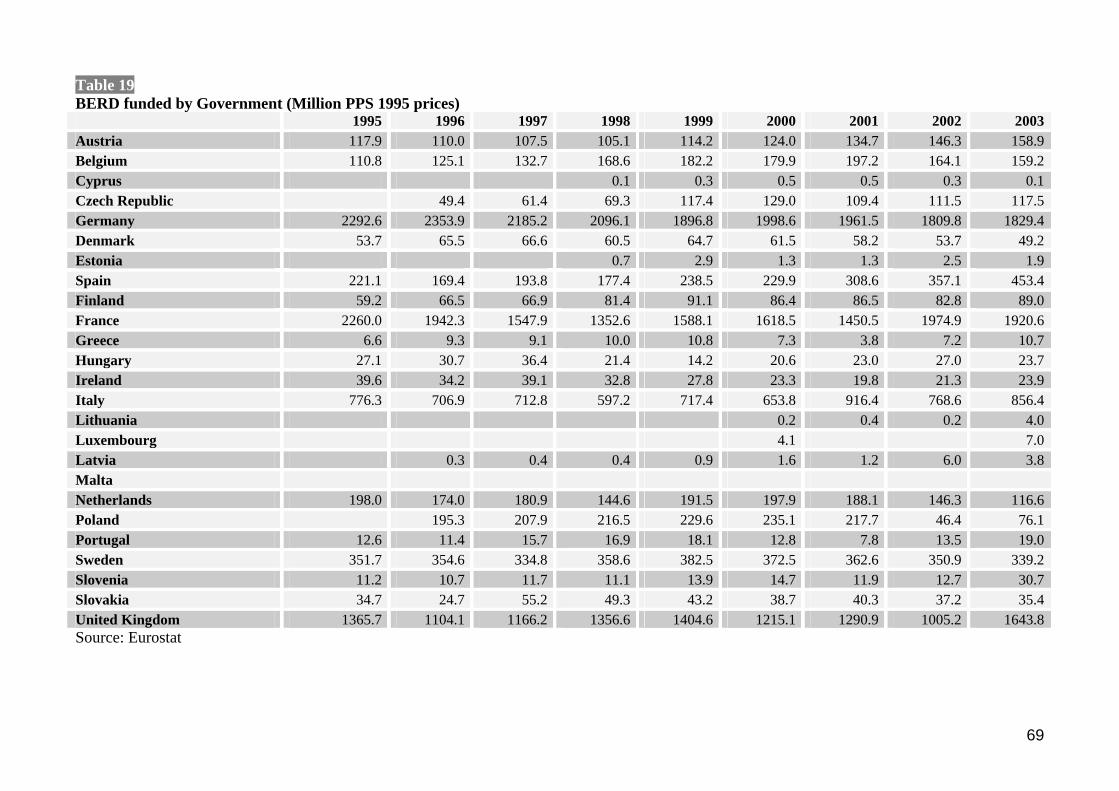
69
Table 19 BERD funded by Government (Million PPS 1995 prices) 1995 1996 1997 1998 1999 2000 2001 2002 2003 Austria 117.9 110.0 107.5 105.1 114.2 124.0 134.7 146.3 158.9 Belgium 110.8 125.1 132.7 168.6 182.2 179.9 197.2 164.1 159.2 Cyprus 0.1 0.3 0.5 0.5 0.3 0.1 Czech Republic 49.4 61.4 69.3 117.4 129.0 109.4 111.5 117.5 Germany 2292.6 2353.9 2185.2 2096.1 1896.8 1998.6 1961.5 1809.8 1829.4 Denmark 53.7 65.5 66.6 60.5 64.7 61.5 58.2 53.7 49.2 Estonia 0.7 2.9 1.3 1.3 2.5 1.9 Spain 221.1 169.4 193.8 177.4 238.5 229.9 308.6 357.1 453.4 Finland 59.2 66.5 66.9 81.4 91.1 86.4 86.5 82.8 89.0 France 2260.0 1942.3 1547.9 1352.6 1588.1 1618.5 1450.5 1974.9 1920.6 Greece 6.6 9.3 9.1 10.0 10.8 7.3 3.8 7.2 10.7 Hungary 27.1 30.7 36.4 21.4 14.2 20.6 23.0 27.0 23.7 Ireland 39.6 34.2 39.1 32.8 27.8 23.3 19.8 21.3 23.9 Italy 776.3 706.9 712.8 597.2 717.4 653.8 916.4 768.6 856.4 Lithuania 0.2 0.4 0.2 4.0 Luxembourg 4.1 7.0 Latvia 0.3 0.4 0.4 0.9 1.6 1.2 6.0 3.8 Malta Netherlands 198.0 174.0 180.9 144.6 191.5 197.9 188.1 146.3 116.6 Poland 195.3 207.9 216.5 229.6 235.1 217.7 46.4 76.1 Portugal 12.6 11.4 15.7 16.9 18.1 12.8 7.8 13.5 19.0 Sweden 351.7 354.6 334.8 358.6 382.5 372.5 362.6 350.9 339.2 Slovenia 11.2 10.7 11.7 11.1 13.9 14.7 11.9 12.7 30.7 Slovakia 34.7 24.7 55.2 49.3 43.2 38.7 40.3 37.2 35.4 United Kingdom 1365.7 1104.1 1166.2 1356.6 1404.6 1215.1 1290.9 1005.2 1643.8 Source: Eurostat

70
European Commission EUR 22937 EN – Joint Research Centre – Institute for Prospective Technological Studies – Directorate General Research Title: Business R&D in Europe: Trends in Expenditures, Researcher Numbers and Related Policies Authors: Alexander Grablowitz, Ana Delicado, Patrice Laget Luxembourg: Office for Official Publications of the European Communities 2007 EUR – Scientific and Technical Research series – ISSN 1018-5593 ISBN 978-92-79-07077-8 Abstract In 2002, The European Union adopted in Barcelona a R&D investment target aiming at a R&D intensity of 3% in 2010 with 2% stemming from the business sector. In order to achieve this target, R&D policy makers are requested to design and implement an appropriate policy mix for supporting and promoting enhanced R&D expenditures of the business sector. Statistical data on Business expenditures on R&D (BERD) and number of researchers in the business sector are key sources for informing policy makers about trends in business sector R&D. This report presents and analyses available statistical data on BERD and number of researchers on both, sectoral and EU Member State level in order to identify learnings for R&D policy makers. In addition, the paper presents a methodological approach for linking information on R&D policy measures aiming to enhance business sector R&D investments with statistical data, notably between R&D policy information presented in the ERAWATCH research inventory and relevant statistical categories i.e. government funding of BERD (GBERD) and the GBAORD chapter on "Industrial production, and technology".
The mission of the JRC is to provide customer-driven scientific and technical support for the conception, development, implementation and monitoring of EU policies. As a service of the European Commission, the JRC functions as a reference centre of science and technology for the Union. Close to the policy-making process, it serves the common interest of the Member States, while being independent of special interests, whether private or national.
LF-N
A-22937-EN
-C