Embed Size (px)
Citation preview

Social Welfare Expenditures in the United States, 1954-55
One measure of a Nation’s concern for the well-being of its people is theproportion of the national output that is devoted to social welfare. Articles reviewing the development of social wel- fare programs in the United States and public spending for these purposes since the mid- thirties have been presented in the Bulletin for February 1953 and for October 1955. The latter article also brings together current information on pn’vate wel- fare expenditures. Both articles (and the brief notes presented annually beginning in October 1951) show the trends in Federal, State, and local government spending for social welfare.
In the following article, social welfare expenditures for the ftscal year 1954-55 are related to those for selected years in the past two decades. This pattern will be followed in annual articles that will appear each October.
T HE expansion of the social in- surance programs continued to be the major factor in the up-
ward trend in social welfare expendi- tures during the fiscal year 1954-55, as it has been since 1950. About one- third of the total dollar increase in social welfare expenditures from 1953-54 to 1954-55 resulted from the increase in old-age and survivors in- surance benefit payments. Social in- surance payments under public pro- grams are now of almost the same magnitude as total expenditures for public education. When veterans’ service-connected pensions and com- pensation are included with social in- surance payments, income-mainte- nance benefits paid without a needs test made up the largest single com- ponent of the total $32.5 billion spent in 1954-55 for social welfare purposes under the definition used here.
Growth and Scope of Social Welfare Programs
One general problem arises in any attempt to take an overall view of what the Nation is doing in the broad fleld of social welfare. There is, in the first place, no sure and generally accepted touchstone for deciding what should be included under the term social welfare. As used here, so- cial welfare programs are broadly de- Aned to include the major public pro- grams directed specifically toward
l Director, Dlvislon of Program Research, Office of the Commissioner.
Bulletin, October 1956
promoting the well-being of individ- uals and families. Programs directed primarily toward economic develop- ment, price support, flood control, law enforcement, and related activities are not classified as social welfare programs, even though they may have important social welfare aspects or consequences. Direct military expen- ditures are also excluded.
Beyond the decisions as to inClu- sion and exclusion of entire pro- grams, there is a problem of internal classification. None of the programs is a completely separate entity, and similar objectives may be approached in different ways and with varying emphases. Our schools provide health services and school lunches; veterans have long been entitled to income- maintenance benefits and welfare services that in one sense represent a cost of war but that are similar in function to benefits now available to other groups in the population; the public assistance programs are be- coming an increasingly important source of publicly provided medical care for individuals; social insurance programs become involved in the pro- vision of medical, rehabilitative, and other services, and so on.
The activities and expenditures of most of the social welfare programs can therefore be grouped and classi- fied in several different ways. The most useful single classification for a continuing series, and the one that has been followed here, seems to be
by IDA C. MERRIAM*
that based essentially on administra- tive structure. Expenditures for the veterans’ program are shown by type of benefit, so that they can be readily regrouped with other public expen- ditures for the same purpose-for ex- ample, pensions and compensation, education, and medical care-if it seems appropriate. Table 1 has also been expanded this year to show sep- arately the amounts spent for medi- cal services under all the programs for which such information is avail- able in sufficient detail?
Social insurance.-The most im- portant factor in the growth of the social insurance programs has been the gradual maturing of old-age and survivors insurance. The United States went much further than most countries have wanted or felt them- selves able to go in making it possi- ble for workers approaching retire- ment age at the time the system was started to acquire full beneflt rights. Nevertheless, in part because of lim- ited coverage at the outset, it has taken the program 18 years to reach the point at which nearly 55 percent of the persons reaching age 85 have insured status as workers and per- haps another 20 percent are eligible for secondary benefits. This propor- tion will continue to grow for some years.
The successive increases made in the old-age and survivors insurance benefit amounts in 1950, 1952, and 1954 served first to bring benefits back into line with increased living costs and then-except for the higher-paid groups-to reflect a considerable part of the rise in wage levels and national output that has occurred since 1940. Such increases have been implicit in the cost estimates accepted by Con- gress as the financial basis for the
1 This detail has previously been pub- lished in other tables prepared by the M- vision of Program Research (see, for ex- ample, table 4 in the Ann4 Stotistieal SUP- plement. 1955 (Social Secwity Bulletin), 1956.
page 8) but has not been shown earlier in the series.
3

program, and it is reasonable to look for similar adjustments of benefit levels in the future. The effect of the 1954 amendments-both the expan- sion of coverage and the increase in beneilt levels--shows up in the 1954- 55 old-age and survivors insurance expenditures, which were 32 percent higher than those in the preceding fiscal year, in contrast to the 24-per- cent rise from 1952-53 to 1953-54.
The other social insurance pro- grams have also grown in importance since 1940. Though the railroad re- tirement system started with a large beneficiary group taken over from the private pension plans of the rail- roads, it has expanded its coverage of the risks of disability and death and its benefit levels also have been raised as wage levels have gone up. The number of government employees covered by special retirement sys- tems has increased substantially, with a growing number of the State and local systems now being supplemen- tary to old-age and survivors insur- ance. Public provisions for temporary disability insurance, starting in Rhode Island in 1943, now cover more than one-fifth of the Nation’s employees.
Under the impetus of the tax-off- set provisions of the Social Security Act, all the States had adopted un- employment insurance laws and were paying benefits by July 1939. Since that time the major fluctuations in unemployment beneflt payments from Year to year have resulted from changes in employment conditions, although there have been some ex- tensions of coverage and increases in benefits. The sharp rise in unem- ployment benefit payments during 1953-54 and the further increase in 1954-55 resulted primarily from the recession that occurred in 1954. Pay- ments from Federal funds in 1954-55 included $19 million paid to unem- ployed Federal workers under an amendment to the Social Security Act adopted in 1954.
Workmen’s compensation was the first social insurance program for workers in industry and commerce in the United States, as in most other countries. The program developed on a State-by-State basis, and it was not until 1948 that all States had such legislation. (A Federal system for eIIIPlOYeeS of the Federal Govern-
4
ment was adopted in 1908.) The growth in total workmen’s compensa- tion payments from $174 million in 1934-35 to $970 million in 1954-55 re- sulted from expansion of coverage both through additional State pro- grams and through amendment of existing legislation, rising payrolls and wages on which cash benefits are based, increasing costs of hospitali- zation and medical care, and changes in statutory benefit provisions.’
Education.-Throughout most of this century and earlier, public ex- penditures for education have been larger than the outlays for any other social welfare program. In 1929, ex- penditures for education amounted to about 60 percent of the total spent for social welfare. With the growth of other types of welfare Programs, expenditures for education represent a smaller but still substantial Part of all government expenditures for wel- fare-about one-third in 1954-55. If the special education benefits Pro- vided to veterans of World War II and the Korean conflict are included, expenditures for education in some recent years take on even greater rel- ative importance.
Except for the veterans’ Program benefits, about 97 percent of all pub- lic expenditures for education in 1954-55 were from State and local funds. The Federal expenditures in- clude the amounts spent for the Gf- fice of Education, Indian schools, Fed- eral grants for land-grant colleges, vocational education, and construc- tion of schools in Federally impacted areas, and a few smaller items. State and local expenditures for education increased from $7.2 billion in 1949- 50 to $10.5 billion in 1954-55, with construction outlays accounting for about one-seventh of the total in 1949-50 and about one-fifth in the most recent year.
Veterans’ programs.-One-third of the Federal social welfare expendi- tures in 1954-55 went into the vet- erans’ programs, with pensions and compensation accounting for about 63 percent of the total outlay for veterans. Readjustment allowances,
2 See Dorothy McCamman and Alfred M. Skolnik. “Workmen’s Compensation: Meas- ures of Accomplishment,” Social Secusity
Bulletin, March 1954.
which in 1945-46 and 1946-47 were almost as large as pension and com- pensation payments, have been of negligible importance in recent Years. Jn the past 3 years this part of the program has shown net refunds. Be- ginning with 1952-53, unemployment benefits for Korean veterans have been paid through the Bureau of Em- ployment Security of the Department of Labor, with the State employment security agencies acting as agents of the Federal Government in the ad- ministration of the programs. Ex- penditures for veterans’ education benefits reached a peak of $2.8 bil- lion in 1948-49 and did not fall be- low $1 billion until 1952-53.
Health. -Public expenditures for health and medical services under the programs directly identifled as health programs amounted to $3.3 billion in 1954-55. Of this amount more than $3.0 billion came from State and local funds, and a little less than $300 million-a substantial part of which represented grants in aid to the States-from Federal funds.
The largest part-almost $1.8 bil- lion-of the expenditures was used for the provision of hospital and medical care in mental, tuberculosis, and general public hospitals. About $1.1 billion went into community health and sanitation services, in- cluding the activities of State and lo- cal public health departments, food and drug inspection, and the current operating costs of water and sewer systems. Capital outlays for water and sewer system construction-to- taling in recent years about $800- $1,200 million a year-are not, how- ever, included in the series. It is rec- ognized that this is a debatable deci- sion and that for certain types of studies or comparisons these amounts would appropriately be included. Ex- penditures for construction and capi- tal improvements for hospitals and clinics are included here. They amounted to $387 million in 1954-55. The remainder of the amount shown in table 1 under health and medical services is accounted for by two spe- cial health programs-maternal and child health services and services for crippled children-administered by the Children’s Bureau in the Social Security Administration.
Social Security
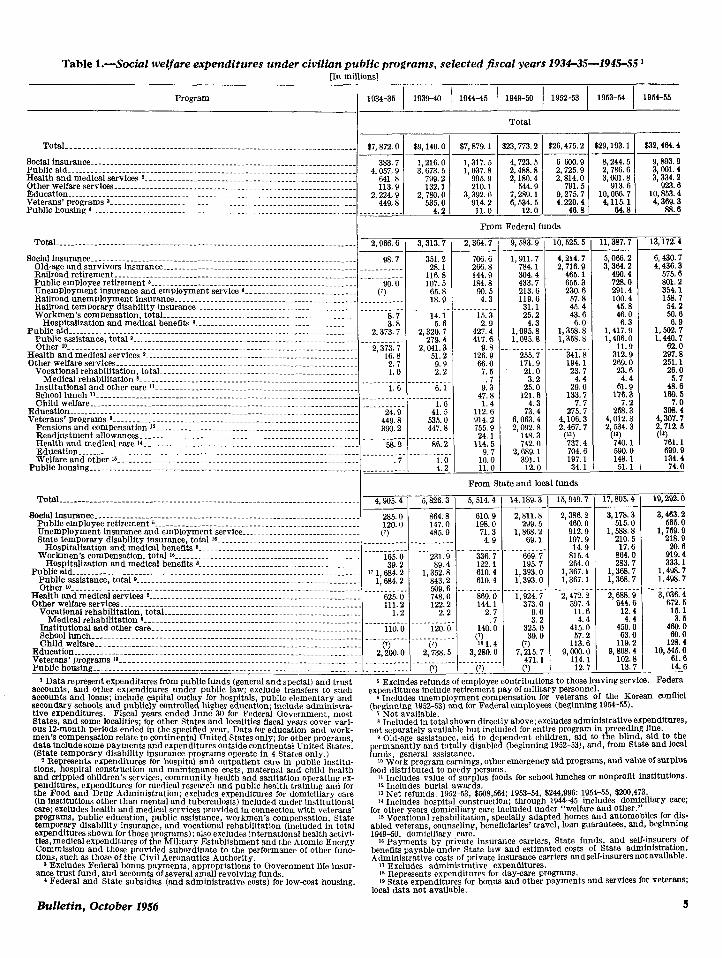
Table l.-Social welfare expenditures under civilian public programs, selected jiscal years 1934-35-1945-55 l [In millions1
1934-35 1 193940 1 194445 1 1949-50 ) 1952-S I 1953-54 I 1954-55
Total
program .-
-
z
-
_
_
_
-
- _ .
_
.
- .
. ._
. ._ ._ ._ ._ __ _- _- _- -- _-
x-
37.872.0 1 $9.140.0 1 $7.879.1 $23.773.2 $26,475.2 $29,193.1 1 1 1 1 $32,464.4 Total---- ___.-.-______..__----..-----.-.----....~ ..__.....____.____. __..__ _.
Social in~wlce .~----~~~.._.~~--..~~~~ .-.. --. . ..____ .-.-- . . ..__. _______ .___ __--. - . I’UbllC 81~...~...~-----..----....------..-----...---..~-.....~~~~..~.~~.~.-~~~~~... Health and medical services *_ _. _ ___ . . .._.. _...___. .._.__.._ .__. -_.-..- ____ .._. _. Otherwelfareservices.-------.-.---..-.---...-----..---...----..-.~---..~~....~~~. lcducation- ._._____....____.._.-.-...----....---...-.---..-.- . ..___ -- .___...______ Veterans’ programs a---.--...----------...---.....---.-.----....---...--.-.---.--. Public housing 4. _________. .._____._.____..__. _ .- __.____....__ _._.___. .___ _-.
-I--l----L 383.7 1,216.O 1,317. 5
4,057.g 3, 1,037,s 641.8 p: 2” 995.9 113.9 132.1 210.1
2,224.g 2,78&o 3,392.6 449.8 535.0 914.2
4.2 11.0
9,893.g 3, cm. 4 3,334.2
923.6 ‘4 p; ;
’ 38:s
4,723. 5 2,488.8 2,180.4
544.9 7,289.1 6,534.5
12.0
From Federal funds -
9 2.966.6 I 3.313.7 2,364.7 ,
98. 7 351.2 706.6 .- .____-.- 28.1 266.8
116.8 144.9 90.0 107.5 184.8
(7) 65.8 90.5 ..--.__--- 18.9 4.3
1,911. 7 784.1 304.4 433.7 213.6 119.6 31.1 25.2
4.3 1,095.8 1,095.8
10 , . Total ._______ __________ _______ .___ -- ____..____ . .._. -- __...._._ ______..._____
Socia]insuranee.~~...~..~.-.~.~~..~~~.~....~......~~~-~~....~.-.-.~.---~~~......~. Old-age andsurvivors insurance...~.~--..~~.....~~~.~...~..--..~~---~~~.....~~.. Railroad retirement ____. ..__. -..-- _.______...._ -._._ ._.....__..___....._-...... PublicemP]oyeeretirement~.....~.~.-.~-...~.~..~.~~.~.....-..-~~~-........~-~. Unemployment insurance and employment service 6 ____... -...-__- . ..________.. Railroad unemplowent insurance-.... .___.....__ -._.-__ _-. . . . ._-.. __ .._. __. _ _. Railroad temporary disability insurance.... _.____. --__.-.- . . ..___._.....______.. Workmen’s compensation, total _... __.____.___ ..______.._ ___._____........._.
Hospitalization and medical benefits 8 __...__._. --._ _.-._-. .-_. _- __...._.__ _.. Public sid _.___________..___._-..-.-----.-...........-----.-------. _ ___. -- ._._._ --
Publicassistance,total~.....~.~...~~..~.~.~.~~~.~~~.~...~.~~~~~.~~-..---..~~~-- Other ‘0 ._...__.___..____ -.- . .._.__ -._-- ____...___. ._...__.._____.___._...-----
Health andmedicalservices ).-------.--.----.....---..--..-...-----.----....-.-.. Otherwelfareservices---.--.- ______ ._.__ __..______. _.____ -.-- ___..._.._.____._
Vocational rehabilitation, total .___ --- __......__ . . . ..__._ -- . . . .._.__....__.._.. Medicalrehebilitation~.. . ..______ .______.________..._-.. -.-._-.-- _._....___
Institutiona]sndothercare~*~- ______ __..__....... . . . . .._ --- _._._ ____.._____ School lunch ‘I_________._________.___ ___..._____ -- . .._._... _.._.___._...___.. Childwelfare ___.___ ---.- ____ .______ _____....__ _..____..... ___._....____._..
Education .._____ .____ -- _________. ._______....___. -.- _... -.- ..__._ _._..._.___.. Veterans’progrems ~.-.~~~~-.~...~~~~~.--.....--........--~~~~..~~~-.-..--....~~~
Pensions and compensation I~----- .___ ..__....._ __..__ ._._ -_- _..____._____.. Resdjustmenta]lowances~.~.~.---..~-~~~~~~..~.~~~~....~-...-~.~.~...~..~~~~.. Health andmedlcalcare~~..-~~..-.-~-~.~.~.~~~.~~..~~.--...~~~...~~~~..~~..~.. Education ___..__...._.______..--..-.-. .--..... ___. ____ __ ..___ Welfare andother lr.-.-------...-.------..---.--...---....----.---..----....---
Public housing ___..________ ___..._._.__________--.-----. _...__ .___ ._.____..___._
11, -i- 13,172.4
5,066.2 3,364.2
490.4 728.0 291.4 100.4 45. 8 46.0 6.3
1,417.g 1,406.O
11.9 312.9 269.0 23.6
4.4 61.9
176.3
25% 4,012.3 2,534.3
(‘9 740.1 590.0 148.1 51.1
6,430.7 4,436.3
575.6 801.2 354.1 153.7 54.2 50.6 6.9
1,502. 7 1,440.7
62.0 297.8 251.1 26.0
4::; 169.5
30:: ! 4,307.7 2,712. 6 (‘9
761.1 699.9 134.4 74.0
17. -
_ _.
-
- 3,178.3
515.0 1,5%3.8
210.5 17.6
864.0 283.7
1,368.7 1,368.7
19.292.0
2,688.g 644.6
12.4 4.4
450.0 63.0
119.2 9,808.4
102.8 13.7
-
-.
-
3, -g ;
1,759.g 218.9
20.6
2:: 1,498: 7 1,498.7
_ _ _ _ _ _ -. 3,036.4
%: f 3.5
460.0 69.0
128.4 10,545.o
61.6 14. 6
-
8.7 14.1 3.8 5. 6
2,373.7 2,320.7 _______--- 279.4
2,“:;: ;( 2,“,;:; 2.7 9.9 1.0 2.2
------i:6-1---------- 6. 1
_- -.. 15.3 2.9
427.4 417.0
9.8 126.9 66.0 7.5
9:; 47.8
1.4 112.6
, 914.2 755.9 24. 1
114.5
_______--- 24.9 4:::
449.8 535. 0 390.2 447.8
58.9 86.2 _.__._.._. -.-.-.-i:~
.7 4.2
)- 9.7
10.0 , 11.0 -
4,214.7 2,716.g
465.1 655.3 230.6
57.8 45. 4 43.6 6.0
1,358.8 1,358.8
_____. -._ 341.8 194.1 23.7
4.4 29.0
133.7 7.7
275.7 4,106.3 2,467.7
(9 737.4 704.6 197.1 34. 1
255.7 171.9 21.0 3.2
25.0
12:: 3” 73.4
6.063.4 2,092.a
148.3 742.0
2,689.1 391.1
12.0
From State and local funds
14 L Total ___.________________-------.--------.-.-----.---..-.-------.-.--- -__ _...__. 15
2,386.2 460.0 912.9 197.9 14.9
815.4 264.0
1,367.l 1,367. 1
___- ._.__ 2,472.2
597.4 11.6 4.4
415.0 57.2
113.6 9,000.0
114.1 12.7
5
610.9 2,811.8 198.0 299.5 71.3 1,868.2 4.9 69.1
336.7 122.1
E: i . _ _ _ _ _ _ -
869.0 144.1
2. 7
140: ?I
‘3 1 4 3,286.0
_- ______. (9
_
-
669.7 195.7
1,393.o 1,393.0
_- _._._.. 1,924.7
373.0 9.0 3.2
325.0 39.0
7,015.7 471.1 (‘1
4.9054 I 5,826.3 .-
-
Social insurance _____..____ ____ _.___.________ _ ._____...___..______-.---. -_- __.. _. Publicemployee retirernent~..-~.~.~~~~...~.--.-..~-~~~.~~~~.~..~~~~...~~~~~~~. Unemployment insurance and employment service-. _.._ .._...____...__._ ___ State temporary disability insurance,~totsl 16.----.-- _.___ --_.- ____.._____.__ __.
Hospitalization andmedicalbeneflts a--- _.__.._..._.._....... ~~~~~~~~~~ Worktien’scompensation, total I~---- .__..______________.. [IILII-.IIIIIII:::II:
Hospitalization and medical benefits 8 _.____....._ _ _.___._._____.______..--... Publicaid __.._______..______________ -.-- ________.____ _._.__. -.- ____...__...____.
Public assistance, total 0 ..____ -_.-._.- ._____..____ -.__- _... ___..____._..__..__. Other 1Q------.-.---...-------------.-----.-..---..---.-..------.-.---.-.---....
Health and medical services SM. ______ .____..____ ._.__. ..- ____ .._ __... .._.___ .._ Other welfare services..-----.---.-.-------.------------.-.--......--..-.--....--
Vocational rehabilitation, total ______ _________.____ _ __..___._. -__- ___.__...___ Medical rehabilitation 8_--.------.------_--...-.---...---....-----..--....-.
Institutional and other care _________..._______..--.-..------...- . ..__......__ Schoollunch- __...____._______.__-. __.___..__..___ _ ..____. --.__- .__......____ Child we]fare--.--...----.--.------.-..----..-.---.-.---....-.-.....-.....-.--
Education .___________.___ -- ____._____._._______..--- _.__ ------- _.__......__..__ Veterans’programs *~~--_--.~~~~~~~~~~~.~-----..~~~--~~...-...~~..~~..~~.~~~~~.. Publichousing ._______.__ ._._________.____...-.-.--- ___.-_.- ._.._.._.......___.
285.0 864.8 120.0 147.0
(‘1 485.9
._._-.-____ 165.0
.---m3i:9.
39.2 89.4 11 1,684.2
1,634.2 1, ;,“t;
_ 509.6 625.0 748.0 111.2 122.2
1.2 2.2
110.0 120.0
I Data represent expenditures from public funds (genera] and special) and trust Federa eCCOUnts, and other expenditures under public law; exclude transfers to wch
6 Excludes refunds of employee contributions to those leaving service.
BCCOUnts and loans; include capital outlay for hospitals. public elementarv and expenditures include retirement pay of military Personnel.
6 Includes unemployment compensation for veterans of the Korean conflict &,&mine 1952-531 and for Federal employees (beginning 1954-55). ‘~i’fiot a&able.
secondary schools and publicly controlled higher educaticn; include admixiistra- tive expenditures. Fiscal years ended June 30 for Federal Government, most States. and some localities: for other States and localities Asral wars cover vari- 8 Included in total shown directly above; excludes administrative expenditures,
not separately available but included for entire program in preceding line. 9 Old-age assistance, aid to dependent children, aid to the blind, aid to the
permanently and totally disabled (beginning 1952-B), and, from State and local funds, general assistance.
ous 12:month periods endeb in the specified year. D&e for education and work- men’s compensation relate to continental United States only; for other programs, data include some payments and expenditures outside continental United States. (State temporary disability insurance programs operate in 4 States only.)
2 Represents expenditures for hospital and outpatient care in public institu- tions, hospital construction and maintenance costs, maternal and child health and crippled children’s services, community health and sanitation operating ex- penditures, expenditures for medical research and public health training and for the Food and Drug Administration; excludes expenditures for domiciliary care (in institutions other than mental and tuberculosis) included under institutional care; excludes health and medical services provided in connection with veterans’ programs, public education, public assistance, workmen’s compensation, State temporary disability insurance, and vocational rehabilitation (included in total expenditures shown for those programs); also excludes international health activi- ties. medical expenditures of the Militarv Establishment and thP Atomic Rnerev Cotimlssion arid those provided subor&nate to the performance-~orther-~~~- tions, such as those of the Civil Aeronautics Authority,
10 Work program earnings, other emergenoy aid programs, and value of surplus food distributed to needy persons.
11 Includes vslue of surplus foods for school lunches or nonprofit institutions. 12 Includes burial awards. 13 Net refunds: 1952-53, $508$X; 1953-54, $244,996: 1954-55, $200,473. I+ Includes hospital construction; through 1944-45 includes domiciliary Care;
for other years domiciliary care included under “welfare and other.” 15 Vocational rehabilitation, specially adapted homes and automobiles for dis-
abled veterans counseling, beneficiaries’ travel, loan guarantees, and, beginning 1849-50, domidiliary care.
* Excludes Federal bonus payments, appropriations to Government life insur- ance trust fund, and accounts of several small revolving funds.
4 Federal and State subsidies (and administrative costs) for low-cost housing.
16 Payments by private insurance carriers, State funds, and self-insurers Of benefits payable under State law and estimated costs of State administration. Administrative costs of private insurance carriers andself-insurersnot available.
17 Excludes administrative expenditures. 18 Represents expenditures for day-care programs. 19 State expenditures for bonus and other payments and services for Veteran&
local data not available.
Bulletin, October 1956 5

When account is taken of the ex- penditures for medical care under workmen’s compensation programs, the hospitalization benefits paid un- der temporary disability insurance in California and New York, vendor pay- ments (direct payments to the pro- viders of medical services) under public assistance, medical services provided under the vocational reha- bilitation program, and medical care provided to veterans, the total iden- tifiable expenditures for health and medical services under civilian pub- lic programs for 1954-55 become $4.7 billion.
[In millions]
Total _______ _ ___-_ I$4,676.9/ ‘$3,%X3.6 1$l,67L6/
Public health pro- grSms _________.__ 3,334.2
Hospital end medi- cal cme- _._____-_- 1.777.1
HcsDital ccnstrue- I I
287.8 3.036.4
70.9 1,766.2
So.8 306.0
1.
Gi Hospital construc-
tion- ____________ Public assistance
(vendor psy- mentsl____________
Federallv aided pro- gramsl_..-S-L..
Qeneral assistance~ Workmen’s compcn-
sation (hospital end medical care)
Vocational rehabili- tation program Cmedicsl rehsbil-
23. 69.2
122.5 955.0 761.1 _ .________
728.1 _______ -__
33.0 _-_- _.____
211.9
145.6 66.3
346.0 6.9 * 333.1
Temporary disahilit 6.7 3.5
______ ‘20.6
1 Total excludes public a!&tance vendor psy- merits; distribution by source of funds not avallsble.
2 Includes amounts paid by private insurance carriers and self-insurers under public Programs but not from public funds-about $265 million for workmen’s compensation and $14.6 million for State temlhxarg disability insurance Programs.
To the flgures in this tabulation should be added possibly $70 million for school health services provided through State and local school au- thorities and included in the figures for education in table 1. Reported expenditures for school health serv- ices were $32 million in 1951-52 and $58 million in 1953-54.
Expenditures for health services from public funds would be smaller
6
than the figure shown for expendi- tures under public programs with the exclusion of the amount of work- men’s compensation medical benefits paid by private insurance carriers and self-insurers (about $265 mil- lion in 1954-55) and the hospital and medical beneAts privately insured un- der the California and New York State temporary disability insurance programs (about $14.6 million).
Information is not available on what part of the vendor payments for medical services under the public as- sistance program came from Federal or from State and local funds since, in the matching provisions that have been in effect, no distinction is made between vendor payments and cash assistance payments.3 Total vendor payments were $155 million, $175 mil- lion, and $212 million in the Ascal years ended June 30, 1953, 1954, and 1955, respectively. In addition to these payments, which the public as- sistance agencies made directly to the suppliers of services, the public assistance agencies make allowances for medical care in determining mon- ey payments to recipients. An esti- mated $100 million was thus included in assistance budgets for medical serv- ices in the four Federally aided cate- gories in 1953-54 and 1954-55. These amounts are included as assistance payments in table 1 but are not counted as health expenditures in the tabulation above.
Expenditures by the Department of Defense for medical care for members of the Armed Forces (and to a very limited extent for other persons) amounted to $266 million in 1954-55. These sums and the approximately $25 million spent by the Atomic En- ergy Commission for medical re- search-primarily on problems of special concern to the Armed Forces -have not been included in this series. Small amounts spent by vari- ous Federal agencies for employee health programs or for medical or quasi-medical research (by the De- partment of Agriculture, for exam- ple) are also omitted.
Surplus agricultural commodities. -The value of surplus agricultural
s The 1956 amendments that provide for special matching of vendor payments go into effect July 1, 1957.
commodities distributed to school lunch programs, to nonprofit insti- tutions, and to needy persons has been included this year for the flrst time in table 1 under the expendi- tures shown for school lunches, insti- tutional care, and other public aid, respectively. While the basic purpose of price-support legislation is the stabilization of the agricultural econ- omy-and therefore in a series show- ing all government expenditures these amounts would more appropriately be classified as agricultural-the spe- cific welfare uses of the surplus com- modities has come to be so definitely recognized in recent legislation that their inclusion here seems desirable.’
Public housing.-Another addition to table 1 is expenditures for public housing.6 These data were omitted from the earlier articles only because the staff time necessary to develop estimates comparable with the flg- ures for other programs had not been available. A major problem in ana- lyzing public housing expenditures results from the fact that the annual amounts shown in the reports of the Bureau of the Census and elsewhere for State and local government ex- penditures in this field are gross rather than net flgures. They rep- resent primarily funds borrowed through public bond issues for low- rent public housing construction, which will be more than repaid from future operations of the projects. From the point of view of the housing program, the stimulating effect of State and local government action authorizing and encouraging public housing authorities is of basic im- portance. It is only the net monetary costs of the government activities, however, that represent social wel- fare expenditures.
During the past 25 years Federal, State, and local governments in the United States have engaged in several different types of activities related to housing. As a result of the depres-
4 For 8 description of the school lunch program, see this issue. pages 21-22 ff.
5 The detailed work underlying this anal- ~818 was done by Thomas garter of the Division of Program Research. The coop- eration of the Public Housing Admlniatra- tion in providing lnfonnation and revlew- ing this section of the article is gratefully acknowledged.
social Security

sion of the thirties, the Federal GOV- ernment was drawn into a Program designed to assure adequate housing credit. The Home Owners Loan Gor- poration was organized in 1933 to re- finance the mortgages of distressed homeowners. The Reconstruction Fi- nance Corporation made some loans for housing. The system of Federal Home Loan Banks, which provide credit facilities for home-financing institutions, was created in 1932. The National Housing Act of 1934 created a system of insurance for individual funds (up to $5,000, increased in 1950 to $10,000) invested in savings and loan associations; and it established, under the Federal Housing Adminis- tration, insurance programs designed to encourage the production, pur- chase, repair, and improvement of residential structures. These pro- grams have over the long run resulted in no net cost to the Government: in- deed, several of them have paid sur- pluses or dividends to the Federal Treasury.
From 1933 through 1937 the Pub- lic Works Administration directly fi- nanced and built about 22,000 hous- ing units; more than half the units have now been transferred to local housing authorities, which will pay to the Federal Government any net in- come from the projects over a 40- year period. A number of “greenbelt” towns and rural subsistence home- stead projects built during the thir- ties were subsequently sold.
The Federal Government again be- came involved in the construction of housing during World War II. Much of the defense housing was of tem- porary construction; a substantial number of units were dormitories. Some of these wartime housing units were subsequently converted to pro- vide accommodations for veterans; others were sold on a competitive ba- sis or transferred to local housing authorities or other local bodies that will pay income to the Federal Gov- ernment for a period of 40 years on those used for low-rent housing proj- ects. It is therefore not clear what the Anal net cost to the Federal Gov- ernment of the war housing program will be. Because these were primarily war expenditures, none of the direct outlays are included in table 1. It may be argued that at least the direct
Bulletin, October 1956
cost of converting war housing units for the use of veterans should be regarded as a social welfare expendi- ture. The $418 million spent for this purpose was all paid out in the Ascal years 1946-49.
Since 1937, and on an expanded basis since 1949, the Federal GOV- ernment has also provided loans and subsidies to local public housing au- thorities for low-rent housing. The Federal Government pledges itself to pay annual contributions suiilcient to cover the debt service, if necessary, on bonds sold to the public by local hous- ing authorities. Rising income levels in recent years have held down the amount of the annual Federal sub- sidy. The total Federal contribution for low-rent housing in the fiscal year ended June 30, 1955, including costs of administration, was $66.6 million.
Most States have adopted legisla- tion authorizing the establishment of local public housing authorities with the power to acquire, own, and op- erate low-rent housing projects and to engage in slum clearance and ur- ban redevelopment programs. A few States also provide loans (repayable) and annual subsidies to local housing authorities. The local government financial contribution to the cost of low-rent housing is primarily in the form of reduced tax collections, since local housing authorities must be ex- empted from local taxes to receive Federal loans and subsidies. On the other hand, payments amounting to 10 percent of the shelter rents of the housing projects are made in lieu of taxes by the housing authorities to local governments. It is not clear that there is always a net loss to the locality, particularly when account is taken of the decreased expenditures for police and Are protection and other services and the increased value of surrounding properties when slum areas are replaced by public housing projects. No attempt has been made to estimate the value of such local contributions. As indi- cated earlier, the direct money out- lays of the local housing authorities are made primarily from money bor- rowed through the sale of bonds and covered by the income of the project.
Both State and local governments made some direct expenditures for veterans’ housing in the years from
1946 to 1948. State grants to local- ities for this purpose amounted to more than $200 million. Local gov- ernments contributed primarily by providing land and utilities or selling land to veterans at reduced prices and freezing the tax rates on vet- erans’ rental projects for a number of years. The amounts shown in ta- ble 1 for expenditures for public housing from State and local funds are the annual State contributions or subsidies to local housing authorities. For the years covered, these amounts -plus the expenditures from Federal funds shown-represent total net government expenditures for public housing.
Since 1949 the Federal Government has also had a program of loans and grants to localities to assist in slum clearance and urban redevelopment projects. Grants and costs of admin- istration for this program amounted to $35.7 million in 1954-55. These ex- penditures are not included in the so- cial welfare series because their pur- pose is more closely related to gen- eral community development expen- ditures, such as those for improved highways, transportation facilities, and related utilities.
Social Welfare Expenditures and National Output
The growth in social welfare ex- penditures over the past 20 years has been affected by population growth and price changes as well as by pro- gram developments. With an in- crease of 30 percent in the total pop- ulation and of 36 percent in the num- ber under age 18 and 81 percent in the number aged 65 and over, most of the programs would have spent more money merely to maintain the same level of service per capita. In addition, prices almost doubled dur- ing the period, and a larger dollar outlay has been required for the same level of service. At the same time, national productivity and real na- tional output have continued to ex- pand, and part of this increase- varying from program to program- has been channeled into the improve- ment of social welfare services.
The proportions of the total na- tional output used for social welfare programs (table 2) reflect the inter- action of all these factors-program
7

development, population growth Price change, and improved levels of Pro- gram adequacy. A far more detailed analysis than is possible here Would
be required to separate the influence of each of the significant factors. Several broad generalizations, how- ever, can be made. One is that gen- eral economic and social conditions and the size of the national income itself are of major importance in determining the uses of the national income. Social welfare expenditures represented more than 11 percent of total national output in the flscal year 1934-35, in part because national output had fallen sharply and in part because of the emergency relief pro- grams, designed to mitigate and cor- rect that situation. These expendi- tures took less than 4 percent of the national output in 1944-45, primarily because of the tremendous expansion in the output directed to war pur- poses.
The reasons for the growth in so- cial insurance expenditures were dis- cussed earlier. The peak of expen- ditures for veterans in relation to the national output (3 percent) came in 1946-47, when both the spe- cial readjustment allowances and ed- ucation benefits were at high levels. With most veterans back in civilian employment, expenditures for this program now reflect primarily the in- come-maintenance and health serv- ices provided to disabled and aged veterans or to their survivors.
The increases during the past few Years in expenditures for health and medical services and for education reflect a number of common factors. In both programs, there has been an accelerated building program-large- IY to catch up with the wartime defi- cits in school and hospital construc-
tion. The increased use of public funds for hospital construction, re- sulting largely from the grants under the Hill-Burton Act of 1946, got un- der way and reached at least a tem- porary peak earlier than the school building program (table 3). Total expenditures for both health and ed- ucation have also been affected by the fact that salaries of health and education personnel, which had lagged behind the average for wage and salary workers, have in the past few years increased proportionately more than the average and thus re- duced the difference. Medical care costs have shown a particularly sharp increase in the past few years. The medical care component of the con- sumer price index (based on the peri- od 1947-49) had gone up 31.4 percent by March 1956, compared with 14.7 percent for all items. Increases in the cost of hospital care have been primarily responsible for the more rapid rise in medical costs. The ad- justment to the current price level shown in table 4 for all the programs was, however, made on the basis of the overall index.
When adjusted for price level changes, total social welfare expen- ditures about doubled between 1934- 35 and 1954-55. Adjusted expendi- tures per capita increased 65 percent.
Social Welfare and Other Government Expenditures
In the fiscal year ended June 30, 1955, social welfare expenditures as defined in this article accounted for a little less than one-third of all gov- ernment expenditures for all purposes (table 51. Excluding social insurance payments, social welfare expenditures from general revenues make up one- fourth of all government expendi-
Table 2.-Social welfare expenditures as percent of gross national product, selectedfSscalyears1934-35-1954-55
Fiscal year
8
C:Z 218.3 263.0 357.9 359.7 373.1
I Social welfare exPenditures a~ Percent of gross national Product
Total
11.5 0.6 9.6 1.3 3.6 .6 9.0 1.8 7.4 1.8 8.1 2.3 8.7 2.7
-- -
_-
-
Health
pz!c and
medical services
5.9 0.9 3.8 .8
5 :: :s”
:i :: .Q
1
-
Educa- tion
3.2 0.2 0. 7 2.9 .6 1.6
::
2.8 2:: 2.6
:i 1.2
2.8 .3 1.1 2.9 .2 1.2
Table 3.-Capital outlays from public funds for schools and hospitals, fiscal years 1949-50, 1952-53, 1953- 54, and 1954-55
[In millions]
Fiscal year
Hospitals
Total: 1949-51.. ._.___. $1,532.7 $1,014. 1952-53 . . . . ..__. 2,400.3 1953-54 . . . . ..__. 2,772.3 1954-55Federsi. 3,206.2
From funds:
1949-50 ____ __ 5.9 156.2 1952-53 . . ..-_.-- E i 139.9 90.0 1953-54 ._._._._. 268.1 119.8 52.2 1954-55 __.-..--. 255.2 141.4 33.0
From State and local funds:
1949-50 . . ..___ -_ h310.3 1,008.3 ___..__- 1952-53 . . .._..._ 2,059.o 1,759.0 .-_..-- 1953-54 _...._._. 2,594.2 2,242.2-T _..__. 1954-55 _.__ _ ____ 2,951.0 2,645.0.. _._---
1 Includes capital outlays for public elementary and secondary schools and publicly controlled higher education.
tures from general revenues. The picture is somewhat different when expenditures from Federal funds and from State and local funds are ex- amined separately.
About 40 percent of all social wel- fare expenditures in 1954-55 came from Federal funds, and 60 percent from State and local funds. Because the Federal expenditures, other than those for social insurance and the veterans’ programs, take the form primarily of grants in aid to the States, two-thirds of the total ex- penditures were used for programs administered by the States or local- ities.
On the other hand, of total gov- ernment expenditures (including so- cial insurance payments) of $99 bil- lion in 1954-55, $69 billion was spent by the Federal Government and $30 billion by State and local govern- ments.7 Social welfare expenditures accounted for 19 percent of all Fed- eral expenditures, including social in- surance and related payments, and for 11 percent of all Federal expen-
7 State unemployment lnsursnce benefit payments are here treated &a State expen- ditures: in the Federal Budget and in the national income series of the Department of Commerce from which the government expenditure data used here are derived. State withdrawals from the unemploy- ment insurance trust fund appear as Fed-
eral expenditures.
Social Security

Table L-Social welfare expenditures per capita under civilian public programs, actual and 1955 prices, selectedfiscal years 1934-35-1954-55
Per capita 1 social welfare expenditures Social welfare expenditures in 1955 prices
Fiscal Year
Peryg;%ge change, 1955 from
Actual expenditures ___.._.. Expenditures in 1955 prices.
1 Per capita figures relate to total civilian popula- * Includes public housing, not shown separately. tion of continental United States as of end of Decem- 3 For actual expenditures, see table 1. her.
ditures from general revenues. They accounted for 62 percent of State and local expenditures, including social insurance payments, and 57 percent of expenditures from the States’ gen- eral revenues (table 5). These pro- portions reflect the traditional divi- sion of functions and responsibilities between. the Federal and the State and local governments in this coun- try, as modified by changing eco- nomic circumstances. They may also provide some clue as to why many persons in other countries, looking only to the Federal Budget, may still think of the United States as a coun- try that neglects the welfare needs of its people.
The comparison of social welfare expenditures with all government ex- penditures omits the payments made under the State workmen’s compen- sation and temporary disability in- surance programs by private insur- ance carriers. These amounts are not public funds and should not be in- cluded in any figure on total gov- ernment expenditures. Since the PaYments are required by law and in most States may be insured under public funds or through private car- riers at the employer’s option, they are included with social insurance Program expenditures in all tables other than table 5.
Private Welfare Expenditures Information on private welfare ex-
penditures is too inexact and incom-
Bulletin, October 1956
plete to provide a firm basis for de- tailed, year-by-year comparisons. The general relationships between private and public welfare expendi- tures changed little between 1953-54 * and 1954-55. A few summary com- parisons can, however, be made.
In discussing private expenditures for welfare purposes, it is important to distinguish between two different though not unrelated concepts. One has to do with the total amount spent privately for education or health or old age, disability, or life
s See Ida C. Merriam, “Social Welfare In the United States, 1934-54,“Social Security Bulletin, October 1955, pa@% 13-14.
insurance; the other concerns the amount of private philanthropic con- tributions for these and other “wel- fare” purposes.
In considering first the relation between total private and total public spending for purposes that have be- come identified as social welfare pur- poses, it is useful to compare the gen- eral magnitudes involved. For edu- cation, between 75 percent and 80 percent of all expenditures in the United States are from public funds. Private expenditures for education in 1954-55 included about $400 million for construction and $2.8 billion in current expenditures, primarily tui- tion fees. About 40 percent of these current expenditures went for higher education, compared with about 12 percent of public expenditures (ex- eluding construction). This differ- ence reflects the lesser extent to which higher education, compared with primary and secondary educa- tion, has been made available with- out direct charge to all young persons who want it.
Medical care and health services, on the other hand, are paid for pri- marily through private expenditures. Private expenditures for medical services amounted to about $10.9 bil- lion and private funds for hospital construction to about $350 million in 1954. Public funds thus supported a little less than 30 percent of the com- bined total outlay for Qvilian medical and health care.
Private pension plans paid perhaps
Table 5.-Social welfare expenditures in relation to government expenditures for all purposes, selected fitcal years 1934-35-1954-55
[In millions]
Fiscal yeal
1934-35.--.. 193m...-. 194445..--. 1949+x...-. 195%53~.w-. 1953%54~.~~. 1954-55..--.
Soda1 welfare expenditures
Total as From Fed- percent Of era1 fund?
as percent g”ey;;n;;snt of Federal
tl;f”;f$ expendi- tures for
poses ’ all Pur- poses
59.9 47.1 49.5 36. 4 7. 5 2.5
37.2 23.2 25. 7 13.9 29.1 16.2 32.0 19.1
From State and
l~~eFZ? of state- local ex-
pe~o;i~res
Pwposes 2
Total BS percent of all govern- ment ex-
penditures from
general revenues
72.2 58.3 63.1 45. 6 66.8 6. 5 64.7 32.2 62.0 20.8 62.3 23.5 61. 5 24.8
1 Expenditures from general revenues and from social insurance trust funds; the Portion of work-
omitted in computing percentages.
men’s compensation and temporary disability insur- 4 Includes expenditures from State accounts in the
ance Payments made through private carriers was unemployment trust fund, but excludes Federal grants-in-aid.
-
Social welfare expenditures from general revenues
From Federal funds as percent of all
Federal expenditures from general revenues
Akier veterans’
E
4:: 3.1 3.6 3.9
FrOm State and
local funds Bs Percent
of all ;t;;t&&
tures from general
*evenues
70.3 59.0
Et! Ea.1 57.6 56.9
9

$540 million in age and disability benefits in the fiscal year 1954-55. For most of the persons receiving such benefits, the private annuity was designed to supplement an old-age and survivors insurance benefit. In- creasingly, employee benefit plans and individuals are adjusting their life insurance coverage to reflect the availability of survivor benefits under old-age and survivors insurance. The Institute of Life Insurance estimates that death benefit payments under group life insurance amounted to al- most $600 million in 1955 and under all types of policies, including those individually purchased, to $2.2 bil- lion. Private cash sickness insurance payments (not including payments by private carriers or self-insurers un- der the public laws of California, New Jersey, and New York), plus paid sick leave, amounted to about $1.2 billion in 1954.
Private contributions for all phil- anthropic and religious purposes in 1954, the latest year for which data are available, amounted to about $5.4 billion. About $2.8 billion of the total went to religious organizations. Pri- vate charitable organizations spent for health purposes-medical and hospital care, research, health infor- mation, hospital construction-about $750 million, including about $80 mil- lion spent by religious organizations for health services. Perhaps $1.1 bil- lion, including $270 million from church funds, went for welfare serv- ices - family counseling, specialized services for children, recreation, group work, institutional care, and similar services.
Conclusion From the earliest period of its his-
tory, the United States has worked toward the goal of social welfare through a variety of public and pri- vate programs and activities. Before the end of the eighteenth century the Federal Government had set aside land from the public domain for the support of public education, estab- lished quarantine regulations and a
marine hospital service, and begun the payment of pensions to veterans and their survivors. The nineteenth century was marked by a steady growth first of local action and then, from about the middle of the cen- tury, of State action in the field of education, health, and welfare. Dur- ing the same period, private social welfare groups were giving impetus and direction to reform efforts. The first and second decades of the twen- tieth century saw the beginning of social insurance for all workers, with workmen’s compensation legislation in most of the States (special retire- ment systems for State and local gov- ernment employees began somewhat earlier), and the beginning of modern public assistance programs, with the development of State mother’s aid and later State old-age pension laws.
The Social Security Act of 1935 es- tablished or laid the basis for a large part of our present social welfare structure. The national system of old-age insurance it established has become the old-age, survivor, and dis- ability insurance system, covering al- most all persons who work for a liv- ing. The nationwide system of State unemployment insurance programs made possible by the act provides a stabilizing influence on the economy as well as partial support to unem- ployed workers and their families. The Social Security Act also marked the acceptance of Federal responsi- bility for other health and welfare needs and the use of Federal grants in aid to strengthen State programs of public assistance, maternal and child health and child welfare serv- ices, and vocational rehabilitation and general public health programs. The health and vocational rehabilita- tion grants were subsequently placed under separate legislation and ex- panded in scope and amount.
The growth in the public programs in the past 20 years has been accom- panied by a substantial growth in private pension and other employee beneilt plans supplementing and flll- ing in gaps in the public programs.
There has also been an expansion Of private welfare services of many kinds and a new interest in the non- monetary needs of such groups as the aged or families and young people with special problems or subject to particular strains.
In spite of the tremendous expan- sion of social welfare expenditures since 1934-35, the amounts thus channeled into public education, health, and welfare programs repre- sented in the Ascal year 1954-55 leSS than 9 percent of our national OUt- put. Some further expansion both in dollar expenditures and in the pro- portion of our total production de- voted to these programs is probable. The dollar outlays will rise as a re- sult of population increases even if price levels remain stable. As more and more of the persons reaching re- tirement age or becoming disabled qualify for old-age, survivor, or dis- ability benefits, more of the total goods and services used by these groups in the population-that is to say, more of the total national out- put-will be distributed through this insurance program. There is evidence that the American people are likely in the next few years to give a sufii- ciently high priority to improving and expanding public education so that the share, as well as the volume, of the national product used for edu- cation may increase. Health needs and potentials are also attracting in- creasing attention.
The gains of increasing productiv- ity can be used in many ways-more leisure, higher personal incomes, im- proved social services, increased par- ticipation in worldwide technical de- velopment, and other measures for national security. It is probable that in the future, as in the past, such gains will be used in all these ways. As tightly as most of the existing so- cial welfare programs are woven into the fabric of our economic and social institutions, there remains a wide and continuing range of choice and decision as to the direction and pace of their future development.
10 Social Security