Embed Size (px)
Citation preview
How to use this Business Plan TemplateReplace Sample TextText inside brackets [ ] is meant to be read by you but then deleted. This includes suggested questions to answer, template help and general tips.
Table of Contents, Sections and HeadingsIf you want to add a new section so that the Table of Contents updates automatically, just add a new heading in the body of the document and assign it the Heading 1 or Heading 2 style.
To update the Table of Contents, go to the References tab and within the Table of Contents button group, click on Update Table and then "Update entire table."
Financial Tables, Charts and the Companion Excel WorkbookEdit and customize the various financial tables provided in the companion Excel workbook and then paste them into this document. This allows you to take advantage of the calculations that Excel will do automatically. The sample tables and charts you see in this document have all been created this way.
Pasting tables from Excel to Word: Use Copy/Paste to copy a table from Excel to Word. This will typically paste the data as a formatted and editable table in Word, though none of the formulas will be functional within Word (and the table will not be linked to Excel). If you don't want the table to be editable in Word, you can "Paste as a Picture" using Paste Special or by choosing the "Picture" option when you right-click in the document to paste the table.
Pasting charts from Excel to Word: When you paste a chart object into your business plan, make sure to "Paste as a Picture" because pasting the chart as an embedded object means that the entire spreadsheet becomes embedded in your Word document (even though what you see is only the chart).
Figure Titles and CaptionsParagraph styles have been created for making it easy to put a title or caption on the figures you include in this template (charts, tables, pictures, etc.). They are called Figure Title and Figure Caption and can be found in the Home tab Styles section.
Other related templatesBusiness Startup Costs Templatehttps://www.vertex42.com/ExcelTemplates/business-startup-costs.html
Sales Forecast Templatehttps://www.vertex42.com/ExcelTemplates/sales-forecast.html
Profit and Loss Projection Templatehttps://www.vertex42.com/ExcelTemplates/profit-and-loss.html
Balance Sheet Templatehttps://www.vertex42.com/ExcelTemplates/balance-sheet.html
Cash Flow Statement Templatehttps://www.vertex42.com/ExcelTemplates/cash-flow-statement.html
Business Budget Templatehttps://www.vertex42.com/ExcelTemplates/business-budget.html
Break Even Analysis Templatehttps://www.vertex42.com/ExcelTemplates/breakeven-analysis.html
Template UsageBy Vertex42.comhttps://www.vertex42.com/WordTemplates/business-plan.html
Business Plan Template © 2016 Vertex42 LLC
This template, including all associated content is a copyrighted work under the United States and other copyright laws. Do not submit copies or modifications of this template to any website or online template gallery.
Please review the following license agreement to learn how you may or may not use this template. Thank you.License Agreement: https://www.vertex42.com/licensing/EULA_privateuse.html
CONFIDENTIAL Page 2
Business Plan
NAME OF BUSINESSStreet AddressCity, ST 87654
Ted BlackPresident
12345 Somewhere StreetSome City, AB 87654
Phone: (123) 456-7890Fax: (123) 456-7890
Email: [email protected]
Sue BlackPresident
12345 Somewhere StreetSome City, AB 87654
Phone: (123) 456-7890Fax: (123) 456-7890
Email: [email protected]
Table of Contents
1 Executive Summary..........................................................................................31.1 The Quick Pitch.................................................................................................................................................3
1.2 The Problem.....................................................................................................................................................3
1.3 The Solution.....................................................................................................................................................3
1.4 Highlights.........................................................................................................................................................3
1.5 Keys to Success.................................................................................................................................................3
2 Our Team & Organization................................................................................42.1 Mission Statement...........................................................................................................................................4
2.2 Management & Team.......................................................................................................................................4
2.3 Company Goals and Objectives........................................................................................................................4
3 Products & Services.........................................................................................54 Market Analysis...............................................................................................6
4.1 Market Summary..............................................................................................................................................6
4.2 Customers........................................................................................................................................................6
4.3 Competition.....................................................................................................................................................7
5 Strategy & Implementation.............................................................................85.1 Milestones (Keys to Success)............................................................................................................................8
5.2 Customer Acquisition.......................................................................................................................................8
5.3 Pricing Strategy and Revenue Model...............................................................................................................9
6 Financial Plan & Projections..........................................................................106.1 Start-up Expenses & Funding.........................................................................................................................10
6.2 Sales Forecast.................................................................................................................................................11
6.3 3-Year Sales Forecast......................................................................................................................................12
6.4 Profit and Loss Projection...............................................................................................................................13
6.5 Balance Sheet.................................................................................................................................................14
6.6 3-Year Cash Flow............................................................................................................................................15
6.7 Business Budget.............................................................................................................................................16
6.8 Break-Even Analysis........................................................................................................................................17
CONFIDENTIAL Page 2
1 Executive Summary
1.1 The Quick Pitch[In one sentence... what does our company do?] [Tip: Being able to describe what your business does in just once sentence will be a huge asset to you as you talk about it with others. Work on refining your quick pitch again after completing your business plan.]
1.2 The Problem[What problem are you solving for the consumer?] [How big is the problem?]
[Are there currently any solutions out there?]
1.3 The Solution[How does your business solve the problem?] [Is it a simple solution or a complex solution?][Tip: If it is complex, how can you make it simple, or describe it more simply?]
1.4 Highlights[Type content here]
[Optional caption for graph]
1.5 Keys to Success[What are the main steps you'll need to take to be successful (3-6 steps)?]
CONFIDENTIAL Page 3

2 Our Team & Organization
2.1 Mission Statement[This mission statement should be related to your team and organization]
2.2 Management & Team[Who is working on this with you?]
[What are your backgrounds?]
[What industry experience do they have?]
[What makes your team qualified to make your business a success?]
[Who do you need to hire?]
Professional and Advisory SupportBoard of Directors [names]Management Advisory BoardAttorneyAccountantInsurance AgentBankerConsultant(s)Mentors and Key Advisors
2.3 Company Goals and Objectives[Type content here]
CONFIDENTIAL Page 4
3 Products & Services[Type content here]
CONFIDENTIAL Page 5
4 Market Analysis
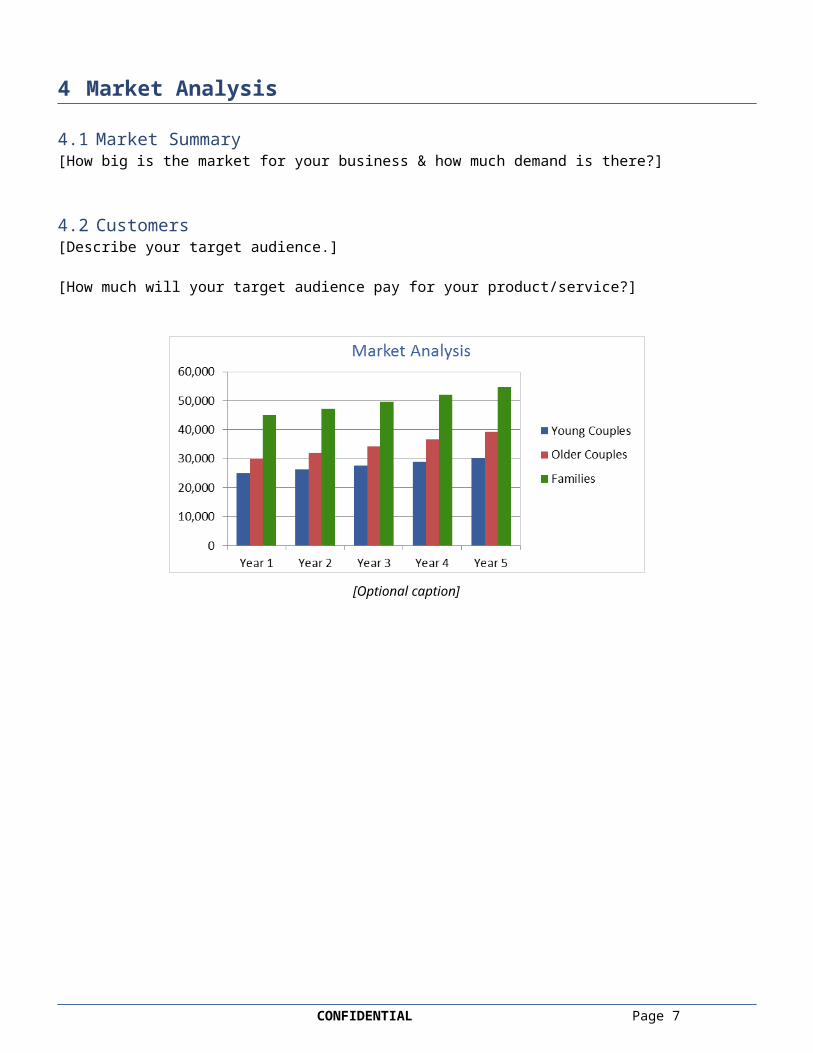
4.1 Market Summary[How big is the market for your business & how much demand is there?]
4.2 Customers[Describe your target audience.]
[How much will your target audience pay for your product/service?]
[Optional caption]
CONFIDENTIAL Page 6
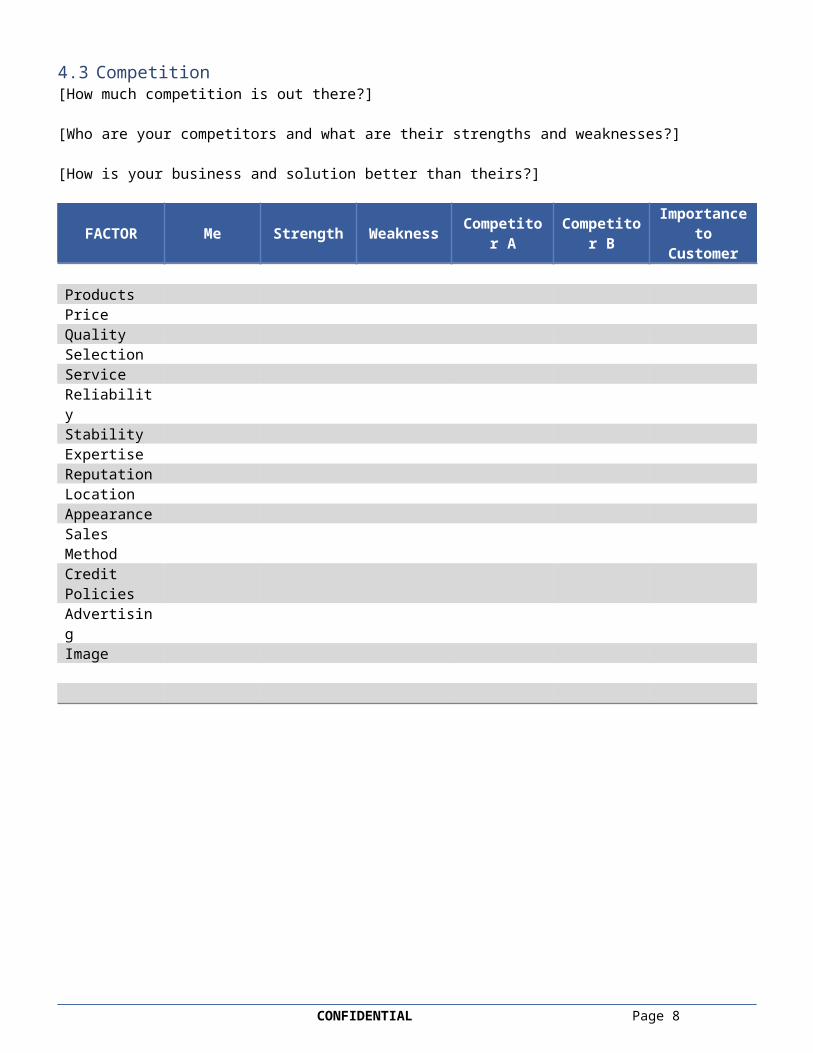
4.3 Competition[How much competition is out there?]
[Who are your competitors and what are their strengths and weaknesses?]
[How is your business and solution better than theirs?]
FACTOR Me Strength Weakness Competitor A Competitor B Importance to Customer
ProductsPriceQualitySelectionServiceReliabilityStabilityExpertiseReputationLocationAppearanceSales MethodCredit PoliciesAdvertisingImage
CONFIDENTIAL Page 7
5 Strategy & Implementation
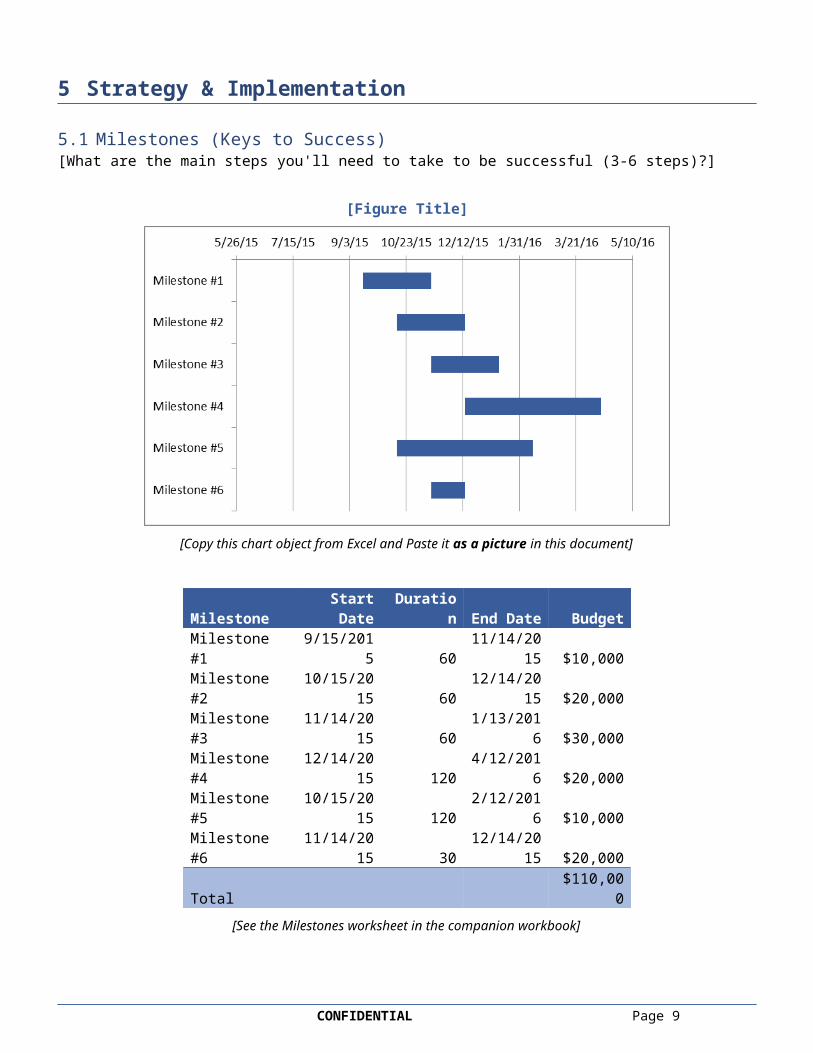
5.1 Milestones (Keys to Success)[What are the main steps you'll need to take to be successful (3-6 steps)?]
[Figure Title]
[Copy this chart object from Excel and Paste it as a picture in this document]
Milestone Start Date Duration End Date Budget
Milestone #1 9/15/2015 6011/14/201
5 $10,000
Milestone #210/15/201
5 6012/14/201
5 $20,000
Milestone #311/14/201
5 60 1/13/2016 $30,000
Milestone #412/14/201
5 120 4/12/2016 $20,000
Milestone #510/15/201
5 120 2/12/2016 $10,000
Milestone #611/14/201
5 3012/14/201
5 $20,000Total $110,000
[See the Milestones worksheet in the companion workbook]
5.2 Customer Acquisition[How will you gain customers?]
[How much money will it take to gain them?]
CONFIDENTIAL Page 8
[What will your Customer Lifetime Value be?]
5.3 Pricing Strategy and Revenue Model[What will your pricing strategy be?]
[What is your revenue model?]
CONFIDENTIAL Page 9
6 Financial Plan & Projections
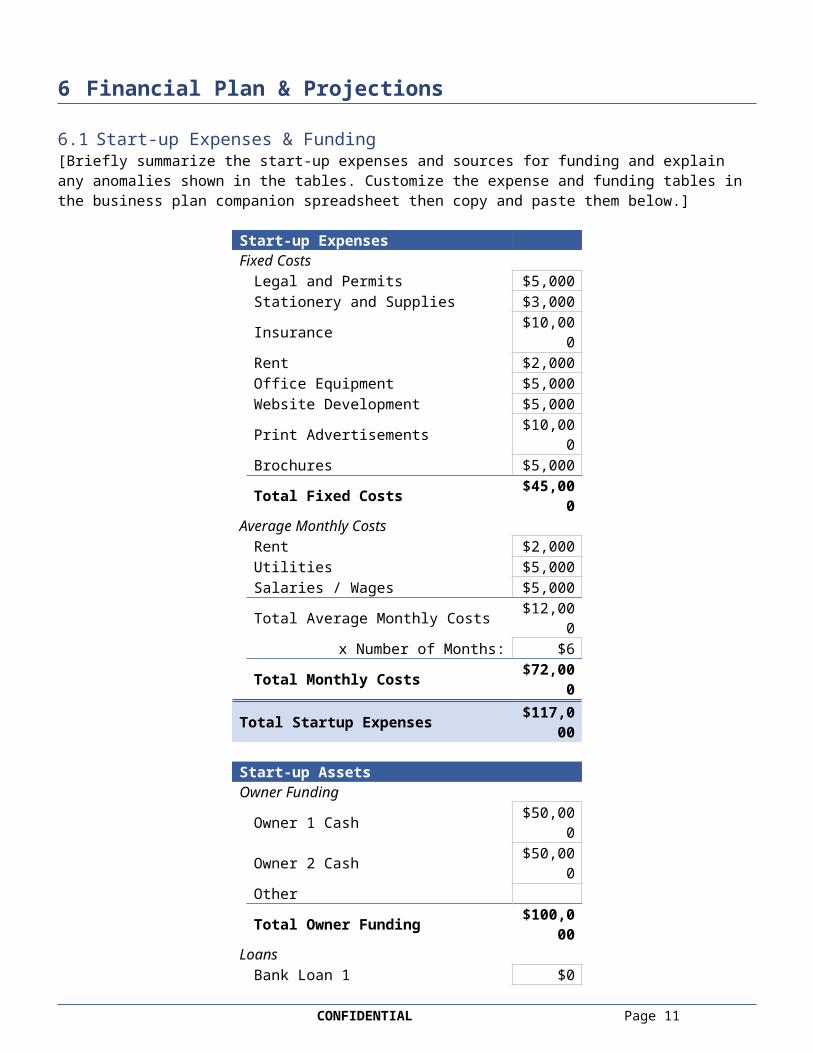
6.1 Start-up Expenses & Funding[Briefly summarize the start-up expenses and sources for funding and explain any anomalies shown in the tables. Customize the expense and funding tables in the business plan companion spreadsheet then copy and paste them below.]
Start-up Expenses Fixed Costs
Legal and Permits $5,000Stationery and Supplies $3,000Insurance $10,000Rent $2,000Office Equipment $5,000Website Development $5,000Print Advertisements $10,000Brochures $5,000Total Fixed Costs $45,000
Average Monthly CostsRent $2,000Utilities $5,000Salaries / Wages $5,000Total Average Monthly Costs $12,000
x Number of Months: $6Total Monthly Costs $72,000
Total Startup Expenses $117,000
Start-up Assets Owner Funding
Owner 1 Cash $50,000Owner 2 Cash $50,000Other
Total Owner Funding $100,000
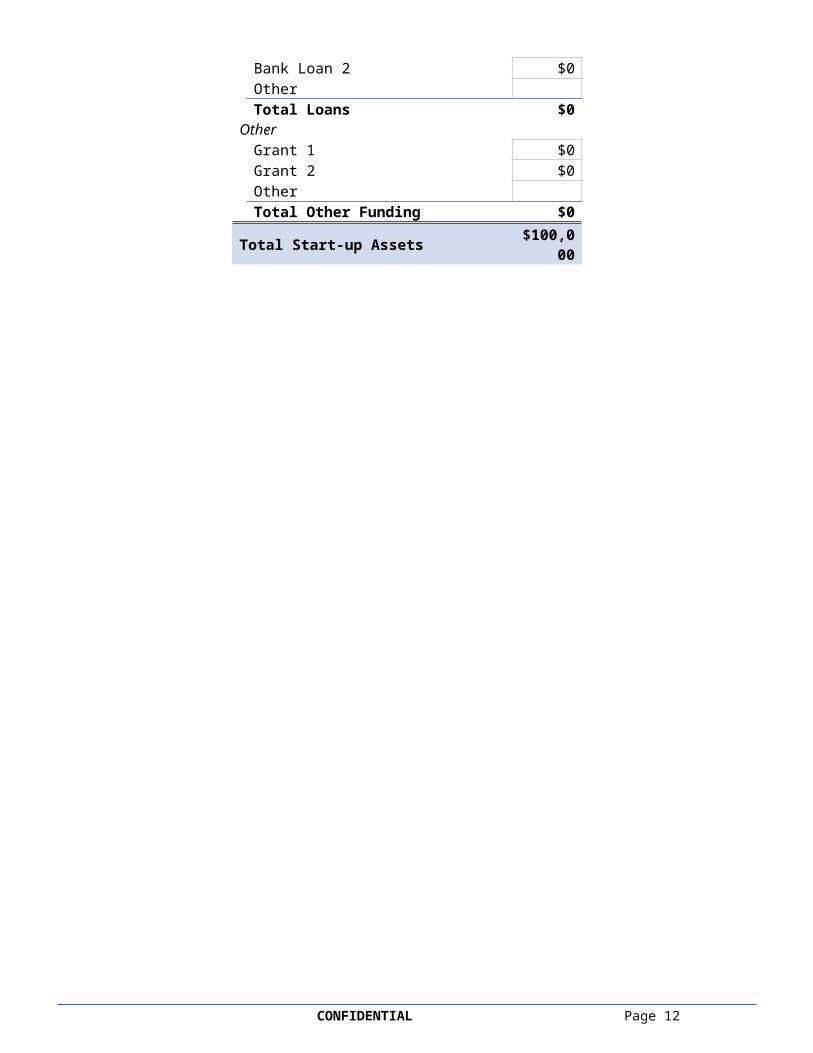
LoansBank Loan 1 $0Bank Loan 2 $0Other Total Loans $0
OtherGrant 1 $0Grant 2 $0Other Total Other Funding $0
Total Start-up Assets $100,000
CONFIDENTIAL Page 10
CONFIDENTIAL Page 11
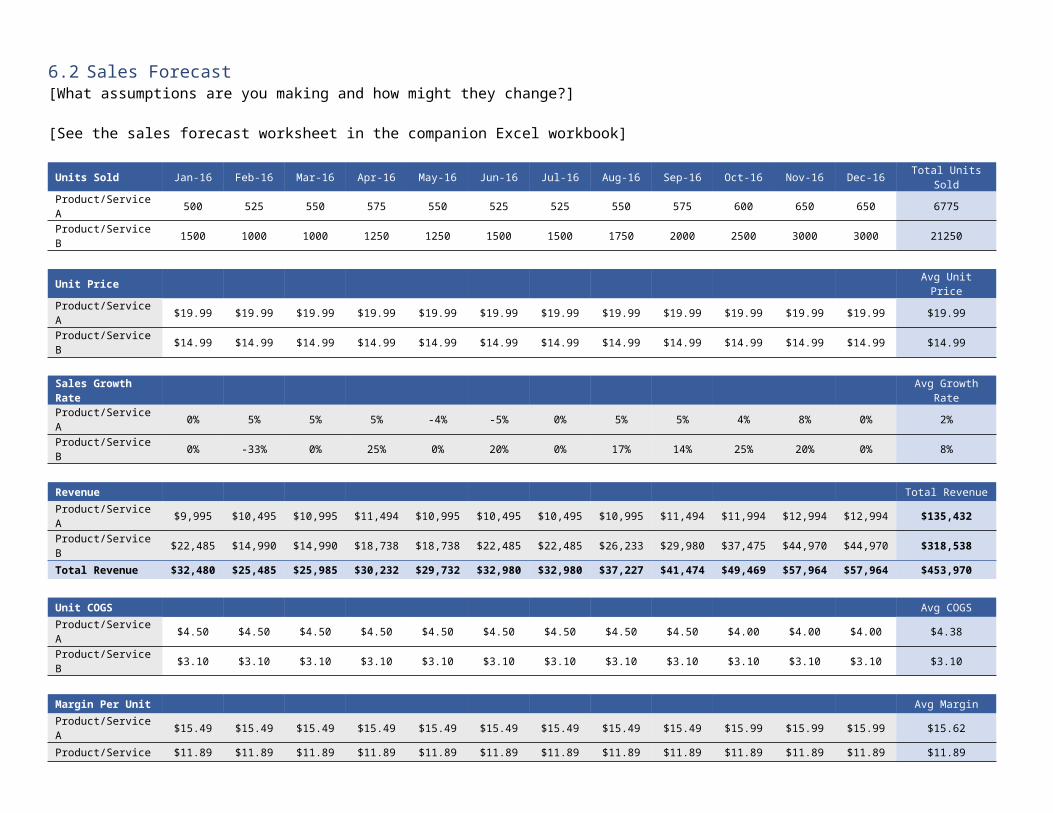
6.2 Sales Forecast[What assumptions are you making and how might they change?]
[See the sales forecast worksheet in the companion Excel workbook]
Units Sold Jan-16 Feb-16 Mar-16 Apr-16 May-16 Jun-16 Jul-16 Aug-16 Sep-16 Oct-16 Nov-16 Dec-16 Total Units Sold
Product/Service A 500 525 550 575 550 525 525 550 575 600 650 650 6775
Product/Service B 1500 1000 1000 1250 1250 1500 1500 1750 2000 2500 3000 3000 21250
Unit Price Avg Unit Price
Product/Service A $19.99 $19.99 $19.99 $19.99 $19.99 $19.99 $19.99 $19.99 $19.99 $19.99 $19.99 $19.99 $19.99
Product/Service B $14.99 $14.99 $14.99 $14.99 $14.99 $14.99 $14.99 $14.99 $14.99 $14.99 $14.99 $14.99 $14.99
Sales Growth Rate Avg Growth Rate
Product/Service A 0% 5% 5% 5% -4% -5% 0% 5% 5% 4% 8% 0% 2%
Product/Service B 0% -33% 0% 25% 0% 20% 0% 17% 14% 25% 20% 0% 8%
Revenue Total Revenue
Product/Service A $9,995 $10,495 $10,995 $11,494 $10,995 $10,495 $10,495 $10,995 $11,494 $11,994 $12,994 $12,994 $135,432
Product/Service B $22,485 $14,990 $14,990 $18,738 $18,738 $22,485 $22,485 $26,233 $29,980 $37,475 $44,970 $44,970 $318,538
Total Revenue $32,480 $25,485 $25,985 $30,232 $29,732 $32,980 $32,980 $37,227 $41,474 $49,469 $57,964 $57,964 $453,970
Unit COGS Avg COGS
Product/Service A $4.50 $4.50 $4.50 $4.50 $4.50 $4.50 $4.50 $4.50 $4.50 $4.00 $4.00 $4.00 $4.38
Product/Service B $3.10 $3.10 $3.10 $3.10 $3.10 $3.10 $3.10 $3.10 $3.10 $3.10 $3.10 $3.10 $3.10
Margin Per Unit Avg Margin
Product/Service A $15.49 $15.49 $15.49 $15.49 $15.49 $15.49 $15.49 $15.49 $15.49 $15.99 $15.99 $15.99 $15.62
Product/Service B $11.89 $11.89 $11.89 $11.89 $11.89 $11.89 $11.89 $11.89 $11.89 $11.89 $11.89 $11.89 $11.89
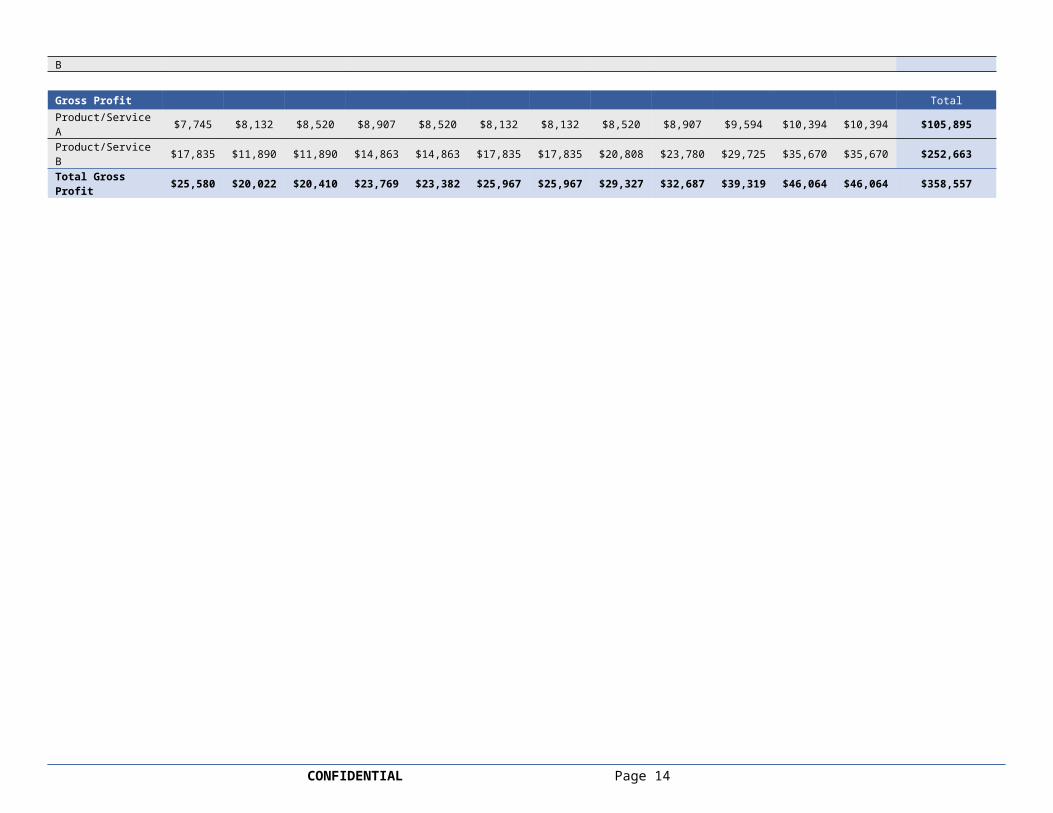
Gross Profit Total
Product/Service A $7,745 $8,132 $8,520 $8,907 $8,520 $8,132 $8,132 $8,520 $8,907 $9,594 $10,394 $10,394 $105,895
Product/Service B $17,835 $11,890 $11,890 $14,863 $14,863 $17,835 $17,835 $20,808 $23,780 $29,725 $35,670 $35,670 $252,663
Total Gross Profit $25,580 $20,022 $20,410 $23,769 $23,382 $25,967 $25,967 $29,327 $32,687 $39,319 $46,064 $46,064 $358,557
6.3 3-Year Sales Forecast[See the sales forecast worksheet in the companion Excel workbook]
Year 1 Year 2 Year 3 Yr 2 vs Yr 1 Yr 3 vs Yr 2
Total Units Sold % Change
Product/Service A 6775 7500 8850 11% 18%
Product/Service B 21250 27250 33750 28% 24%
Product/Service C 3650 4375 5500 20% 26%
Avg Unit Price Difference
Product/Service A $19.99 $19.99 $19.99 $0.00 $0.00
Product/Service B $14.99 $14.99 $14.99 $0.00 $0.00
Product/Service C $49.99 $54.99 $59.99 $5.00 $5.00
Avg Sales Growth Rate Difference
Product/Service A 2% 1% 2% -1% 1%
Product/Service B 8% 6% 4% -2% -2%
Product/Service C 8% 2% 3% -6% 1%
Total Revenue Difference
Product/Service A $135,432 $149,925 $176,912 $14,493 $26,987
Product/Service B $318,538 $408,478 $505,913 $89,940 $97,435
Product/Service C $182,464 $240,581 $329,945 $58,117 $89,364
Total Revenue $636,434 $798,984 $1,012,770 $162,550 $213,786
Avg Unit COGS Difference
Product/Service A $4.38 $4.08 $3.75 ($0.30) ($0.33)
Product/Service B $3.10 $3.05 $3.01 ($0.05) ($0.04)
Product/Service C $1.55 $1.51 $1.36 ($0.04) ($0.15)
Avg Margin Per Unit Difference
Product/Service A $15.62 $15.91 $16.24 $0.29 $0.33
Product/Service B $11.89 $11.94 $11.98 $0.05 $0.04
Product/Service C $48.44 $53.48 $58.63 $5.04 $5.15
Total Gross Profit Difference
Product/Service A $105,895 $119,431 $143,868 $13,536 $24,437
Product/Service B $252,663 $326,003 $405,188 $73,340 $79,185
Product/Service C $176,806 $234,025 $322,613 $57,219 $88,588
Total Gross Profit $535,364 $679,459 $871,669 $144,095 $192,210
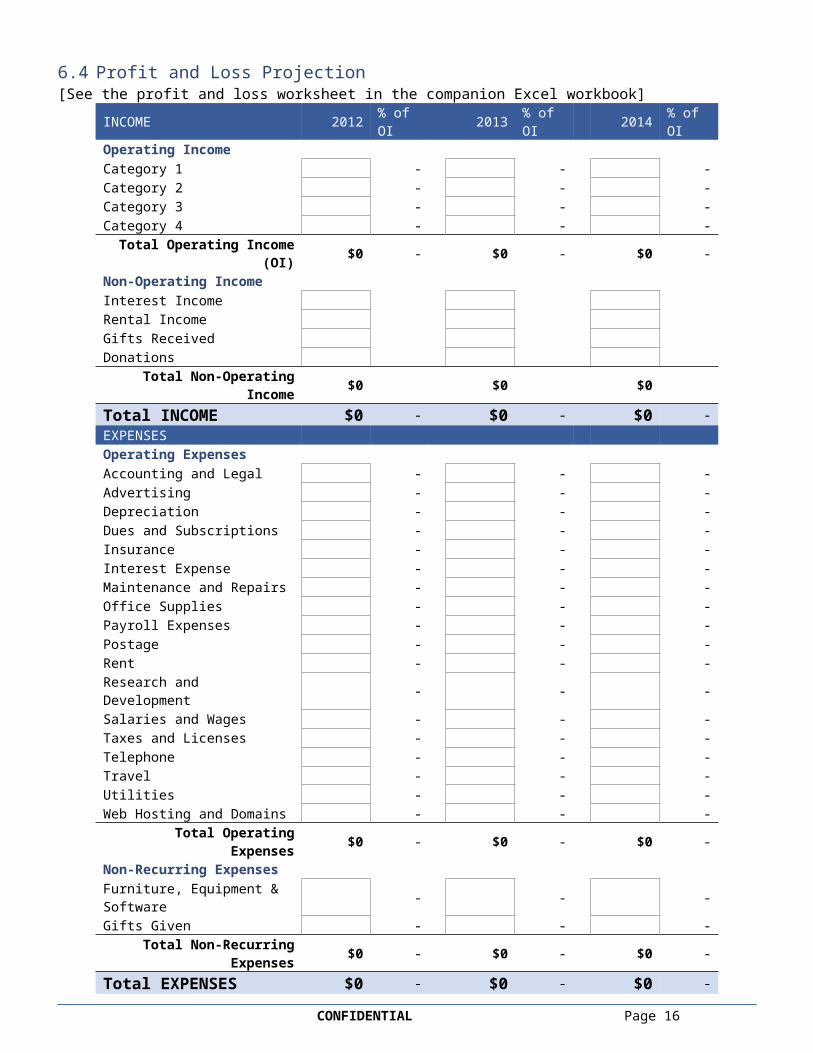
6.4 Profit and Loss Projection[See the profit and loss worksheet in the companion Excel workbook]
INCOME 2012 % of OI 2013 % of OI 2014 % of OIOperating IncomeCategory 1 - - - Category 2 - - - Category 3 - - - Category 4 - - -
Total Operating Income (OI) $0 - $0 - $0 - Non-Operating IncomeInterest Income Rental Income Gifts Received Donations
Total Non-Operating Income $0 $0 $0 Total INCOME $0 - $0 - $0 - EXPENSES Operating ExpensesAccounting and Legal - - - Advertising - - - Depreciation - - - Dues and Subscriptions - - - Insurance - - - Interest Expense - - - Maintenance and Repairs - - - Office Supplies - - - Payroll Expenses - - - Postage - - - Rent - - - Research and Development - - - Salaries and Wages - - - Taxes and Licenses - - - Telephone - - - Travel - - - Utilities - - - Web Hosting and Domains - - -
Total Operating Expenses $0 - $0 - $0 - Non-Recurring ExpensesFurniture, Equipment & Software - - - Gifts Given - - -
Total Non-Recurring Expenses $0 - $0 - $0 - Total EXPENSES $0 - $0 - $0 - Net Income Before Taxes $0 $0 $0Income Tax Expense NET INCOME $0 $0 $0 Owner Distributions / Dividends Adjustment to Retained Earnings $0 $0 $0
CONFIDENTIAL Page 14
6.5 Balance Sheet[See the balance sheet worksheet in the companion Excel workbook]
Assets 2017 2016Current Assets Cash $11,874 Accounts receivable Inventory Prepaid expenses Short-term investments
Total current assets $11,874 $0Fixed (Long-Term) Assets Long-term investments $1,208 Property, plant, and equipment $15,340 (Less accumulated depreciation) -$2,200 Intangible assets
Total fixed assets $14,348 $0Other Assets Deferred income tax Other
Total Other Assets $0 $0Total Assets $26,222 $0
Liabilities and Owner's Equity Current Liabilities Accounts payable $8,060 Short-term loans Income taxes payable $3,145 Accrued salaries and wages Unearned revenue Current portion of long-term debt
Total current liabilities $11,205 $0Long-Term Liabilities Long-term debt $3,450 Deferred income tax
Total long-term liabilities $3,450 $0Owner's Equity Owner's investment $7,178 Retained earnings $4,389
Total owner's equity $11,567 $0Total Liabilities and Owner's Equity $26,222 $0
{42}Common Financial Ratios Debt Ratio (Total Liabilities / Total Assets) 0.56 Current Ratio (Current Assets / Current Liabilities) 1.06 Working Capital (Current Assets - Current Liabilities) 669 -Assets-to-Equity Ratio (Total Assets / Owner's Equity) 2.27 Debt-to-Equity Ratio (Total Liabilities / Owner's Equity) 1.27
CONFIDENTIAL Page 15

6.6 3-Year Cash Flow[See the cash flow worksheet in the companion Excel workbook]
CASH BALANCE 2015 2016 2017
Date Ending 9/3/2015 9/3/2016 9/3/2017
Cash at Beginning of Period $5,000 $5,000 $5,000Cash at End of Period $5,000 $5,000 $5,000
CASH INFLOWS 2015 2016 2017Cash from Operations
Receipts from Customers Gross Rents Total Cash from Operations $0 $0 $0
Cash from FinancingIssuance of Stock Borrowing Total Cash from Financing $0 $0 $0
Cash from InvestingSale of Property and Equipment Collection of Principal on Loans Sale of Investment Securities Total Cash from Investing $0 $0 $0
Total Cash Inflows $0 $0 $0
CASH OUTFLOWS 2015 2016 2017Operations
Wages Inventory Purchases General Operating Expenses Interest Income Taxes Totoal Outflows from Operations $0 $0 $0
FinancingRepayment of Loans Repurchase of Stocks Dividends Paid Total Outflows from Financing $0 $0 $0
InvestingPurchase of Property and Equipment Making Loans to Other Entities Purchase of Investment Securities Total Outflows from Investing $0 $0 $0
Total Cash Outflows $0 $0 $0
NET CASH FLOW $0 $0 $0
CONFIDENTIAL Page 16
6.7 Business Budget[See the business budget worksheet in the companion Excel workbook]
INCOME Actual Budget DifferenceOperating IncomeCategory 1 $0Category 2 $0Category 3 $0Category 4 $0
Total Operating Income $0 $0 $0Non-Operating IncomeInterest Income $0Rental Income $0Gifts Received $0Donations $0
Total Non-Operating Income $0 $0 $0Total INCOME $0 $0 $0EXPENSES Operating ExpensesAccounting and Legal $0Advertising $0Depreciation $0Dues and Subscriptions $0Insurance $0Interest Expense $0Maintenance and Repairs $0Office Supplies $0Payroll Expenses $0Postage $0Rent $0Research and Development $0Salaries and Wages $0Taxes and Licenses $0Telephone $0Travel $0Utilities $0Web Hosting and Domains $0
Total Operating Expenses $0 $0 $0Non-Recurring ExpensesFurniture, Equipment and Software $0Gifts Given $0
Total Non-Recurring Expenses $0 $0 $0Total EXPENSES $0 $0 $0Net Income Before Taxes $0 $0 $0Income Tax Expense $0NET INCOME $0 $0 $0
6.8 Break-Even Analysis[See the break-even analysis worksheet in the companion Excel workbook]
CONFIDENTIAL Page 17
Selling Price (per unit) $12.00
FIXED COSTS Advertising $1,000.00Accounting Insurance Manufacturing Payroll Rent Supplies Taxes Utilities Other (specify) Total Fixed Costs $1,000.00
VARIABLE COSTS Per UnitVariable Costs based on dollar amount per unitCost of Goods Sold $1.00Direct Labor Overhead Other (specify) Total $1.00
Variable Costs based on percentage per unitCommissions 7.50%Other (specify) Total 7.50%
Total Variable Cost per Unit $1.90 Contribution Margin per Unit $10.10 Contribution Margin Ratio 84.17%
Break-Even Point Break-Even Units 100 unitsBreak-Even Sales $1,188.12
CONFIDENTIAL Page 18