Embed Size (px)
Citation preview

Business Plan 2011- 2013
Edition, May 2011
Key Issue
� The current document represents an updated and extended version of theprevious “Business Plan 2010-12” unveiled to the financial community on pastMarch 23rd, 2010;
� This document contains the results reached in 2010 and an updated overview of
2
� This document contains the results reached in 2010 and an updated overview ofthe expected targets for the period 2011- 2013;
� Details regarding the strategic and operating targets for the medium term arereported in the “Business Plan 2010-12” published on past March 23rd, 2010.

Pierrel Group – Current Organizational Chart
Pierrel S.p.A.
Pierrel Research Int. AGCMO Division (*) Pierrel Pharma srl
Contract Drugs & Contract Research
3
Contract
Manufacturing
Organization
Drugs &
Formulations
Licensing
Pierrel Research Austria GmbH
Pierrel Research Balkan Doo
Pierrel Research Baltic States UAB
Pierrel Research Bulgaria EOOP
Pierrel Research Europe GmbH
Pierrel Research Germany GmbH
Pierrel Research HP Romania S.r.l.
Pierrel Research Hungary Kft
Pierrel Research IMP S.r.l.
Pierrel Research Italy S.p.A.
Pierrel Research Onco-Immunology GmbH
Pierrel Research Polska Sp z.o.o
Pierrel Research Romania S.r.l.
Pierrel Research Russia O.O.O.
Pierrel Research Slovakia S.r.o.
Pierrel Research UK Ltd
Pierrel Research USA, Inc.
(*) The CMO Division is a business of the holding company Pierrel Spa
Contract Research
Organization

Pierrel Research – Summary Report
� On January 2011 Pierrel Research has completed its operational and administrative reorganization. All the local CRO subsidiarieshave been contributed in kind into the Swiss sub-holding, Pierrel Research International AG, based in Thalwil (Zurich), which endedup with an equity of about CHF 60.0 mln. Luigi Visani, MD, has been appointed Chairman and CEO of Pierrel Research InternationalAG.
As described in 2010 Business Plan, the main objective of the Pierrel Research, over the last 12
months, has been to consolidate its leading position in Italy and to become one of the most
important players in Europe and to expand the operations in the USA, through an increased
penetration of the international clinical research market .
4
• Presence of Pierrel Research Worldwide
Pierrel Research – Summary Report
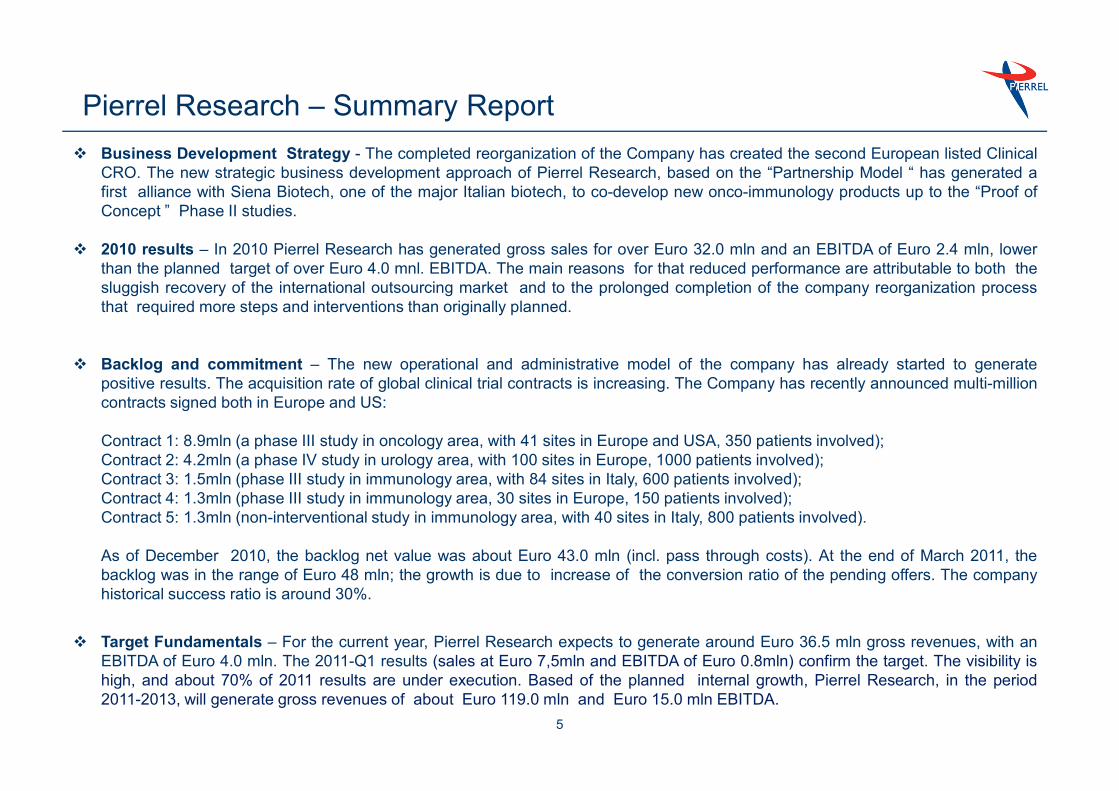
� Business Development Strategy - The completed reorganization of the Company has created the second European listed ClinicalCRO. The new strategic business development approach of Pierrel Research, based on the “Partnership Model “ has generated afirst alliance with Siena Biotech, one of the major Italian biotech, to co-develop new onco-immunology products up to the “Proof ofConcept ” Phase II studies.
� 2010 results – In 2010 Pierrel Research has generated gross sales for over Euro 32.0 mln and an EBITDA of Euro 2.4 mln, lowerthan the planned target of over Euro 4.0 mnl. EBITDA. The main reasons for that reduced performance are attributable to both thesluggish recovery of the international outsourcing market and to the prolonged completion of the company reorganization processthat required more steps and interventions than originally planned.
� Backlog and commitment – The new operational and administrative model of the company has already started to generatepositive results. The acquisition rate of global clinical trial contracts is increasing. The Company has recently announced multi-millioncontracts signed both in Europe and US:
5
contracts signed both in Europe and US:
Contract 1: 8.9mln (a phase III study in oncology area, with 41 sites in Europe and USA, 350 patients involved);Contract 2: 4.2mln (a phase IV study in urology area, with 100 sites in Europe, 1000 patients involved);Contract 3: 1.5mln (phase III study in immunology area, with 84 sites in Italy, 600 patients involved);Contract 4: 1.3mln (phase III study in immunology area, 30 sites in Europe, 150 patients involved);Contract 5: 1.3mln (non-interventional study in immunology area, with 40 sites in Italy, 800 patients involved).
As of December 2010, the backlog net value was about Euro 43.0 mln (incl. pass through costs). At the end of March 2011, thebacklog was in the range of Euro 48 mln; the growth is due to increase of the conversion ratio of the pending offers. The companyhistorical success ratio is around 30%.
� Target Fundamentals – For the current year, Pierrel Research expects to generate around Euro 36.5 mln gross revenues, with anEBITDA of Euro 4.0 mln. The 2011-Q1 results (sales at Euro 7,5mln and EBITDA of Euro 0.8mln) confirm the target. The visibility ishigh, and about 70% of 2011 results are under execution. Based of the planned internal growth, Pierrel Research, in the period2011-2013, will generate gross revenues of about Euro 119.0 mln and Euro 15.0 mln EBITDA.

Pierrel Research – Key Performance Indicators (updated March 2011)
31.12.10 31.03.11
42.6 48.4
49.8
64.8
Pipeline
RFPs
Backlog
+13.4%
+30.1%
92.4
113.2
31.12.10 31.03.11
68.1 70.8
9.113.4
Net Revenues/headcount & EBITDA ratio
Revenues / headcount (€/k) EBITDA / Net Revenues ratio (%)
6
31.12.10 31.03.11
1.0
1.6
Net Book-to-Bill ratio
+60%
31.12.10 31.03.11 Revenues / headcount (€/k) EBITDA / Net Revenues ratio (%)
0%
20%
40%
60%
80%
100%
31.12.10 31.03.11
55% 63%
45% 37%
International / National contract ratio
International Contracts National Contracts

Pierrel Research - Targets for 2011-2013
INCOME STATEMENT (€/k) 2011R 2012R 2013R
GROSS REVENUES 36,538 38,730 43,378YoY growth 11.0% 6.0% 12.0%
NET REVENUES 29,230 30,984 34,702YoY growth 6.3% 6.0% 12.0%
7
Pass-Through Costs 7,308 7,746 8,676% on Gr.Rvn 20.0% 20.0% 20.0%
Total operating costs 32,519 33,743 37,261
EBITDA 4,019 4,987 6,116% on Gr.Rvn 11.0% 12.9% 14.1%
% on Net.Rvn 13.7% 16.1% 17.6%
Pierrel Pharma - Summary Report
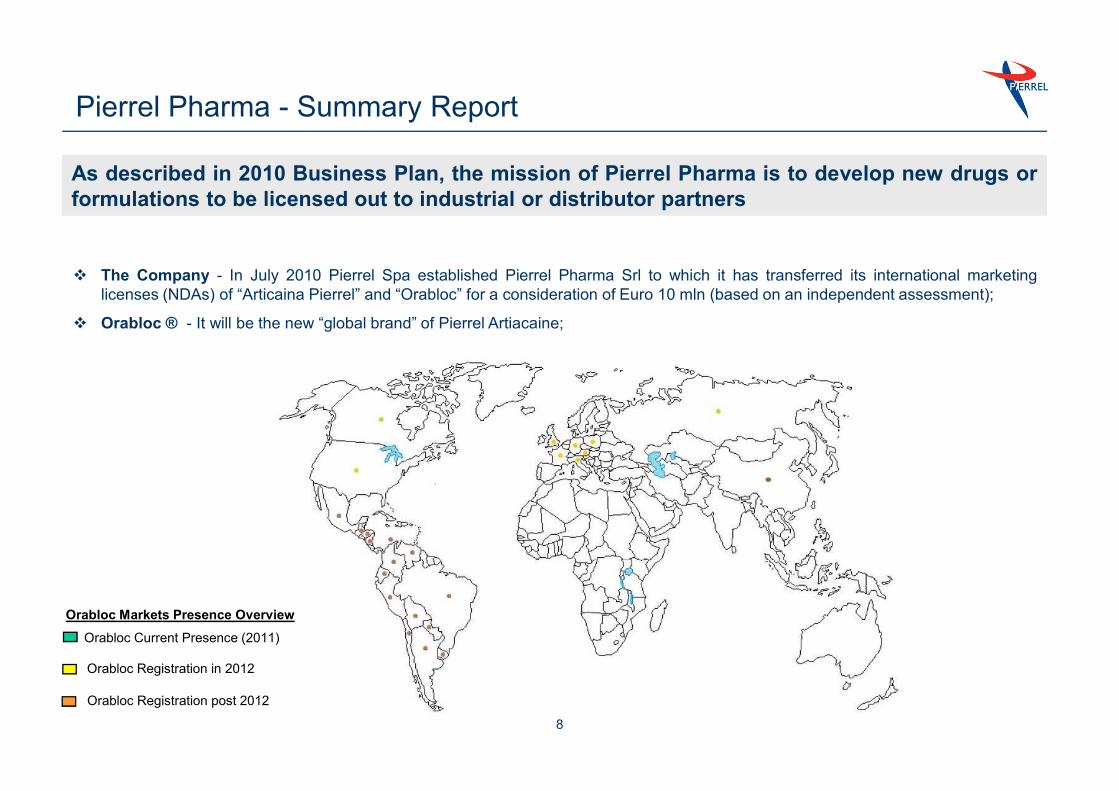
� The Company - In July 2010 Pierrel Spa established Pierrel Pharma Srl to which it has transferred its international marketinglicenses (NDAs) of “Articaina Pierrel” and “Orabloc” for a consideration of Euro 10 mln (based on an independent assessment);
� Orabloc ® - It will be the new “global brand” of Pierrel Artiacaine;
As described in 2010 Business Plan, the mission of Pierrel Pharma is to develop new drugs or
formulations to be licensed out to industrial or distributor partners
8
Orabloc Current Presence (2011)
Orabloc Registration in 2012
Orabloc Registration post 2012
Orabloc Markets Presence Overview

� The Patterson Agreement - In November 2010 Pierrel Pharma singed a 10 years distribution agreementPatterson Dental, an US leading distributor for dental products. The agreement has a minimum value of US$80mln.
� Orabloc® to be launch in the US on May 12nd 2011. The CMO division of the Group will responsible for itsmanufacturing.
� The company strategy represented in the “Business Plan 2010-12” is confirmed and it is under execution.
Pierrel Pharma - Summary Report
9
� The company strategy represented in the “Business Plan 2010-12” is confirmed and it is under execution.
� The Management – A new Business Development Manager, has been recently appointed in order to identify andselect the appropriate distributors in those European countries where Orabloc® is, at present, under registrationand whose approval is expected early next year.
� Targets Fundamentals -The company expects a cumulated EBITDA of Euro 7.7 mln in the period 2011-13,based on about 70 mln of cartridges sold. More in details, in addition to volume currently under contract (32mln inthe period 2011-13), Pierrel Pharma expects further 38mln of volume to be sold in USA, Canada, EU and Russiabetween 2012 and 2013, thanks to further registrations under approval and new contracts to be signed.

Costs executedinternally
Pierrel Pharma - Targets for 2011-2013
10
The price of € 0.14per unit does notinclude what is paidfor the manufacturingof € 0.2 per unit
� The recovery of efficiency - Following the conclusion of the investments aimed to obtain the FDAapproval, in 2010, the Capua plant has been mainly involved in the recovery of its efficiency. Theprocess has been very challenging and starting from the end of 2010, first results were visible. Anew controlling procedure has been implemented to closely monitor any production phase.
As described in 2010 Business Plan, the mission of the CMO Division is to exploit its high level
production standards and processes through the finalization of long term manufacturing
agreements, for a stable and predictable cash flow generation.
Pierrel Manufacturing - Summary Report
11
� Increased production volumes – The reported recovery of efficiency has been followed by agradual increase of production volumes. In 2010 the CMO division has posted a turnover of aroundEuro 13mln sales, compared with Euro 8mln sales of the previous year.
� Unmet 2010 results – The Business Plan presented in 2010 reported an expected sales of Euro14mln and Euro 0.6mln EBITDA. These results have not been reached due to more intensive thanexpected activities, needed to recovery the efficiency problems of the Capua plant.

� Backlog with > 10 Years Visibility – The plant FDA approval, combined with the support coming fromthe development of Pierrel Pharma, generated a strong increase in the backlog, currently above of Euro140 mln, most of which has more than 10 years visibility;
� Dentsply (Value of the contract: Euro 70mln): dental anesthetics-cartridges, all EU + UK +Australia + MEA, expiring date 2021, revenues per year c.a. Euro 7mln;
� Hereaus (Value of the contracts: Euro 22mln): dental anesthetics-cartridges, Germany, expiringdate 2022, revenues per year c.a. Euro 2mln;
� Patterson (Value of the contract for CMO Division: Euro 32mln): dental anesthetics, USA +Canada, expiring date 2020, revenues per year up to Euro 4mln;
Pierrel Manufacturing - Summary Report
12
Canada, expiring date 2020, revenues per year up to Euro 4mln;
� Curaden (Value of the contract Euro 8mln): dental anesthetics, Italy, expiring date 2021, revenuesper year Euro 0.8mln;
� Astrazeneca (Value o the contract Euro 3.6mln); local anesthetics and packaging of oral tablets,Italy, expiring date 2013, revenue per year Euro 1.2mln;
� Provenpharm (Value of the contract Euro 4mln): orphan drug Provenblue ®, 30 countries(EMEA), exclusivity production, expiring date 2015, revenues per year Euro 1mln (expected up toEuro 4-5mln per year);
� Others – The CMO Division has also other minor contracts
THESE FIGURES DOES NOT TAKE INTO ACCOUNT THE DEVELOPMENT OF PRODUCTION
COMING FROM THE EXPANSION OF PIERREL PHARMA (ORABLOC)

� Targets Fundamentals – The CMO Divisions expects in 2011 around Euro 16.4mln sales with an EBITDA in the range of Euro1.8mln. The results reached in Q1 (sales at Euro 3.6mln and EBITDA Euro 0.337mln) support our 2011 targets. Assuming theexpectations in terms of backlog and expansion coming from Pierrel Pharma, which production will be served by the CMO Division,in the period 2011-13 we expects sales of Euro 71 mln and an EBITDA of about Euro 15.5mln.
The management has already understudying a detailed project regarding a newline for the manufacturing of cartridgesamounting up to 60mln per year with a
Pierrel Manufacturing - Targets for 2011-2013
Data in K€ 2011 2012 2013Dentsply 40.0 45.0 45.0Hereaus 9.0 10.0 10.0Curaden 3.0 3.5 4.0Hansamed 1.0 1.0 1.0Pierrel 6.0 6.0 6.0Patterson 6.0 8.0 11.5Varie 8.0 6.0 6.0
Total Volume (Cartridges) 73 80 84Average price per unit (Euro) 0.20 0.20 0.20
Revenues Cartridges 14,473 15,900 16,700
13
The increase of volume is due to theexpansion of the proprietary Orabloc ® inUS, Canada, Russia, Germany, France,Poland, UK and Austria
amounting up to 60mln per year with acapex of Euro 4.5mln. Investments isplanned to start in 2012 to cover theincrease of sales from 2014
Revenues Cartridges 14,473 15,900 16,700Revenues Other Products 2,064 3,000 4,000
Total Revenues 16,537 18,900 20,700Variable Costs 9,410 10,250 10,978% of Tot Rev 57% 54% 53%
Fixed Costs 5,272 5,300 5,530% of Tot Rev 32% 28% 27%
EBITDA 1,855 3,350 4,192% of Tot Rev 11% 18% 20%
D&A 2,969 2,900 2,850Ebit (1,114) 450 1,342ROS na 2% 6%
Data in K€ 2011 2012 2013Capex (Euro mln) 4.5Additional Volume Cartridges (mln) 0 15 23Revenues per unit (Euro) 0.20 0.20 0.20
Additional Sales 0 3,000 4,600
Additional Fixed Costs 0 244 366Variable Costs (on Add Volumme) 0 1,627 2,439Total Addiotnal Costs 0 1,871 2,805Additionsl EBITDA (B) 0 1,129 1,795
TOTAL EBITDA (A+B) 1,855 4,479 5,987

Drivers of the economics
Sales
CMO
Pharma
CRO
� Start to benefit from 2011 of the new CRO international platform (over
20 countries) to access to projects on a international basis
� New CEO appointed in the USA in H2 2010 to facilitate the integration
and to boost the activity in USA
� Step up in backlog due to FDA approval
� Strong demand of FDA approved plant’s capacity that will allow Pierrel
to exploit the “duopolistic market structure” (only 2 plans FDA authorized
for the production of local dental anesthetics)
� NDA approval obtained in 2010 (Articaine)
� Implementation of the distribution agreement for the USA and Canadian
Order backlog overview - historical trend value (€m)
Strong order
backlog
increase
mainly due to
the FDA
approval of
Capua plant
Order backlog and drivers of the economics 2011-13
2769
43
4876
70146
187
020406080
100120140160180200
Dec 09 Mar 11
The value of the contract with Dentsply
expiring in 2021 is estimated to be equal to
c. €60-70m1
14
Pharma
EBITDA
CMO
Pharma
CRO
Centr.
costs
Implementation of the distribution agreement
markets. New agreements to be signed in Russia and other countries
� The development of new molecules will also contribute to boost revenues of the CRO and CMO divisions
� Benefits related to the introduction of the new CRO international platform
– Possibility to be awarded international sizable contracts with higher margin
– Significant cost synergies expected (€1-1.2m per year)
� Shortage of FDA authorized plant capacity are expecting to allow Pierrel to re-price the production increasing company’s marginality
� Exploitation of a significant operating leverage
� Efficiency improvements due to the completion of the start up phase
Order backlog - % of revenues secured by contracts
Long term
contracts (up
to 2020/21)
guarantee
high visibility
on cash flow
� Royalties scheme and distribution contract already signed
� Inelastic cost structure will allow Pierrel to benefit from a strong cash flow generation
Standard
contract with
1-1.5 years
tenor
Note
1 The value is estimated on the basis of the historical trend (the contract has geographical limitation but notincludes a minimum production)
2 Pending offers value as of March 2011 equal to c. €65m (excluding Pass Through).
2
Order backlog (€m)
Years 2011 2012
CRO > 60-65% > 25-30%
CMO 100% 82%
Dentsply CRO CMO
Preliminary targets 2011-13 at the current stage (1)
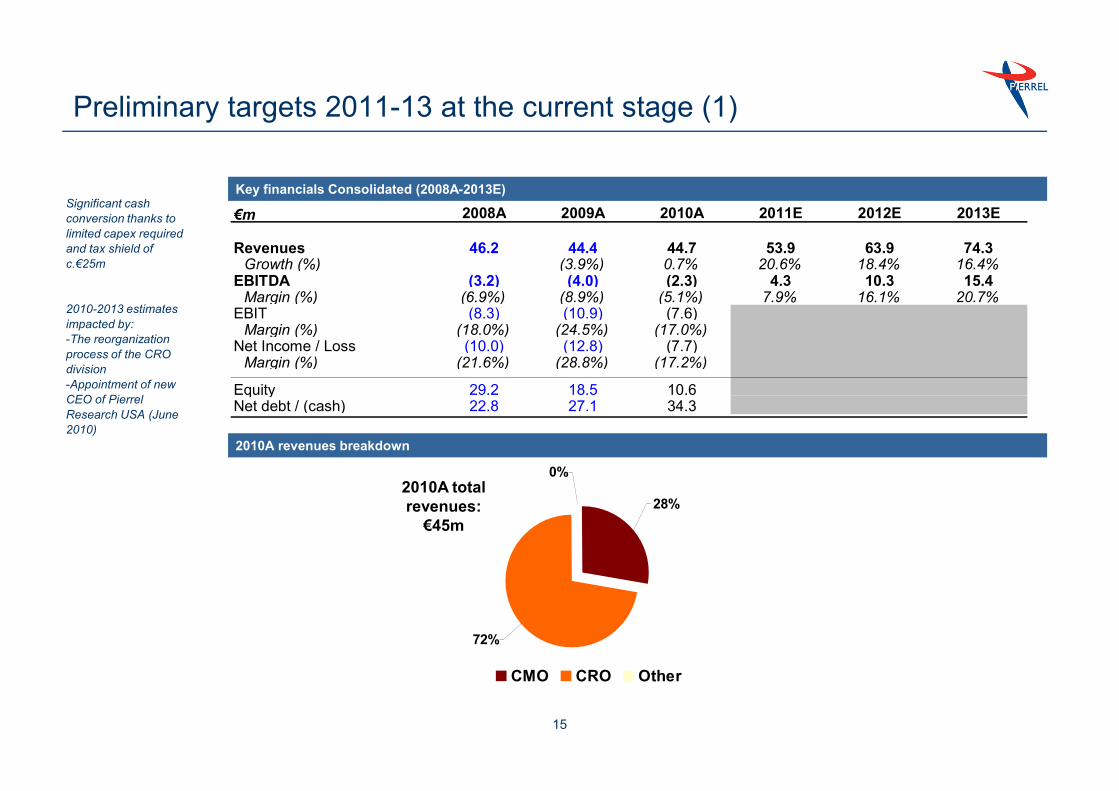
Key financials Consolidated (2008A-2013E)Significant cash
conversion thanks to
limited capex required
and tax shield of
c.€25m
2010-2013 estimates
impacted by:
-The reorganization
process of the CRO
division
-Appointment of new
CEO of Pierrel
€m 2008A 2009A 2010A 2011E 2012E 2013E
Revenues 46.2 44.4 44.7 53.9 63.9 74.3Growth (%) (3.9%) 0.7% 20.6% 18.4% 16.4%
EBITDA (3.2) (4.0) (2.3) 4.3 10.3 15.4Margin (%) (6.9%) (8.9%) (5.1%) 7.9% 16.1% 20.7%
EBIT (8.3) (10.9) (7.6)Margin (%) (18.0%) (24.5%) (17.0%)
Net Income / Loss (10.0) (12.8) (7.7)Margin (%) (21.6%) (28.8%) (17.2%)
Equity 29.2 18.5 10.6
15
0%
72%
28%
CMO CRO Other
2010A revenues breakdown
2010A total
revenues:
€45m
CEO of Pierrel
Research USA (June
2010)
Equity 29.2 18.5 10.6Net debt / (cash) 22.8 27.1 34.3

8.9 8.0 12.5 16.5 21.9 25.3
36.9 36.1 32.336.5
38.743.4- - --
0.83.2
5.7
0.4 0.2 - -
-
-
10.0
20.0
30.0
40.0
50.0
60.0
70.0
80.0
2008 2009 2010 2011 2012 2013
Preliminary targets 2011-13 at the current stage (2)
Revenues breakdown by division (€m)
CRO pass-
through 3 :20% 20% 20%
16
(1.9) (2.2) (0.9)1.9
4.5 6.02.1 2.3 2.5
4.0
5.0
6.1
- - -
0.3
2.5
5.0
(5.0)
-
5.0
10.0
15.0
20.0
2008A 2009A 2010A 2011A 2012A 2013A
CMO CRO Pharma
CMO CRO Pharma OtherEBITDA excluding centralized costs1 by division (€m)
2 2
Notes
1 Recurring centralized costs of the Group in 2010 to be equal to €3.4m, then €1.9m in 2011 and €1.7m in 2012 and 20132 Combined EBITDA of CMO and CRO divisions. CMO division reported negative EBITDA equal to €1.9m in 2008 and €2.2m in 2009. The CRO division reported a positive EBITDA
equal to €2.1m in 2008 and €2.3m in 2009 3 Pass-through cost: costs for provision of services requested to third parties and charged by Pierrel Group to its customers

First Quarter 2011 and Full Year Targets
REVENUES ANALYSIS
17
EBITDA ANALYSIS