Embed Size (px)
Citation preview

Business outlook in AzerbaijanThird issueDeloitte CIS Research Centre2H 2018

02
Brochure / report title goes here | Section title goes here
ContentsIntroduction 03
Azerbaijanin figures Macroeconomic outlook (GDP, inflation, currency rates etc.) 04
Keyindustries 12
AzerbaijanTax TransparencySurvey Research Center analysis 16
Contacts 27

Business outlook in Azerbaijan
03
IntroductionWe are pleased to present the third edition of Business Outlook in Azerbaijan, the Deloitte Research Centre’s macroeconomic journal.
We focus on the current trends in Azerbaijan economy and present our key research findings.
The current issue is focused on Azerbaijan’s taxation system. In September 2018, Deloitte conducted a survey of top management of leading Azerbaijani companies. This allowed us to identify priority areas of the taxation system in need of improvement, to assess the business community’s perception of the tax environment and to suggest measures required to increase the transparency level.
If you have any questions or suggestions regarding this research, please do not hesitate to contact us at: [email protected]
NuranKerimovManagingPartnerDeloitte Azerbaijan

Business outlook in Azerbaijan
04
Azerbaijan in figures 01
Business outlook in Azerbaijan
05
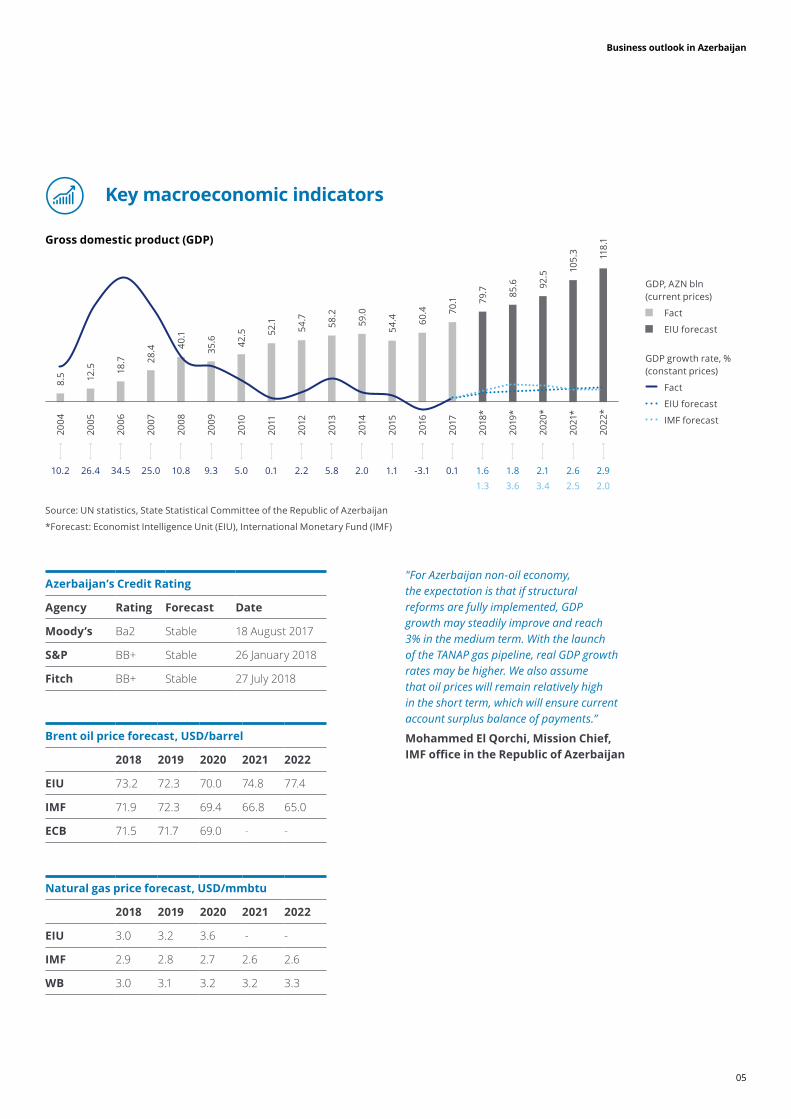
Grossdomesticproduct(GDP)
GDP, AZN bln (current prices)
Fact
EIU forecast
GDP growth rate, % (constant prices)
Fact
EIU forecast
IMF forecast
Keymacroeconomicindicators
Source: UN statistics, State Statistical Committee of the Republic of Azerbaijan
*Forecast: Economist Intelligence Unit (EIU), International Monetary Fund (IMF)
"For Azerbaijan non-oil economy, the expectation is that if structural reforms are fully implemented, GDP growth may steadily improve and reach 3% in the medium term. With the launch of the TANAP gas pipeline, real GDP growth rates may be higher. We also assume that oil prices will remain relatively high in the short term, which will ensure current account surplus balance of payments.”
MohammedElQorchi,MissionChief,IMF office in the RepublicofAzerbaijan
8.5
40.1 54
.7 60.4
92.5
12.5
35.6
58.2 70
.1
105.
3
18.7
42.5
59.0
79.7
118.
1
28.4
52.1
54.4
85.6
2004
2008
2012
2016
2020
*
2005
2009
2013
2017
2021
*
2006
2010
2014
2018
*
2022
*
2007
2011
2015
2019
*
26.4 9.3 5.8 0.125.0 0.1 1.110.2 10.8 2.2 -3.134.5 5.0 2.0 1.6 2.92.1 2.61.81.3 2.03.4 2.53.6
Azerbaijan’sCreditRating
Agency Rating Forecast Date
Moody’s Ba2 Stable 18 August 2017
S&P BB+ Stable 26 January 2018
Fitch BB+ Stable 27 July 2018
Brentoilpriceforecast,USD/barrel
2018 2019 2020 2021 2022
EIU 73.2 72.3 70.0 74.8 77.4
IMF 71.9 72.3 69.4 66.8 65.0
ECB 71.5 71.7 69.0 - -
Naturalgaspriceforecast,USD/mmbtu
2018 2019 2020 2021 2022
EIU 3.0 3.2 3.6 - -
IMF 2.9 2.8 2.7 2.6 2.6
WB 3.0 3.1 3.2 3.2 3.3

Business outlook in Azerbaijan
06
Foreigntrade,USDbln
Source: EIU
*Forecast
Source: State Customs Committee
In the forecast period (2018–2022), the value of exports is expected to be almost twice as high as that of imports. That will provide a solid positive trade balance and support Azerbaijan’s financial stability.
EIU estimates that in 2018–2022 exports will be adding 7percentper annum on average, while imports will grow by 4 percentannually.
2013
2017
2021
*
2014
2018
*
2022
*
2015
2019
*
2016
2020
*
31.8
15.2 20
.0
28.3
17.9 21
.0
15.6 17
.8
13.2
18.8
11.2
9.0 10
.7
9.3 9.5 10
.9
9.8
10.0
9.0 10
.5
Exports of goods
Imports of goods
Keymacroeconomicindicators
Structureofgoodsexportedin January–September2018,USDmln
Structureofgoodsimportedin January–September2018,USDmln
15.1%
28.0%
13.5%
23.2%
7.2%
13.0%
100%Total
Machinery and electrical
equipment
Vehicles, aircraft, vessels
Food and agricultural
products
Other
Metals
Chemicals
1,833
568
1,194
2,211
7,905
1,030
1,069
Petroleum products
Other
Food and agricultural
products
Total
Metals
Chemicals
3.1%
100%
1.1%
92.2%
2.2%
1.4%
13,156
318
445
14,275
203
153

Business outlook in Azerbaijan
07
Currentaccounts,USDbln
Keymacroeconomicindicators
Current account balance
Foreign trade balance
Services balance
Primary income balance
Secondary income balance
Source: EIU
*Forecast
20.6
6.1
9.3
18.9
8.4 10
.1
5.8 7.
8
4.2
8.3
2013
2017
2021
*
2014
2018
*
2022
*
2015
2019
*
2016
2020
*
-4.2 -3.4
-3.8
-6.1 -3
.5
-3.9
-4.2 -3.7-3.2
-3.8
0.7
0.7
0.6
0.7 0.
5
0.2
0.1
0.6
-4.1
-1.8
-3.1
-2.6
-2.1
-3.8-2
.0 -2.0
-2.5
-2.4
10.2 3.5 2.9-1.4 2.712.2 1.7 2.9-0.2 2.8

Business outlook in Azerbaijan
08
Keymacroeconomicindicators
According to the State Debt Management Strategy, sovereign debt will reach its peak of USD10.1bln by the end of 2019 and after that will drop to USD 6.5 bln by the results of 2025.
2.0 7.1
11.
8 17.
7*
19.
9
3.0 8.
1 13.
2 18.
4
2.6
9.6 1
4.1 1
8.9
4.8
10.
1
17.
4
19.
6 10 12
25
36
1114
43
1013
16
38
6
14
3733
2629
2006
2010
2014
2018
2022
2007
2011
2015
2008
2012
2016
2020
2009
2013
2017
2021
2019
Externaldebt
Source: EIU
*Including USD 9.6 bln of sovereign debt as of 1 July, 2018
2.0
6.4
13.8
5.5
4.0
10.5
5.06.1
11.7
4.05.2
14.2
5.3
2006
2010
2014
Aug
20
18
2007
2011
2015
2008
2012
2016
2009
2013
2017
Foreignexchangereserves,USDbln
Source: Central Bank of the Republic of Azerbaijan
External debt volume, USD bln
Fact
Forecast
External debt volume, percentage of GDP
Fact
Forecast

Business outlook in Azerbaijan
09
Retailtradeandpersonalincome
Keymacroeconomicindicators
Nominal personal disposable monthly income is growing steadily: EIU expects it will increase almost 1.5 times by 2022. EIU also forecasts that in 2019–2022 real income will be adding 3.9 percent per annum on average.
Stable growth of personal disposable income will favorably affect the growth in retail sales.
226
344
480
243
362
530
273
394
306
433
80 4
1
210
-44
12
2
2013
2017
2021
2014
2018
2022
2015
2019
2016
2020
92 4
-8
412
-1 5
-5
3Nominal personal disposable monthly income, AZN
Fact
Forecast
Retail sales dynamics, %
Real personal disposable income, %
Source: EIU
Averageconsumerpriceindex,%
Price indices
Fact
EIU forecast
IMF forecast
Source: State Statistical Committee of the Republic of Azerbaijan
*Forecast: EIU, IMF
Source: State Statistical Committee of the Republic of Azerbaijan, Central Bank of the Republic of Azerbaijan
9.6
1.5 2.4
12.9
16.7
7.9 4.06.7
20.8
1.1
12.48.3
5.71.4
2.8
4.64.6 4.84.5
2004
2008
2012
2016
2020
*
2005
2009
2013
2021
*
2006
2010
2014
2018
*
2022
*
2007
2011
2015
2019
*
2017
3.5
3.03.0 3.03.3
CPI,January-August2018bycomponents
Total 2.7%
Food products, beverages, tobacco 2.7%
Non-food products 3.2%
Services 2.4%

Business outlook in Azerbaijan
10
Keymonetaryindicators
EURandUSDvs.AZN,July2015–September2018
Average2015EUR 1.14USD 1.03
Average2016EUR 1.77USD 1.60
Average2017EUR 1.95USD 1.72
EUR
USD
Average9m2018EUR 2.04USD 1.70
01/0
7/20
15
01/0
7/20
16
01/0
7/20
17
01/1
0/20
15
01/1
0/20
16
01/1
0/20
17
01/0
1/20
16
01/0
1/20
17
01/0
1/20
18
01/0
4/20
16
01/0
4/20
17
01/0
4/20
18
01/0
7/20
18
01/1
0/20
18
Since 2017 the Central Bank of the Republic of Azerbaijan has been implementing the policy of managing the manat rate. Based on the current plan, a full transition to the free floating exchange rate will happen by 2020.
Since the beginning of 2018, Central Bank of Azerbaijan decreased the refinancing rate three times in a row. On 1 August 2018, the Central Bank kept the refinancing rate unchanged at 10.00 percent.
"If the price of oil is kept in the corridor of 60-70 dollars per barrel, there will be no problems with the transition to a free exchange rate.”
VahidAkhmedovMemberoftheMilliMajlis,DeputyChairmanofMilliMajlis'sCommitteeonEconomicPolicy
Source: Central Bank of the Republic of Azerbaijan
Source: Central Bank of the Republic of Azerbaijan
Currencyrate–EIUforecast
2018 2019 2020 2021 2022
EUR vs. AZN 2.01 1.96 1.96 1.91 1.92
USD vs. AZN 1.70 1.65 1.61 1.58 1.55
RefinancingrateandyieldofT-bills,%
5.253.00
15.00
3.00 3.504.757.00
Refinancing rate
Yield of T-bills
01/01/2011 01/01/201501/01/2012 01/01/201601/01/2013 01/01/201701/01/2014 01/01/2018
9.50
13.00
11.00
10.00

Business outlook in Azerbaijan
11
"Tax reforms will be aiming for increasing reporting requirements, that will be accompanied by a reduction in the tax burden.”
MikayilCabbarov MinisterofTaxesof the Republic Azerbaijan
Tax Taxdescription
Profittax Taxbase:gross income from economic activities less allowable deductionsTaxrate: 20%
VAT (valueaddedtax)
PayersofVAT: an individual or legal entity whose taxable sales amount to more than AZN 200,000 in a consecutive 12-months period
Objectoftaxation: supply of goods/provision of services and import of goodsTaxrate:18%
STS(simplifiedtaxationsystem)
Taxbase: gross revenue during any consecutive 12-months period not exceeding AZN 200,000 Taxrate:Baku – 4%, other regions – 2%
Propertytax For individuals
Taxrate:For buildings, the tax rate varies between AZN 0.1 and AZN 0.4 per square meter of the floor area, depending on its location.For water and air transport vessels, the tax rate is AZN 0.02 per cubic cm of its engine or 1% of the market value of water and air transport equipment without engines.
For legal entities
Taxbase: average annual value of fixed assets for residents; average annual value of fixed assets connected with a permanent establishment in Azerbaijan for non-residentsTaxrate:1%
Landtax Taxbase: land plots in the territory of the Republic of Azerbaijan owned or used by enterprises and individualsTaxrate:for agricultural land the tax rate is AZN 0.06 per hectare.For other land plots, the tax rate varies from AZN 0.1 to AZN 20 per 100 square meters, depending on the city, region and the plot size.
PIT(Personalincometax)
Taxbase:worldwide income of tax residents and Azerbaijani sourced income of non-resident individualsTaxrate: 14% for monthly taxable income up to AZN 2,500 and 25% of the amount exceeding 2,500 per month; 20% for all individuals engaged in entrepreneurial activity
Miningtax Therate depends on the type of mineral extracted and varies from 3% to 26% of its total wholesale price
Excisetax Taxrate: • tobacco products – AZN 12 per 1,000 cigarettes; • alcoholic beverages – varies from AZN 0.1 to AZN 6 per liter; • imports of passenger cars, leisure and sport yachts – different rates depending on the engine size; • imported platinum, gold, jewelry – different rates depending on number of grams of platinum, amount of gold in a thousand weight unit, diamond carats;
• import of fur-leather products – 10% from its wholesale price.
GlanceatAzerbaijantaxationsystem
Business outlook in Azerbaijan
12
Key industries02
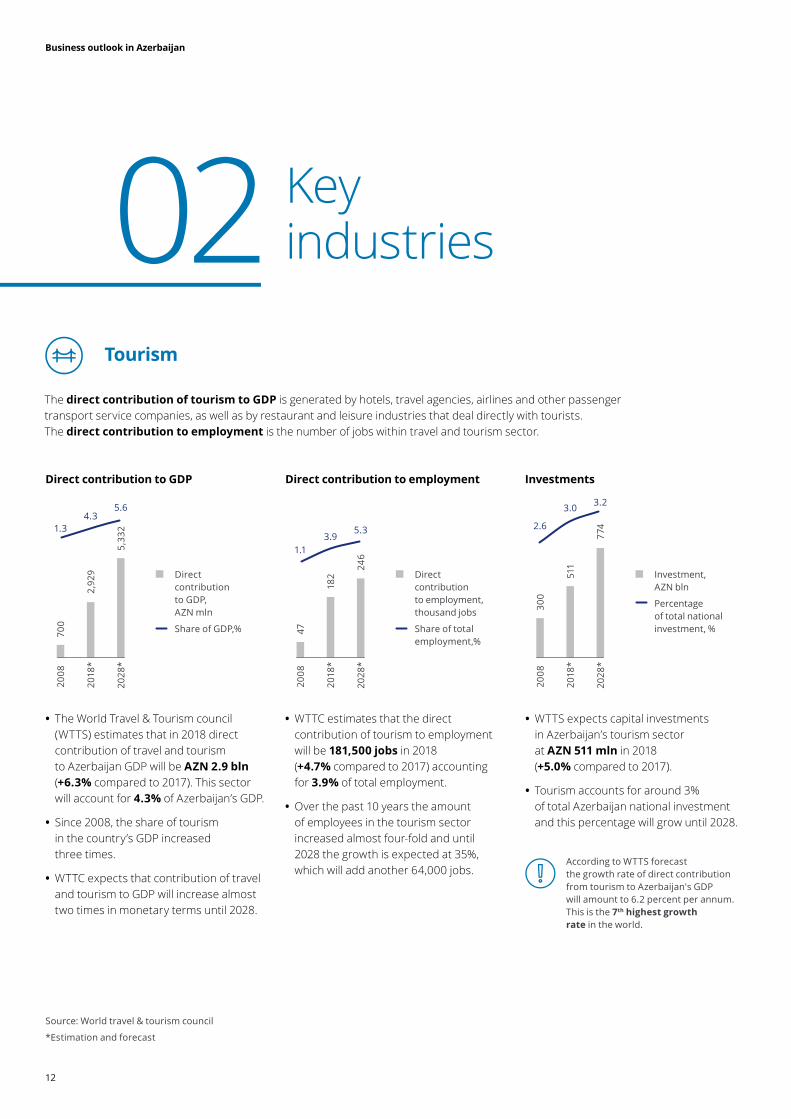
ThedirectcontributionoftourismtoGDPis generated by hotels, travel agencies, airlines and other passenger transport service companies, as well as by restaurant and leisure industries that deal directly with tourists.The directcontributiontoemploymentis the number of jobs within travel and tourism sector.
• The World Travel & Tourism council (WTTS) estimates that in 2018 direct contribution of travel and tourism to Azerbaijan GDP will beAZN2.9bln(+6.3% compared to 2017). This sector will account for4.3% of Azerbaijan’s GDP.
• Since 2008, the share of tourism in the country’s GDP increased three times.
• WTTC expects that contribution of travel and tourism to GDP will increase almost two times in monetary terms until 2028.
• WTTC estimates that the direct contribution of tourism to employment will be 181,500jobsin 2018 (+4.7% compared to 2017) accounting for 3.9% of total employment.
• Over the past 10 years the amount of employees in the tourism sector increased almost four-fold and until 2028 the growth is expected at 35%, which will add another 64,000 jobs.
• WTTS expects capital investments in Azerbaijan’s tourism sector at AZN 511 mln in 2018 (+5.0% compared to 2017).
• Tourism accounts for around 3% of total Azerbaijan national investment and this percentage will grow until 2028.
DirectcontributiontoGDP Directcontributiontoemployment Investments
Direct contribution to GDP, AZN mln
Share of GDP,%
Direct contribution to employment, thousand jobs
Share of total employment,%
Investment, AZN bln
Percentage of total national investment, %
Source: World travel & tourism council
*Estimation and forecast
2008
2018
*
2028
*
4.31.3
5.6
700
2,92
9
5,33
2
2008
2018
*
2028
*
3.91.1
5.3
47
182
246
2008
2018
*
2028
*
3.0
2.6
3.2
300
511
774
Tourism
According to WTTS forecast the growth rate of direct contribution from tourism to Azerbaijan's GDP will amount to 6.2 percent per annum. This is the 7th highestgrowthrate in the world.

Business outlook in Azerbaijan
13
• Top 5 countries account for more than 80 percent of foreign visitors in Azerbaijan.
• In 2017 a number of foreign visitors to Azerbaijan increased by20% to 2.7 mlnpeople.
• A number of foreign visitors from the UAE and Iran significantly increased in 2017 (by 93 percent and 46 percent respectively).
ForeignvisitorsarrivingtoAzerbaijanin2017bycountry,‘000people
Source: State Statistical Committee of the Republic of Azerbaijan
"We have identified 18 priority travel markets for which Azerbaijan could act as a popular tourist destination in the coming years. This includes Persian Gulf states, China, Japan, South Korea, Western Europe, Israel as well as our closest neighbours. Azerbaijan's tourist offices will appear in several countries by the end of 2018."
FuadNagiyevChairmanStateTourismAgencyof the Republic ofAzerbaijan
854Russian Federation
538Georgia
363Iran
302 Turkey
102 United Arab Emirates
Business outlook in Azerbaijan
14
Loansofcreditinstitutions
Overdueloans
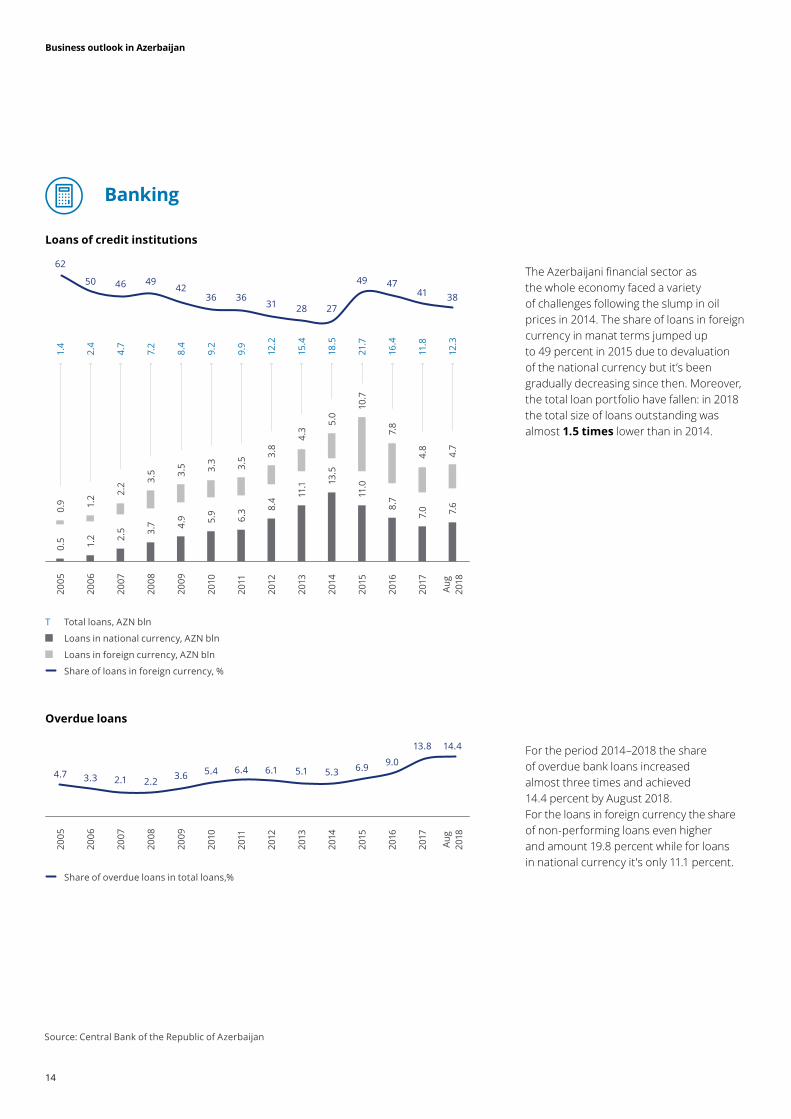
The Azerbaijani financial sector as the whole economy faced a variety of challenges following the slump in oil prices in 2014. The share of loans in foreign currency in manat terms jumped up to 49 percent in 2015 due to devaluation of the national currency but it’s been gradually decreasing since then. Moreover, the total loan portfolio have fallen: in 2018 the total size of loans outstanding was almost 1.5times lower than in 2014.
For the period 2014–2018 the share of overdue bank loans increased almost three times and achieved 14.4 percent by August 2018. For the loans in foreign currency the share of non-performing loans even higher and amount 19.8 percent while for loans in national currency it's only 11.1 percent.
Share of overdue loans in total loans,%
Source: Central Bank of the Republic of Azerbaijan
3.35.4 5.3
14.4
2.26.1
9.04.7 3.6 5.1
13.8
2.16.4 6.9
2005
2009
2013
2017
2006
2010
2014
2007
2011
2015
2008
2012
2016
Aug
20
18
T Total loans, AZN bln
Loans in national currency, AZN bln
Loans in foreign currency, AZN bln
Share of loans in foreign currency, %
0.5
4.9
11.1
7.0
1.2
5.9
13.5
7.6
2.5
6.3
11.0
3.7
8.4
8.7
2005
2009
2013
2017
2006
2010
2014
2007
2011
2015
2008
2012
2016
Aug
20
18
1.4
8.4
15.4
11.8
2.4
9.2
18.5
12.3
4.7
9.9
21.7
7.2
12.2
16.4
0.9
3.5
4.3
4.8
1.2
3.3
5.0
4.7
2.2
3.5
10.7
3.5
3.8
7.8
50
3627
38
49
31
47
62
42
28
4146
36
49
Banking

Business outlook in Azerbaijan
15
Thestructureofloansintheeconomybycreditinstitutiontype
Averageinterestratesonloansinnationalcurrency Averageinterestratesonloansinforeigncurrency
The share of state owned banks’ loans fell dramatically in 2017. Nevertheless, the state’s involvement in the banking sector remains significant.
Source: Central Bank of the Republic of Azerbaijan, EIU
9.9 21.715.4 11.89.2 18.5 12.312.2 16.4
3 33 42 3 32 3
30 2930 2925 30 2728 26
33 3433 5130 34 5536 36
34 3434
16
4333
15
34 35
2010
2014
Aug
20
18
2011
2015
2012
2016
2013
2017
14.4
10.08.9
13.3
8.6
14.111.5
8.9
14.5
9.7
01/0
1/20
10
01/0
1/20
14
01/0
1/20
18
01/0
1/20
11
01/0
1/20
15
01/0
9/20
18
01/0
1/20
12
01/0
1/20
16
01/0
1/20
13
01/0
1/20
17
19.818.5
17.118.3
15.7
20.5
17.716.3
19.1 17.5
Legal entities
Individuals
Legal entities
Individuals
14.2
9.26.8
13.2
5.6
14.710.8
6.8
14.3
8.8
01/0
1/20
10
01/0
1/20
14
01/0
1/20
18
01/0
1/20
11
01/0
1/20
15
01/0
9/20
18
01/0
1/20
12
01/0
1/20
16
01/0
1/20
13
01/0
1/20
17
23.721.5
15.9
22.116.0
23.320.7
16.5
22.9 20.7
High interest rates mean that many businesses prefer to finance investment with their own resources. Average interest rate on national currency loans for legal entities had been decreasing between 2013 and 2017 and stabilized at around 9% in 2018 even though a weak pace of economic activity depresses demand for new financing. At the same time, the interest rate on loans for individuals increased in 2018, impeding consumer lending growth.
T Total loans, AZN bln
The structure of loans in the economy by credit institution type, %
State owned banks
Private banks without foreign capital
Private banks with foreign capital
Non-bank credit institutions
Average interest rates on foreign currency loans are lower than rates on national currency ones but only companies that have their earnings in US dollars can afford it, while other borrowers are afraid of high currency risks.

Business outlook in Azerbaijan
16
Azerbaijan Tax Transparency Survey03
Deloitte Azerbaijan would like to thank all those who participated in the survey we conducted in September 2018. We appreciate your time and interest in our research.
Taxes serve as a powerful tool influencing businesses and investment climate of a country. Therefore, most recovery processes in any economy are naturally accompanied by changes in the national taxation system. Significant changes still await Azerbaijan's tax legislation, including a decrease in payroll tax burden, simplification of tax administration and the fight against tax evasion.
There has never been a more critical time to move beyond just tracking government-initiated tax developments towards a reliable and comprehensive impact analysis of the changes already introduced to the taxation system, including forecasting the effect of the decisions that are being discussed or had been made.
The expert opinions collected in this survey allowed us to conductan integrated analysis of Azerbaijan Tax Environment, as well as to study the sentiments and expectations of businesses regarding the changes in taxation.
We are pleased to present you with the key findings of our research. We hope that you will find this report to be useful and informative. We would be grateful if you would participate in our next survey.
Please feel free to contact us if you have any questions.

Business outlook in Azerbaijan
17
Howdoyouassessyourcompany’scurrentfinancialoutlookcomparedto thesituationsixmonthsago?
Therespondents’assessmentof the financial outlookof their companies
Financialoutlook
TrendsThe respondents’ assessment of their companies’ outlook became more conservative due to the high base effect in the previous period: as more businesses assess their financial position as good, their relative outlook becomes unchanged.
HighlightsNotably, financial services demonstrates the highest optimism among all industries – 78 percentof optimistic responses (24 pp above the average).
Azerbaijani companies with an annual revenue of less than AZN 1.25 mln demonstrate the highest optimism (72 percentof optimistic responses).
Optimistic
Pessimistic
No significant change
Optimistic
Pessimistic
No significant change
138 7
2H20
17
1H20
18
2H20
18
33
1320
54 79 73
1113 14 13
Cons
umer
bu
sine
ss
Tota
l
Ener
gy,
Reso
urce
s &
In
dust
rial
s
Fina
ncia
l Se
rvic
es
11
33 36 40
7854 50 47
1313 14 12
Ove
r A
ZN 5
0 m
ln
Tota
l
Less
than
AZN
1.
25 m
ln
AZN
1.2
5 m
ln
– A
ZN 5
0 m
ln
3333
14
41
5454 72 47
Byindustry,%Total,% Bycompanyrevenue,%

Business outlook in Azerbaijan
18
Therespondentswereaskedaboutexpectedchangesin key financial metrics overthenext12months
Revenue(inAZN),% Operatingprofit(inAZN),% CAPEX(inAZN)
Growth
Decrease
Unchanged
Growth
Decrease
Unchanged
Growth
Decrease
Unchanged
FinancialenvironmentinAzerbaijan
Our survey indicated that 77percent of respondents expect the revenue of their companies to increase, while only 13 percenthold the opposite view and 10 percentbelieve that it will remain the same.
Since the first half of 2018, the share of respondents, who expect a decrease in revenue, have grown by 7pp.
We found that the perception of operating profit changes follows the same trend as the outlook for revenue: the majority of companies (74percent) believe that the operating profit will increase while 13 percent expect a decline.
About half of respondents (46percent)expect that the CAPEX will remain at the same level. However, another 41 percent of experts forecast a CAPEX increase. Thirteen percent think that the CAPEX will decline.
Specificpatterns:Financial services experts and respondents from companies with an annual revenue of over AZN 50 mln expect an increase in revenue more often than others (89 percent and 88 percent respectively.
Specificpatterns:About one out of five(20percent)Consumer business expect a decrease in the operating profit.
Specificpatterns:About one out of three (29percent)experts from Energy, Resources & Industrials companies expect a decrease in CAPEX
Expectedchangeincorporaterevenue,operatingprofitandCAPEX
1H 2
018
2H 2
018
137
7473
1320
1H 2
018
2H 2
018
136
7777
1017
41%
13%
46%

Business outlook in Azerbaijan
19
Growth
Decrease
Unchanged
Growth
Decrease
Unchanged
Therespondentswereaskedaboutexpectedchangesin key financial metricsoverthenext12months
Numberofstaff,% Averagewages(inAZN),%
FinancialenvironmentinAzerbaijan
More than half of the companies (54 percent)are not planning headcount adjustments, while 31percentof respondents predict an increase and only 15 percent expect the opposite.
Compared to the situation observed six months ago, the share of companies that plan to hire additional staff has fallen by12percentagepoints.
The survey have identified almost the same opinions regarding payroll changes: two thirds of the respondents surveyed (62 percent)expect an increase in the average level of wages while another 33 percentof companies are not considering wage adjustments. In the second half of 2018, only 5 percent of companies planned to decease their payroll.
Specificpatterns:About half(44percent)of the financial services companies’ experts expect that the number of staff will increase.
Consumer business experts expect an increase in wages more often than respondents from other industries (80 percent).
Expectedheadcountandpayrollchanges
1H 2
018
2H 2
018
50
6267
3333
1H 2
018
2H 2
018
1510
31
43
5447

Business outlook in Azerbaijan
20
Ataxationsystem’sbenefitsforsociety
Doyouagreewiththestatement“TaxescollectedintheRepublicofAzerbaijanserveasfuturepublicinvestmentsthatwillcontributetothecountry’seconomy”?
Effectivetaxrateforthe2017financial taxyear
5%
8%
51%
36%
33%
6%
56%
5%
TrendsWith more than half(56percent) pointing out that their effective tax rate was below 25 percent in 2017, only 11 percentcited a higher effective tax rate. At the same time, every third respondent could not estimate it.
Agree
Partly agree
Partly disagree
Disagree
Effective tax rate of 25% or less
Effective tax rate of 26%–35%
Effective tax rate of more than 35%
Difficult to answer
Specificpatterns:All the financial services and consumer business respondents, who specified their effective tax rate, stated that it was 25 percent or less.
The only respondents to report an effective tax rate above 35% were 14 percent from energy, resources & industrials. Fifty-sevenpercent in this sector specified an effective tax rate below 25%.
87%
The majority of respondents acknowledge that taxes collected contribute to the Azerbaijan economy
Azerbaijan’staxenvironment

Business outlook in Azerbaijan
21
Taxburden
Specifywhetherthetaxburdenonyourbusinesshas changedoverthepastfiveyears.
41%
33%
26%
TrendsOne third (33percent) indicated that their companies had faced a significant increase in their tax burden over the last five years. Another 26percentsaw a minor growth in their tax burden.
At the same time, 41percentdid not register any change to their tax burden.
No respondents said that the tax burden on their business had decreased.
HighlightsAlmost half of the companies(47percent)in the consumer business sector noted a significant increase in their tax burden.
Forty-fivepercent of respondents in financial services did not notice any significant increase in their tax burden.
Respondents in energy, resources & industrials most often tend to specify that the tax burden has not changed over the last five years, with 57 percent saying so.
The tax burden increased significantly
The tax burden increased insignificantly
The tax burden remained unchanged
Azerbaijan’staxenvironment
The tax burden increased significantly
The tax burden increased insignificantly
The tax burden remained unchanged
33
26
41
22
45
33
29
14
57
47
26
27
Total
Energy, Resources & Industrials
Financial services
Consumer business
Theleveloftaxtransparency
Howwouldyouassessthelikelihoodofincreasingthetaxtransparencyofsmallandmediumenterprisesbyprovidingthemfinancingatpreferentialratesandconditions?
TrendsRespondents seem to be unsure whether preferential financing could have a positive impact on tax transparency for SMEs, with every third respondent finding it difficult to say whether this could be an efficient approach.
The situation will improve
The situation will largely remain unchanged
The situation will worsen
Difficult to answer
31%
28%
8%
33%
Of those who answered, 31percentindicated that reduced tax rates for SMEs could provide the tax authorities with more transparency on what SMEs do. At the same time, 28percentdo not expect that this measure will produce tangible results while another 8 percent have specified that it would be quite the opposite.

Business outlook in Azerbaijan
22
ClarityofAzerbaijan’staxlegislation
SpecifyhowyouassessthelevelofclarityofAzerbaijan’staxlegislation.
HighlightsTrendsPerceived tax clarity has a positive average balance of 0.17 on a scale from –1 to +1. This means that the tax legislation in Azerbaijan is mostly clear, but there are some unclear conditions.
Only8percent stated that the tax laws allow for complete understanding and unambiguity. At the same time, 61 percentnote some ambiguity even though they believe that tax regulations are generally clear.
Thirty-onepercent find it rather difficult when it comes to interpreting tax rules, including 13percent pointing to ambiguity and a lack of clarity regarding the tax legislation.
With a positive net balance of 0.25,respondents in energy, resources & industrials believe that the tax legislation in their sector provides more clarity.
At the same time, respondents in financial services more often tend to struggle with interpreting tax laws, which is demonstrated by a negative net balance of 0.06on perceived clarity.
Unclear +0.17 Clear
13% 18% 61% 8%
All conditions are clearly
interpreted and have a single
meaning
All conditions are unclearly interpreted and have different meanings
Most conditions are unclearly interpreted
and have different meanings, but some conditions are clear
Most conditions are clearly interpreted,
but some conditions are unclear and have different meanings
Azerbaijan’staxenvironment
+0.17 +0.18 +0.25 –0.06
Total Consumer business
Energy, resources & industrials
Financial services

Business outlook in Azerbaijan
23
Priorityareasinneedofbetterclarification
TrendsA clear majority of respondents (71–77percent) note the need for more transparency in taxation in areas such as transfer pricing, the elimination of double taxation and calculation of indirect taxes, with these three areas leading the rankings of legislation areas requiring more clarity.
Overall, respondents do not perceive the need for greater clarity as regards the taxation of income, calculation of taxes on the extraction of minerals, as well calculation of taxes and fees for social insurance and pensions.
Taxation of property is seen as providing the clearest transparency, with 78 percent stating that there is no need for further clarifications.
Taxation related to transfer pricing
Elimination of double taxation
Calculation of indirect taxes
Taxation of corporations
Taxation of foreign income
Taxation of income
Calculation of taxes on the extraction of minerals
Calculation of taxes and fees for social insurance and pensions
Taxation of property
23%
29%
29%
42%
52%
60%
64%
65%
78%
77%
71%
71%
58%
48%
40%
36%
35%
22%
Requires clarification
Does not require clarification
Top3
area
s
Azerbaijan’staxenvironment
Priorityactionstoreducetheshadoweconomy
TrendsA level playing field for all tax players has been selected by respondents as a top priority measure to tackle the shadow economy (54percent).
The need for decreasing direct taxes and improving accounting and reporting compliance comes second in importance, with 46percent indicating this.
However, respondents do not believe that horizontal monitoring and stricter penalties could be efficient as regards reducing the share of the shadow economy.
Top3
action
s
Create a level playing field for all tax payers
Decrease in direct taxes
Increase compliance in accounting and reporting
Decrease in indirect taxes
Implement a “whistle-blowing” system
Announcing a one-time tax amnesty
More severe penalties
Changing from vertical monitoring toward horizontal monitoring
54%
46%
46%
28%
26%
23%
18%
13%

Business outlook in Azerbaijan
24
Satisfactionwiththequalityoftaxaudits
Areyousatisfiedwiththequalityofthetaxauditsthat are being conductedbythetaxauthorities?
HighlightsUnlike respondents in the other industries surveyed, energy, resources & industrials companies(43percent)more often report dissatisfaction with the quality of tax audits.
Financial services tends to have a higher share of those who are somewhat satisfied with the tax audit quality(67percent).
Overall, consumer businesses more often indicate complete satisfaction with the tax audits, with 14percentsaying so.
TrendsThe respondents’ opinions about their level of satisfaction with the quality of tax audits were divided nearly equally, with 56 percentbeing satisfied, and 44 percent – dissatisfied.
26%
5%
51%
18%
I am absolutely satisfied
I am somewhat satisfied
I am somewhat not satisfied
I am not satisfied
Azerbaijan’staxauthorities
I am not satisfied
I am absolutely satisfied
I am somewhat satisfied
I am somewhat not satisfied
5
51
18
26
0
67
11
22
0
28
29
43
14
60
13
13
Total
Energy, Resources & Industrials
Financial services
Consumer business

Business outlook in Azerbaijan
25
Satisfactionwiththequalityoftaxaudits
Whatisthemajorissuecausingyourdissatisfaction?
HighlightsRespondents in energy, resources & industrials most often tend to cite requests for unnecessary documents calculation as a top reason for dissatisfaction with the tax audits (43 percent).
In financial services, two out of three companies (67 percent)indicated inefficient tax audit methodologies as a source of their dissatisfaction.
TrendsRespondents indicated a lack of/insufficiency of the methodology (36 percent) and unnecessary prolongation of tax audits(29percent)as their key reasons for being dissatisfied with the tax audits.
Requests for unnecessary documents and calculation files during a tax audit follows closely as another source of dissatisfaction(21percent).Fourteen percent also mentioned a lack of knowledge from tax inspectors.
36%
21%
29%14%
Lack of/insufficiency of the methodology to conduct tax audits by the tax authorities
Lack of knowledge from tax inspectors
Unnecessary prolongation of tax audits
Requests for unnecessary documents and calculation files during a tax audit
Azerbaijan’staxauthorities
The requirement of unnecessary documents and calculation files during a tax audit
Lack of/insufficiency of the methodology to conduct tax audits
Lack of knowledge from tax inspectors
Unnecessary prolongation
36
14
29
21
67
0
33
0
14
14
29
43
50
25
25
0
Total
Energy, Resources & Industrials
Financial services
Consumer business

Business outlook in Azerbaijan
26
Totalnumberofpermanentemployees
Companiesbyindustry
Less than AZN 1.25 mln
AZN 1.25–50 mln
Over AZN 50 mln
Less than 125
125–500
More than 500
Aboutrespondents
Financial services
Other
Consumer business
Energy, Resources & Industrials
3%
38%
36%
23%
Annualgrossrevenuein2017
44%
18%
38%
28%
36%
36%

Brochure / report title goes here | Section title goes here
NuranKerimovManagingPartnerDeloitte [email protected]
JalalHajibayovSeniorManager,Risk AdvisoryDeloitte [email protected]
EmilGarayevDirector,Tax&LegalDeloitte [email protected]
LoraZemlyanskayaResearchCentreLeaderDeloitte [email protected]
JoePacelliPartner,Headof Business DevelopmentDeloitte [email protected]
VictoriaPigalkinaAnalystDeloitte [email protected]
MikhailGordeevSeniorResearchSpecialistDeloitte [email protected]
Contacts

deloitte.azAboutDeloitte
Deloitte refers to one or more of Deloitte Touche Tohmatsu Limited, a UK private company limited by guarantee (“DTTL”), its network of member firms, and their related entities. DTTL and each of its member firms are legally separate and independent entities. DTTL (also referred to as “Deloitte Global”) does not provide services to clients. Please see www.deloitte.com/about for a more detailed description of DTTL and its member firms.
Deloitte provides audit, consulting, financial advisory, risk management, tax and related services to public and private clients spanning multiple industries. Deloitte serves four out of five Fortune Global 500® companies through a globally connected network of member firms in more than 150 countries bringing world-class capabilities, insights, and high-quality service to address clients’ most complex business challenges. To learn more about how Deloitte’s approximately 286,000 professionals make an impact that matters, please connect with us on Facebook, LinkedIn, or Twitter.
This communication contains general information only, and none of Deloitte Touche Tohmatsu Limited, its member firms, or their related entities (collectively, the “Deloitte Network”) is, by means of this communication, rendering professional advice or services. Before making any decision or taking any action that may affect your finances or your business, you should consult a qualified professional adviser. No entity in the Deloitte Network shall be responsible for any loss whatsoever sustained by any person who relies on this communication.
© 2018 Deloitte & Touche LLC. All rights reserved.