Embed Size (px)
Citation preview

Business Intelligence (BI) Training Manual for MM – General Navigation Page 1
2012
Rick Heckman PASSHE 1/31/2012
SAP Business Intelligence (BI) Reporting Training for MM
General Navigation
Business Intelligence (BI) Training Manual for MM – General Navigation Page 2
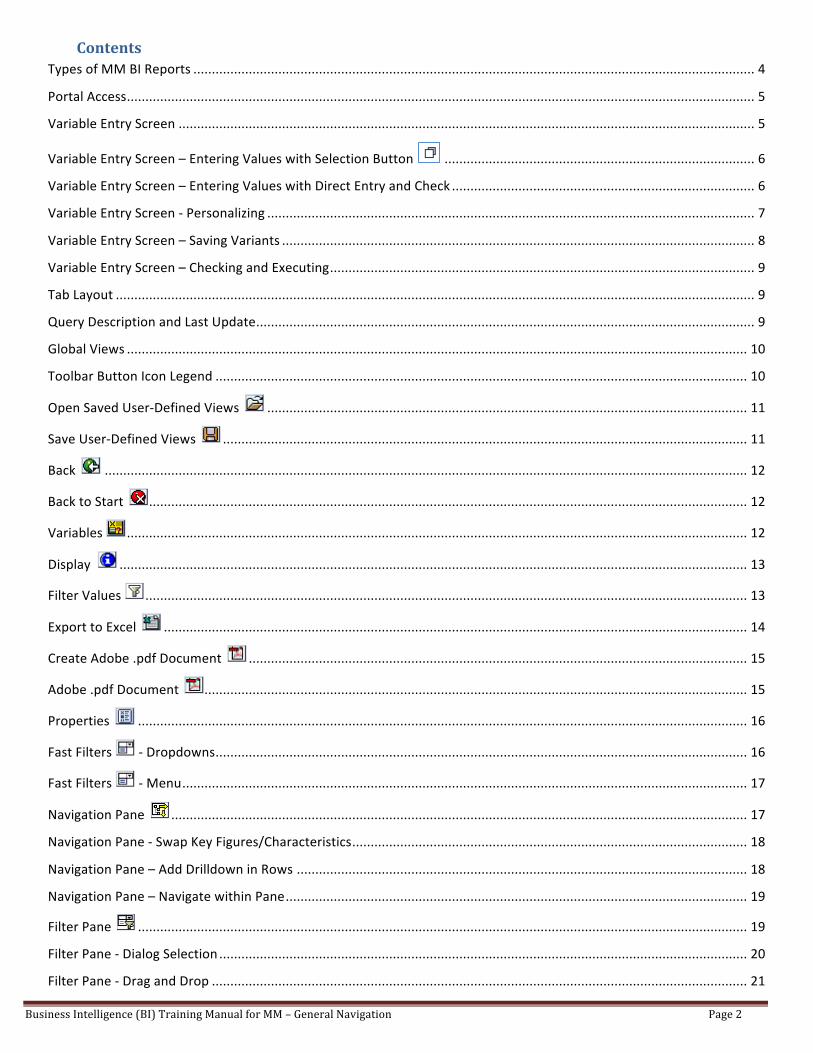
Contents Types of MM BI Reports ........................................................................................................................................................ 4
Portal Access .......................................................................................................................................................................... 5
Variable Entry Screen ............................................................................................................................................................ 5
Variable Entry Screen – Entering Values with Selection Button .................................................................................... 6
Variable Entry Screen – Entering Values with Direct Entry and Check .................................................................................. 6
Variable Entry Screen -‐ Personalizing .................................................................................................................................... 7
Variable Entry Screen – Saving Variants ................................................................................................................................ 8
Variable Entry Screen – Checking and Executing ................................................................................................................... 9
Tab Layout ............................................................................................................................................................................. 9
Query Description and Last Update ....................................................................................................................................... 9
Global Views ........................................................................................................................................................................ 10
Toolbar Button Icon Legend ................................................................................................................................................ 10
Open Saved User-‐Defined Views .................................................................................................................................. 11
Save User-‐Defined Views .............................................................................................................................................. 11
Back .............................................................................................................................................................................. 12
Back to Start .................................................................................................................................................................. 12
Variables ........................................................................................................................................................................ 12
Display .......................................................................................................................................................................... 13
Filter Values ................................................................................................................................................................... 13
Export to Excel .............................................................................................................................................................. 14
Create Adobe .pdf Document ....................................................................................................................................... 15
Adobe .pdf Document ................................................................................................................................................... 15
Properties ..................................................................................................................................................................... 16
Fast Filters -‐ Dropdowns ................................................................................................................................................ 16
Fast Filters -‐ Menu ......................................................................................................................................................... 17
Navigation Pane ............................................................................................................................................................ 17
Navigation Pane -‐ Swap Key Figures/Characteristics ........................................................................................................... 18
Navigation Pane – Add Drilldown in Rows .......................................................................................................................... 18
Navigation Pane – Navigate within Pane ............................................................................................................................. 19
Filter Pane ..................................................................................................................................................................... 19
Filter Pane -‐ Dialog Selection ............................................................................................................................................... 20
Filter Pane -‐ Drag and Drop ................................................................................................................................................. 21
Business Intelligence (BI) Training Manual for MM – General Navigation Page 3
Filter & Navigation Pane – Filter and Drilldown Drag and Drop .......................................................................................... 22
Exceptions ..................................................................................................................................................................... 23
Conditions ..................................................................................................................................................................... 23
Full Window .................................................................................................................................................................. 24
Data Table Navigation – Remove Characteristic From Drilldown ........................................................................................ 25
Data Table Navigation – Filter Out a Characteristic Value ................................................................................................... 25
Data Table Navigation – Move Columns .............................................................................................................................. 26
Data Table Navigation – Sort Columns ................................................................................................................................ 26
Data Table Navigation – Call Context Menu ........................................................................................................................ 26
Data Table Navigation – Context Menu Options (1 of 2) ..................................................................................................... 27
Data Table Navigation – Context Menu Options (2 of 2) ..................................................................................................... 28
Report to Report Interface – Jump/Goto Functionality ....................................................................................................... 29
Manage Saved Views – Open Views .................................................................................................................................... 30
Manage Saved Views – Delete Views .................................................................................................................................. 30
NOTES .................................................................................................................................................................................. 31

Business Intelligence (BI) Training Manual for MM – General Navigation Page 4
Types of MM BI Reports
Analytics: Analytical reports allow the user to enter a wide range of variables. These reports can be used as query tools to answer ad hoc questions. If the same question is asked frequently, user-‐defined or global views can be created for easy access in the future. Since analytic reports have few, if any, restrictions at the query level, the user should use caution when running the reports. A greater understanding of the data and functionality is needed.
Finished Reports: Finished Reports were created to answer a specific question. Because they are highly restricted by design, they have limited ability to be used to answer other reporting needs. Of course, users can still drilldown to detail and perform multiple navigation changes. Less understanding of the data and report functionality is needed since the finished report is formatted to answer the specific need when executed.
Report Data Source Type
Commitments Budget Accounting Analytics
Purchases Account Assignment Category Analytics

Business Intelligence (BI) Training Manual for MM – General Navigation Page 5
Portal Access BI MM reports are published on the portal for easy access. To access your BI MM reports via the portal, simply logon to the portal as you would to access ESS, for example.
1. Click on the Business Intelligence tab 2. Click on the Campus Reports tab 3. Click on a report link to open it in a new window
Variable Entry Screen
After clicking on the report link, a Variable Entry screen will appear before the report runs.
Variables allow the user to change the report criteria before execution. Use caution, variables determine the data you will see. Generally, analytical reports have more flexibility by giving the user more variables. This also adds risk and requires the user have a better understanding of the data. Finished reports, in contrast, have fewer variables and are more restricted at the query design level.
Screen shot of the Purchasing by Recipient report. Variable screens vary by report.
If a Variable has an asterisk to the left of the description, it is required. You must enter a value before running the report. This is often done for time variables to limit the amount of data and reduce run time.
There are different types of variables. Some allow ranges, some only allow a single value, and some will allow the user to enter multiple values.
If you don’t see the Business Intelligence or Campus Reports tabs, you do not have the appropriate Active Directory Group assigned to you. Contact [email protected] for access to Active Directory Groups or inability to see BI tabs. Please note, portal roles vary for each person. Your portal layout may differ from the screen shot.

Business Intelligence (BI) Training Manual for MM – General Navigation Page 6
Variable Entry Screen – Entering Values with Selection Button 1. Click on the Selection button to open a dialog box for the variable value options. 2. Select the value from the list by clicking on the block to the left of the value. In this example, multiple values can be
selected. 3. Click the Add button to add the values to the list. 4. After clicking add, notice the Selection values are added to the right. 5. Click OK when all the selection values are added
Variable Entry Screen – Entering Values with Direct Entry and Check
You can also type directly in the variable Current Selection box in most cases.
Simply click in the Current Selection box of the appropriate variable and type.
After typing the values, click on the Check button to verify the values you entered are valid.
If typing variables directly, keep in mind not all vales are intuitive. For example, Goods Recipient could be A COLEMAN or A. COLEMAN. If unsure, click the Check button.
When typing ranges, the hyphen must have a space on each side.
Keep in mind there are several types of variables. Some will only allow a single value to be selected. Others will prompt the user for a range of values. Many variables will also allow the user to exclude a value or multiple values. For example, you may want to exclude Students from Personnel Subarea or Group variables. The screen shot displayed is just one variable option.

Business Intelligence (BI) Training Manual for MM – General Navigation Page 7
Variable Entry Screen -‐ Personalizing
Personalizing is functionality that saves time by filling the variables current selection with predetermined values. For example, if you always want to see Requisition Created By on the Purchasing by Recipient report you can personalize that value to save time.
1. Enter the values that you want to personalize (populate automatically every time you run the report).
2. Click on the “Show Variable Personalization link
3. Select the variable you want to personalize by clicking on the block to the left of the variable. You can select multiple variables at one time.
4. Click on the “Add selected variables...” button to move the variables to the Personalized Variables area.
5. Variables displayed in the Personalized Variables area will display every time the report is executed. They only default; the user can still overwrite them at time of execution.
Variables are personalized, not the report. If another report uses the same variables, it may be personalized on the other report too.
Although you can personalize dates, keep in mind those dates will populate automatically even as time moves forward. Consider not personalizing the dates.

Business Intelligence (BI) Training Manual for MM – General Navigation Page 8
Variable Entry Screen – Saving Variants
Users also have the ability to save variants. Unlike Personalized variables, Variants do not default; rather the users can select variants from the Available Variants dropdown. Additionally, multiple variants can be created and even global variants that are available for all users.
1. Enter the variable values needed for the variant. Remember to click the check button if you are unsure of the validity of the variables.
2. Click the Save As… button 3. The Save Variant dialog box will open 4. The default setting is to save only user variants. Others will not be able to see your variants. If you need to
create global variants for others who use the report to see, please contact the BI Team as special authorizations are needed for creating global variants.
5. Type in the name of the variant. Try to describe what variable values the variant will return. 6. Click OK to save the variant.
After the variant is saved, you can access it every time you run the report. Simply select the variant from the dropdown list and the variables will populate as per the saved variant. You can also delete or save over any variants you create.
Personalized Variables vs. Saved Variants Personalized Variables Saved Variants
Variable is saved, not the report. Could affect other reports. Variant is saved on the specific report. Never affects other reports. One personalization per variable. Multiple variants can be saved per report. User-‐defined Personalization only – not global. Global variants can be saved with the appropriate authorizations. Automatically displays when report is executed. Manual selection from the Available Variants list necessary.

Business Intelligence (BI) Training Manual for MM – General Navigation Page 9
Variable Entry Screen – Checking and Executing
After you have selected your variable values, click the OK button to execute the report.
A spinning wheel will display while the report is running.
Typical run time could be from ten seconds to two minutes.
While a report is running, you can open another report or switch to another application such as email.
Tab Layout BI reports are typically bundled into a tab layout. The variables entered when the report is executed are applied to all tabs. To navigate from tab to tab, click on the appropriate tabs. Please note that a user should click one-‐time only. BI will display a processing wheel until processing is complete. In some cases, time variables may not apply to certain tabs. For example, trend tabs may automatically display 5 years, for
example, and ignore any time variable entered by the user.
For most reports, tabs are arranged in a logical order. Summary or high level data is typically first followed by more detailed or specific tabs. Specialty tabs, like Trends, can be found at the end.
Query Description and Last Update A. For each tab selected, the description of the query will display. The query provides the underlying data for the report. B. The Last Data Update date and time will also display on the information bar. This is the day and time the SAP BI reports were
last updated with SAP transaction or master data. Keep this date and time in mind when viewing BI reports. Remember, BI is a reporting platform and does not contain real-‐time data.

Business Intelligence (BI) Training Manual for MM – General Navigation Page 10
Global Views
Each tab may contain multiple views in a dropdown list. Simply click on the dropdown arrow to display a list of views built on the query. Click on the desired view and wait for the screen to refresh with the new view. The views are typically other navigation states of the same data but may also contain specific filters or conditions.
The view dropdown list contains global views – available to all who use the report.
Each view selected will reset dynamic (tab specific) filters.
The default view is typically designated by an asterisk * before the view description.
Toolbar Button Icon Legend
A. OPEN -‐ Access and open any previously saved used-‐defined views. B. SAVE -‐ Save a user-‐defined View after implementing formatting and criteria changes. C. UNDO -‐ Undo last navigation change. Each click will back out another step / change. Allow time for each screen
refresh. NOTE: THIS ACTION MAY TAKE SEVERAL MINUTES. WE ARE CURRENTLY WORKING ON A SOLUTION. D. RESET -‐ this will undo all user navigation, filter changes, and return the view to the way it was delivered. NOTE:
THIS ACTION MAY TAKE SEVERAL MINUTES. WE ARE CURRENTLY WORKING ON A SOLUTION. E. VARIABLE SCREEN -‐ This will return the user to the Initial Variable Screen to change your selections. F. DISPLAY -‐ This will show all variable and filter selections that are currently in effect. G. FITLER VALUES -‐ Hide/Display Variable (report-‐wide) and Dynamic (tab only) Filter Values. The report defaults to
display variable and filter values. H. EXCEL -‐ This will allow you to export the current view to Excel for further processing. I. PDF PRINT -‐ This will convert the current view to a pdf format to allow you to either print the view or save the
pdf file. J. PROPERTIES -‐ This will display the properties of the current view. Toggle on / off. K. FAST FILTER AND NAVIGATION -‐ Display Fast Filter Dropdowns, Fast Menus, and Fast Navigation Buttons. The
report defaults to display fast filter dropdowns and menus. L. NAVIGATION PANE -‐ This will allow you full access to the building blocks of the current view. Toggle on / off. M. FILTER PANE -‐ This will allow you full access to apply / remove filters on the data. Toggle on / off. N. EXCEPTIONS -‐ Add or edit the formatting of cells based on report values -‐ i.e. cells in red when dollar amount is
negative. O. CONDITIONS -‐ Limit display of data that meets particular user-‐defined criteria. P. FULL WINDOW VIEW -‐ Open the report detail or chart in a full window to aid scrolling. Q. DOCUMENTATION -‐ Access the report documentation and/or tab specific notes.

Business Intelligence (BI) Training Manual for MM – General Navigation Page 11
Open Saved User-‐Defined Views
Click on the Open User Defined Views icon on the toolbar to open the views you had previously saved.
1. Your user-‐defined views can be found on the Favorites tab of the Open dialog box.
2. Click on the view you want to open
3. You will notice after clicking on the view the name will appear. Verify you have the correct view selected. You can ignore the technical name. Click the OK button to open the view.
4. After clicking OK, you may be prompted to enter variables. Your current report will be replaced with the user-‐defined view you opened.
Save User-‐Defined Views
After making navigational and/or filter changes to a report, you may wish to save those changes for future reference. Saved Views can save considerable time. Click on the Save User-‐Defined Views icon on the toolbar to create a new user-‐defined view.
1. The Save Variable Values will be checked by default. Uncheck this box before saving.
2. On the Favorites tab…
3. You will notice all the views you have saved. You can click on one to overwrite it (with the same name) or double-‐click on a folder to save in a folder.
4. Type the Description of your view.
5. After typing the Description, click OK to save the user-‐defined view.
Folders can be created to organize your “Favorite” views. Go to the Manage Saved Views tab under Business Intelligence on the portal.

Business Intelligence (BI) Training Manual for MM – General Navigation Page 12
Back NOTE: THIS ACTION MAY TAKE SEVERAL MINUTES. WE ARE CURRENTLY WORKING ON A SOLUTION. Click on the Back icon to undo your last navigation or filter. Each time you click the Back button you will undo one step. You can click multiple times to undo multiple steps but you must wait for the screen to refresh after each click.
DO NOT use your browser’s back button or your browser’s context menu back button.
Browser Back Button Browser Context Menu
BI Toolbar Button BI Context Menu
Back to Start NOTE: THIS ACTION MAY TAKE SEVERAL MINUTES. WE ARE CURRENTLY WORKING ON A SOLUTION.
Clicking the Back to Start button will remove all navigation steps and return the report to the original navigational state. It will also remove any dynamic filters that we added since the report was executed.
Variables
Use the Variables Icon to quickly reprocess the report with new values.
1. Click on the Variables icon to call the variable screen to change variable values.
2. The variable dialog box will open. 3. Change the variable values. 4. Click OK to transfer the new variables
to the report with the same navigational state.

Business Intelligence (BI) Training Manual for MM – General Navigation Page 13
Display
The Display button will show toolbar icon legend, all variable and filter selections, query filters, general information, and any query documents.
1. Click on Display button on toolbar 2. Icon Legend will explain the use for each toolbar button 3. Variables and Filters will display all variable values, including blank variable values, as well as dynamic filters
on the active tab. 4. Static Filters/Query Filters will display variable values as well as filter values that are in the query design. 5. General Query information will display who created the query, the technical name of the query and web
template, who last modified the query, the current user, last update, etc. 6. Query Documents displays any documents that are attached to the query.
Filter Values
A. Variable Filters: This will display the variable values entered when you ran the report. B. Dynamic Filters: This will display any filtering done on the current tab. Dynamic filters only apply to the tab you
are viewing while Variable Filters are the same for all tabs. C. To hide the display of the Variable and Dynamic filters, toggle the icon. Hiding the filter values will give you
more screen area for the data but you may lose track of the filters on the data you are viewing.
Business Intelligence (BI) Training Manual for MM – General Navigation Page 14
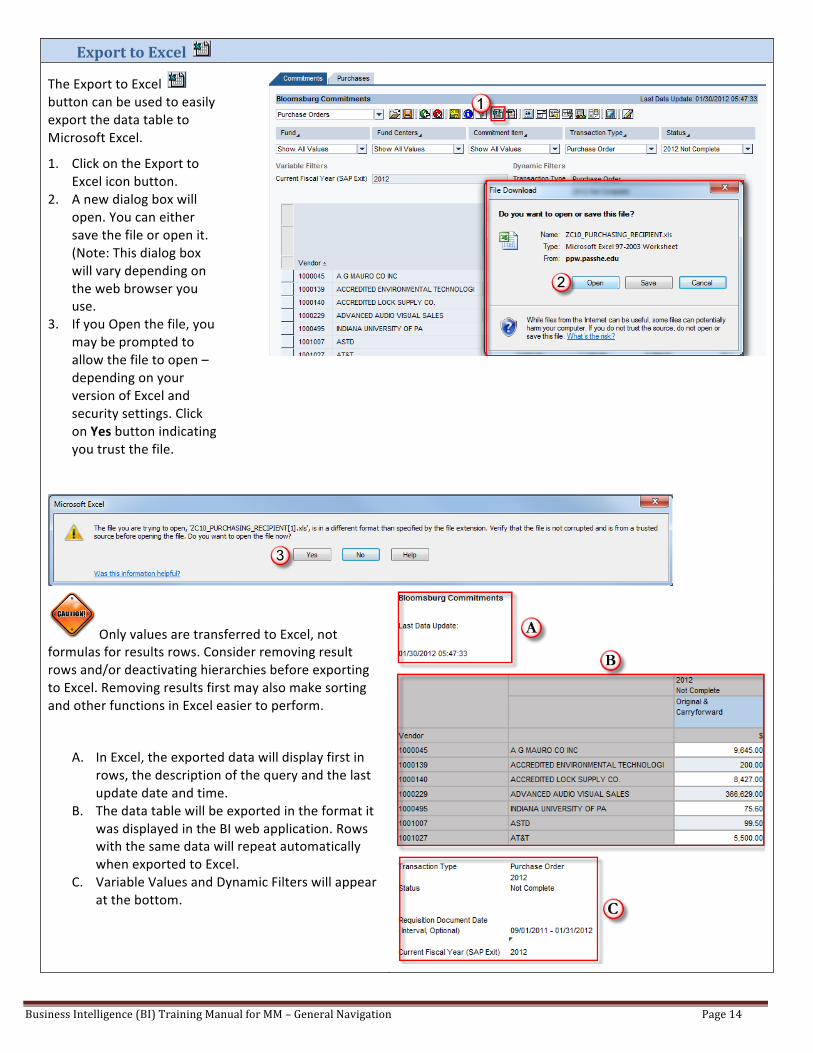
Export to Excel
The Export to Excel button can be used to easily export the data table to Microsoft Excel.
1. Click on the Export to Excel icon button.
2. A new dialog box will open. You can either save the file or open it. (Note: This dialog box will vary depending on the web browser you use.
3. If you Open the file, you may be prompted to allow the file to open – depending on your version of Excel and security settings. Click on Yes button indicating you trust the file.
Only values are transferred to Excel, not formulas for results rows. Consider removing result rows and/or deactivating hierarchies before exporting to Excel. Removing results first may also make sorting and other functions in Excel easier to perform.
A. In Excel, the exported data will display first in rows, the description of the query and the last update date and time.
B. The data table will be exported in the format it was displayed in the BI web application. Rows with the same data will repeat automatically when exported to Excel.
C. Variable Values and Dynamic Filters will appear at the bottom.

Business Intelligence (BI) Training Manual for MM – General Navigation Page 15
Create Adobe .pdf Document
1. Click on the Export to .pdf button to open the…
2. Export Dialog box. 3. Make any desired
settings changes. You can change from Black and White to color, change orientation (landscape or portrait), change margins, and even add text to the header or footer.
4. Click OK to complete export.
Adobe .pdf Document
A File Download dialog box will prompt you to Open or Save the Adobe .pdf file.
1. Open will open Adobe Acrobat for future printing or saving.
2. Save will allow you to save the file for future reference. The formatted report is displayed.
3. After exporting to Adobe .pdf, you will be able to Print, email, or Save the document for future reference. One of the new improvements to .pdf printing is that columns and/or rows headings will repeat for all pages.

Business Intelligence (BI) Training Manual for MM – General Navigation Page 16
Properties Users have the ability to change the properties of many reporting objects by activating the properties pane. Click on the Properties button to open the properties pane. (Click on Properties button again to hide the properties pane)
You can modify Table, Chart, All Data Cells, and Query properties.
1. For example, you may want to display text on every line, regardless if it is repeating.
2. Click on the Properties icon/button on the toolbar. The Properties Pane will display
3. On the Table tab
4. Check the “Display Repeating Text” checkbox
5. Notice that every row will now display text, even if that text is the same as the row above.
Fast Filters -‐ Dropdowns Each tab may contain a filter dropdowns with a list of values. For example, if you run the report for multiple Employee Subgroups you can simply select a single subgroup from the dropdown. After making a filter selection, the screen will refresh to display data for the single filter value.
Selecting a different view will reset all dynamic filter values.
Selecting a filter from a dropdown menu will only filter that tab. Only variables restrict all tabs.
Business Intelligence (BI) Training Manual for MM – General Navigation Page 17
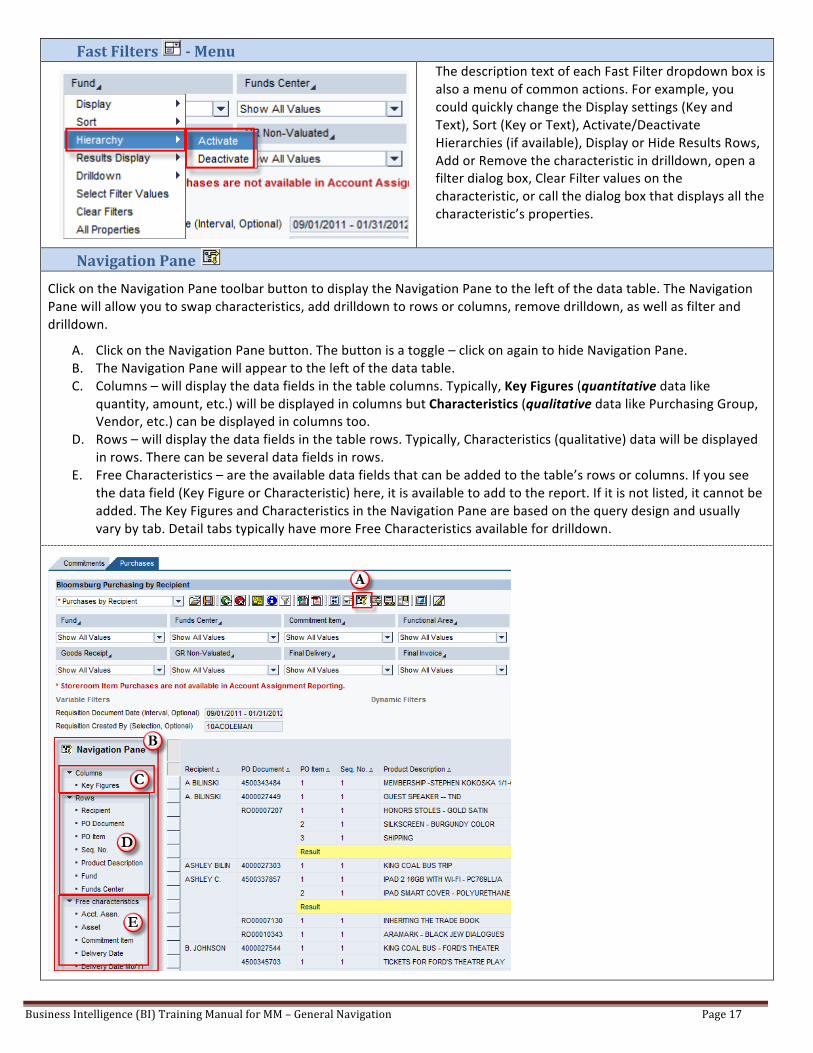
Fast Filters -‐ Menu
The description text of each Fast Filter dropdown box is also a menu of common actions. For example, you could quickly change the Display settings (Key and Text), Sort (Key or Text), Activate/Deactivate Hierarchies (if available), Display or Hide Results Rows, Add or Remove the characteristic in drilldown, open a filter dialog box, Clear Filter values on the characteristic, or call the dialog box that displays all the characteristic’s properties.
Navigation Pane
Click on the Navigation Pane toolbar button to display the Navigation Pane to the left of the data table. The Navigation Pane will allow you to swap characteristics, add drilldown to rows or columns, remove drilldown, as well as filter and drilldown.
A. Click on the Navigation Pane button. The button is a toggle – click on again to hide Navigation Pane. B. The Navigation Pane will appear to the left of the data table. C. Columns – will display the data fields in the table columns. Typically, Key Figures (quantitative data like
quantity, amount, etc.) will be displayed in columns but Characteristics (qualitative data like Purchasing Group, Vendor, etc.) can be displayed in columns too.
D. Rows – will display the data fields in the table rows. Typically, Characteristics (qualitative) data will be displayed in rows. There can be several data fields in rows.
E. Free Characteristics – are the available data fields that can be added to the table’s rows or columns. If you see the data field (Key Figure or Characteristic) here, it is available to add to the report. If it is not listed, it cannot be added. The Key Figures and Characteristics in the Navigation Pane are based on the query design and usually vary by tab. Detail tabs typically have more Free Characteristics available for drilldown.

Business Intelligence (BI) Training Manual for MM – General Navigation Page 18
Navigation Pane -‐ Swap Key Figures/Characteristics
To swap (replace) one characteristic with another one, single-‐click on the characteristic you want (Delivery Date in this example) and drag-‐and-‐drop it on top of the characteristic you want to replace.
Navigation Pane – Add Drilldown in Rows To Add a Drilldown to rows, click on the desired characteristic to add from the list of Free Characteristics, drag until a dark line appears. The line will indicate the new location of the characteristic to be added. Release and wait for the screen to refresh.
The new free characteristic will be added to the rows.
You can remove characteristics by clicking on the characteristic you want to remove and dragging it to the Free Characteristic section of the navigation pane.
<< After dragging-‐and-‐dropping the characteristic onto the data table you will see it display in the table as was as under the Rows in the Navigation Pane.

Business Intelligence (BI) Training Manual for MM – General Navigation Page 19
Navigation Pane – Navigate within Pane
Instead of dragging-‐and-‐dropping on the data table, you have the option to drag-‐and-‐drop within the Navigation Pane. Some users find this method easier, especially if the data table is complex.
Simply left-‐click, hold, and drag the characteristic from the original location to the desired new location within the Navigation Pane.
Remember, a solid line will insert and a teal highlight will swap.
Add Employee after Gender Swap Gender with Employee
Filter Pane
Click on the Filter Pane toolbar button to display the Filter Pane to the left of the data table. The Filter Pane will allow you to add or remove a filter on any characteristic or key figure.
A. Click on the Filter Pane button. The button is a toggle – click on again to hide Filter Pane. B. The Filter Pane will appear to the left of the data table. Note: If you have the Navigation Pane open, the Filter
Pane will display below the Navigation Pane. C. All Characteristics and Key Figures will be displayed as dropdown boxes for filtering. D. If you used a Fast Filter dropdown, notice the same Fast Filter dropdown filter values can be found in both the
Fast Filter and the Filter Pane.
Filter Pane vs. Fast Filters Filter Pane Fast Filters
• All Characteristics and Key Figures in the query are displayed
• Drag-‐and-‐drop functionality • Must open dialog box in most cases to filter – values not listed directly in dropdown
• The characteristics or key figure description is text only
• Can select multiple filter values with the dialog box
• Only commonly used Characteristics and/or Key Figures are displayed • No Drag-‐and-‐drop functionality • Available filter values display in dropdown box • The characteristics or key figure description is a menu of commonly used commands
• Can only select one filter value at a time

Business Intelligence (BI) Training Manual for MM – General Navigation Page 20
Filter Pane -‐ Dialog Selection
1. The Filter Pane will display to the left of the data table with all available characteristics and key figures.
2. To filter on a characteristic (Account Assignment in this example) select Edit from the dropdown box.
3. A new dialog window will open for the characteristic selected.
4. Find the value(s) you want to include (or exclude) in your filter and select the value(s) by clicking on the block to the left.
5. After making your selections, click on the Add button to move values to the Selections table on the right.
6. After clicking the Add button, the added values will display on the Selections table.
7. You can also exclude values by selecting the value and clicking the red square to exclude the value (not all characteristics will have exclude option).
8. When complete, click the OK button to transfer the filter.
9. After clicking the OK button to transfer the filter values, the dropdown will display the filtered value.
A “!” before the value indicates the value is excluded.

Business Intelligence (BI) Training Manual for MM – General Navigation Page 21
Filter Pane -‐ Drag and Drop Instead of using the filter dialog box to select filter values, you can also drag and drop values to restrict or exclude them from the results, depending on the “drop” location.
To filter or restrict to a single value, click on the value and drag-‐and-‐drop it onto the Filter Pane. The Filter Pane will highlight in teal when you hover over it with the selected value.
Drop on Filter Pane and wait for screen to refresh.
After dropping the value onto the Filter Pane, you will notice the data table will display only the single value and the Filter Dropdown on the Filter Pane will also indicate there is a filter.
The Filters tab will always display all dynamic filter values.
To Exclude a value from the data, click on the value and drag-‐and-‐drop it in the grey Filter Pane section “Drag from table and drop items here to remove/exclude filter value(s)”. A “!” before the value indicates the value is excluded.
You can drag and drop any characteristic or key figure value off the table to exclude it. When you drag a value off the table you will see the “X” by the curser indicating the value is going to be excluded. If you drag off a characteristic description, it will remove it from the drilldown, not exclude any values.

Business Intelligence (BI) Training Manual for MM – General Navigation Page 22
Filter & Navigation Pane – Filter and Drilldown Drag and Drop
Using the Navigation Pane, or Filter Pane, you can filter and drilldown in a single step.
A. Left-‐click and hold on the characteristic in the Navigation or Filter Pane.
B. Drag the characteristic onto the data table and drop it on the value you would like restricted.
C. Notice in the example, the characteristic in the drilldown has no restrictions prior to the filtering characteristic being dropped onto a current value.
D. After releasing, the characteristic moved from the Navigation or Filter Pane will appear in the rows.
E. Additionally, you will notice the characteristic value that the new characteristic was dropped on now shows up in filter restrictions.
By following these steps, you can easily filter and restrict with a single drag and drop action.
Remember, this action can be performed from the Filter Pane and the Navigation Pane.

Business Intelligence (BI) Training Manual for MM – General Navigation Page 23
Exceptions Exceptions are created to apply “conditional formatting” to the data table. If the query developer created an Exception on the query, you have the ability to Active or Deactivate the Exception but not change or delete it. You can create new Exceptions at any time on any tab.
1. Click on the Exceptions button to display the Exceptions Pane. 2. The Exceptions Pane will display to the left of the data table. 3. If the query designer created any Exceptions on the query, you will be able to active or deactivate the
Exceptions here. You can also create a new one by clicking the Add button. 4. Active Exceptions will color-‐code the data table by the Exception Definition. In this example, all Purchase
Orders with Net Value over $10,000 are displayed in orange.
If you create an Exception it will not be saved unless you save a new user-‐defined view.
Conditions Conditions are created to apply filters to the data table based on Key Figure values. If the query developer created a Condition on the query, you have the ability to Active or Deactivate the Condition but not change or delete it. You can create new Condition at any time on any tab.
1. Click on the Conditions button to display the Conditions Pane. 2. The Conditions Pane will display to the left of the data table. 3. If the query designer created any Conditions on the query, you will be able to active or deactivate the
Conditions here. You can also create a new one by clicking the Add button. 4. Active Conditions will filter the data table by the Condition Definition. In this example, the Top 10 Vendors are
displayed based on PO Net Value.
If you create a Condition it will not be saved unless you save a new user-‐defined view.

Business Intelligence (BI) Training Manual for MM – General Navigation Page 24
Full Window
If you data list is very long, you may wish to open the data table in a full window. You will still have the ability to use the BI Context Menu but the other web items will be removed from the full window view. Simply click on the Full Window button to open a new window.
The Full Window screen will allow the user to set up the data table with scrolling that will “freeze” the data column headings.
There are several tools that will help maximize the display area and assist with scrolling while locking the column and row headings.
A. You can adjust the display area by entering the number of rows and columns to display at one time. Simply enter a number and press Enter on your keyboard. You can set the rows and columns to a display area that best fits your computer’s screen size and resolution. The step increment settings will determine how many rows or columns are scrolled with each page. For example, you can display 15 rows at a time but only step through five rows with each click of the Next Page button.
B. Use the scroll buttons to scroll through the data. Column and row headings will display with each step.
C. You can also use the scroll bar on the right and/or bottom of the screen to scroll through pages.
Button Action
First Entry / Last Entry – The page will step to the start or end of the data table. Previous Page / Next Page – The page will step according to the step increment setting Previous Item / Next Item – The page will step by a single row at a time.
Clicking in the open area of a horizontal or vertical scroll bar is the same as a Page step

Business Intelligence (BI) Training Manual for MM – General Navigation Page 25
Data Table Navigation – Remove Characteristic From Drilldown
<<<After
Left-‐click and hold a Characteristic or Key Figures column heading/description, then drag the characteristic description off the data table.
When you see the symbol, release the mouse button and the characteristic will be removed from the drilldown. NO FILTERING WAS DONE.
After: The characteristic, Vendor in this example, was removed from the drilldown on the data table but no filtering was done.
Data Table Navigation – Filter Out a Characteristic Value
<<<<After
Left-‐click and hold a Characteristic or Key Figures value, then drag the characteristic value off the data table.
When you see the symbol, release the mouse button and the characteristic value will be restricted out of the data. FILTERING ON THE DATA WAS DONE.
After: The characteristic value, Separated in this example, was set as a filter exclude on Requisition Created By. The characteristic still displays in rows.
A “!” before the dynamic filter value indicates the value is excluded.

Business Intelligence (BI) Training Manual for MM – General Navigation Page 26
Data Table Navigation – Move Columns
<<After
To move Key Figures columns, simply left-‐click and hold on the heading/description on the column you want to move and drag it onto the heading description you want it to appear BEFORE.
After: When you drop a key figure heading/description onto another one it will appear before the one it was dropped onto.
Data Table Navigation – Sort Columns
Icon Status Action on Click
Not Sorted Sort Ascending
Sorted Ascending Sort Descending
Sorted Descending Sort Ascending
Key Figures and Characteristics can be sorted directly on the data table by simply clicking on the sort icon next to the description. One click will sort ascending, click on the icon again and it will sort descending.
Characteristics can also be sorted by key or text. Go into the characteristics properties to specify a key or text sort if needed.
Data Table Navigation – Call Context Menu
The BI Context menu can be opened from the data table. Right-‐click on any BI object on the data table to call the context menu.
You must see the HAND to call the BI context menu. If you don’t see the hand, a right-‐click may call your browser’s context menu. Do not use the browser context menu.

Business Intelligence (BI) Training Manual for MM – General Navigation Page 27
Data Table Navigation – Context Menu Options (1 of 2)
Back Back One Navigation Step Choose Back → Back One Navigation Step if you want to undo a navigational step. Back to Start Choose Back → Back to Start if you want to restore the initial state of view.
Filter Keep Filter Value To display the data for one characteristic value only, choose Filter → Keep Filter Value. The characteristic value itself is removed from the drilldown. Keep Filter Value on Axis Choose Keep Filter Value on Axis if you want to display the data for one characteristic value only but still want to display the characteristic value itself in the drilldown. Filter and Drill Down By > Characteristic Choose Filter and Drilldown By to fix a characteristic to a value in one step (meaning to filter it) and to drilldown according to another characteristic on the same axis (row axis or column axis). Select Filter Value Choose Select Filter Value if you want to filter the data table according to values. Remove Filter Value Choose Remove Filter Value to remove a selected filter value from the selected characteristic and display the table unfiltered.
Change Drilldown Add Drilldown According To >Characteristic 1 In the context menu for a characteristic value or characteristic description, choose Add Drilldown According To → Employee Group if you want to add a characteristic (such as Employee Group) to a particular position in the drilldown. Swap characteristic 1 / structure 1 with > characteristic 2 / structure 2 You can use this function to swap a characteristic or structure with another characteristic or structure. Remove Drilldown Choose Remove Drilldown if you want to remove a characteristic from the drilldown. Swap Axes You use this function to swap the axes of the query. For example, if you have characteristics in the rows and key figures in the columns and you choose Swap Axes, the key figures are displayed in the rows and the characteristics are displayed in the columns.

Business Intelligence (BI) Training Manual for MM – General Navigation Page 28
Data Table Navigation – Context Menu Options (2 of 2)
Hierarchy Hierarchy Active You use this function to switch display hierarchies on and off. Hierarchy Node Expanded Select Hierarchy Node Expanded if you want to expand a hierarchy node. If you want to collapse the hierarchy node, deselect the indicator. You can also expand or collapse the hierarchy node by choosing the hierarchy icon. Expand Hierarchy > Level 1/2/3… Choose Expand Hierarchy > Level 1 if you want to display more levels of the hierarchy. You can also expand the hierarchy by choosing the hierarchy icon.
Properties Characteristic You can make various settings for the characteristic here. Data Cell You can make various settings for the structure element or data cell (intersection of two structure elements) here. All Data Cells You can make various settings for all structure elements in the drilldown for the Web application. Data Providers You can make various settings for the data provider at runtime. Axis You can make various settings for the axis here. Web Item You can make various settings for the Web item here.
Calculations and Translations Calculate Single Values As You use this function to recalculate single values that are displayed in the query according to various criteria (such as minimum, sum, rank number, and so on): Calculate Results As You use this function to recalculate results rows that are displayed in the query according to various criteria (such as first value, last value, average, average, median, and so on): Cumulate After Applying Details and Result Calculations You use this function to cumulate the individual cells of an area. This means the first value is added to the second value, the result is added to the third value, and so on. In the columns, the cells are cumulated from top to bottom, and in the rows, the cells are cumulated from left to right. With blocks of single values, that is, a drilldown in both the rows and the columns, the values are cumulated from top to bottom and from left to right. Formulas You can recalculate the key figures in a structure using a formula. You can also edit or remove existing user-defined formulas. If you want to keep a formula for future reference you must save a view.
Goto Choose Goto → ME23N (for example), if you want to navigate to jump targets using the report-report interface.
Sorting Depending on the cell for which you call the context menu. For characteristics, you can sort the characteristic values or attributes according to various criteria, in ascending or descending order. You can sort according to key or name.
Business Intelligence (BI) Training Manual for MM – General Navigation Page 29
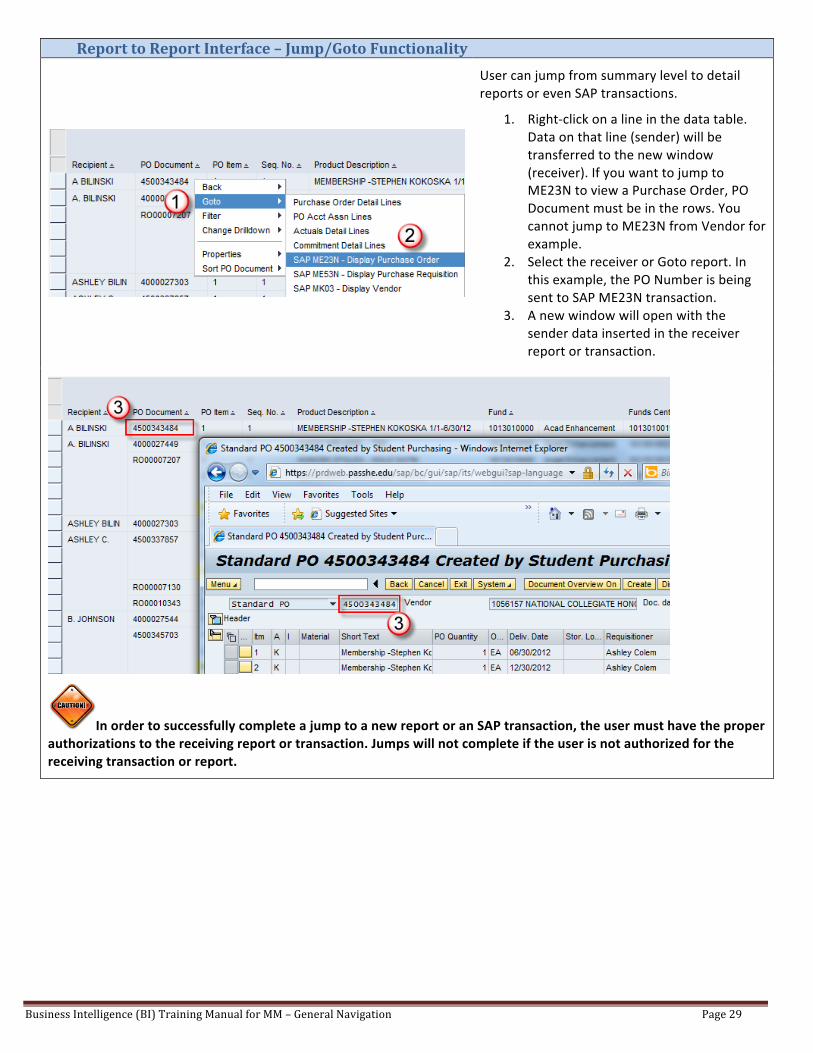
Report to Report Interface – Jump/Goto Functionality
User can jump from summary level to detail reports or even SAP transactions.
1. Right-‐click on a line in the data table. Data on that line (sender) will be transferred to the new window (receiver). If you want to jump to ME23N to view a Purchase Order, PO Document must be in the rows. You cannot jump to ME23N from Vendor for example.
2. Select the receiver or Goto report. In this example, the PO Number is being sent to SAP ME23N transaction.
3. A new window will open with the sender data inserted in the receiver report or transaction.
In order to successfully complete a jump to a new report or an SAP transaction, the user must have the proper authorizations to the receiving report or transaction. Jumps will not complete if the user is not authorized for the receiving transaction or report.

Business Intelligence (BI) Training Manual for MM – General Navigation Page 30
Manage Saved Views – Open Views The Manage Saved Views tab on the Business Intelligence menu will be used for two purposes. It will enable a user to directly access a personal view they have created. These views will appear in the “Favorites” folder (The procedure for creating personal views is explained on page 10). Additionally, the portal is the only place a user can delete his or her personal views. Other users will not be able to see your personal views so feel free to create as many as necessary to meet your reporting needs.
To open a view from the Business Intelligence>Manage Saved Views tab, simply click on the view link. The report will run on the home page of the portal.
Open Personal View on Manage Saved Views of Portal vs. Open Folder on Reports Manage Saved Views Tab Open Folder on Report
• Views can be deleted • Variables are not called. Report runs with saved variables. • No working wheel is displayed • The saved view opens on the Home page of the portal
• Views cannot be deleted • Variables are called and can be changed prior to execution • A working wheel is displayed showing the report is running • The saved view opens in the same window as the current report
Manage Saved Views – Delete Views To delete a view, click on the context menu icon to the right of the view name and select delete from the context menu. This will only delete your personal view and will not affect others.

Business Intelligence (BI) Training Manual for MM – General Navigation Page 31
NOTES