Embed Size (px)
Citation preview

Business Case
Telecommunications Network
Capacity & Coverage

Business Case – Network Capacity and Coverage i
Executive Summary
The existing Ergon Energy telecommunications network (comprising of fibre optic cables, microwave
links, Time Division Multiplexing (TDM) equipment, Internet Protocol (IP) networking equipment,
collectively called CoreNet) provides for a high speed, high capacity and robust telecommunications
network, supporting the primary power distribution network in order to meet legislative, safety,
business and customer requirements.
The number of Telecommunications services catered for on the network continues to grow despite
the low growth in load on the power network. The number of services has approximately doubled in
the current control period between 2015 and 2019. As the services have grown in number and
utilisation, they have consumed capacity on the network such that capacity constraints are now being
experienced. Key strategic directions including the various programs associated with the Intelligent
Grid Strategy, including the likely impact of Internet of Things (IoT) devices and expanded monitoring
of the Distribution Network to improve Asset Management for primary network assets, will cause
increasing capacity and congestion issues during the 2020-25 regulatory period. As the number of
services increases on existing links, the risk associated with failure of links without redundancy or
loop diversity increases. These increasing risks can be mitigated by the strategic implementation of
diversity to the existing network.
Two options were considered but rejected for this business case. A counterfactual, ‘do nothing’
option was rejected on the basis that it would pose unacceptable risk to the network. Another option
to completely offset the cost of Telco Transmission Augmentation using DWDM was also rejected.
This option is not considered reasonable, as DWDM would not be able to provide the necessary
outcomes in all cases, so additional fibre rollout would always need to be included. Three network
options were evaluated for this business case:
Option 1 – Upgrade Telecommunications capacity like for like before needs arise
Option 2 – Upgrade Telecommunications capacity like for like as constraints are projected to occur
Option 3 – Upgrade Telecommunications capacity with new technologies and like for like upgrades
as constraints are projected to occur
Ergon Energy aims to minimise expenditure in order to keep pressure off customer prices, however
understands that this must be balanced against critical network performance objectives. These
include network risk mitigation (e.g. safety, bushfire), regulatory obligations (e.g. safety), customer
reliability and security and preparing the network for the ongoing adoption of new technology by
customers (e.g. solar PV). In this business case both the need to support the adoption of new
technology by customers and reliability are strong drivers, based on the need to address existing and
forecast network capacity and congestion issues.
To this end, Option 3 is the preferred option, as it has the least negative Net Present Value (NPV)
result of the three options (-$10.9M), while still addressing the identified need for expanding network
capacity.
The direct cost of the program for each submission made to the AER is summarised in the table
below. Note that all figures are expressed in 2018/19 dollars and apply only to costs incurred within
the 2020-25 regulatory period for the preferred option.
Regulatory Proposal Draft Determination Allowance Revised Regulatory Proposal
$13.0M N/A $11.7M

Business Case – Network Capacity and Coverage ii
Contents
Executive Summary ......................................................................................................................... i
1. Introduction .............................................................................................................................. 1
1.1 Purpose of document .................................................................................................... 1
1.2 Scope of document ....................................................................................................... 1
1.3 Identified Need .............................................................................................................. 2
1.4 Energy Queensland Strategic Alignment ....................................................................... 2
1.5 Applicable service levels ............................................................................................... 3
1.6 Compliance obligations ................................................................................................. 3
1.7 Limitation of existing assets .......................................................................................... 4
2 Counterfactual Analysis ............................................................................................................ 8
2.1 Purpose of asset ........................................................................................................... 8
2.2 Business-as-usual service costs ................................................................................... 8
2.3 Key assumptions ........................................................................................................... 8
2.4 Risk assessment ........................................................................................................... 8
2.5 Retirement decision ...................................................................................................... 9
3 Options Analysis ..................................................................................................................... 10
3.1 Options considered but rejected .................................................................................. 10
3.2 Identified options ......................................................................................................... 10
3.3 Economic analysis of identified options ....................................................................... 11
3.3.1 Cost versus benefit assessment of each option ........................................................... 11
3.4 Scenario Analysis........................................................................................................ 12
3.4.1 Sensitivities ................................................................................................................. 12
3.4.2 Value of regret analysis ............................................................................................... 13
3.5 Qualitative comparison of identified options ................................................................ 13
3.5.1 Advantages and disadvantages of each option ............................................................ 13
3.5.2 Alignment with network development plan ................................................................... 14
3.5.3 Alignment with future technology strategy.................................................................... 15
3.5.4 Risk Assessment Following Implementation of Proposed Option ................................. 15
4 Recommendation ................................................................................................................... 17
4.1 Preferred option .......................................................................................................... 17
4.2 Scope of preferred option ............................................................................................ 17
Appendix A. References .......................................................................................................... 18
Appendix B. Acronyms and Abbreviations ................................................................................ 19
Appendix C. Alignment with the National Electricity Rules (NER) ............................................. 21
Appendix D. Mapping of Asset Management Objectives to Corporate Plan .............................. 22

Business Case – Network Capacity and Coverage iii
Appendix E. Risk Tolerability Table .......................................................................................... 23
Appendix F. Reconciliation Table ............................................................................................. 24
Appendix G. Examples of limitation on the Ergon Energy fibre network .................................... 25

Business Case – Network Capacity and Coverage 1
1. Introduction
The existing Ergon Energy telecommunications network (CoreNet) is vital to support operational
requirements. Operational services across the distribution network support critical voice and data
services to co-ordinate safe and efficient work activities, access medical or emergency services, and
monitor and control the power network. CoreNet operates over sites and infrastructure that is directly
owned by Ergon Energy or leased from third parties. Existing arrangements are reviewed periodically
to identify prudent options to take advantage of network changes.
1.1 Purpose of document
This document recommends the optimal capital investment necessary to increase the capacity and
resiliency of the communication network by increasing the communication coverage across the State.
This is a preliminary business case document and has been developed for the purposes of seeking
funding for the required investment in coordination with the Ergon Energy Revised Regulatory
Proposal to the Australian Energy Regulator (AER) for the 2020-25 regulatory control period. Prior to
investment, further detail will be assessed in accordance with the established Energy Queensland
(EQL) investment governance processes. The costs presented are in $2018/19 direct dollars.
1.2 Scope of document
The scope of this proposal consists of three key areas; telco technology introduction, telco
transmission augmentation, and external removal of third-party infrastructure. Assets replaced under
replacement expenditure (Repex) programs were excluded from this program. Details of the scope of
each of these areas are given in Table 1 below.
Table 1: Scope of each area addressed by this proposal
Area Scope
Telco
Technology
Introduction
A range of activities involved with the integration of industry accepted telecommunication
technologies into CoreNet. These include lab testing, trailing, system integration and process
modifications. This is an ongoing program that covers a range of technology introductions
including:
Firmware upgrades to improve security, provide additional functionality and increase
reliability.
Dense Wavelength Division Multiplexing (DWDM) which is a technology that provides
significant network capacity increase with no requirement for additional fibre installation.
5G Integration which provides new opportunities for Ergon Energy to connect new
equipment or increase the services available from existing equipment. This will mitigate
the need to increase the coverage of the telecommunication network.
WIFI at Substations to remotely connect compatible Intelligent Electronic Devices (IED) and
corporate devices such as phones and laptops.
Telco
Transmission
Augmentation
To address assets that are at or near capacity, augmentation measures considered include
new technologies tested under the Telco Technology Introduction stream described above.
If such new technologies are not acceptable then existing technology platforms will be utilised
which will include the new installation of the following;
Overhead or Underground Fibre
Microwave Links
Internet Protocol (IP) Networking Equipment
Business Case – Network Capacity and Coverage 2
Area Scope
The implementation of the existing technology platforms requires significant resources and
materials compared to new technologies such as Dense Wavelength Division Multiplexing
(DWDM) which will increase the capacity of the existing fibre network with no additional
infrastructure requirements.
External
Removal of
Third Party
Infrastructure
The program to maintain the integrity of CoreNet with the purchase of Powerlink sites and
infrastructure is forecast to continue in 2019-20 and 2020-21. A total of 9 Powerlink sites have
been identified for purchase and negotiations with Powerlink have commenced.
It should be noted that there are dependencies between Telco Transmission Augmentation and Telco
Technology Introduction. Successful implementation of Dense Wavelength Division Multiplexing
(DWDM) should reduce the need for additional fibre installation. However, utilising new fibre cable
instead of the DWDM equipment could mitigate potential future diversity issues, and this would need
to be assessed on a case by case basis. As such, there is a balance between these two programs
that will need to be determined during detailed planning of each case.
1.3 Identified Need
Ergon Energy aims to minimise expenditure in order to keep pressure off customer prices, however
understands that this must be balanced against critical network performance objectives. These
include network risk mitigation (e.g. safety, bushfire), regulatory obligations (e.g. safety), customer
reliability and security and preparing the network for the ongoing adoption of new technology by
customers (e.g. solar PV). In this business case both the need to support the adoption of new
technology by customers and reliability are strong drivers, based on the need to address existing and
forecast network capacity and congestion issues.
The program is required to ensure we can meet current and future business requirements that will
support meeting our obligations for legislated compliance, by ensuring ongoing and reliable carriage
of protection and control communications services. There are current constraints on localised
sections of the existing network that require investment to address, which are described in more
detail in Section 1.7. Given the need to provide Telecommunications for mission critical protection
and Supervisory Control and Data Acquisition (SCADA) applications, there are no viable alternative
methods to provision the network.
Similar to power network Augmentation activities, ideally Telecommunications network would provide
capacity ahead of the demand, rather than reacting to the required demand. This needs to be
balanced with cost of providing the capacity to ensure investments are prudent. This program will
support the business to deliver on the future grid roadmap, providing the technology platform to
enable the digital platform. This is essential to enable an intelligent grid.
In addition, the introduction of industry accepted telecommunication related technologies to CoreNet
is an ongoing requirement to support changing business and customer needs. These technologies
are used to provide new functionality required by the organisation and efficiently increase capacity
and utilisation of the existing network.
These are described in the following sections. This proposal aligns with the CAPEX objectives,
criteria and factors from the National Electricity Rules as detailed in Appendix C.
1.4 Energy Queensland Strategic Alignment
Table 2 below details how the proposed works contribute to Energy Queensland’s corporate and
asset management objectives. The linkages between these Asset Management Objectives and
EQL’s Corporate Objectives are shown in Appendix D.

Business Case – Network Capacity and Coverage 3
Table 2: Asset Function and Strategic Alignment
Objectives Relationship of Initiative to Objectives
Ensure network safety for staff contractors and the community
Provides communication services at substations field sites to reduce risk to staff, contractors and the community, which offers the business the opportunity to reach the safety objective goals.
Meet customer and stakeholder expectations
Continued service availability supports network reliability and promotes efficient delivery of a standard quality electrical energy service. Customers have indicated they want prudent investments in technology to modernise the network, to enable them to interact with the network, manage their electricity costs and take advantage of new products and technology developments. A modern communication network is a critical part of the intelligent grid of the future that will enable this for our customers.
Manage risk, performance standards and asset investments to deliver balanced commercial outcomes
This proposal promotes an approach that balances the need for investment to reduce risks and support the delivery of services at a quality expected by the community, against the need to prudently manage costs. An example of this is workforce efficiencies and reduced ICT costs achieved by provision of corporate data services between locations and access to corporate ICT applications and systems in substations and other field locations, aligning with the digitalisation of processes and practices.
Develop Asset Management capability & align practices to the global standard (ISO55000)
Development of a well-planned and integrated communication system in a systematic and timely manner to support the primary electricity network is consistent with the requirements of asset management standards
Modernise the network and facilitate access to innovative energy technologies
Promotes the development and introduction of new technology to provide modern communications capabilities and provide operational efficiencies. In addition, increasing the capacity of communications networks will be key to enabling greater value to be realised from new technologies. An example is the provision of data communications which deliver reliability and power quality improvement as well as enabling Demand Management and Load Control applications and systems.
1.5 Applicable service levels
Corporate performance outcomes for this asset are rolled up into Asset Safety & Performance group
objectives, principally the following Key Result Areas (KRA):
• Customer Index, relating to Customer satisfaction with respect to delivery of expected
services
• Optimise investments to deliver affordable & sustainable asset solutions for our customers
and communities
1.6 Compliance obligations
Table 3 shows the relevant compliance obligations for this proposal.
Table 3: Compliance obligations related to this proposal
Legislation, Regulation, Code or Licence Condition
Obligations Relevance to this investment
QLD Electrical Safety Act 2002
QLD Electrical Safety Regulation 2013
We have a duty of care, ensuring so far as is reasonably practicable, the health and safety of our staff and other parties as follows:
Pursuant to the Electrical Safety Act 2002, as a person in control of a business or undertaking (PCBU), EQL has an obligation to ensure that its works are electrically safe
This program is important to assist Ergon to meet its obligations in relation to staff and public safety. This is achieved through

Business Case – Network Capacity and Coverage 4
Legislation, Regulation, Code or Licence Condition
Obligations Relevance to this investment
and are operated in a way that is electrically safe.1 This duty also extends to ensuring the electrical safety of all persons and property likely to be affected by the electrical work.2
providing communication with substation field sites.
Distribution Authority for Ergon Energy or Energex issued under section 195 of Electricity Act 1994 (Queensland)
Under its Distribution Authority:
The distribution entity must plan and develop its supply network in accordance with good electricity industry practice, having regard to the value that end users of electricity place on the quality and reliability of electricity services.
The distribution entity will ensure, to the extent reasonably practicable, that it achieves its safety net targets as specified.
The distribution entity must use all reasonable endeavours to ensure that it does not exceed in a financial year the Minimum Service Standards (MSS)
This program is in line with good practice in design. It balances the introduction of new technologies against the need for reliable communications systems. This should support Ergon to meet its compliance obligations.
National Electricity Rules, Chapter 5
Schedule S5.1 of the National Electricity Rules, Chapter 5 provides a range of obligations on Network Services Providers relating to Network Performance Requirements. These include:
Section S5.1.9 Protection systems and fault clearance times
Section S5.1a.8 Fault Clearance Times
Section S5.1.2 Credible Contingency Events
This program ensures ongoing and reliable carriage of protection and control communications services.
1.7 Limitation of existing assets
Growth of Telecommunications services utilized in Ergon Energy continues at a rate much larger
than the load growth experienced in the power network. Figure 1 below show the year on year growth
of Ethernet services in the network.
1 Section 29, Electrical Safety Act 2002 2 Section 30 Electrical Safety Act 2002

Business Case – Network Capacity and Coverage 5
Figure 1 – growth of services commissioned on the Ergon Telecommunications network
As the services have grown in number and utilisation, they have consumed capacity on the network
such that capacity and coverage constraints are now being experienced.
Key strategic directions including the various programs associated with the Intelligent Grid Strategy,
likely impact of Internet of Things (IoT) devices and expanded monitoring of the Distribution Network
to improve Asset Management of the power network will cause increasing capacity and congestion
issues during the 20-25 regulatory period.
As the number of services increases the following limitations result: -.
• Congested Fibre Optic Cables where no cores are available for extra services currently or will
be by the end of the regulatory period
• Microwave links and other infrastructure that are congested
• Non – diverse systems architecture. Increasing risk from failure of an ever-increasing number
of services provisioned in non-diverse architectures.
• Need to secure non-Ergon Energy owned communications sites that are critical to the
performance of the network that are proposed to be disposed of by the site owners.
Below is a discussion on each of these limitations.
• Congested Fibre Optic cables
In the Ergon fibre network a number of cables are full (no cores are available) or are on the verge of
being full. This is occurring on the older cables which have lower per cable fibre counts. Core counts
in the network vary from 2 to 96 cores per cable, with 9% of total cables having 6 or less cores and
50% of total cables having between 12 and 36 cores. Data gathered in our recent analysis suggests
that 4.75% by count or 2.9% by length of fibre cables will experience capacity issues within the 2020-
25 regulatory control period, as shown in Table 4. However, it is likely that the true figure will exceed
this amount due to the limitations of current data sources. While the percentage of fibres exceeding
threshold are be small, these are concentrated in specific areas resulting in a greater need for action.
0
500
1000
1500
2000
2500
3000
3500
4000
2004 2006 2008 2010 2012 2014 2016 2018 2020 2022 2024
Tota
l ne
w a
nd
mig
rate
d s
erv
ice
po
st 2
00
4Service Expansion for Core Net
Actual Total
Projected based on Linearexpansion using average of all data
Projected based on linearexpansion using average of last 10years
Projected based on Linearexpansion using average of last 5years

Business Case – Network Capacity and Coverage 6
This proposal is targeted specifically at only these key areas of constraint, which is a relatively small
investment as compared to the overall size of the network. Some examples of the issues currently
being experienced relating to these limitations have been included in Appendix G.
Table 4: Current status of fibres in the Ergon Energy telecommunications network
Fibre Capacity Number of Fibres
% of total Fibre numbers
Length (km)
% of total length of Fibre network
Total Fibres 2947 100% 2,106.1 100%
Fibres Completely Full 38 1.29% 2.6 0.12%
Fibres Exceeding Threshold 102 3.53% 58.5 2.78%
Total Fibres currently exceeding performance thresholds (< 2025)
140 4.75% 61.1 2.90%
• Microwave links and other infrastructure that are congested
Because of the increased demand, the network is experiencing capacity restraints in microwave radio
links, ports on IP networking equipment and in many instances capacity data services running on
fibre cabling. Some examples of the issues currently being experienced relating to these limitations
have been included in Appendix G.
It is vital to the business operations that there is sufficient network capacity to ensure that operational
requirements can be met, and the safety of the network, customers and employee are not put a risk.
• Non – diverse systems architecture
The fibre cable and microwave networks have grown organically based on power network
augmentation works. The resulting network has a range of areas where diversity is not present and
as more services are implemented, and the capacity and importance of existing services increases
risk of failure escalates to a point that will justify the implementation of redundant paths / rings
allowing rerouting of traffic during failures. Ideally only extra fibre cabling and associated equipment
would be implemented however in many cases this will not be cost effecting and microwave links
would be utilised. Appendix G contains existing implementations where fibre cabling could be
installed to improve diversity. These total to 61km of fibre cable.
• External Removal of Third-Party Infrastructure
Powerlink is one of the third-party providers used by Ergon Energy to establish CoreNet. Powerlink
advised in 2016-17 that they were selling their radio sites and infrastructure across the majority of
Queensland. To maintain the integrity of CoreNet in 2018-19 Ergon Energy purchased eight
communication sites. Powerlink will continue to sell their remaining radio sites.
There is an inherent risk of the loss of critical services if Ergon Energy does not purchase these sites.
The cost to rearrange/relocate services from the identified Powerlink sites is significantly greater than
the Powerlink sell price.

Business Case – Network Capacity and Coverage 7
Using technology to overcome issues
Issues associated with congestion can be overcome without the need to implement like for like cable
infrastructure. Use of Dense Wave Division Multiplex (DWDM) can effectively provide the capacity
requirements without the need of extra fibre cable implementation.
While the introduction of this technology will be able to moderate the need for additional infrastructure
investments to overcome congestion, non-redundant architecture can only be resolved by the
implementation of new capacity.
Increasing requirements driving service and capacity increases
The current limitations of these assets will also be exacerbated by the increasing need for network
capacity to support the move towards smart grid capabilities and growing role of internet of things
(IoT) devices. The drivers for this growth and our strategic approach to leverage these technologies
is outlined in Energy Queensland’s Future Grid Roadmap and Intelligent Grid Technology Plan
(2019).
Other business cases that will rely on the increased use of sensors or the capacity of the network
include the following:
• Energy Queensland – LV Network Safety
• Energy Queensland – Intelligent Grid Enablement
• Energex – Power Quality
• Ergon Energy – Power Quality
In addition, CoreNet needs to account for a forecasted dramatic increase in cyber threats and the
likely legislated and business needs to mitigate risks associated with these threats and ensure
adherence to Australian Energy Market Operator (AEMO) standards for protection network
expansion. It is unclear what extra capacity may be necessary, potential requirements include
increasing firewalling, encryption and other data protections pervasively within Corenet.
Business Case – Network Capacity and Coverage 8
2 Counterfactual Analysis
2.1 Purpose of asset
The assets addressed in this program form an essential part of Ergon Energy’s telecommunications
network and are vital to support operational requirements and meet safety and protection obligations
as detailed in the sections above.
2.2 Business-as-usual service costs
The business as usual (BAU) service costs for these assets are the maintenance costs associated
with ongoing operations. In addition to these costs, significant emergency response and replacement
costs would be incurred for the counterfactual BAU case if failures occur. These have not been
explicitly costed in this case due to the significant safety, reliability and compliance risks associated
with asset failures.
2.3 Key assumptions
The assumptions made include:
• There is an expectation that additional capacity constraints will occur and will be included in
the program
• No delay or extended material procurement times greater than 3 months.
• Assets replaced under Repex projects are excluded from the program.
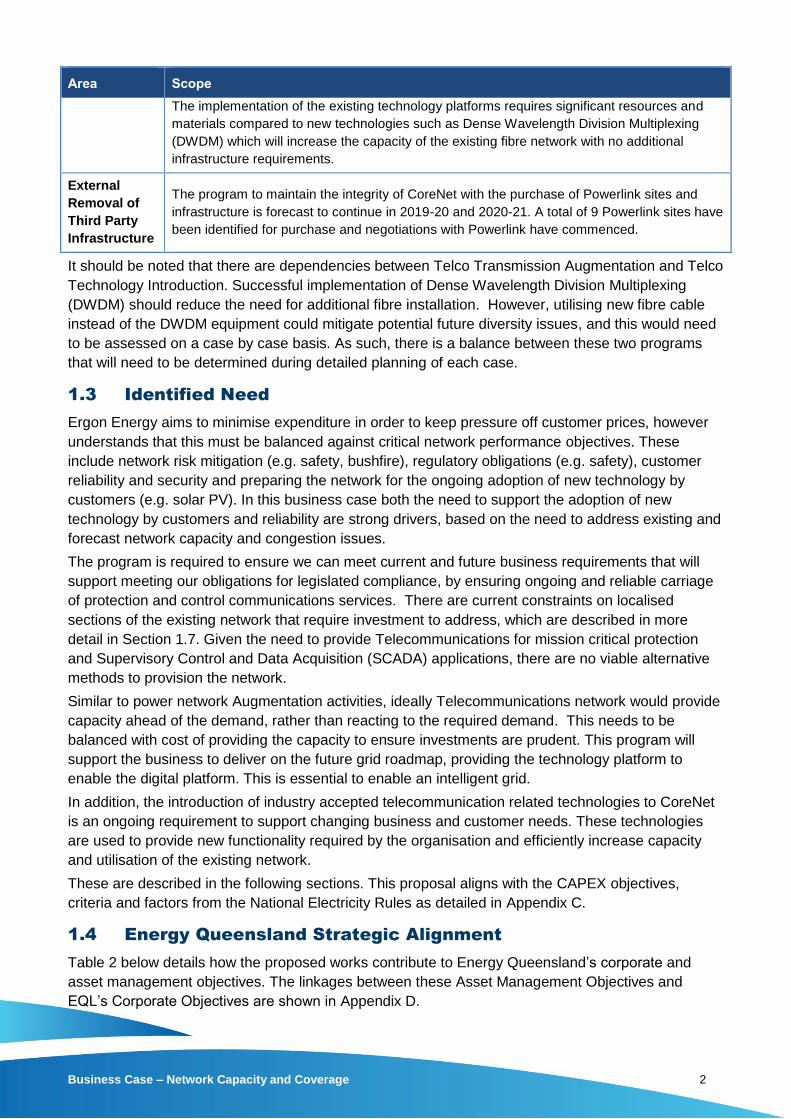
2.4 Risk assessment
This risk assessment is in accordance with the EQL Network Risk Framework and the Risk
Tolerability table from the framework is shown in Appendix E.
Table 5: Counterfactual risk assessment
Risk Scenario Risk Type Consequence
(C) Likelihood
(L) Risk
Score Risk Year
Corporate Voice / Data: Failure of corporate voice, data and internet communication. This leads to inability to access corporate IT systems. Inability to remotely control or manage the network across multiple sites.
Business 4
(Inability to control ≥2 bulk supply
substations supply area)
3
(Unlikely)
12
(Moderate Risk)
2020
Cyber security: Obsolete technology leads to vulnerabilities in corporate voice, data and internet communications. Ergon Energy unable to meet the AEMO standards for protection network expansion. Compliance breach with external standards.
Business 3
(Compliance breach with
external standards)
4
(Likely)
12
(Moderate Risk)
2020
Technology obsolescence: Obsolete technology leads to capabilities below acceptable industry best practice in corporate voice, data and internet communications. Ergon Energy is unable to implement incremental changes to update or extend existing technology. Resulting lost opportunity >$1 million.
Business 4
(Asset impact (including
obsolescence) Lost opportunity
>$1 million)
3
(Unlikely)
12
(Moderate Risk)
2020

Business Case – Network Capacity and Coverage 9
Risk Scenario Risk Type Consequence
(C) Likelihood
(L) Risk
Score Risk Year
Infrastructure Procurement: Radio towers are owned by Powerlink who sell to 3rd party providers. Ergon Energy is unable to purchase currently used radio tower assets at a reasonable cost resulting in the requirement to construct or procure assets elsewhere. Additional costs to the business >$5 Million.
Business 5
(Strategic Direction -
Additional Costs to the business
>$5 million)
3
(Unlikely)
15
(Moderate Risk)
2020
Further Details of the risk ratings and descriptions can be found in Energy Queensland’s Network
Risk Framework.
The network (business) risk the organisation would be exposed to if the project was not undertaken is
not deemed to be as low as reasonably practicable (ALARP). Addressing the risks as detailed above
through implementation of the preferred option will reduce Ergon Energy’s risk exposure.
The relationship of each area of this program to these risks is as follows:
Telco Technology Introduction
The introduction of industry accepted telecommunication related technologies to CoreNet is based on
a needs basis. The forecasts are conservative, and costs are based on completion of previous similar
activities completed since 2009.
Telco Transmission Augmentation
Without additional transmission, augmentation projects specific CoreNet transmission paths will not
have sufficient transmission capacity to meet service growth needs and will find itself in breach of
applicable standards.
External Removal of Third-Party Infrastructure
Without purchase of the identified Powerlink sites, critical CoreNet transmission paths will not be
maintained resulting in loss of critical services and loss of transmission redundancy.
2.5 Retirement decision
Due to the nature of these assets in providing essential communications, they are not considered for
retirement and must be continued. New technologies introduced as part of this program will be used
to mitigate the need for investment in additional infrastructure.

Business Case – Network Capacity and Coverage 10
3 Options Analysis
3.1 Options considered but rejected
The counterfactual case where no action is taken has been rejected due to the unacceptable level of
risk it would introduce.
In addition, the option to completely offset the cost of Telco Transmission Augmentation using
DWDM was considered. However, this option is not considered reasonable as DWDM would not be
able to provide the necessary outcomes in all cases (specifically to overcome non-diverse
architecture), so fibre rollout would always need to be included.
3.2 Identified options
Three main options were identified for this program:
• Option 1: Upgrade Telecommunications capacity like for like before needs arise.
o Implement 124km of cable to overcome congestion and diversity issues
o Acquire communications sites
• Option 2: Upgrade Telecommunications capacity like for like as constraints are
projected to occur (similar to Option 1, but with Telco Transmission Augmentation and
Telco Technology Introduction spread over more years)
o Implement 124km of cable to overcome congestion and diversity issues
o Acquire communications sites
• Option 3: Upgrade Telecommunications capacity with new technologies and like for
like as constraints are projected to occur
o Offset a portion of fibre Augmentation with an expanded and accelerated DWDM rollout.
o Implement 61km of fibre cable to overcome diversity issues
o Acquire communications sites
Further details of how each area of the program would be impacted by these options is described in
Table 6.
Table 6: Options identified for this program
Option 1: Like for
like before need
arises
Option 2: Like for like as
constraints are projected to
occur
Option 3: Accelerated
Technology Introduction and
like for like as constraints are
projected to occur
Telco
Transmission
Augmentation
Transmission
augmentation related
projects would be
completed only as
forecast service needs
are confirmed.
The transmission augmentation
related projects would be
completed only as forecast
service needs are confirmed.
Fibre augmentation for
congestion would be replaced in
this case, with use of DWDM
technology. Implementation of
fibre cable will continue to be
necessary to overcome non-
diverse architecture constraints.

Business Case – Network Capacity and Coverage 11
Option 1: Like for
like before need
arises
Option 2: Like for like as
constraints are projected to
occur
Option 3: Accelerated
Technology Introduction and
like for like as constraints are
projected to occur
Telco
Technology
Introduction
This option brings
forward and expands
the range of
introduced industry
accepted
telecommunication
related technologies to
CoreNet in advance of
business needs.
The introduction of industry
accepted telecommunication
related technologies to CoreNet
would be based on a needs
basis.
The forecast technology
introduction requirements are
conservative, and the costs
used are based on the
completion of previously similar
activities since 2009
This option includes significant
additional investment in DWDM
over the 2020-25 regulatory
control period.
Through this expanded and
accelerated adoption of DWDM,
fibre installation to relieve
congestion related initiatives
could be offset.
External
Removal of
Third Party
Infrastructure
Would involve
purchasing Powerlink
sites that will in the
future assist with the
expansion of CoreNet.
Powerlink sites have been
individually assessed and only
where there is an identified
immediate need to maintain the
integrity of CoreNet would
purchases be considered.
Powerlink sites have been
individually assessed and only
where there is an identified
immediate need to maintain the
integrity of CoreNet would
purchases be considered.
3.3 Economic analysis of identified options
3.3.1 Cost versus benefit assessment of each option
Costs for these options were developed based on previous programs of work. A summary of the total
cost of each of the options over the 2020-25 regulatory control period is shown in Table 7 below.
Mitigation of the high-risk counterfactual approach will result in reactive solutions; this option is more
expensive than any of the options considered.
Table 7: Cost breakdown by program for each of the options considered
Program Option 1 or Option 2
(Total costs 2020-25, $)
Option 3
(Total costs 2020-25, $)
Telco Transmission Augmentation $11,251,061 $6,001,061
Telco Technology Introduction $887,827 $4,887,827
External Removal of Third Party Infrastructure
$890,313 $890,313
TOTAL (All Programs) $13,029,201 $11,698,201
The costs of Option 1 and Option 2 are the same, but these are spread differently across the years
as shown in Table 8 and Table 9. The cost breakdown for each year of Option 3 is shown in Table
10.
Table 8: Costs per year for Option 1: Like for like before need arises
FY 2020/21 FY 2021/22 FY 2022/23 FY 2023/24 FY 2024/25
Telco Transmission Augmentation $5,183,001 $6,068,060 - - -
Telco Technology Introduction $443,710 $444,117 - - -

Business Case – Network Capacity and Coverage 12
FY 2020/21 FY 2021/22 FY 2022/23 FY 2023/24 FY 2024/25
External Removal of Third Party Infrastructure
$890,313 - - - -
TOTAL (All Programs) $6,517,024 $6,512,177 - - -
Table 9: Costs per year for Option 2: Like for like as need arises
FY 2020/21 FY 2021/22 FY 2022/23 FY 2023/24 FY 2024/25
Telco Transmission Augmentation $2,240,145 $1,892,358 $2,100,997 $3,065,333 $1,952,228
Telco Technology Introduction $147,890 $147,890 $295,861 $148,296 $147,890
External Removal of Third Party Infrastructure
$890,313 - - - -
TOTAL (All Programs) $3,278,348 $2,040,248 $2,396,858 $3,213,629 $2,100,118
Table 10: Costs per year for Option 3: Accelerated Technology Introduction and like for like as need
arises
FY 2020/21 FY 2021/22 FY 2022/23 FY 2023/24 FY 2024/25
Telco Transmission Augmentation $1,190,145 $842,358 $1,050,997 $2,015,333 $902,228
Telco Technology Introduction $947,890 $947,890 $1,095,861 $948,296 $947,890
External Removal of Third Party Infrastructure
$890,313 - - - -
TOTAL (All Programs) $2,947,348 $1,790,248 $2,146,858 $2,963,629 $1,850,118
These comparisons reveal that Option 3 provides the lowest cost option from a direct cost
perspective.
Additional Net Present Value (NPV) analysis was undertaken for each option, discounting the annual
CAPEX for each option over a 20-year period from 2019/20 to 2039/40, at the Regulated Real Pre-
Tax Weighted Average Cost of Capital (WACC) rate of 2.62%. The results of NPV analysis are
shown in Table 11. Once again, Option 3 provided the strongest performance, with an NPV of -
$10.9M, as compared to Option 1 and 2 which had more negative NPVs.
Table 11: NPV of options considered
Option NPV
Option 1: Like for like before needs arise -$12,534,533
Option 2: Like for like as constraints are projected to occur -$12,093,135
Option 3: New Technology and like for like upgrades as constraints are
projected to occur -$10,856,747
3.4 Scenario Analysis
3.4.1 Sensitivities
The proposed works are sensitive to the implications of any upcoming changes to requirements and
the successful implementation of the new technologies introduced such as DWDM.
If increased capacity were needed, or an increased percentage of fibres were to exceed their
performance thresholds, this would require the work schedule to be brought-forward as needed.
Business Case – Network Capacity and Coverage 13
Failures of these assets could result in inability to contact emergency help, or the inability to control
areas of the network, resulting in safety and business risks as detailed above.
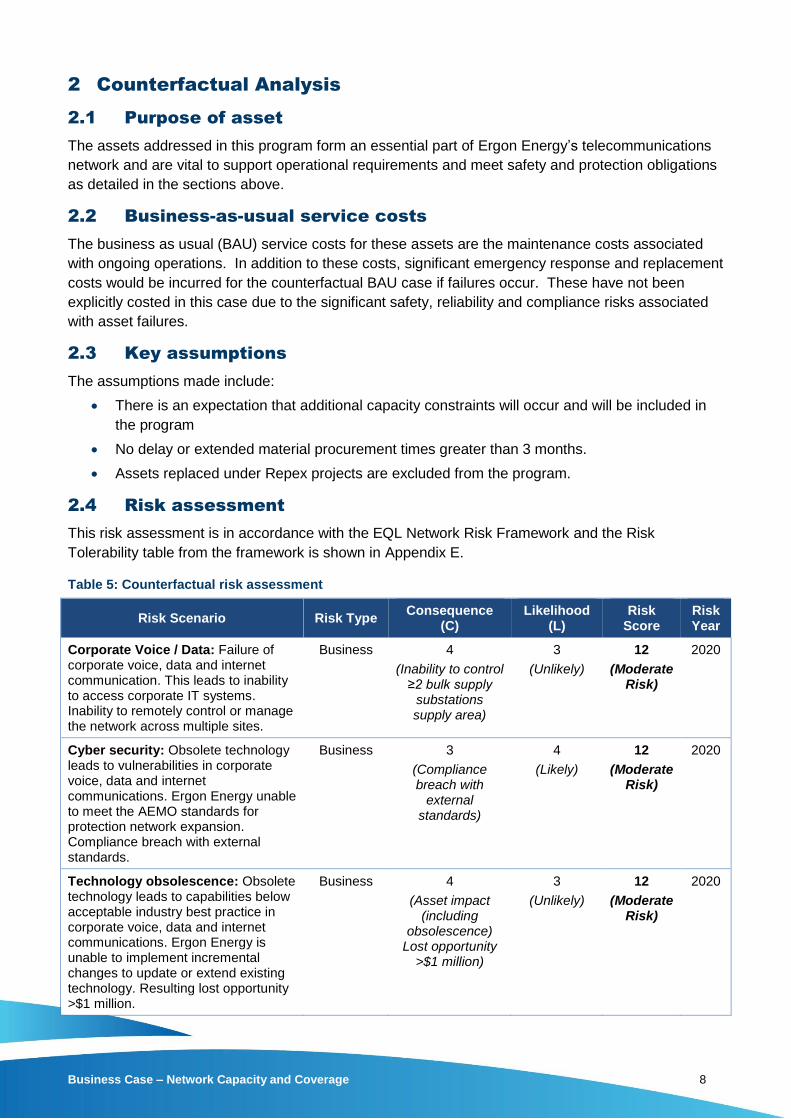
The costs of Option 3 are considered to be more uncertain than the traditional approach outlined in
Options 1 & 2, due to the increased reliance on the introduction of new technologies in this case.
While cost variations were uniform for the NPV analysis in above, a further scenario was considered
with cost variation of +/- 10% for Option 1 & 2 as above, and +/- 20% for Option 3. The results of the
NPV analysis for this scenario are given in Table 12 below. It is evident that Option 3 remains the
preferred option even in the event of greater cost variation.
Table 12: NPV of Options 1-3 with differing levels of variability to cost
Option Average NPV Maximum NPV Minimum NPV
Option 1: Like for like before need arises -$12,553,012 -$11,661,267 -$13,352,886
Option 2: Like for like as constraints are projected
to occur -$12,123,912 -$11,480,124 -$12,637,144
Option 3: Accelerated Technology Introduction
and like for like as constraints are projected to
occur
-$10,852,213 -$10,506,431 -$11,209,319
3.4.2 Value of regret analysis
In terms of selecting a decision pathway of ‘least regret’, Option 3 has a significantly lower cost while
providing relatively similar outcomes to the other two options. The costs saved by selecting Option 3
must be considered in conjunction with the risks introduced by using DWDM rather than investing in
additional fibre that would resolve congestion but could also improve diversity. Given the magnitude
of these cost savings and combined with the fact that only a portion of the fibre rollout is being
reduced in favour of DWDM, this is a balanced approach to dealing with the existing constraints on
the network.
The approach selected is staged and risk-assessed and can be accelerated if required. Given the
options available, Option 3 can be considered the least regret option.
3.5 Qualitative comparison of identified options
3.5.1 Advantages and disadvantages of each option

Business Case – Network Capacity and Coverage 14
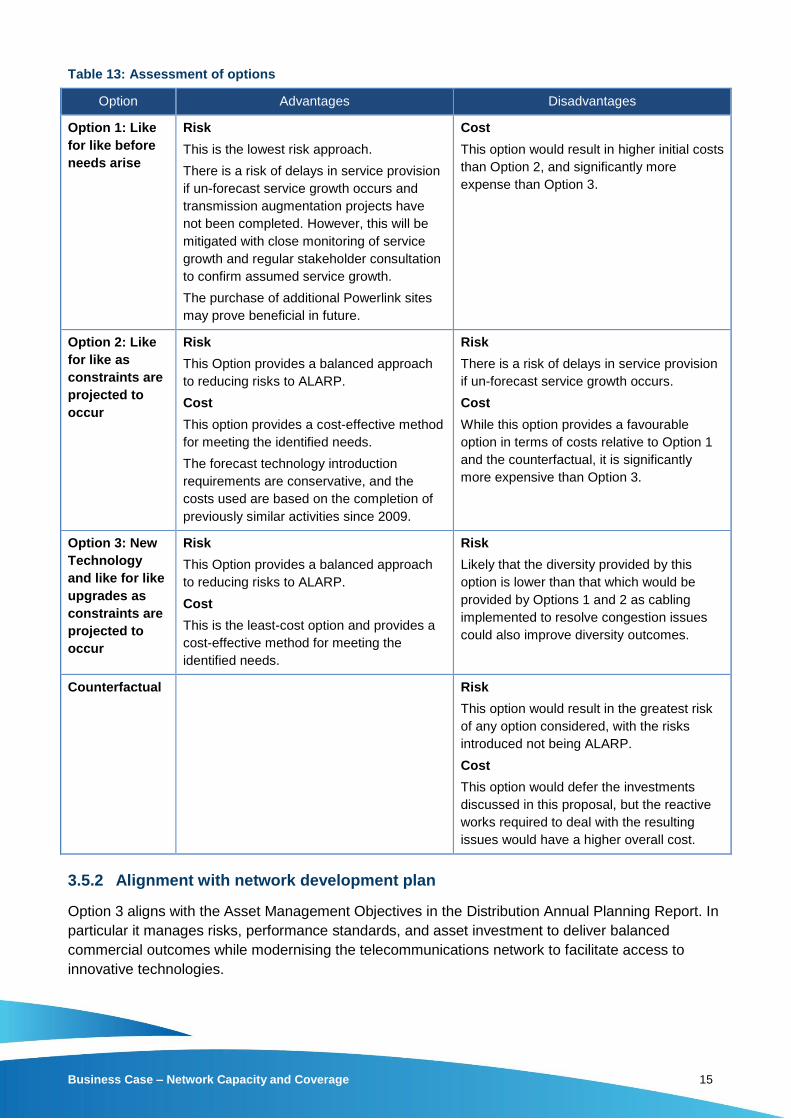
Table 13 below details the advantages and disadvantages of each option considered.
Business Case – Network Capacity and Coverage 15
Table 13: Assessment of options
Option Advantages Disadvantages
Option 1: Like
for like before
needs arise
Risk
This is the lowest risk approach.
There is a risk of delays in service provision
if un-forecast service growth occurs and
transmission augmentation projects have
not been completed. However, this will be
mitigated with close monitoring of service
growth and regular stakeholder consultation
to confirm assumed service growth.
The purchase of additional Powerlink sites
may prove beneficial in future.
Cost
This option would result in higher initial costs
than Option 2, and significantly more
expense than Option 3.
Option 2: Like
for like as
constraints are
projected to
occur
Risk
This Option provides a balanced approach
to reducing risks to ALARP.
Cost
This option provides a cost-effective method
for meeting the identified needs.
The forecast technology introduction
requirements are conservative, and the
costs used are based on the completion of
previously similar activities since 2009.
Risk
There is a risk of delays in service provision
if un-forecast service growth occurs.
Cost
While this option provides a favourable
option in terms of costs relative to Option 1
and the counterfactual, it is significantly
more expensive than Option 3.
Option 3: New
Technology
and like for like
upgrades as
constraints are
projected to
occur
Risk
This Option provides a balanced approach
to reducing risks to ALARP.
Cost
This is the least-cost option and provides a
cost-effective method for meeting the
identified needs.
Risk
Likely that the diversity provided by this
option is lower than that which would be
provided by Options 1 and 2 as cabling
implemented to resolve congestion issues
could also improve diversity outcomes.
Counterfactual Risk
This option would result in the greatest risk
of any option considered, with the risks
introduced not being ALARP.
Cost
This option would defer the investments
discussed in this proposal, but the reactive
works required to deal with the resulting
issues would have a higher overall cost.
3.5.2 Alignment with network development plan
Option 3 aligns with the Asset Management Objectives in the Distribution Annual Planning Report. In
particular it manages risks, performance standards, and asset investment to deliver balanced
commercial outcomes while modernising the telecommunications network to facilitate access to
innovative technologies.

Business Case – Network Capacity and Coverage 16
3.5.3 Alignment with future technology strategy
This program of work supports Energy Queensland’s transition to modern communications network
technologies. This is in alignment with the Future Grid Roadmap and Intelligent Grid Technology
Plan, which promote the use of modern technology in maintaining affordability of the distribution
network while also maintaining safety, security and reliability of the energy system, and supporting
optimal customer outcomes and value across short, medium and long-term horizons.
Additionally, customers have indicated they want prudent investments in technology to modernise the
network, to enable them to interact with the network, manage their electricity costs and take
advantage of new products and technology developments. A modern communication network is a
critical part of the intelligent grid of the future that will enable this for customers.
3.5.4 Risk Assessment Following Implementation of Proposed Option
While Option 1 and 2 would reduce the risks detailed in Section 2.4, however these options provide
poor cost efficiency. Option 3 would reduce the risk to ALARP as described in

Business Case – Network Capacity and Coverage 17
Table 14.

Business Case – Network Capacity and Coverage 18
Table 14: Risk assessment showing risks mitigated following Implementation
Risk Scenario Risk Type Consequence (C) Likelihood
(L) Risk Score
Risk Year
Corporate Voice / Data: Failure of corporate voice, data and internet communication. This leads to inability to access corporate ICT systems. Inability to remotely control or manage the network across multiple sites.
Business (Original)
4
(Inability to control ≥2 bulk supply
substations supply area)
3
(Unlikely)
12
(Moderate Risk)
2020
(Mitigated)
4
(Inability to control ≥2 bulk supply
substations supply area)
1
(Almost no likelihood)
4
(Very Low Risk)
Cyber security: Obsolete technology leads to vulnerabilities in corporate voice, data and internet communications. Ergon Energy unable to meet the AEMO standards for protection network expansion. Compliance breach with external standards.
Business (Original)
3
(Compliance breach with external standards)
4
(Likely)
12
(Moderate Risk)
2020
(Mitigated)
3
(Compliance breach with external standards)
2
(Very Unlikely)
6
(Low Risk)
Technology obsolescence: Obsolete technology leads to capabilities below acceptable industry best practice in corporate voice, data and internet communications. Ergon Energy is unable to implement incremental changes to update or extend existing technology. Resulting lost opportunity >$1 million.
Business (Original)
4
(Asset impact (including
obsolescence) Lost opportunity >$1
million)
3
(Unlikely)
12
(Moderate Risk)
2020
(Mitigated)
4
(Asset impact (including
obsolescence) Lost opportunity >$1
million)
1
(Almost no likelihood)
4
(Very Low Risk)
Infrastructure Procurement: Radio towers are owned by Powerlink who sell to 3rd party providers. Ergon Energy is unable to purchase currently used radio tower assets at a reasonable cost resulting in the requirement to construct or procure assets elsewhere. Additional costs to the business >$5 Million.
Business (Original)
5
(Strategic Direction - Additional Costs to the business >$5
million)
3
(Unlikely)
15
(Moderate Risk)
2020
(Mitigated)
5
(Strategic Direction - Additional Costs to the business >$5
million)
1
(Almost no likelihood)
5
(Very Low Risk)

Business Case – Network Capacity and Coverage 19
4 Recommendation
4.1 Preferred option
The preferred option is Option 3, as this provides a balanced approach between risk reduction and
cost efficiency. The work will be prioritised and organised into bundles to reduce overall program
costs. The risk exposure is greater than Option 1 as the program will be completed over a longer time
frame however, this is a prudent approach to the delivery of the program.
4.2 Scope of preferred option
The delivery timeframes for each area of the recommended option are as follows:
• Telco Technology Introduction: Ongoing program - Projects commenced in 2018-19 and
will continue across the 2020-25 regulatory control period and beyond.
• Telco Transmission Augmentation: Ongoing program - Projects commenced in 2018-19
and will continue across the 2020-25 regulatory control period and beyond.
• External Removal of Third Party Infrastructure: The present Powerlink third party driver
will see purchase of additional sites from 2018-19 through to 2020-21. At present, there are
no further known changes to existing third-party arrangements that require augmentation
funding.
The forecast CAPEX profile of the preferred Option 3 in this program is as shown in Table 15. The
total CAPEX associated with the next regulatory period 2020-2025 is $11,698,201 (real $2018/19)
Table 15: Costs per year for Option 3: Accelerated Technology Introduction
FY 2020/21 FY 2021/22 FY 2022/23 FY 2023/24 FY 2024/25 Total
Telco Transmission Augmentation
$1,190,145 $842,358 $1,050,997 $2,015,333 $902,228 $6,001,061
Telco Technology Introduction
$947,890 $947,890 $1,095,861 $948,296 $947,890 $4,887,827
External Removal of Third Party Infrastructure
$890,313 - - - - $890,313
TOTAL (All Programs)
$2,947,348 $1,790,248 $2,146,858 $2,963,629 $1,850,118 $11,698,201

Business Case – Network Capacity and Coverage 20
Appendix A. References
Note: Documents which were included in Energy Queensland’s original regulatory submission to the
AER in January 2019 have their submission reference number shown in square brackets, e.g.
Energy Queensland, Corporate Strategy [1.001], (31 January 2019).
Energy Queensland, Asset Management Overview, Risk and Optimisation Strategy [7.025], (31
January 2019).
Energy Queensland, Corporate Strategy [1.001], (31 January 2019).
Energy Queensland, Future Grid Roadmap [7.054], (31 January 2019).
Energy Queensland, Intelligent Grid Technology Plan [7.056], (31 January 2019).
Energy Queensland, Network Risk Framework, (October 2018).
Ergon Energy, Distribution Annual Planning Report (2018-19 to 2022-23) [7.049], (21 December
2018).

Business Case – Network Capacity and Coverage 21
Appendix B. Acronyms and Abbreviations
The following abbreviations and acronyms appear in this business case.
Abbreviation or acronym Definition
$M Millions of dollars
$ nominal These are nominal dollars of the day
$ real 2019-20 These are dollar terms as at 30 June 2020
2020-25 regulatory control
period
The regulatory control period commencing 1 July 2020 and ending 30 Jun
2025
AEMC Australian Energy Market Commission
AEMO Australian Energy Market Operator
AER Australian Energy Regulator
ALARP As Low as Reasonably Practicable
AMP Asset Management Plan
BAU Business as Usual
CAPEX Capital expenditure
Current regulatory control
period or current period
Regulatory control period 1 July 2015 to 30 June 2020
DAPR Distribution Annual Planning Report
DC Direct Current
DWDM Dense Wavelength Division Multiplexing
EQL Energy Queensland Ltd
ICT Information and Communications Technology
IED Intelligent Electronic Devices
IoT Internet of Things
IP Internet Protocol
IT Information Technology
KRA Key Result Areas
MSS Minimum Service Standard
NEL National Electricity Law
NEM National Electricity Market
NEO National Electricity Objective
NER National Electricity Rules (or Rules)
Next regulatory control period
or forecast period
The regulatory control period commencing 1 July 2020 and ending 30 Jun
2025
NPV Net Present Value

Business Case – Network Capacity and Coverage 22
Abbreviation or acronym Definition
PCBU Person in Control of a Business or Undertaking
Previous regulatory control
period or previous period
Regulatory control period 1 July 2010 to 30 June 2015
PV Present Value
Repex Replacement Expenditure
RIN Regulatory Information Notice
RTS Return to Service
SAIDI System Average Interruption Duration Index
SAIFI System Average Interruption Frequency Index
SAMP Strategic Asset Management Plan
SCADA Supervisory Control and Data Acquisition
WACC Weighted average cost of capital
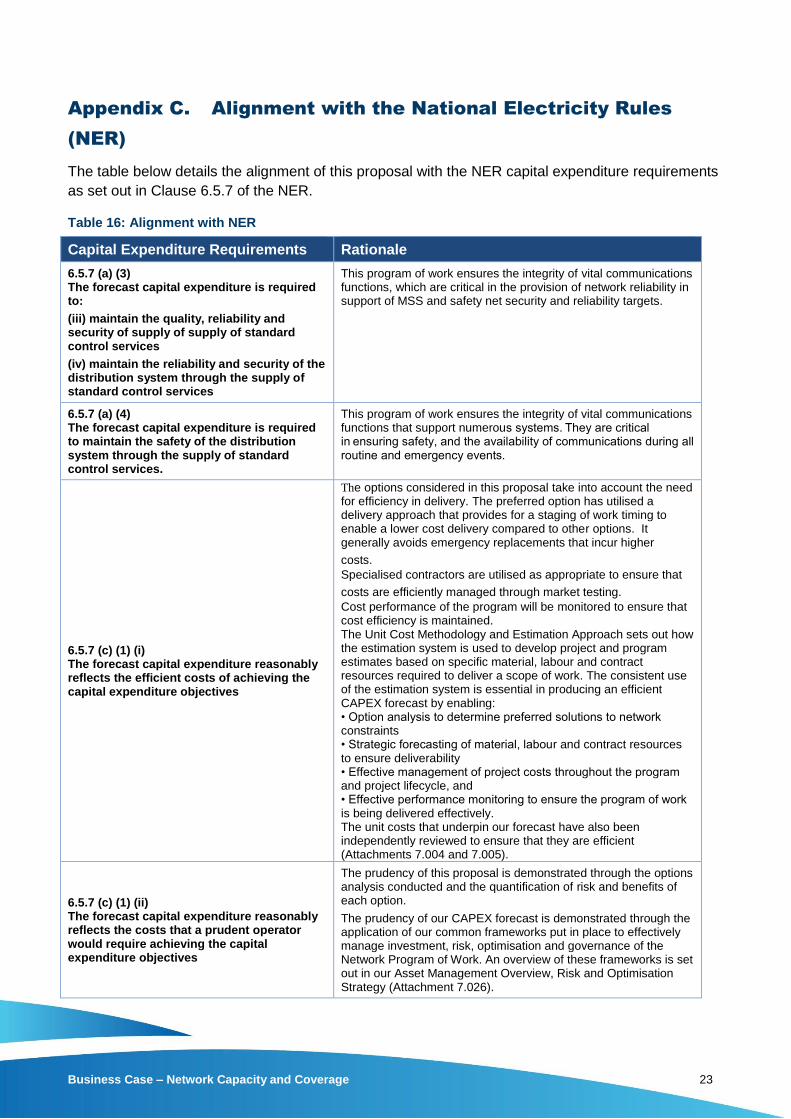
Business Case – Network Capacity and Coverage 23
Appendix C. Alignment with the National Electricity Rules
(NER)
The table below details the alignment of this proposal with the NER capital expenditure requirements
as set out in Clause 6.5.7 of the NER.
Table 16: Alignment with NER
Capital Expenditure Requirements Rationale
6.5.7 (a) (3) The forecast capital expenditure is required to:
(iii) maintain the quality, reliability and security of supply of supply of standard control services
(iv) maintain the reliability and security of the distribution system through the supply of standard control services
This program of work ensures the integrity of vital communications functions, which are critical in the provision of network reliability in support of MSS and safety net security and reliability targets.
6.5.7 (a) (4) The forecast capital expenditure is required to maintain the safety of the distribution system through the supply of standard control services.
This program of work ensures the integrity of vital communications functions that support numerous systems. They are critical in ensuring safety, and the availability of communications during all routine and emergency events.
6.5.7 (c) (1) (i) The forecast capital expenditure reasonably reflects the efficient costs of achieving the capital expenditure objectives
The options considered in this proposal take into account the need for efficiency in delivery. The preferred option has utilised a delivery approach that provides for a staging of work timing to enable a lower cost delivery compared to other options. It generally avoids emergency replacements that incur higher
costs. Specialised contractors are utilised as appropriate to ensure that
costs are efficiently managed through market testing. Cost performance of the program will be monitored to ensure that cost efficiency is maintained. The Unit Cost Methodology and Estimation Approach sets out how the estimation system is used to develop project and program estimates based on specific material, labour and contract resources required to deliver a scope of work. The consistent use of the estimation system is essential in producing an efficient CAPEX forecast by enabling: • Option analysis to determine preferred solutions to network constraints • Strategic forecasting of material, labour and contract resources to ensure deliverability • Effective management of project costs throughout the program and project lifecycle, and • Effective performance monitoring to ensure the program of work is being delivered effectively. The unit costs that underpin our forecast have also been independently reviewed to ensure that they are efficient (Attachments 7.004 and 7.005).
6.5.7 (c) (1) (ii) The forecast capital expenditure reasonably reflects the costs that a prudent operator would require achieving the capital expenditure objectives
The prudency of this proposal is demonstrated through the options analysis conducted and the quantification of risk and benefits of each option.
The prudency of our CAPEX forecast is demonstrated through the application of our common frameworks put in place to effectively manage investment, risk, optimisation and governance of the Network Program of Work. An overview of these frameworks is set out in our Asset Management Overview, Risk and Optimisation Strategy (Attachment 7.026).

Business Case – Network Capacity and Coverage 24
Appendix D. Mapping of Asset Management Objectives to
Corporate Plan
This proposal has been developed in accordance with our Strategic Asset Management Plan. Our
Strategic Asset Management Plan (SAMP) sets out how we apply the principles of Asset
Management stated in our Asset Management Policy to achieve our Strategic Objectives.
Table 2: “Asset Function and Strategic Alignment” in Section 1.4 details how this proposal contributes
to the Asset Management Objectives.
The Table below provides the linkage of the Asset Management Objectives to the Strategic
Objectives as set out in our Corporate Plan (Supporting document 1.001 to our Regulatory Proposal
as submitted in January 2019).
Table 17: Alignment of Corporate and Asset Management objectives
Asset Management Objectives Mapping to Corporate Plan Strategic Objectives
Ensure network safety for staff contractors and the community
EFFICIENCY
Operate safely as an efficient and effective organisation
Continue to build a strong safety culture across the business and empower and develop our people while delivering safe, reliable and efficient operations.
Meet customer and stakeholder expectations
COMMUNITY AND CUSTOMERS
Be Community and customer focused
Maintain and deepen our communities’ trust by delivering on our promises, keeping the lights on and delivering an exceptional customer experience every time
Manage risk, performance standards and
asset investments to deliver balanced
commercial outcomes
GROWTH
Strengthen and grow from our core
Leverage our portfolio business, strive for continuous improvement and work together to shape energy use and improve the utilisation of our assets.
Develop Asset Management capability & align practices to the global standard (ISO55000)
EFFICIENCY
Operate safely as an efficient and effective organisation
Continue to build a strong safety culture across the business and empower and develop our people while delivering safe, reliable and efficient operations.
Modernise the network and facilitate access to innovative energy technologies
INNOVATION
Create value through innovation
Be bold and creative, willing to try new ways of working and deliver new
energy services that fulfil the unique needs of our communities and
customers.
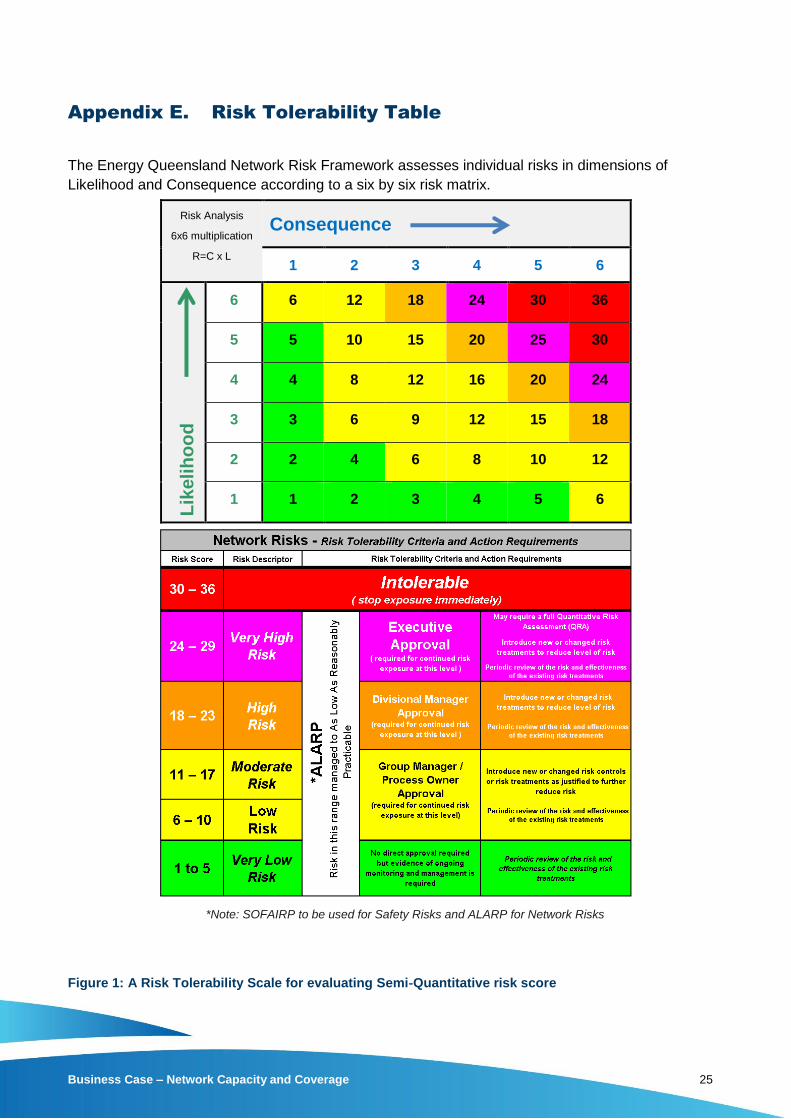
Business Case – Network Capacity and Coverage 25
Appendix E. Risk Tolerability Table
The Energy Queensland Network Risk Framework assesses individual risks in dimensions of
Likelihood and Consequence according to a six by six risk matrix.
Risk Analysis
6x6 multiplication
R=C x L
Consequence
1 2 3 4 5 6
Lik
eli
ho
od
6 6 12 18 24 30 36
5 5 10 15 20 25 30
4 4 8 12 16 20 24
3 3 6 9 12 15 18
2 2 4 6 8 10 12
1 1 2 3 4 5 6
*Note: SOFAIRP to be used for Safety Risks and ALARP for Network Risks
Figure 1: A Risk Tolerability Scale for evaluating Semi‐Quantitative risk score

Business Case – Network Capacity and Coverage 26
Appendix F. Reconciliation Table
$11.70
$12.13(M$2020)
Reconciliation Table
Conversion from $18/19 to $2020
Business Case Value
(M$18/19)
Business Case Value

Business Case – Network Capacity and Coverage 27
Appendix G. Examples of limitation on the Ergon Energy fibre
network
Congestion
Maryborough Town Fibre - High Priority
Maryborough town fibre loops between all sites are full and require urgent attention. There is no
additional capacity to provision additional services or to re-route services via an alternative path if a
fibre break occurs.
Below is an example of fully utilised 24 core fibre cable (Cable #5001:24c – highlighted red) between
MARYCS (T59 Maryborough Substation) and MASRCS (Maryborough Searle St Depot). Figure 2
shows the cable location.
Figure 2: Cable #5001:24c - highlighted red, a fully utilised fibre cable in the Maryborough Town area
Table 18: Core utilisation for Cable #5001:24c
Core No Circuit ID Description
1 F5015 SDH Mux Rx T059 from SESD
2 F5016 SDH Mux Tx T059 to SESD
3 F5315 STM-16 Intra City Link B/Up Tx ADST-MASR
4 F5316 STM-16 Intra City Link B/Up Rx ADST-MASR

Business Case – Network Capacity and Coverage 28
Core No Circuit ID Description
5 5001-05 SESD - T059 #05
6 5001-06 SESD - T059 #06
7 F5401 Widelinx MAWX - GHWX Circuit #1
8 F5402 Widelinx MAWX - GHWX Circuit #2
9 F5403 Widelinx MAWX - GHWX Circuit #3
10 F5404 Widelinx MAWX - GHWX Circuit #4
11 F5405 Widelinx MAWX - GHWX Circuit #5
12 F5406 Widelinx MAWX - GHWX Circuit #6
13 F5407 Widelinx MAWX - GHWX Circuit #7
14 F5408 Widelinx MAWX - GHWX Circuit #8
15 F5301 Sparq WAN Tx SESD to ADST via T059
16 F5302 Sparq WAN Rx SESD from ADST via T059
17 F5409 Widelinx MAWX - GHWX Circuit #9
18 F5410 Widelinx MAWX - GHWX Circuit #10
19 F5305 Corenet Tx ADST to TEMB Backup Path
19 F5494 MASR-SURI CORENET TX
20 F5306 Corenet Rx ADST from TEMB Backup Path
20 F5495 MASR-SURI CORENET RX
21 F5411 Widelinx MAWX - GHWX Circuit #11
22 F5412 Widelinx MAWX - GHWX Circuit #12
23 F5317 Corenet NEXTGEN to ADSTCS (BUDECS)
24 F5318 Corenet NEXTGEN to ADSTCS (BUDECS)
Maryborough / Hervey Bay
Only 12 cores are available for half the Hervey Bay loop and the fibres in this area are mostly full.
The remaining 12 cores are dark fibres for WideLinx. Overall there is limited capacity and diversity in
Hervey Bay, in particular between Hervey Bay and Maryborough.
Diversity
FN
• Cairns Hartley Street – to – Turkinje - 40km o Currently a single PLQ fibre from Cairns Terminal (132kV) to Turkinje (132kV) o Turkinje provides services to 20 communications sites
▪ 5 - P25 base stations ▪ 8 – Substations ▪ 4 – Depots
o Cost Estimate - $3,345,945
• McLeod Street Depot Pit Entry <1km
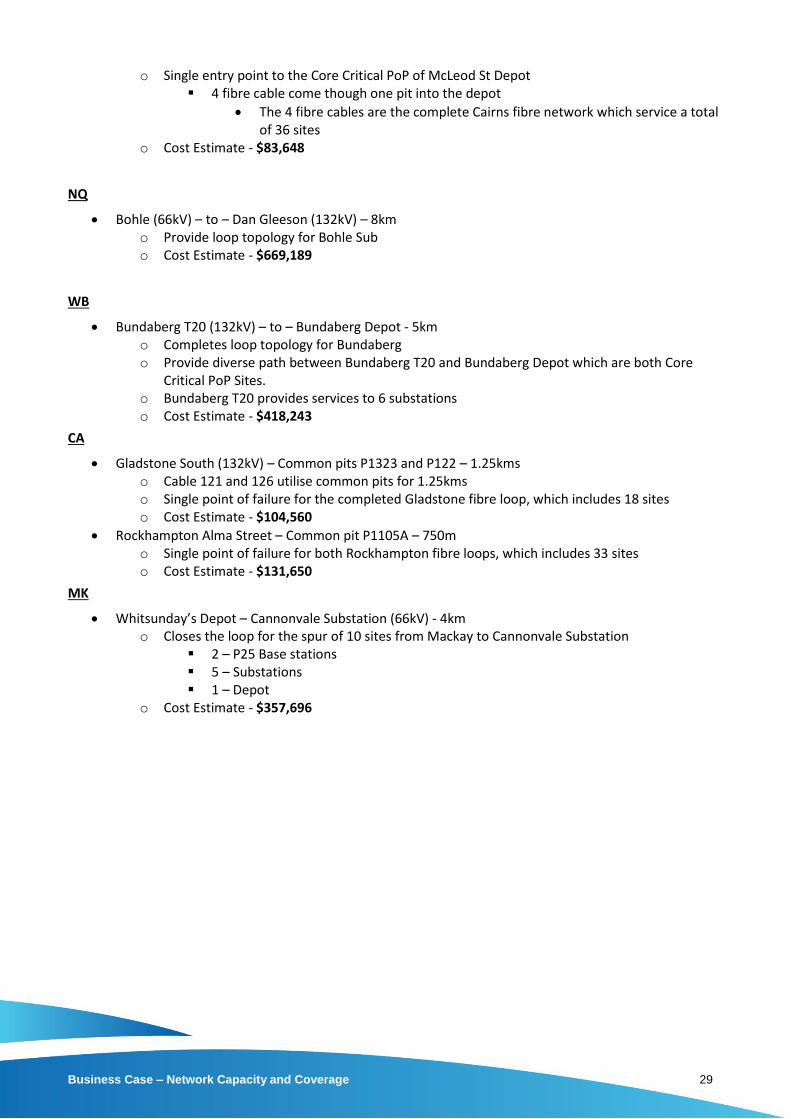
Business Case – Network Capacity and Coverage 29
o Single entry point to the Core Critical PoP of McLeod St Depot ▪ 4 fibre cable come though one pit into the depot
• The 4 fibre cables are the complete Cairns fibre network which service a total of 36 sites
o Cost Estimate - $83,648
NQ
• Bohle (66kV) – to – Dan Gleeson (132kV) – 8km o Provide loop topology for Bohle Sub o Cost Estimate - $669,189
WB
• Bundaberg T20 (132kV) – to – Bundaberg Depot - 5km o Completes loop topology for Bundaberg o Provide diverse path between Bundaberg T20 and Bundaberg Depot which are both Core
Critical PoP Sites. o Bundaberg T20 provides services to 6 substations o Cost Estimate - $418,243
CA
• Gladstone South (132kV) – Common pits P1323 and P122 – 1.25kms o Cable 121 and 126 utilise common pits for 1.25kms o Single point of failure for the completed Gladstone fibre loop, which includes 18 sites o Cost Estimate - $104,560
• Rockhampton Alma Street – Common pit P1105A – 750m o Single point of failure for both Rockhampton fibre loops, which includes 33 sites o Cost Estimate - $131,650
MK
• Whitsunday’s Depot – Cannonvale Substation (66kV) - 4km o Closes the loop for the spur of 10 sites from Mackay to Cannonvale Substation
▪ 2 – P25 Base stations ▪ 5 – Substations ▪ 1 – Depot
o Cost Estimate - $357,696