Embed Size (px)
Citation preview

WHITE PAPER
Copyright © 2011, Juniper Networks, Inc. 1
CovERAgE oR CAPACITy—MAkINg THE BEsT UsE of 802.11N Meeting the Need for High Performance and Ubiquitous Coverage with the Proliferation of Mobile Devices in the Enterprise
2 Copyright © 2011, Juniper Networks, Inc.
WHITE PAPER - Coverage or Capacity—Making the Best Use of 802.11n
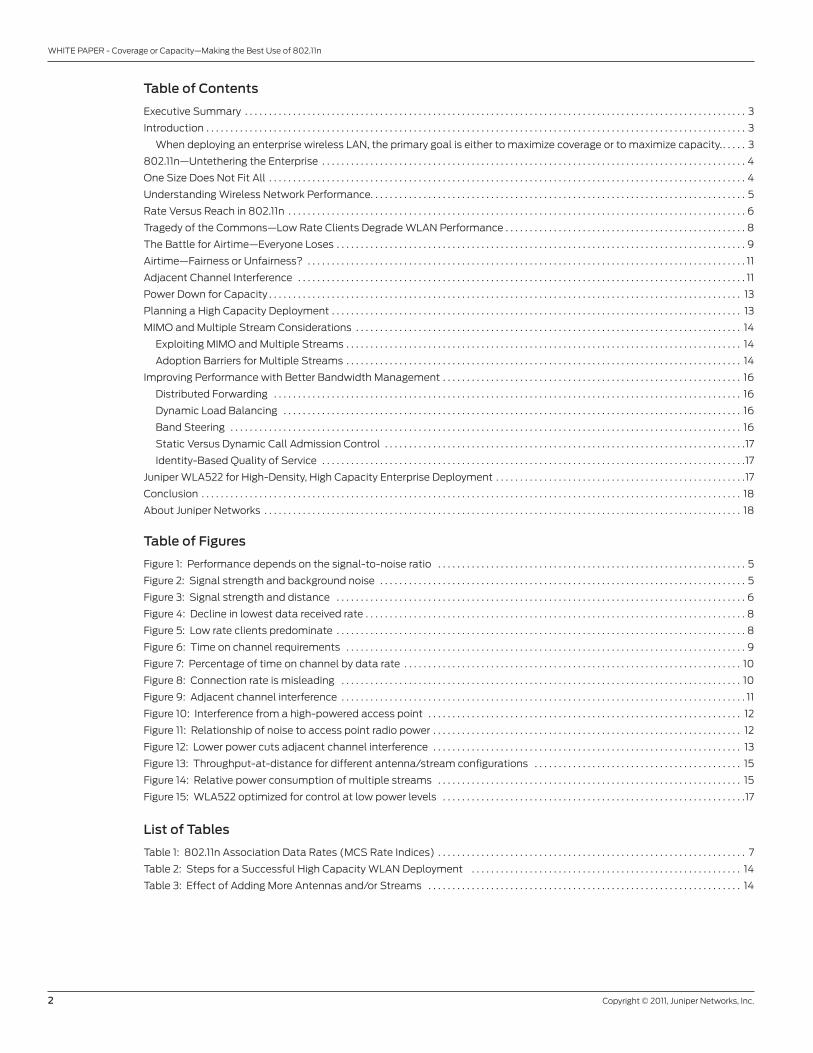
Table of Contents
Executive summary . . . . . . . . . . . . . . . . . . . . . . . . . . . . . . . . . . . . . . . . . . . . . . . . . . . . . . . . . . . . . . . . . . . . . . . . . . . . . . . . . . . . . . . . . . . . . . . . . . . . . . . . 3
Introduction . . . . . . . . . . . . . . . . . . . . . . . . . . . . . . . . . . . . . . . . . . . . . . . . . . . . . . . . . . . . . . . . . . . . . . . . . . . . . . . . . . . . . . . . . . . . . . . . . . . . . . . . . . . . . . . . 3
When deploying an enterprise wireless LAN, the primary goal is either to maximize coverage or to maximize capacity. . . . . . 3
802.11n—Untethering the Enterprise . . . . . . . . . . . . . . . . . . . . . . . . . . . . . . . . . . . . . . . . . . . . . . . . . . . . . . . . . . . . . . . . . . . . . . . . . . . . . . . . . . . . . . . . 4
one size Does Not fit All . . . . . . . . . . . . . . . . . . . . . . . . . . . . . . . . . . . . . . . . . . . . . . . . . . . . . . . . . . . . . . . . . . . . . . . . . . . . . . . . . . . . . . . . . . . . . . . . . . . 4
Understanding Wireless Network Performance. . . . . . . . . . . . . . . . . . . . . . . . . . . . . . . . . . . . . . . . . . . . . . . . . . . . . . . . . . . . . . . . . . . . . . . . . . . . . . 5
Rate versus Reach in 802.11n . . . . . . . . . . . . . . . . . . . . . . . . . . . . . . . . . . . . . . . . . . . . . . . . . . . . . . . . . . . . . . . . . . . . . . . . . . . . . . . . . . . . . . . . . . . . . . . 6
Tragedy of the Commons—Low Rate Clients Degrade WLAN Performance . . . . . . . . . . . . . . . . . . . . . . . . . . . . . . . . . . . . . . . . . . . . . . . . . . 8
The Battle for Airtime—Everyone Loses . . . . . . . . . . . . . . . . . . . . . . . . . . . . . . . . . . . . . . . . . . . . . . . . . . . . . . . . . . . . . . . . . . . . . . . . . . . . . . . . . . . . . 9
Airtime—fairness or Unfairness? . . . . . . . . . . . . . . . . . . . . . . . . . . . . . . . . . . . . . . . . . . . . . . . . . . . . . . . . . . . . . . . . . . . . . . . . . . . . . . . . . . . . . . . . . . . 11
Adjacent Channel Interference . . . . . . . . . . . . . . . . . . . . . . . . . . . . . . . . . . . . . . . . . . . . . . . . . . . . . . . . . . . . . . . . . . . . . . . . . . . . . . . . . . . . . . . . . . . . . 11
Power Down for Capacity . . . . . . . . . . . . . . . . . . . . . . . . . . . . . . . . . . . . . . . . . . . . . . . . . . . . . . . . . . . . . . . . . . . . . . . . . . . . . . . . . . . . . . . . . . . . . . . . . . 13
Planning a High Capacity Deployment . . . . . . . . . . . . . . . . . . . . . . . . . . . . . . . . . . . . . . . . . . . . . . . . . . . . . . . . . . . . . . . . . . . . . . . . . . . . . . . . . . . . . 13
MIMo and Multiple stream Considerations . . . . . . . . . . . . . . . . . . . . . . . . . . . . . . . . . . . . . . . . . . . . . . . . . . . . . . . . . . . . . . . . . . . . . . . . . . . . . . . . 14
Exploiting MIMo and Multiple streams . . . . . . . . . . . . . . . . . . . . . . . . . . . . . . . . . . . . . . . . . . . . . . . . . . . . . . . . . . . . . . . . . . . . . . . . . . . . . . . . . . 14
Adoption Barriers for Multiple streams . . . . . . . . . . . . . . . . . . . . . . . . . . . . . . . . . . . . . . . . . . . . . . . . . . . . . . . . . . . . . . . . . . . . . . . . . . . . . . . . . . 14
Improving Performance with Better Bandwidth Management . . . . . . . . . . . . . . . . . . . . . . . . . . . . . . . . . . . . . . . . . . . . . . . . . . . . . . . . . . . . . . 16
Distributed forwarding . . . . . . . . . . . . . . . . . . . . . . . . . . . . . . . . . . . . . . . . . . . . . . . . . . . . . . . . . . . . . . . . . . . . . . . . . . . . . . . . . . . . . . . . . . . . . . . . . 16
Dynamic Load Balancing . . . . . . . . . . . . . . . . . . . . . . . . . . . . . . . . . . . . . . . . . . . . . . . . . . . . . . . . . . . . . . . . . . . . . . . . . . . . . . . . . . . . . . . . . . . . . . . 16
Band steering . . . . . . . . . . . . . . . . . . . . . . . . . . . . . . . . . . . . . . . . . . . . . . . . . . . . . . . . . . . . . . . . . . . . . . . . . . . . . . . . . . . . . . . . . . . . . . . . . . . . . . . . . . 16
static versus Dynamic Call Admission Control . . . . . . . . . . . . . . . . . . . . . . . . . . . . . . . . . . . . . . . . . . . . . . . . . . . . . . . . . . . . . . . . . . . . . . . . . . .17
Identity-Based Quality of service . . . . . . . . . . . . . . . . . . . . . . . . . . . . . . . . . . . . . . . . . . . . . . . . . . . . . . . . . . . . . . . . . . . . . . . . . . . . . . . . . . . . . . . .17
Juniper WLA522 for High-Density, High Capacity Enterprise Deployment . . . . . . . . . . . . . . . . . . . . . . . . . . . . . . . . . . . . . . . . . . . . . . . . . . . .17
Conclusion . . . . . . . . . . . . . . . . . . . . . . . . . . . . . . . . . . . . . . . . . . . . . . . . . . . . . . . . . . . . . . . . . . . . . . . . . . . . . . . . . . . . . . . . . . . . . . . . . . . . . . . . . . . . . . . . 18
About Juniper Networks . . . . . . . . . . . . . . . . . . . . . . . . . . . . . . . . . . . . . . . . . . . . . . . . . . . . . . . . . . . . . . . . . . . . . . . . . . . . . . . . . . . . . . . . . . . . . . . . . . . 18
Table of Figures
figure 1: Performance depends on the signal-to-noise ratio . . . . . . . . . . . . . . . . . . . . . . . . . . . . . . . . . . . . . . . . . . . . . . . . . . . . . . . . . . . . . . . . 5
figure 2: signal strength and background noise . . . . . . . . . . . . . . . . . . . . . . . . . . . . . . . . . . . . . . . . . . . . . . . . . . . . . . . . . . . . . . . . . . . . . . . . . . . . 5
figure 3: signal strength and distance . . . . . . . . . . . . . . . . . . . . . . . . . . . . . . . . . . . . . . . . . . . . . . . . . . . . . . . . . . . . . . . . . . . . . . . . . . . . . . . . . . . . . 6
figure 4: Decline in lowest data received rate . . . . . . . . . . . . . . . . . . . . . . . . . . . . . . . . . . . . . . . . . . . . . . . . . . . . . . . . . . . . . . . . . . . . . . . . . . . . . . . 8
figure 5: Low rate clients predominate . . . . . . . . . . . . . . . . . . . . . . . . . . . . . . . . . . . . . . . . . . . . . . . . . . . . . . . . . . . . . . . . . . . . . . . . . . . . . . . . . . . . . 8
figure 6: Time on channel requirements . . . . . . . . . . . . . . . . . . . . . . . . . . . . . . . . . . . . . . . . . . . . . . . . . . . . . . . . . . . . . . . . . . . . . . . . . . . . . . . . . . . 9
figure 7: Percentage of time on channel by data rate . . . . . . . . . . . . . . . . . . . . . . . . . . . . . . . . . . . . . . . . . . . . . . . . . . . . . . . . . . . . . . . . . . . . . . 10
figure 8: Connection rate is misleading . . . . . . . . . . . . . . . . . . . . . . . . . . . . . . . . . . . . . . . . . . . . . . . . . . . . . . . . . . . . . . . . . . . . . . . . . . . . . . . . . . . 10
figure 9: Adjacent channel interference . . . . . . . . . . . . . . . . . . . . . . . . . . . . . . . . . . . . . . . . . . . . . . . . . . . . . . . . . . . . . . . . . . . . . . . . . . . . . . . . . . . . 11
figure 10: Interference from a high-powered access point . . . . . . . . . . . . . . . . . . . . . . . . . . . . . . . . . . . . . . . . . . . . . . . . . . . . . . . . . . . . . . . . . 12
figure 11: Relationship of noise to access point radio power . . . . . . . . . . . . . . . . . . . . . . . . . . . . . . . . . . . . . . . . . . . . . . . . . . . . . . . . . . . . . . . . 12
figure 12: Lower power cuts adjacent channel interference . . . . . . . . . . . . . . . . . . . . . . . . . . . . . . . . . . . . . . . . . . . . . . . . . . . . . . . . . . . . . . . . 13
figure 13: Throughput-at-distance for different antenna/stream configurations . . . . . . . . . . . . . . . . . . . . . . . . . . . . . . . . . . . . . . . . . . . 15
figure 14: Relative power consumption of multiple streams . . . . . . . . . . . . . . . . . . . . . . . . . . . . . . . . . . . . . . . . . . . . . . . . . . . . . . . . . . . . . . . 15
figure 15: WLA522 optimized for control at low power levels . . . . . . . . . . . . . . . . . . . . . . . . . . . . . . . . . . . . . . . . . . . . . . . . . . . . . . . . . . . . . . .17
List of Tables
Table 1: 802.11n Association Data Rates (MCs Rate Indices) . . . . . . . . . . . . . . . . . . . . . . . . . . . . . . . . . . . . . . . . . . . . . . . . . . . . . . . . . . . . . . . . 7
Table 2: steps for a successful High Capacity WLAN Deployment . . . . . . . . . . . . . . . . . . . . . . . . . . . . . . . . . . . . . . . . . . . . . . . . . . . . . . . . 14
Table 3: Effect of Adding More Antennas and/or streams . . . . . . . . . . . . . . . . . . . . . . . . . . . . . . . . . . . . . . . . . . . . . . . . . . . . . . . . . . . . . . . . . 14

Copyright © 2011, Juniper Networks, Inc. 3
WHITE PAPER - Coverage or Capacity—Making the Best Use of 802.11n
Executive Summary
The proliferation of wireless devices—laptops, tablets, and smartphones with dual-mode communications—tells us that
users now expect to be both fully mobile and constantly connected—24x7.
In addition, an increasing amount of traffic now consists of high-resolution graphics and full motion video, further burdening
the wireless LAN infrastructure and challenging WLAN designers.
fortunately, the latest 802.11n WLAN technology revolutionizes enterprise networks with substantial gains in performance
and range over legacy 802.11a/b/g technologies, making the unwired enterprise a practical reality.
But as with any new technology, there are new challenges. Enterprises adopting the new standard have learned that there is
no “one-size-fits-all” 802.11n solution. Real-world deployments demand trade-offs between range and performance.
Coverage or Capacity
optimal deployment of 802.11n depends on enterprise goals—either maximize coverage at the lowest cost or maximize
capacity while “future proofing” the network for voice and location services.
This white paper examines these two different strategies for enterprise wireless LAN deployment and discusses how to
best take advantage of the flexibility built into the 802.11n standard.
Introduction
When deploying an enterprise WLAN, the primary goal is to maximize either coverage or capacity.
Maximum coverage deployments support a low density of users with low throughput demands. This approach is common
in public hot spots, warehouses, factories, and retail installations where cost-effective coverage is more important than
performance.
Maximum capacity deployments support a large number of high bandwidth users and mission critical applications such
as voice, video, and location services. While this approach was pioneered in hospitals and educational institutions, the
proliferation of wireless devices and multimedia communications in the enterprise (all demanding more bandwidth) now
make maximum capacity the preferred wireless local area network (WLAN) design objective in most environments.
When the goal is maximum coverage, the enterprise can keep costs low by deploying as few access points as possible and
turning up the radio signal power as high as possible. But real-world experience shows that this high-powered approach is
not the solution for high capacity deployments. In fact, cranking up the power creates problems for sites that require high
throughput—the most serious being adjacent channel interference, which increases exponentially as power output rises.
An access point turned up to full power can pollute the transmissions of a neighboring access point operating on an
adjacent channel.
Another problem is the result of variable association rates—the further a client is from the access point, the lower the data
rate. In a large cell served by a fully powered access point, up to 50% of clients may be operating in the lowest rate area of
the network. To make matters worse, those low rate users tie up 70% of all airtime—degrading performance for everyone else
on the network.
fortunately, the flexibility built into 802.11n multiple input and multiple output (MIMo) technology enables different
approaches to WLAN deployment based on enterprise goals. In fact, the 802.11n standard defines a wide range of options
for selectively tuning the performance characteristics of access points to meet different use cases and price points. These
options can range from a single radio with single antenna supporting only one spatial stream, to a 4x4 MIMo configuration
with four antennas and four spatial streams.
for high capacity areas, enterprises can deploy a higher density of access points by reducing the cell size of each. Cell size is
reduced by reducing radio power and turning off the lowest data rates. This technique eliminates problems associated with
adjacent channel interference and low rates, thereby optimizing performance for all clients using that cell.
Powering down has cost benefits as well. Because they don’t require expensive features for maximizing coverage, access
points designed for maximum capacity are less expensive, delivering a consistently attractive RoI.
This white paper, intended for a moderately technical audience, discusses the best practices for deploying 802.11n,
depending on whether the enterprise goal is to maximize wireless coverage or to maximize wireless capacity.

4 Copyright © 2011, Juniper Networks, Inc.
WHITE PAPER - Coverage or Capacity—Making the Best Use of 802.11n
802.11n—Untethering the Enterprise
With dramatic improvements in range and throughput over legacy 802.11a/b/g technologies, 802.11n is the catalyst for
enterprises to start cutting the cords that bind workers to their desks. supporting transmission speeds up to 150 Mbps per
stream and up to four streams, 802.11n can be up to 12 times faster than current 802.11a and 802.11g technology, and it uses
greater efficiency to deliver up to 20 times the throughput of legacy standards.
An ideal platform for enabling next-generation wireless services and applications, 802.11n also represents a competitive
advantage for companies interested in saving money, attracting top talent, and increasing security. Wireless LANs keep
information at employees’ fingertips, allowing faster decision making, reduced downtime, and better collaboration.
There are also cost benefits to going wireless. financial models demonstrate that by moving to a wireless network access
layer, an enterprise can reduce capital costs by 40 to 50% and operational costs by 20 to 30%.
One Size Does Not Fit All
The promise of 802.11n has given rise to a myth that it is the cure for all of the enterprise’s ills. Amidst the hyperbole around
the promise of 300-600 Mbps, it’s easy to forget that 802.11n is shared Ethernet and is subject to many different factors
affecting performance.
Network designers should be aware that a strategy successful at one site may not be the right approach for another
environment. User density and bandwidth considerations make designing a WLAN for maximum capacity completely
different from designing one for maximum coverage.
sites that require maximum coverage generally exhibit low user density and low throughput demands. supporting a small
number of low traffic Wi-fi client devices scattered over a large area, these sites require only a few access points to provide
adequate wireless service. Examples include public hot spots, warehouses, factories, shipping yards, automobile dealership
lots, retail installations, and some hospitality applications.
on the other hand, sites that require maximum capacity must serve many concurrent users with high bandwidth
requirements, and they must support mission critical, real-time applications such as voice and location tracking. This is
especially true given the increased use of high-resolution graphics and video. Examples of maximum capacity deployments
include k-12 and higher education, hospitals, and office buildings.

Copyright © 2011, Juniper Networks, Inc. 5
WHITE PAPER - Coverage or Capacity—Making the Best Use of 802.11n
Understanding Wireless Network Performance
The popular belief is that wireless network performance depends on signal power. But in reality, the critical factor in
measuring overall performance of any communication system is signal-to-noise ratio (sNR)—the ratio of the signal power
(s) to the noise power (N)—as illustrated in figure 1.
Figure 1: Performance depends on the signal-to-noise ratio
The higher the signal-to-noise ratio, the better the performance; the absolute power level of either the signal or the noise is
irrelevant. for example, you can use noise reduction to increase sNR, raising overall performance without changing the signal
power level. sufficient sNR enables recovery of transmitted information (the signal s, from the background noise N)—in
other words, successful communications.
figure 2 depicts a wireless access point and the signal strength (intensity of the signal power) associated with its operating
channel. Background noise is present in all environments at a constant average intensity and is unrelated to other
communication sources.
Figure 2: Signal strength and background noise
Higher throughputLower error rate
Greater reach
Lower throughputHigher error rate
Less reach
Increasing SNR
Access point
High
Signalstrength
Backgroundnoise
Low

6 Copyright © 2011, Juniper Networks, Inc.
WHITE PAPER - Coverage or Capacity—Making the Best Use of 802.11n
As users move away from an access point, signal power decreases while background noise remains constant, resulting in a
decline in sNR and operation at successively lower data rates. At a certain distance the signal is lost in the background noise,
resulting in a signal-to-noise ratio that will no longer support communications.
In reality, it is very difficult to design power amplifiers that support the linear increase in sNR shown in figure 1. At certain
levels, the distortion is so significant that it becomes cost prohibitive to design and build a system that can sustain and
recover signals in the presence of high noise levels.
figure 3 illustrates a signal-to-distance relationship that more closely resembles wireless network performance in
real-world conditions.
Figure 3: Signal strength and distance
A signal-to-noise ratio that falls below the baseline depicted in the figure can no longer support wireless communications.
In the real world, wireless communication environments also include obstacles that cause reflections, refraction, and
absorption of the signal. some of these obstacles (such as people) are transient—moving in and out of the signal area.
Rate Versus Reach in 802.11n
While signal attenuation is a gradual and continuous phenomenon, the 802.11n specification defines data rates in discrete
increments, each requiring specific minimum received signal power levels for reliable operation. The minimum received signal
power level required to achieve a sufficient sNR is called receive sensitivity. If the received signal power level falls below the
receive sensitivity for a data rate, communication at that data rate becomes unreliable.
ReceivedPower
Distance from transmitter
Baseline

Copyright © 2011, Juniper Networks, Inc. 7
WHITE PAPER - Coverage or Capacity—Making the Best Use of 802.11n
Table 1 lists 802.11n association data rates (also known as the Modulation and Coding scheme or MCs rate indices) and
associated receive sensitivities.
Table 1: 802.11n Association Data Rates (MCS Rate Indices)
MCS RATE INDEx
DATA STREAMS
MODULATION / ECC
DATA RATE (MbPS) RECEIVE SENSITIVITy(DbM)
800NS GI 400NS GI
20 MHz 40 MHz 20 MHz 40 MHz 20 MHz 40 MHz
0 1 BPsk / 1:2 6.5 13.5 7.2 15.0 -82 -79
1 1 QPsk / 1:2 13.0 27.0 14.4 30.0 -79 -76
2 1 QPsk / 3:4 19.5 40.5 21.7 45.0 -77 -74
3 1 16-QAM / 1:2 26.0 54.0 28.9 60.0 -74 -71
4 1 16-QAM / 3:4 39.0 81.0 43.3 90.0 -70 -67
5 1 64-QAM / 2:3 52.0 108.0 57.8 120.0 -66 -63
6 1 64-QAM / 3:4 58.5 121.5 65.0 135.0 -65 -62
7 1 64-QAM / 5:6 65.0 135.0 72.2 150.0 -64 -61
8 2 BPsk / 1:2 13.0 27.0 14.4 30.0 -82 -79
9 2 QPsk / 1:2 26.0 54.0 28.9 60.0 -79 -76
10 2 QPsk / 3:4 39.0 81.0 43.3 90.0 -77 -74
11 2 16-QAM / 1:2 52.0 108.0 57.8 120.0 -74 -71
12 2 16-QAM / 3:4 78.0 162.0 86.7 180.0 -70 -67
13 2 64-QAM / 2:3 104.0 216.0 115.6 240.0 -66 -63
14 2 64-QAM / 3:4 117.0 243.0 130.0 270.0 -65 -62
15 2 64-QAM / 5:6 130.0 270.0 144.4 300.0 -64 -61
16 3 BPsk / 1:2 19.5 40.5 21.7 45.0 -82 -79
17 3 QPsk / 1:2 39.0 81.0 43.3 90.0 -79 -76
18 3 QPsk / 3:4 58.5 121.5 65.0 135.0 -77 -74
19 3 16-QAM / 1:2 78.0 162.0 86.7 180.0 -74 -71
20 3 16-QAM / 3:4 117.0 243.0 130.7 270.0 -70 -67
21 3 64-QAM / 2:3 156.0 324.0 173.3 360.0 -66 -63
22 3 64-QAM / 3:4 175.5 364.5 195.0 405.0 -65 -62
23 3 64-QAM / 5:6 195.0 405.0 216.7 450.0 -64 -61
Note: Both the access point and the client require two or three spatial streams to enjoy the higher data rates offered by
MCs8-15 or MCs16-23, respectively.

8 Copyright © 2011, Juniper Networks, Inc.
WHITE PAPER - Coverage or Capacity—Making the Best Use of 802.11n
As a client device moves farther away from the access point, the declining received signal power level forces the
communication link to operate at successively lower data rates, until the sNR is too low for communication at the lowest
data received rate (figure 4).
Figure 4: Decline in lowest data received rate
Tragedy of the Commons—Low Rate Clients Degrade WLAN Performance
In large 802.11n cells, the low rate boundary region of the network is by far the largest region of coverage. Clients in the
boundary region are forced to use lower modulation schemes, resulting in inefficient use of bandwidth/airtime.
In low-density deployments with access points operating at high power levels, as much as half of all WLAN clients may be
operating in the lowest rate region, assuming equal distribution of clients across the coverage area as shown in figure 5.
Figure 5: Low rate clients predominate
-82 dBm
-77 dBm
-70 dBm
-64 dBm
-79 dBm
-74 dBm
-66 dBm
-65 dBm
150/300 Mbps
135/260 Mbps
120/240 Mbps
90/180 Mbps
60/120 Mbps
45/90 Mbps
30/60 Mbps
14.4/30 Mbps
49.9%
18.5%
15.8%
Percentage ofCoverage Area
Coverage Area MCS0-7/MCS8-15Throughput

Copyright © 2011, Juniper Networks, Inc. 9
WHITE PAPER - Coverage or Capacity—Making the Best Use of 802.11n
In fact, more than 84% of the network coverage area is in the three lowest rate regions. Edge performance doesn’t pose a
problem for low-density networks with light data traffic demands, but it can cripple performance in a WLAN environment
that requires high capacity because of either the high number of users or high per-user bandwidth demands—or both.
In high capacity deployments, low data rates at the edge of the cell degrade performance for all WLAN clients using the
same radio—resulting in a wireless network that does not meet the throughput and latency requirements of its users.
The battle for Airtime—Everyone Loses
A major factor in aggregate WLAN performance is based on the shared access nature of wireless Ethernet. Before 1989,
nodes in wired Ethernet deployments were forced to compete for media access using the carrier-sense multiple access
with collision detection (CsMA/CD) protocol to avoid and detect collisions, and the best practice for scaling performance
was to segment the network into multiple collision domains. The arrival of full duplex, switched Ethernet, brought network
segmentation, ending contention battles and increasing throughput for clients.
While wired Ethernet has advanced from shared media to a switched, point-to-point topology, all 802.11 wireless LANs
continue to operate by sharing the air. It is also worthy to note that because traffic collisions cannot be detected in a wireless
environment, Wi-fi must instead couple CsMA with a less efficient collision avoidance protocol.
The shared media nature of 802.11n means that the problems related to a highly variable association rate are aggravated
by Head-of-Line Blocking (HoLB), because there is nothing to stop the transmission of larger, low priority packets ahead of
smaller, high priority packets on ingress. Because more clients might be connected at the lower link rates, an access point’s
aggregate throughput can plummet when it needs to allocate more airtime to those users transferring data at low rates. To
make matters worse, the low rate users on the edge of the network also tie up a disproportionate amount of airtime—50% of
all users might be consuming more than 70% of airtime, for example—degrading performance for everyone else sharing the
same radio.
figure 6 shows the time on channel (airtime) required for transmitting 1 megabyte at the lowest MCs rate (MCs0) and the
highest MCs rate (MCs15) using one spatial stream.
Figure 6: Time on channel requirements
As shown in figure 6, transmission of a 1 MB file at the MCs0 rate takes 20 times longer than transmission at MCs15. Because
802.11n uses a shared media paradigm, only one client can transmit data at a time, which means that all other clients must
wait their turn to transmit.
Lowest Rate 20X
Highest Rate 1X (Airtime unavailable to others on the WLAN)
TIme to transmit 1 megabyte of data with one spatial stream
10 Copyright © 2011, Juniper Networks, Inc.
WHITE PAPER - Coverage or Capacity—Making the Best Use of 802.11n
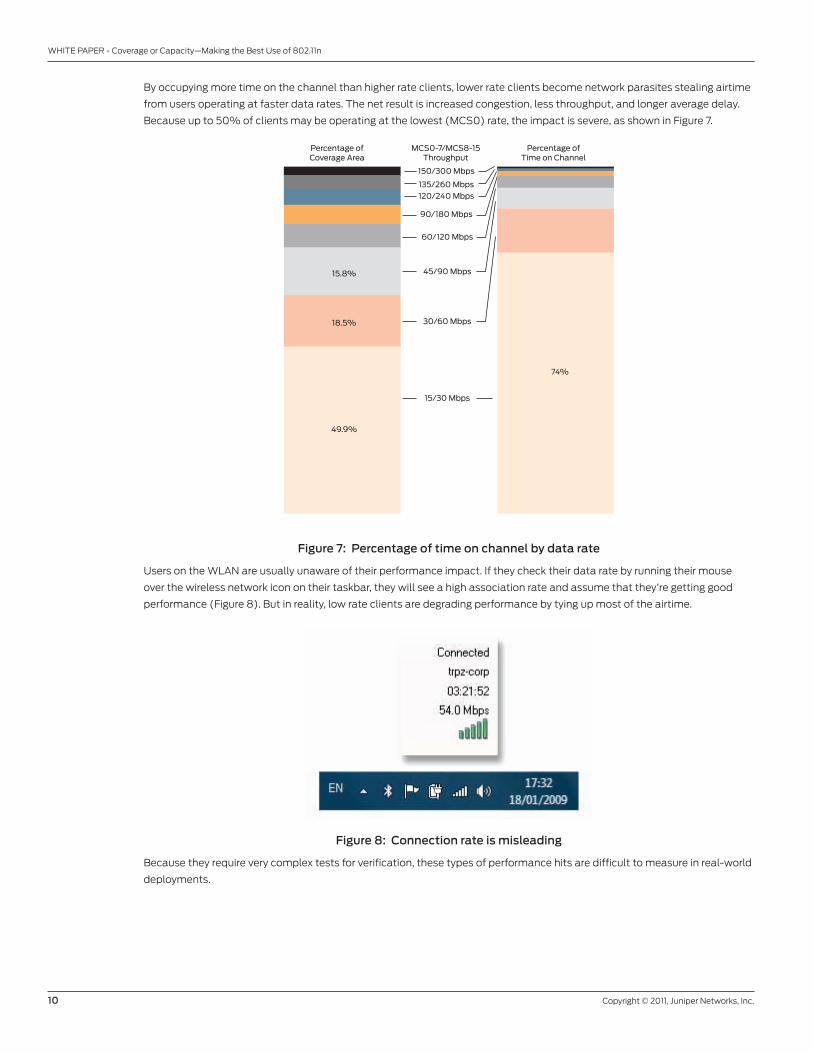
By occupying more time on the channel than higher rate clients, lower rate clients become network parasites stealing airtime
from users operating at faster data rates. The net result is increased congestion, less throughput, and longer average delay.
Because up to 50% of clients may be operating at the lowest (MCs0) rate, the impact is severe, as shown in figure 7.
Figure 7: Percentage of time on channel by data rate
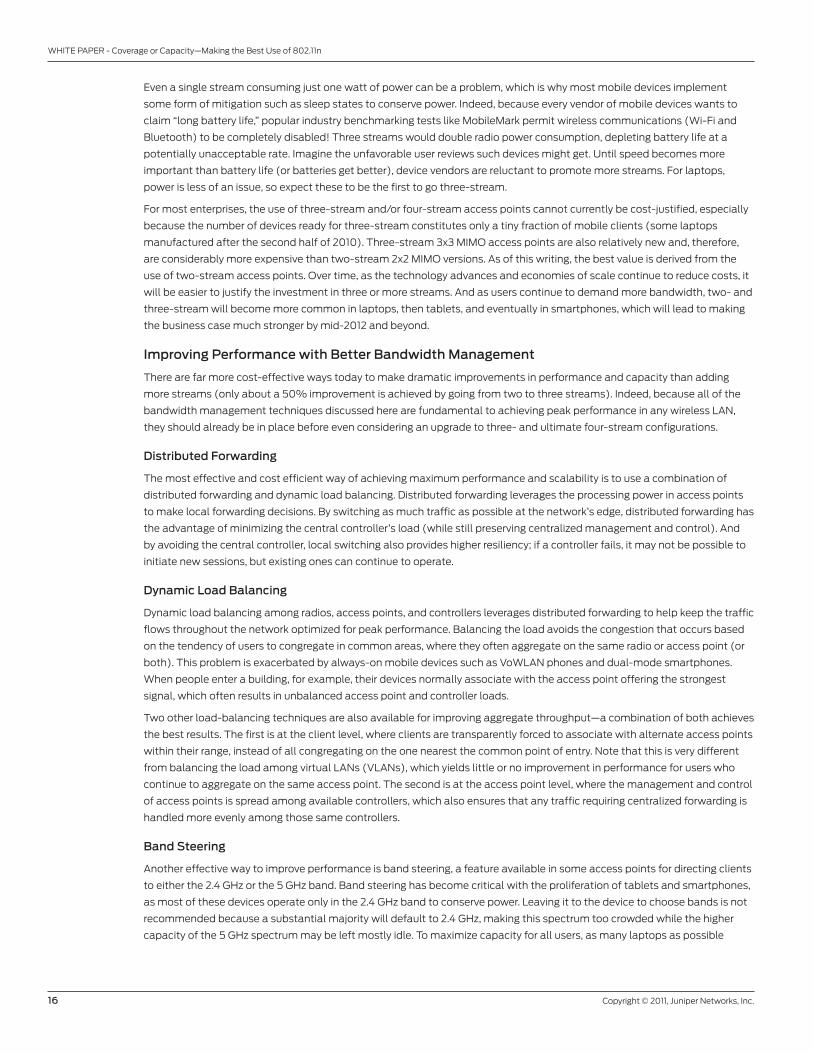
Users on the WLAN are usually unaware of their performance impact. If they check their data rate by running their mouse
over the wireless network icon on their taskbar, they will see a high association rate and assume that they’re getting good
performance (figure 8). But in reality, low rate clients are degrading performance by tying up most of the airtime.
Figure 8: Connection rate is misleading
Because they require very complex tests for verification, these types of performance hits are difficult to measure in real-world
deployments.
150/300 Mbps
135/260 Mbps
120/240 Mbps
90/180 Mbps
60/120 Mbps
45/90 Mbps
30/60 Mbps
15/30 Mbps
49.9%
18.5%
15.8%
74%
Percentage ofCoverage Area
Percentage ofTime on Channel
MCS0-7/MCS8-15Throughput

Copyright © 2011, Juniper Networks, Inc. 11
WHITE PAPER - Coverage or Capacity—Making the Best Use of 802.11n
Airtime—Fairness or Unfairness?
some wireless networking vendors have implemented airtime fairness features that favor 802.11n-capable clients over legacy
802.11a/b/g clients. The goal is to prevent legacy clients from slowing down the faster 802.11n clients. But these techniques
don’t apply if the WLAN is populated completely with 802.11n clients. Also, there’s skepticism about applying these
techniques in a high capacity deployment where many legacy devices are IP telephones, which should receive priority service
instead of being punished with airtime “unfairness.”
Another effective way to achieve better overall fairness involves the accounting capabilities in RADIUs or other directory
servers to track utilization by all users over time. This permits rules to be established and applied based on a combination
of weighted fair queuing (WfQ) and bandwidth limiting to temporarily throttle back the usage of both chronic and acute
bandwidth abusers, as needed.
for voice over WLAN (voWLAN) calls, it is also important to take into account the need for more airtime for devices
operating at lower data rates. for this reason, the quality-of-service (Qos) provisions should be capable of differentiating
between 802.11b and 802.11g devices, and permit sufficiently greater airtime for the slower 802.11b sessions.
Adjacent Channel Interference
Another problem in turning up access point radio power is an exponential rise in adjacent channel interference, which affects
the performance of neighboring access points in a high-density deployment.
When neighboring access points are transmitting on adjacent channels, they can pollute each other’s radio frequency (Rf)
environment, thereby degrading performance. figure 9 illustrates how transmission within one of the 20 MHz channels
generates some amount of unwanted energy that leaks into adjacent channels.
Figure 9: Adjacent channel interference
As shown in figure 9, energy from a channel leaks into both of the adjacent channels. In turn, this channel is vulnerable to
energy leaking from the two channels adjacent to it.
20 MHz Channels

12 Copyright © 2011, Juniper Networks, Inc.
WHITE PAPER - Coverage or Capacity—Making the Best Use of 802.11n
figure 10 illustrates how one access point at high power (~18 dBm, shown in red) can pollute the surrounding environment
with adjacent channel noise that exceeds the always present background noise.
Figure 10: Interference from a high-powered access point
An overpowered access point raises the noise floor for any neighboring access points on adjacent channels, effectively
reducing the potential throughput of those devices. And even if neighboring access points are not on adjacent channels, their
neighbors in a high-density deployment might be.
figure 11 shows a wireless cell in isolation to illustrate the noise floor of a single channel when a single access point is
fully powered.
Figure 11: Relationship of noise to access point radio power
Adjacent channel noise Background noiseChannel A
Adjacent channel noise Background noiseChannel A
Access Point

Copyright © 2011, Juniper Networks, Inc. 13
WHITE PAPER - Coverage or Capacity—Making the Best Use of 802.11n
Power Down for Capacity
Planners can take advantage of the exponential relationship between power output and channel interference by making
slight adjustments to the power level. While turning down transmit power may seem counterintuitive, a reduction in transmit
power levels is a valuable technique for maximizing throughput for both an access point and its neighbors. Turning down
the power slightly reduces the radius of the service area, but it also reduces interference by a much greater factor. As shown
in figure 12, although turning down the power reduces the coverage area of the channel by 30-40%, it almost completely
eliminates the adjacent channel interference.
Figure 12: Lower power cuts adjacent channel interference
Turning down transmit power is a prudent and proven technique for maximizing throughput for an access point and its
neighbors in a high-density deployment. This makes it a best practice for a WLAN designer to streamline a wireless cell for
optimal performance.
Planning a High Capacity Deployment
Clearly, there’s more to getting maximum range and performance than turning up or down the power on 802.11n access points.
The large number of low rate clients at the edge of the network degrades performance for everyone else—making a strategy
based on raw signal power unsuitable for high capacity deployments. for this reason, WLAN designers deploying for high
capacity can eliminate the problem by streamlining the cell—that is, by turning off those areas with low association rates.
While a streamlined cell gives all WLAN users higher data rates, it also creates coverage holes, making it necessary to deploy
more access points in a high-density configuration. With the coverage holes filled, planners can then eliminate the possibility
of adjacent channel interference by turning down access point power to a level that reduces interference completely. Table 2
shows the methodology for a successful high capacity deployment.
Adjacent channel noise
Access Point
Background noiseChannel A

14 Copyright © 2011, Juniper Networks, Inc.
WHITE PAPER - Coverage or Capacity—Making the Best Use of 802.11n
Table 2: Steps for a Successful High Capacity WLAN Deployment
ACTION RESULT
Turn down power on access points Minimizes adjacent channel interference
Turn off low rates on access points gives all clients in coverage area high association rates
steer laptop clients to 5 gHz band Balances load more evenly between the 2.4 and 5 gHz bands
Use policies to rate-limit maximum bandwidth utilization Increases airtime fairness when network is enduring peak loads
Implement dynamic Call Admission Control Ensures bandwidth is reserved for active voice calls
for high capacity deployments, access points may or may not need high-performance features such as 3x3 MIMo or
beamforming—technologies that are generally better suited to low-density, maximum coverage environments where
interference and edge performance aren’t issues.
Astute readers will notice that deploying multiple access points designed for maximum capacity will cost more than
deploying them for maximum coverage. But this is only true when considering cost on a per square area basis. If the metric is
performance or available bandwidth, as it should be with the proliferation of wireless devices, then cost should be evaluated
on a per Mbps basis. And by this measure, 2x2 and 2x3 MIMo access points deliver superior price/performance.
MIMO and Multiple Stream Considerations
In addition to the coverage versus capacity trade-offs already mentioned, there are some additional factors WLAN designers
normally need to consider. These include the number of access point antennas and streams, and improving performance
with better bandwidth management.
Exploiting MIMO and Multiple Streams
As shown in figure 13 and Table 3, having more antennas affords greater range by providing better reception over longer
distances, while adding more streams affords higher overall throughput. for example, bandwidth intensive applications will
benefit from the higher throughput of 3x3 access points with three streams (typically 450 Mbps) in both maximum coverage
and maximum capacity configurations, while adding only more antennas and not more streams in a maximum capacity
configuration (with its dense deployment of access points) offers only marginal benefit.
Table 3: Effect of Adding More Antennas and/or Streams
MAxIMUM COVERAGE MAxIMUM CAPACITy
2x2 MIMo with 2 streams y
3x3 MIMo with 2 streams y
3x3 MIMo with 3 streams y y
Adoption barriers for Multiple Streams
As shown in figure 13, there is a benefit in both maximum coverage and maximum capacity configurations to using 3x3
three-stream access points compared with 2x2 and 3x3 two-stream access points. While the improvements affect both
dimensions, they are not fully realizable today. Capacity gains can only be enjoyed by clients that are also three-stream
capable, so this is a long-term payoff. In contrast, coverage gains are more immediate, since they are the result of new
chipsets which utilize newer, more efficient encoding schemes and advanced Digital signal Processing (DsP) techniques to
yield a stronger signal.
Clearly, whether or not these benefits can be cost-justified rests on many factors. More streams require more back end
capacity at the controller. so the move to three-stream access points might warrant more powerful WLAN controllers
designed specifically for mainstream 802.11n deployment with hardware-assisted control and provisioning of wireless access
points (CAPWAP) and line-rate switching performance. otherwise, the additional capacity at the edge might only create
oversubscription at the controllers, resulting in only a marginal improvement in overall performance.

Copyright © 2011, Juniper Networks, Inc. 15
WHITE PAPER - Coverage or Capacity—Making the Best Use of 802.11n
Figure 13: Throughput-at-distance for different antenna/stream configurations
Power over Ethernet (PoE) may also be a factor here. The original 802.11af PoE standard generally supports 2x2, 2x3, and
most 3x3 two-stream access points. But Ethernet switches supporting 802.11at (aka PoE Plus or PoE+) may be needed to
support the higher power required for three-stream 3x3 MIMo access points or four-stream 4x4 MIMo in future. While most
vendors now support the 802.11at standard in newer access switches, these are not widely deployed in the installed base.
The biggest impediment, however, is the current lack of support for three-stream MIMo in client devices. There are three
primary reasons for this. first, suitable chipsets for three-stream clients have only been available since early 2010. second,
few clients today actually need the additional bandwidth provided by multiple streams. And third, mobile devices are
battery-powered, and Wi-fi consumes a significant amount of a battery’s limited capacity.
Figure 14: Relative power consumption of multiple streams
For MaxCapacityDesign
Range
For MaxCoverageDesign
4x4 Four Stream
3x3 Three Stream
3x3 Two Stream
2x2 Two Stream
2x2 One Stream
Th
rou
gh
pu
t
2 Stream1 Stream
Po
we
r C
on
sum
pti
on
/Wa
tts
3 Stream
16 Copyright © 2011, Juniper Networks, Inc.
WHITE PAPER - Coverage or Capacity—Making the Best Use of 802.11n
Even a single stream consuming just one watt of power can be a problem, which is why most mobile devices implement
some form of mitigation such as sleep states to conserve power. Indeed, because every vendor of mobile devices wants to
claim “long battery life,” popular industry benchmarking tests like MobileMark permit wireless communications (Wi-fi and
Bluetooth) to be completely disabled! Three streams would double radio power consumption, depleting battery life at a
potentially unacceptable rate. Imagine the unfavorable user reviews such devices might get. Until speed becomes more
important than battery life (or batteries get better), device vendors are reluctant to promote more streams. for laptops,
power is less of an issue, so expect these to be the first to go three-stream.
for most enterprises, the use of three-stream and/or four-stream access points cannot currently be cost-justified, especially
because the number of devices ready for three-stream constitutes only a tiny fraction of mobile clients (some laptops
manufactured after the second half of 2010). Three-stream 3x3 MIMo access points are also relatively new and, therefore,
are considerably more expensive than two-stream 2x2 MIMo versions. As of this writing, the best value is derived from the
use of two-stream access points. over time, as the technology advances and economies of scale continue to reduce costs, it
will be easier to justify the investment in three or more streams. And as users continue to demand more bandwidth, two- and
three-stream will become more common in laptops, then tablets, and eventually in smartphones, which will lead to making
the business case much stronger by mid-2012 and beyond.
Improving Performance with better bandwidth Management
There are far more cost-effective ways today to make dramatic improvements in performance and capacity than adding
more streams (only about a 50% improvement is achieved by going from two to three streams). Indeed, because all of the
bandwidth management techniques discussed here are fundamental to achieving peak performance in any wireless LAN,
they should already be in place before even considering an upgrade to three- and ultimate four-stream configurations.
Distributed Forwarding
The most effective and cost efficient way of achieving maximum performance and scalability is to use a combination of
distributed forwarding and dynamic load balancing. Distributed forwarding leverages the processing power in access points
to make local forwarding decisions. By switching as much traffic as possible at the network’s edge, distributed forwarding has
the advantage of minimizing the central controller’s load (while still preserving centralized management and control). And
by avoiding the central controller, local switching also provides higher resiliency; if a controller fails, it may not be possible to
initiate new sessions, but existing ones can continue to operate.
Dynamic Load balancing
Dynamic load balancing among radios, access points, and controllers leverages distributed forwarding to help keep the traffic
flows throughout the network optimized for peak performance. Balancing the load avoids the congestion that occurs based
on the tendency of users to congregate in common areas, where they often aggregate on the same radio or access point (or
both). This problem is exacerbated by always-on mobile devices such as voWLAN phones and dual-mode smartphones.
When people enter a building, for example, their devices normally associate with the access point offering the strongest
signal, which often results in unbalanced access point and controller loads.
Two other load-balancing techniques are also available for improving aggregate throughput—a combination of both achieves
the best results. The first is at the client level, where clients are transparently forced to associate with alternate access points
within their range, instead of all congregating on the one nearest the common point of entry. Note that this is very different
from balancing the load among virtual LANs (vLANs), which yields little or no improvement in performance for users who
continue to aggregate on the same access point. The second is at the access point level, where the management and control
of access points is spread among available controllers, which also ensures that any traffic requiring centralized forwarding is
handled more evenly among those same controllers.
band Steering
Another effective way to improve performance is band steering, a feature available in some access points for directing clients
to either the 2.4 gHz or the 5 gHz band. Band steering has become critical with the proliferation of tablets and smartphones,
as most of these devices operate only in the 2.4 gHz band to conserve power. Leaving it to the device to choose bands is not
recommended because a substantial majority will default to 2.4 gHz, making this spectrum too crowded while the higher
capacity of the 5 gHz spectrum may be left mostly idle. To maximize capacity for all users, as many laptops as possible

Copyright © 2011, Juniper Networks, Inc. 17
WHITE PAPER - Coverage or Capacity—Making the Best Use of 802.11n
should be steered to the 5 gHz band. With their larger batteries, laptops can readily provide the additional power needed to
operate in this higher frequency range. Depending on the mix of client devices, band steering is able to reclaim up to 40% of
the total capacity in a crowded network.
Static Versus Dynamic Call Admission Control
In environments with substantial voWLAN traffic, it is desirable to implement some form of call admission control (CAC).
CAC’s role is to limit the number of active voWLAN sessions to avoid a situation where the network becomes so congested
that quality deteriorates for everyone. The telecom network (PsTN) also has a form of CAC to limit the number of calls,
recognizable by the familiar “all circuits busy” message or “fast” busy signal. Compared with static session-based CAC, which
is typical of most wireless LANs, a dynamic CAC solution offers superior management of available resources based on its
ability to recognize the always-on nature of the many voWLAN-enabled devices, only considering those with active voice
calls in the session count. This ensures that no bandwidth is wasted by being reserved for users who do not actually need it
because they are not on any calls currently.
Identity-based Quality of Service
finally, wireless LAN designers should be cognizant of the fact that not all users are equal. Therefore, it is important that Qos
provisions be based on user identity. Two common ways for implementing role-based enforcement of Qos provisions include
simply giving different classes of users different service set identifiers (ssIDs) or vLANs, or assigning different priorities to
specific users identified in the directory server, or both.
Juniper WLA522 for High-Density, High Capacity Enterprise Deployment
It takes more than simply removing an antenna pair to optimize an access point for high-density deployment. The access
point’s radio design must allow greater control over power settings in the low-power range. This is a characteristic that most
3x3 MIMo access points currently do not exhibit, because their design objective is to maximize range with full power, and not
to maximize throughput on low-power settings.
optimized for maximum performance in the low-power range, the Juniper Networks® WLA522 Wireless LAN Access
Point offers outstanding value for enterprises with high-density WLAN requirements. It is a two-stream, 2x2 MIMo, high-
performance indoor 802.11a/b/g/n access point—an ideal platform for implementing demanding business-class applications
such as voWLAN and real-time location services in a way that maximizes performance for all WLAN users.
Figure 15: WLA522 optimized for control at low power levels
High capacitypower range
High coveragepower range
Power Level
WLA522 Access Point
2x2MIMO
3x3MIMO
Pe
rfo
rma
nce
WLA432 Access Point

18 Copyright © 2011, Juniper Networks, Inc.
WHITE PAPER - Coverage or Capacity—Making the Best Use of 802.11n
2000410-001-EN May 2011
Copyright 2011 Juniper Networks, Inc. All rights reserved. Juniper Networks, the Juniper Networks logo, Junos, Netscreen, and screenos are registered trademarks of Juniper Networks, Inc. in the United states and other countries. All other trademarks, service marks, registered marks, or registered service marks are the property of their respective owners. Juniper Networks assumes no responsibility for any inaccuracies in this document. Juniper Networks reserves the right to change, modify, transfer, or otherwise revise this publication without notice.
EMEA Headquarters
Juniper Networks Ireland
Airside Business Park
swords, County Dublin, Ireland
Phone: 35.31.8903.600
EMEA sales: 00800.4586.4737
fax: 35.31.8903.601
APAC Headquarters
Juniper Networks (Hong kong)
26/f, Cityplaza one
1111 king’s Road
Taikoo shing, Hong kong
Phone: 852.2332.3636
fax: 852.2574.7803
Corporate and Sales Headquarters
Juniper Networks, Inc.
1194 North Mathilda Avenue
sunnyvale, CA 94089 UsA
Phone: 888.JUNIPER (888.586.4737)
or 408.745.2000
fax: 408.745.2100
www.juniper.net
Printed on recycled paper
To purchase Juniper Networks solutions,
please contact your Juniper Networks
representative at 1-866-298-6428 or
authorized reseller.
Because it doesn’t need expensive performance features better suited to deployments requiring maximum coverage, the
WLA522 Wireless LAN Access Point delivers a consistently high return on investment, and provides a straightforward 802.11n
upgrade path for enterprises with legacy 802.11a/b/g infrastructure and clients.
Conclusion
The world is now wireless—at home, in the office, and everywhere in between. Wireless LAN designers face a fundamental
choice of designing for maximum coverage or maximum capacity. With the increase in high bandwidth applications and the
demand for high levels of performance, the dominant requirement today is mostly for high capacity designs.
fortunately, the advanced capabilities of the latest generation of 802.11n solutions make it possible to design a high-
performance wireless LAN that affords complete coverage of the enterprise based on prudent placement of access points
configured with optimal settings for channel utilization and transmit power levels.
other advanced capabilities, like N:N automatic failover for controllers and access points, distributed forwarding, dynamic
load balancing, robust security, real-time location services, and predictive planning tools, among others, all help make
today’s enterprise WLAN as dependable as it is indispensible.
for more information about how your organization can benefit from a simple, secure, and reliable 802.11n WLAN solution,
visit Juniper Networks on the Web at www.juniper.net/us/en/products-services/wireless.
About Juniper Networks
Juniper Networks is in the business of network innovation. from devices to data centers, from consumers to cloud providers,
Juniper Networks delivers the software, silicon and systems that transform the experience and economics of networking.
The company serves customers and partners worldwide. Additional information can be found at www.juniper.net.