Embed Size (px)
Citation preview

Journal of Agri Socio-Economic and Business, Vol. 02 No. 1 June 2020 page: 31 – 12| 31
Journal of Agri Socio-Economics and Business (JASEB)
Available online at : https://ejournal.unib.ac.id/index.php/jaseb/index DOI: 10.31186/jaseb.2.1.31-44
BUSINESS ANALYSIS OF ROBUSTA GROUND COFFEE
PROCESSING: STUDY IN “SINTARO” GROUND COFFEE BUSINESS
IN KABAWETAN SUB-DISTRICT, KEPAHIANG REGENCY
Deva Yurita Ambarini1); Irnad2); Bambang Sumantri2) 1)Study Program of Agribusiness Magister Faculty of Agriculture,
University of Bengkulu 2) Department of Agricultural Socio-Economics, Faculty of Agriculture,
University of Bengkulu
Email: 1) [email protected]
How to Cite :
Ambarini, D.Y., Irnad; B. Sumantri. 2020. Business Analysis Of Robusta Ground
Coffee Processing: Study In “Sintaro” Ground Coffee Business In
Kabawetan Sub-District, Kepahiang Regency. Journal of Agri Socio-
Economics and Business. 2 (1): 31-44.
DOI:https://doi.org/10.31186/jaseb.2.1.31-44
ARTICLE HISTORY
Received [17 May 2020
Revised [19 May 2020]
Accepted [17 June 2020]
ABSTRACT
One of the ground coffee businesses in Kepahiang Regency
is “Sintaro” operated from 2008 – Today and produces
ground coffee through two material selection systems using
all ground and red bean. The purpose of the present study
was to estimate and analyze the revenue, value-added and
marketing of the ground coffee processing which uses red
bead and all grade bean. Value added was analysed using
Hayami approach while revenue and marketing were
analysed decriptively. Based on the research result, the
revenue of ground coffee processing which uses red bean
was Rp2,512,351/month or profitability level of 87,1 % while
the revenue of ground coffee processing used all grade bean
was Rp3,340,409 month profitability level of 226 %. The
value-added of processing red bean was Rp 9,676/Kg with
value added ratio of 62% in a single production. The value-
added of processing all grade bean was Rp2,834/Kg with
value added ratio of 46% in a single production. Red bean
ground coffee marketing covered Bengkulu, Palembang, and
Jakarta, with distribution percentages of 62 %, 26 %, and
12%, respectively. Meanwhile, all grade ground coffee
covered Kepahiang Regency, Bengkulu, Lubuk Linggau and
Lampung, with distribution percentages of 35 %, 28 %, 24 %,
and 12 %, respectively.
KEYWORDS
Red Bean and All Grade
Ground Coffee,
Revenue,
Value Added
Marketing.
This is an open access article
under the CC–BY-SA license

ISSN: 2685-7243 e-ISSN : 2715-839X
32 | Deva Yurita Ambarini; Irnad; Bambang Sumantri; Business Analysis of Robusta ...
INTRODUCTION
Based on the result of physical quality test from the Center of Coffee and
Cocoa Research (PUSLITKOKA) of Indonesia, Kepahiang Robusta coffee has grade 1
to 3 of SNI with big to small beans and its final score of flavor profile test is 81.33 –
84.42, which is categorized as excellent. Moreover, Kepahiang Robusta coffee has
several flavors, i.e. chocolaty, sweet, caramelly, flowery, fruity (salak), black tea, and
woody. The test is performed on red bean coffee instead of all grade coffee. The
drying process also meets the required Standard Operating Procedure (SOP), i.e.
using para-para, Drying house, and some farmers solar dryer. These coffee beans
did not dry on the ground, floor, tarp or road. For that reasons, Kepahyang Robusta
Coffee has received Geographic Indication Certificate (SIG).
Geographic Indication Certificate (SIG) for Kepahiang Robusta coffee is issued
by the Directorate General of Intellectual Property of the Ministry of Law and Human
Rights on November 2018 with number: IDG000000072 as a legal recognition that
Kepahiang robusta coffee has met the required standards to get the geographic
indication certificate. The Geographic Indication produced by Kabawetan Sub-district
geographic area is coffee in the forms of dried coffee, roasted coffee, and ground
coffee made of healthy and fresh red bean (BMSS).
The area of Kepahiang Regency is 66,500 Ha while the cultivation area is
48,393.69 Ha and dominated by smallholder coffee plantation (24,686 Ha) owned by
69,180 households (BPS Kepahiang in figures 2018). Kepahiang Regency has the
largest coffee plantation area in Bengkulu Province. The plantation statistical data of
the Department of Agriculture in 2018 showed that robusta coffee production was
19,098 tons/year. Robusta ground beef processing in Kepahiang Regency was 13.705
tons/month (Source: Department of Industry and Manpower of Kepahiang Regency,
2018).
Coffee bean picking patterns in Kepahiang Regency are red bean and all grade
bean picking (rainbow picking) of red, yellow, and green beans. Presently, Kepahiang
Regency government through related departments launch red bean picking program
for coffee harvest. Red bean is assumed to have higher selling price than all grade
coffee. Red bean has better quality coffee product and better flavor.
One of the ways to get value added for coffee product is advanced processing.
Coffee processing is a promising business opportunity due to the society’s love for
coffee for its unique flavor and aroma. Robusta red coffee bean processed into
ground coffee known as premium ground coffee, which is expected to contribute
revenue and value-added to farmers who process ground coffee. The present study
also aimed to compared the value added of Robusta red bean and all grade bean
coffees managed by farmers in Kabawetan Sub-district.
Huge coffee potential in Kepahiang are considered promising business
opportunities.. The ground coffee uses material from local farmers, thus facilitating
local economy to develop. The question that must be answered is whether the
processing of ground coffee is profitable or not? Therefore, measuring business
ISSN: 2685-7243 e-ISSN : 2715-839X
Journal of Agri Socio-Economic and Business, Vol. 02 No. 1 June 2020 page: 31 – 12| 33
performance is very important to do. This is intended to help management to
estimate the company's economic performance going forward as well as information
whether or not the company needs to make operational changes (Nanni, et al 1992;
Simons, 2000). Blokland (2003) explains that there are four categories of analysis
that can be used to analyze financial performance, two of which are Profitability and
Efficiency. Another measurement is the added value according to Hayami et al.
(1987), value added is the added value of a commodity caused by the treatment of
the commodity, such as processing, transportation or storage.. To get revenue
efficiency, marketing is important. Departing from these arguments, it is significant
to study the Business Analysis of “Sintaro” Ground Coffee Processing Business in
Kepahiang Regency.
RESEARCH METHODS
Research location and period determination method
The present study was performed on “Sintaro” ground coffee processing
business in Bukit Sari Village, Kabawetan Sub-district Kepahiang Regency. The
research location was determined purposively. It was by considering that the ground
coffee processing company is one of the ground coffee processing company which
uses red bean and all grade bean. The research period was August 2019.
Data collection method
The data types were quantitative and qualitative data. Based on the source,
they were primary and secondary data. Quantitative data is data in the form of
numbers (Sugiyono, 2013). Data secondary data was obtained from the Central
Bureau of Statistics of Kepahiang Regency, Department of Agriculture of Kepahiang
Regency, Office of Kabawetan Sub-district, and other publications related with red
bean coffee processing. Primary data was obtained from respondents by direct
observation and direct interview with the producer using a list of questions
(Questionaire).
Data Analysis Method
The analysis method in the present study processing and descriptively
analyzing data from respondents. In the present study, the business analyses to
analyze the revenue of red bean and all grade bean ground coffee processing are:
Business Revenue Analysis
Revenue is calculated by subtracting total production cost from total sales
revenue (Prayitno & Arsyad, 1997). Soekartawi (1995) states that revenue report is
obtained from multiplying total sold production with the selling price of the product.
The revenue of Sintaro ground coffee company was found by calculating total cost,
ISSN: 2685-7243 e-ISSN : 2715-839X
34 | Deva Yurita Ambarini; Irnad; Bambang Sumantri; Business Analysis of Robusta ...
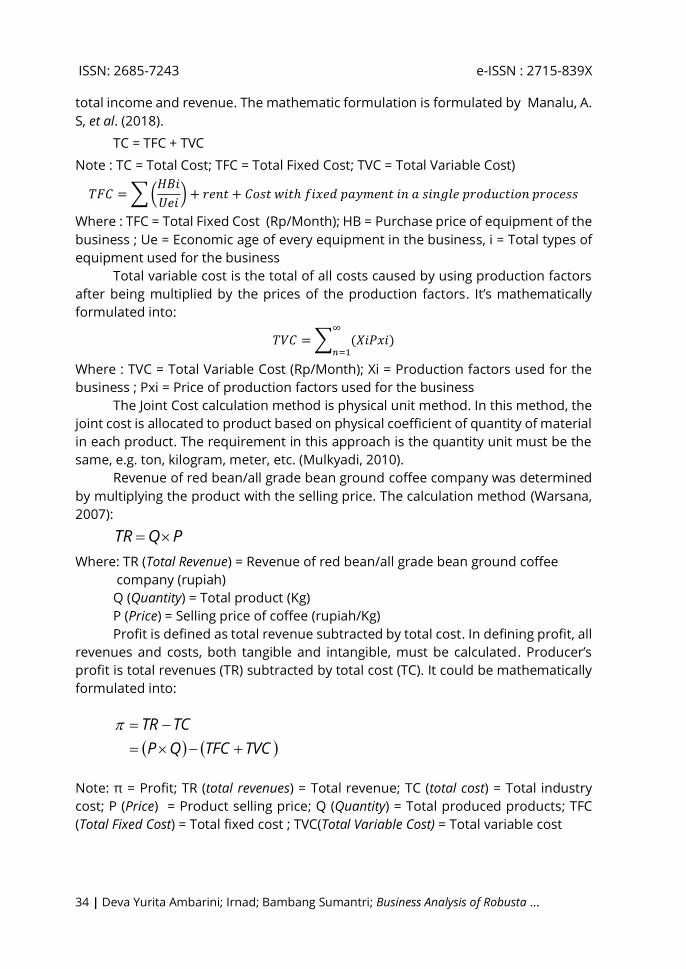
total income and revenue. The mathematic formulation is formulated by Manalu, A.
S, et al. (2018).
TC = TFC + TVC
Note : TC = Total Cost; TFC = Total Fixed Cost; TVC = Total Variable Cost)
𝑇𝐹𝐶 = ∑ (𝐻𝐵𝑖
𝑈𝑒𝑖) + 𝑟𝑒𝑛𝑡 + 𝐶𝑜𝑠𝑡 𝑤𝑖𝑡ℎ 𝑓𝑖𝑥𝑒𝑑 𝑝𝑎𝑦𝑚𝑒𝑛𝑡 𝑖𝑛 𝑎 𝑠𝑖𝑛𝑔𝑙𝑒 𝑝𝑟𝑜𝑑𝑢𝑐𝑡𝑖𝑜𝑛 𝑝𝑟𝑜𝑐𝑒𝑠𝑠
Where : TFC = Total Fixed Cost (Rp/Month); HB = Purchase price of equipment of the
business ; Ue = Economic age of every equipment in the business, i = Total types of
equipment used for the business
Total variable cost is the total of all costs caused by using production factors
after being multiplied by the prices of the production factors. It’s mathematically
formulated into:
𝑇𝑉𝐶 = ∑ (𝑋𝑖𝑃𝑥𝑖)∞
𝑛=1
Where : TVC = Total Variable Cost (Rp/Month); Xi = Production factors used for the
business ; Pxi = Price of production factors used for the business
The Joint Cost calculation method is physical unit method. In this method, the
joint cost is allocated to product based on physical coefficient of quantity of material
in each product. The requirement in this approach is the quantity unit must be the
same, e.g. ton, kilogram, meter, etc. (Mulkyadi, 2010).
Revenue of red bean/all grade bean ground coffee company was determined
by multiplying the product with the selling price. The calculation method (Warsana,
2007):
PQTR
Where: TR (Total Revenue) = Revenue of red bean/all grade bean ground coffee
company (rupiah)
Q (Quantity) = Total product (Kg)
P (Price) = Selling price of coffee (rupiah/Kg)
Profit is defined as total revenue subtracted by total cost. In defining profit, all
revenues and costs, both tangible and intangible, must be calculated. Producer’s
profit is total revenues (TR) subtracted by total cost (TC). It could be mathematically
formulated into:
TVCTFCQP
TCTR
Note: π = Profit; TR (total revenues) = Total revenue; TC (total cost) = Total industry
cost; P (Price) = Product selling price; Q (Quantity) = Total produced products; TFC
(Total Fixed Cost) = Total fixed cost ; TVC(Total Variable Cost) = Total variable cost
ISSN: 2685-7243 e-ISSN : 2715-839X
Journal of Agri Socio-Economic and Business, Vol. 02 No. 1 June 2020 page: 31 – 12| 35
a. Profitability
The method to calculate the profitability of each coffee product was
Downey and Erickson’s method (1992) which was formulated into:
Profitability used ratio of profit to cost in percentage:
%100TR
Pd
Note : = Profitability (%); Pd = Profit (Rp/Month); TC = Total Cost (Rp/Month)
Decision criteria (Downey and Erickson, 1992).:
Profitability > 0 means the business is profitable
Profitability ≤ 0 means the business isn’t profitable
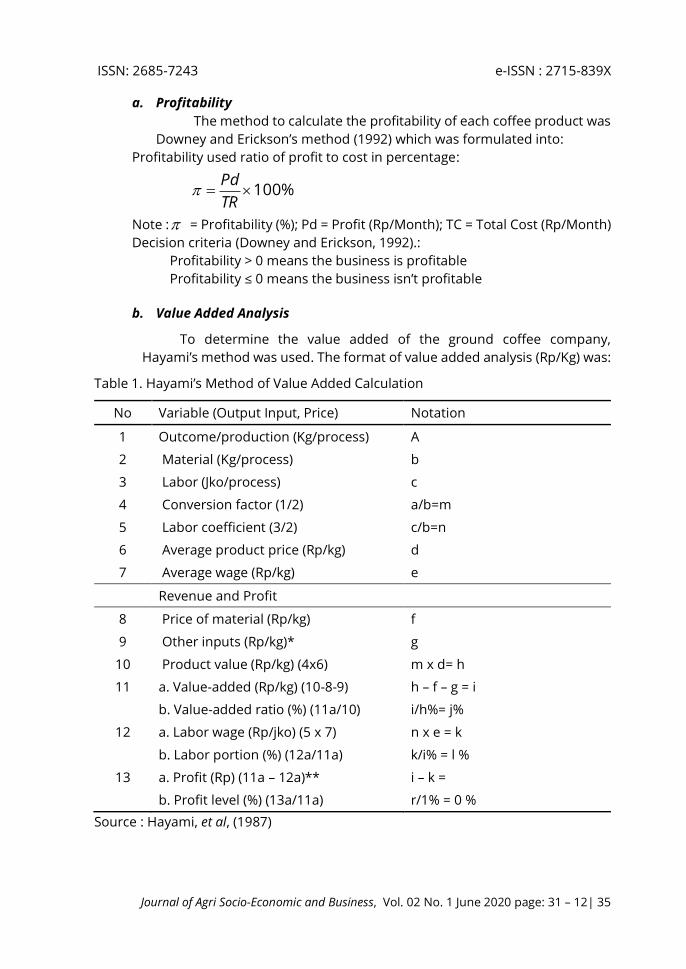
b. Value Added Analysis
To determine the value added of the ground coffee company,
Hayami’s method was used. The format of value added analysis (Rp/Kg) was:
Table 1. Hayami’s Method of Value Added Calculation
No Variable (Output Input, Price) Notation
1 Outcome/production (Kg/process) A
2 Material (Kg/process) b
3 Labor (Jko/process) c
4 Conversion factor (1/2) a/b=m
5 Labor coefficient (3/2) c/b=n
6 Average product price (Rp/kg) d
7 Average wage (Rp/kg) e
Revenue and Profit
8 Price of material (Rp/kg) f
9 Other inputs (Rp/kg)* g
10 Product value (Rp/kg) (4x6) m x d= h
11 a. Value-added (Rp/kg) (10-8-9) h – f – g = i
b. Value-added ratio (%) (11a/10) i/h%= j%
12 a. Labor wage (Rp/jko) (5 x 7) n x e = k
b. Labor portion (%) (12a/11a) k/i% = l %
13 a. Profit (Rp) (11a – 12a)** i – k =
b. Profit level (%) (13a/11a) r/1% = 0 %
Source : Hayami, et al, (1987)
ISSN: 2685-7243 e-ISSN : 2715-839X
36 | Deva Yurita Ambarini; Irnad; Bambang Sumantri; Business Analysis of Robusta ...
According to Hubeis (1997), there are three indicators of value-added ratio:
If NT ratio ˂ 15%, the value-added is low.
If NT ratio 15%-40%, the value-added is moderate.
If NT ratio > 40%, the value-added is high.
c. Analysis of Marketing and Sales Distribution Channels
The marketing channel of “Sintaro” ground coffee could be
determined using descriptive analysis by following the low of “Sintaro”
ground coffee sales from the producer to the customers. The present
study was restricted to customers who performed direct transaction with
the producer to see the amount of “Sintaro” ground coffee which was
distributed from the producer to the customers.
RESULTS AND DISCUSSION
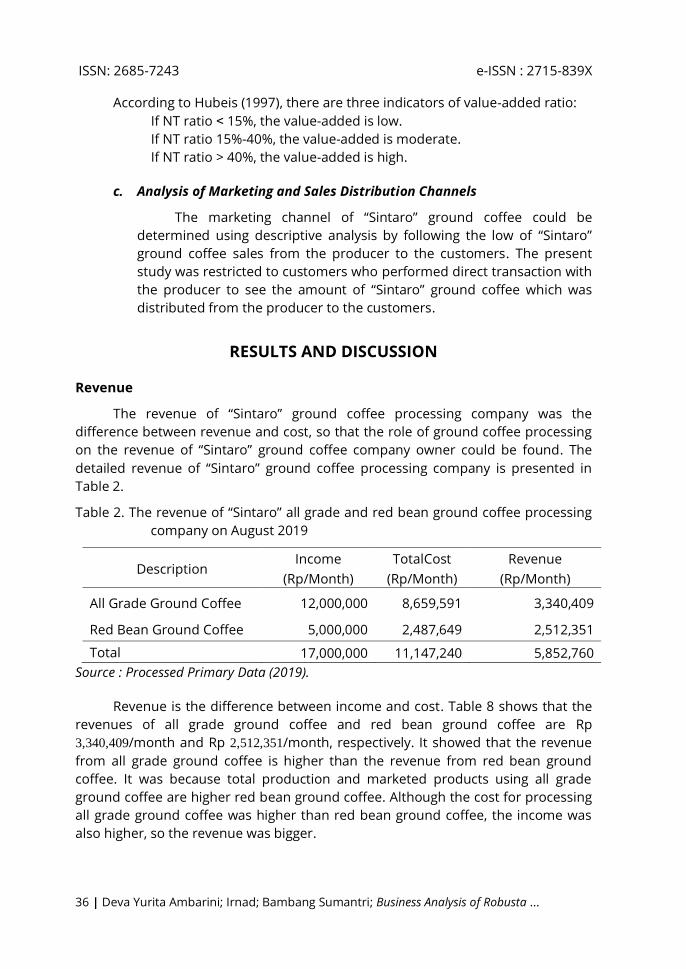
Revenue
The revenue of “Sintaro” ground coffee processing company was the
difference between revenue and cost, so that the role of ground coffee processing
on the revenue of “Sintaro” ground coffee company owner could be found. The
detailed revenue of “Sintaro” ground coffee processing company is presented in
Table 2.
Table 2. The revenue of “Sintaro” all grade and red bean ground coffee processing
company on August 2019
Description Income
(Rp/Month)
TotalCost
(Rp/Month)
Revenue
(Rp/Month)
All Grade Ground Coffee 12,000,000 8,659,591 3,340,409
Red Bean Ground Coffee 5,000,000 2,487,649 2,512,351
Total 17,000,000 11,147,240 5,852,760
Source : Processed Primary Data (2019).
Revenue is the difference between income and cost. Table 8 shows that the
revenues of all grade ground coffee and red bean ground coffee are Rp
3,340,409/month and Rp 2,512,351/month, respectively. It showed that the revenue
from all grade ground coffee is higher than the revenue from red bean ground
coffee. It was because total production and marketed products using all grade
ground coffee are higher red bean ground coffee. Although the cost for processing
all grade ground coffee was higher than red bean ground coffee, the income was
also higher, so the revenue was bigger.
ISSN: 2685-7243 e-ISSN : 2715-839X
Journal of Agri Socio-Economic and Business, Vol. 02 No. 1 June 2020 page: 31 – 12| 37
Analysis of Level of Profitability
Profitability describes a business’ capability to gain net revenue from
expended operational capita or operation/production cost. Business profitability is
measured using total revenue and total cost. The detailed level of profitability of
“Sintaro” ground coffee processing company is shown in Table 3.
Table 3. Level of Profitability of “Sintaro” Ground Coffee Processing Company o
August 2019
No Description Total Revenue
(Rp/Month)
Total Cost
(Rp/Month)
Profitability
(%)
1 All grade ground coffee 2,613 6,154 42
2 Red bean ground coffee 9,071 15,625 58
Source : Processed Primary Data (2019).
The level of profitability is shown in Table 3. All grade ground coffee and red
bean ground coffee had profitability levels of 42 percent/month and 58
percent/month, respectively. The profitability of “Sintaro” red bean ground coffee
was higher than all grade ground coffee. It meant for every Rp. 100 of investment,
Rp. 48 of revenue would be obtained for all grade coffee and dan Rp 52 for red bean
coffee. The total revenue of all grade ground coffee was bigger than red bean ground
coffee, but the profitability of red bean ground coffee was higher. It was because the
selling price of red bean ground coffee was twice the selling price of all grade ground
coffee. So, both ground coffees produced by “Sintaro” were profitable. The higher
the profitability, the better it is for the business because it shows the percentage of
revenue produced by the businessperson.
Value-Added Analysis
Value-added is the difference between product value and accumulated input
cost (material) and contribution of other inputs (additional material and supporting
material). The detailed analysis of the value-added of “Sintaro” “Sintaro” ground
coffee processing company is shown in Table 4.
The values of outputs or all grade and red bean ground coffee products were
Rp. 6,154 and Rp 15,625 per kg, respectively. Product value is obtained from
converting the selling price per kilogram. The value of red bean ground coffee was
higher than all grade ground coffee because the selling price of red bean ground
coffee was higher than all grade ground coffee.
The value-added of processing 1950 kg all grade dried coffee was Rp 2,834/Kg
and the value-added of processing 320 kg red coffee bean into ground coffee was
Rp 9,676/Kg. Value-added is the difference between product value and accumulated
input cost (material) and contribution of other inputs (additional material and
supporting material). The contribution of other inputs was a supporting component

ISSN: 2685-7243 e-ISSN : 2715-839X
38 | Deva Yurita Ambarini; Irnad; Bambang Sumantri; Business Analysis of Robusta ...
of processing. The value-added ration of all grade ground coffee was 46% and the
value-added ratio of red bean ground coffee was 62%. It showed that the processing
of all grade coffee bean and red coffee bean had value-added of 46% and 62% of
product value, respectively. The value-added was gross value-added for “SINTARO”
ground coffee home industry because it wasn’t subtracted by labor contribution.
Labor wages for all grade ground coffee processing was Rp 10,421,- and red bean
ground coffee was Rp 17.021,- in one production month. The wage for all grade
ground coffee was Rp 221,- and red bean ground coffee was Rp 605,- from
multiplying labor coefficient with labor wage.
Table 4. Analysis of Value-Added of “Sintaro” All Grade Ground Coffee and Red
Bean Ground Coffee Processing Company
Variable All Grade
Coffee
Red Bean
Coffee
I. Output Input and Price
Output/total product (Kg/Month) 300 50
Material input (Kg/Month) 1950 320
Labor input (HOK/Month) 41.38 11.38
Conversion Factor (Kg of output/1 Kg of
material) 0.153846154 0.16
Labor Coefficient (HOK/Kg of material) 0.021217949 0.04
Output Price (Rp/Kg) 40,000 100,000
Average Wage of Labor (Rp/Kg) 10,421 17,021
II. Revenue and Profit
Input Price of Material (Rp/Kg) 3,000 4,000
Contribution of Other Inputs (Rp/Kg) 320 1.949
Output Value (Rp/Kg) 6.154 15.625
Value-added (Rp/Kg) 2.834 9.676
Value-added Ratio (%) 46% 62%
Wage of Labor (Rp/Kg) 221 605
Share of Labor (%) 8% 6%
Profit (Rp/Kg) 2,613 9,071
Profit Level (%) 42% 58%
III. Remuneration for production factor
Margin 3,154 11,625
a. Wage of Labor (%) 7% 5%
b. Contribution of Other Inputs (%) 10% 17%
c. Business Profit (%) 87,1% 226%
Source : Processed Primary Data (2019)

ISSN: 2685-7243 e-ISSN : 2715-839X
Journal of Agri Socio-Economic and Business, Vol. 02 No. 1 June 2020 page: 31 – 12| 39
Based on theory, value-added theory which was 15%-40% meant that all grade
and red bean ground coffee processing had high value-added ratio. In other words,,
the effort to optimize or increase the value-added was worthy . The business owner
should expand the market to increase production which is in turn it will increase
profit.
The percentages of labor remuneration to value-added for all grade ground
coffee and red bean ground coffee were 8% and 6%, respectively. The revenues of
Pendapatan all grade ground coffee and red bean ground coffee were Rp 221 per kg
and Rp 605 per kg or 8 percent and 6 percent of product value, respectively. The
revenue was net value-added because it was subtracted by labor remuneration.
The margins of processing all grade coffee bean and red coffee bean into
ground coffee were Rp 3,154 and Rp11,625 which were distributed for labor wage
(7 % and 5 %) and contribution of other inputs (10% and 17%). The high contribution
of other inputs spent by the business owner on red coffee bean processing reduced
the revenue percentage because the fixed cost was high and the production was low,
and the company revenues were 87,1 % and 226 %.
Marketing Analysis
There are several forms of marketing channels for “Sintaro” ground coffee in
and outside of Bengkulu province. The marketing agency involved in marketing the
products was small retailers who distributed the products to the end customers, so
the marketed products reached the end customers quickly.
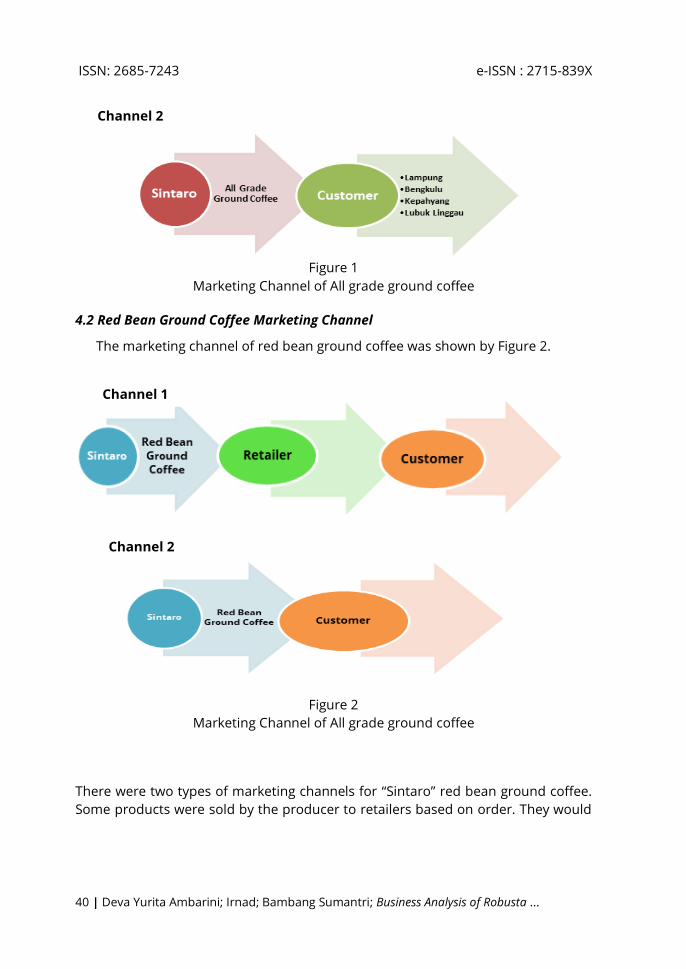
4.1 All Grade Ground Coffee Marketing Channel
The marketing channel of all grade ground coffee was presented by Figure 1.
Channel 1
ISSN: 2685-7243 e-ISSN : 2715-839X
40 | Deva Yurita Ambarini; Irnad; Bambang Sumantri; Business Analysis of Robusta ...
Figure 1
Marketing Channel of All grade ground coffee
4.2 Red Bean Ground Coffee Marketing Channel
The marketing channel of red bean ground coffee was shown by Figure 2.
Figure 2
Marketing Channel of All grade ground coffee
There were two types of marketing channels for “Sintaro” red bean ground coffee.
Some products were sold by the producer to retailers based on order. They would
Channel 2
Channel 1
Channel 2

ISSN: 2685-7243 e-ISSN : 2715-839X
Journal of Agri Socio-Economic and Business, Vol. 02 No. 1 June 2020 page: 31 – 12| 41
be produced after retailer made an order. Other products were directly sold to
customers around the production area.
4.3 All Grade Ground Coffee Marketing Distribution
The study on all grade ground coffee distribution started from producer to
customer who bought “Sintaro” all grade ground coffee. The distribution chain of
“Sintaro” all grade ground coffee from producer to customer is presented in Figure
3.
Figure 6 shows that the biggest marketing distribution was around Kepahiang
Regency, i.e. 106 Kg or 35 %. The smallest marketing was in Lampung, i.e. 37 Kg or
18%. “Sintaro” all grade ground coffee distributed in and out of Bengkulu province
didn’t have any marketing cost because the merchants picked it up at the location or
the buyers paid for it to be delivered to them.
Figure 3.
Distribution Channel of “Sintaro” All Grade Ground Coffee
4.4 Red Bean Ground Coffee Marketing Distribution
The study on red bean ground coffee distribution started from producer to
customer who bought “Sintaro” all grade ground coffee. The distribution chain of
“Sintaro” red bean ground coffee from producer to customer is presented in Figure
4.
Kepahyang;
24%
Bengkulu;
12%Lubuk
Linggau; 36%
Lampung;
28%
ISSN: 2685-7243 e-ISSN : 2715-839X
42 | Deva Yurita Ambarini; Irnad; Bambang Sumantri; Business Analysis of Robusta ...
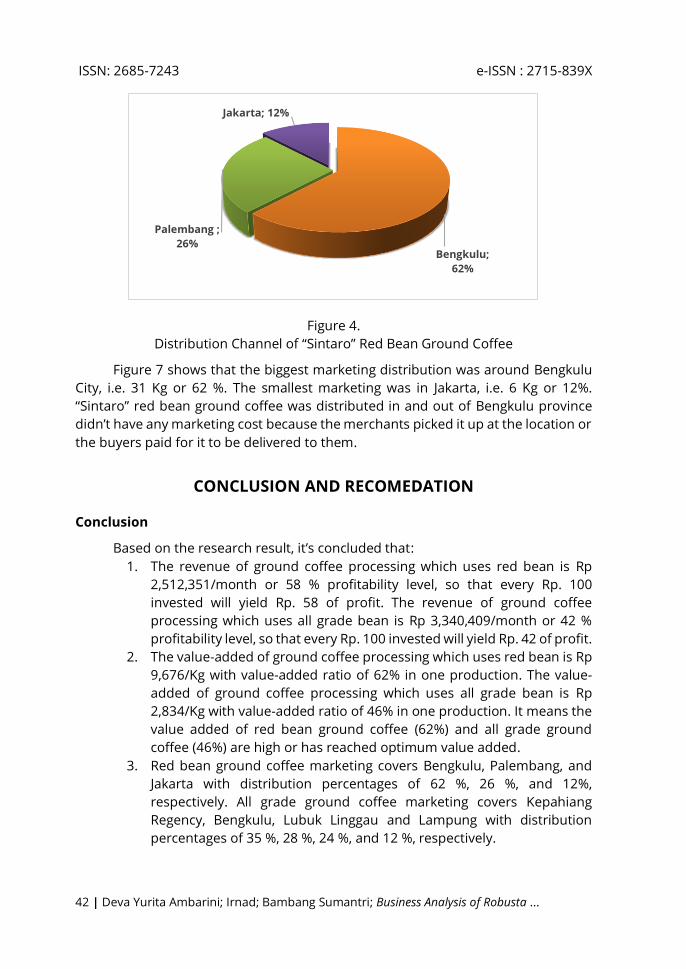
Figure 4.
Distribution Channel of “Sintaro” Red Bean Ground Coffee
Figure 7 shows that the biggest marketing distribution was around Bengkulu
City, i.e. 31 Kg or 62 %. The smallest marketing was in Jakarta, i.e. 6 Kg or 12%.
“Sintaro” red bean ground coffee was distributed in and out of Bengkulu province
didn’t have any marketing cost because the merchants picked it up at the location or
the buyers paid for it to be delivered to them.
CONCLUSION AND RECOMEDATION
Conclusion
Based on the research result, it’s concluded that:
1. The revenue of ground coffee processing which uses red bean is Rp
2,512,351/month or 58 % profitability level, so that every Rp. 100
invested will yield Rp. 58 of profit. The revenue of ground coffee
processing which uses all grade bean is Rp 3,340,409/month or 42 %
profitability level, so that every Rp. 100 invested will yield Rp. 42 of profit.
2. The value-added of ground coffee processing which uses red bean is Rp
9,676/Kg with value-added ratio of 62% in one production. The value-
added of ground coffee processing which uses all grade bean is Rp
2,834/Kg with value-added ratio of 46% in one production. It means the
value added of red bean ground coffee (62%) and all grade ground
coffee (46%) are high or has reached optimum value added.
3. Red bean ground coffee marketing covers Bengkulu, Palembang, and
Jakarta with distribution percentages of 62 %, 26 %, and 12%,
respectively. All grade ground coffee marketing covers Kepahiang
Regency, Bengkulu, Lubuk Linggau and Lampung with distribution
percentages of 35 %, 28 %, 24 %, and 12 %, respectively.
Bengkulu;
62%
Palembang ;
26%
Jakarta; 12%
ISSN: 2685-7243 e-ISSN : 2715-839X
Journal of Agri Socio-Economic and Business, Vol. 02 No. 1 June 2020 page: 31 – 12| 43
Suggestion
1) Sintaro red bean ground coffee processing has higher profitability and
value-added than all grade ground coffee, so the business owner should
increase the production volume of red bean ground coffee.
2) The value-added of Sintaro ground coffee company can be increased for
red bean and all grade ground coffees by minimizing increased selling
price through attractive and innovative packaging.
3) Low ground coffee production which uses red bean is caused by limited
red bean ground coffee marketing. This is because of lack of promotion,
which is only mouth-to-mouth promotion. The business owner of
Sintaro ground coffee company should promote the business through
printed media and social media.
4) The local government through related departments should continue
providing coaching and helping marketing through promotion activities
outside of the region e.g. exhibitions, expos and bazars.
REFERENCES
Agus Supriono. (2011). Cooperative Learning Teori da Aplikasi PAIKEM. Yogyakarta:
Pustaka Pelajar, cet, VI.
BPS Provinsi Bengkulu. 2018. Produk Domestik Regional Bruto Provinsi Bengkulu
Diunduh pada www.bengkulu.bps.go.id, pada tanggal 28 April 2019
Blokland, P. (2003). Introducing farm business analysis. Circular 655, Institute of Food
and Agricultural Sciences, University of Florida
Dewi , Ni Luh Made Indah Murdyani. I. Wayan Budiasa. Ida Ayu Listia Dewi. 2015.
Analisis Finansial Dan Nilai Tambah Pengolahan Kopi Arabika Di Koperasi Tani
Manik Sedana Kabupaten Bangli. Universitas Udayana. Bali. E-Jurnal
Agribisnis Dan Agrowisata Vol.4, No.2, April 2015 .
Hasan, Achmad. 2009. Mesin Pengering produk Pertanian bertenaga Panas Bumi. PT
Mediyatama Sarana Perkasa: Jakarta.
Hayami, Y., Kawagoe, T., Marooka, Y., & Siregar, M. (1987). Agricultural Marketing and
Processing in Upland Java a Perspective From a Sunda Village. Bogor: CPGRT
Centre.
Simons, R., 2000. Performance Measurement & Control Systems for Implementing
Strategy. Prentice-Hall, New Jersey.
Soekartawi. 1993. Teori Ekonomi Produksi: Dengan Pokok Bahasan Analisis Cobb
Douglas. Rajawali Pers. Jakarta.
Soekartawi. 2001. Analisis Usaha Tani. Universitas Indonesia (UIPress). Jakarta .

ISSN: 2685-7243 e-ISSN : 2715-839X
44 | Deva Yurita Ambarini; Irnad; Bambang Sumantri; Business Analysis of Robusta ...
Warsana. 2007. Analisis Efisiensi dan Keuntungan Usahatani Jagung (Studi di Kecamatan
randublatun kabupaten Blora). Magister Ilmu Ekonomi dan Studi
Pembangunan universitas Diponegoro. Semarang
Yurhaya , Rustam Abd. Rauf. 2016. Analisis Profitabilitas Usaha Kopi Bubuk Pada
Industri Bumi Mutiara Di Kota Palu. Program Studi Agribisnis Fakultas
Pertanian Universitas Tadulako, Palu. J. Agroland 23 (2) : Agustus 2016. Hal
149 – 156.
![Expert System in Detecting Coffee Plant Diseases · , known as robusta coffee, accounts for . about 20 percent of Arabica coffee and is different in terms of taste [4]. In 2010, Indonesia](https://img.pdfslide.us/doc/110x75/5ffcf5e0f3f5ed0b4b64564c/expert-system-in-detecting-coffee-plant-diseases-known-as-robusta-coffee-accounts.jpg)