Embed Size (px)
Citation preview
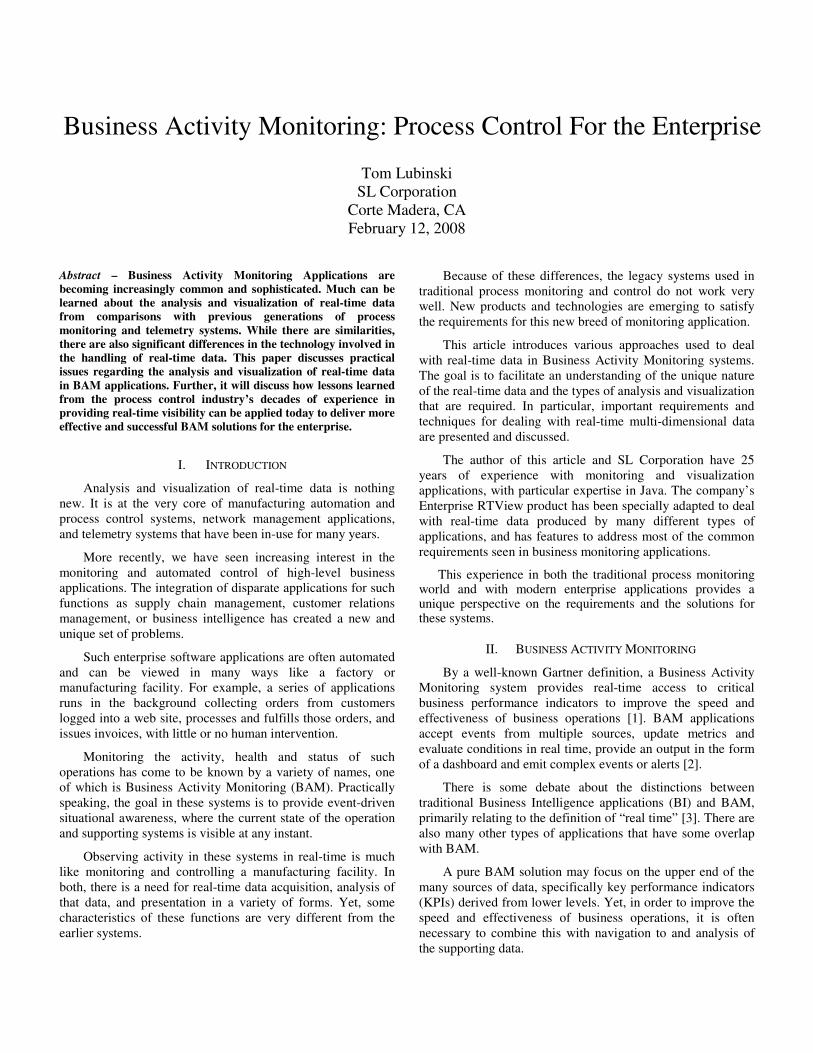
Business Activity Monitoring: Process Control For the Enterprise
Tom Lubinski
SL Corporation
Corte Madera, CA
February 12, 2008
Abstract – Business Activity Monitoring Applications are
becoming increasingly common and sophisticated. Much can be
learned about the analysis and visualization of real-time data
from comparisons with previous generations of process
monitoring and telemetry systems. While there are similarities,
there are also significant differences in the technology involved in
the handling of real-time data. This paper discusses practical
issues regarding the analysis and visualization of real-time data
in BAM applications. Further, it will discuss how lessons learned
from the process control industry’s decades of experience in
providing real-time visibility can be applied today to deliver more
effective and successful BAM solutions for the enterprise.
I. INTRODUCTION
Analysis and visualization of real-time data is nothing
new. It is at the very core of manufacturing automation and
process control systems, network management applications,
and telemetry systems that have been in-use for many years.
More recently, we have seen increasing interest in the
monitoring and automated control of high-level business
applications. The integration of disparate applications for such
functions as supply chain management, customer relations
management, or business intelligence has created a new and
unique set of problems.
Such enterprise software applications are often automated
and can be viewed in many ways like a factory or
manufacturing facility. For example, a series of applications
runs in the background collecting orders from customers
logged into a web site, processes and fulfills those orders, and
issues invoices, with little or no human intervention.
Monitoring the activity, health and status of such
operations has come to be known by a variety of names, one
of which is Business Activity Monitoring (BAM). Practically
speaking, the goal in these systems is to provide event-driven
situational awareness, where the current state of the operation
and supporting systems is visible at any instant.
Observing activity in these systems in real-time is much
like monitoring and controlling a manufacturing facility. In
both, there is a need for real-time data acquisition, analysis of
that data, and presentation in a variety of forms. Yet, some
characteristics of these functions are very different from the
earlier systems.
Because of these differences, the legacy systems used in
traditional process monitoring and control do not work very
well. New products and technologies are emerging to satisfy
the requirements for this new breed of monitoring application.
This article introduces various approaches used to deal
with real-time data in Business Activity Monitoring systems.
The goal is to facilitate an understanding of the unique nature
of the real-time data and the types of analysis and visualization
that are required. In particular, important requirements and
techniques for dealing with real-time multi-dimensional data
are presented and discussed.
The author of this article and SL Corporation have 25
years of experience with monitoring and visualization
applications, with particular expertise in Java. The company’s
Enterprise RTView product has been specially adapted to deal
with real-time data produced by many different types of
applications, and has features to address most of the common
requirements seen in business monitoring applications.
This experience in both the traditional process monitoring world and with modern enterprise applications provides a unique perspective on the requirements and the solutions for these systems.
II. BUSINESS ACTIVITY MONITORING
By a well-known Gartner definition, a Business Activity
Monitoring system provides real-time access to critical
business performance indicators to improve the speed and
effectiveness of business operations [1]. BAM applications
accept events from multiple sources, update metrics and
evaluate conditions in real time, provide an output in the form
of a dashboard and emit complex events or alerts [2].
There is some debate about the distinctions between
traditional Business Intelligence applications (BI) and BAM,
primarily relating to the definition of “real time” [3]. There are
also many other types of applications that have some overlap
with BAM.
A pure BAM solution may focus on the upper end of the
many sources of data, specifically key performance indicators
(KPIs) derived from lower levels. Yet, in order to improve the
speed and effectiveness of business operations, it is often
necessary to combine this with navigation to and analysis of
the supporting data.

2
For this reason and for the purposes of this paper, BAM
could be considered to subsume or include many of the lower
levels of monitoring, sometimes referred to as Business
Services Management (BSM) or Infrastructure Monitoring
(IM). The table below highlights the different levels and
important characteristics of each:
Table 1 - Levels of Monitoring
Level Source Key Performance
Indicators
Business Activity
Monitoring
Custom or Packaged
Applications
# of web site visitors # tickets booked
Sales conversion rate
Business Services
Management
Messaging Middleware, BPM
Engines, Web Services, Custom
Messages sent / sec Message latency
between processes
Infrastructure Monitoring
Components, Processors, Routers, etc.
CPU utilization Available Memory
Network Packets Sent
In general, one could say that real-time data for BAM, in the purest sense, represents the content of the business data exchanged in the supporting processes, such as number of web site visitors or tickets booked. The lower-levels of data, such as number of messages sent, represent information about the health and status of the supporting services or infrastructure.
In many cases, these are, in fact, one and the same. In an on-line web store, the latency in the supporting processes is directly correlated with the number of items sold on that site. If users experience delays, they will go elsewhere. In this situation, a BAM application must analyze and present data from all levels. This is where one might say that BAM subsumes monitoring of the supporting services (BSM).
At each level, the applications involved produce real-time data. These data can be used by the monitoring application to better understand the workings of the system and lead to ways to optimize performance. This is the stated goal of BAM.
III. SOURCES OF REAL-TIME DATA
For decades, monitoring of real-time data was primarily
associated with certain types of applications, such as telemetry
and process control systems. In these applications, individual
components, such as a temperature sensor or a level indicator,
generate measurements at a regular interval which are
transmitted to a central server using standard protocols like
OPC (OLE for Process Control) [5].
A lot of sophisticated technology was developed to
analyze and archive thousands of data “points” so that trends
could be analyzed, alarms generated, and anomalous
conditions detected before they turned into real problems.
Additionally, quality control was facilitated by dynamically
adjusting processes based on real-time measurements.
In contrast to this, the monitoring of business applications
today can be considered quite primitive. Many independently
developed applications support various functions of an
organization, such as customer relations or order processing.
The relational database acts as a cornerstone of enterprise
application development, but numerous stand-alone desktop
applications like spreadsheets complicate the picture. Islands
of independent applications with duplicate data abound.
Tying multiple systems together and automating
interactions of business process applications has become big
business. Many companies offer products that provide
Enterprise Application Integration (EAI) and Business Process
Management (BPM), along with supporting services. These
products typically orchestrate business applications, but do not
provide much real-time monitoring capability.
At the core of many of these systems is Message-Oriented
Middleware (MOM) [6]. Companies like BEA, TIBCO, and
IBM developed messaging systems that transmit structured
packets of data around a network in order to share data
between applications. The Java Message Service (JMS)
emerged as a standard on which most of these systems are
built, and for the first time, supported real-time streams of data
between applications.
In financial services applications, such as program trading, performance is of the utmost importance. New technologies have emerged, improving performance by orders of magnitude over the early MOM systems and providing built-in analytics and complex rule processing. These Complex Event Processing (CEP) [7] systems make more advanced applications, such as automatic fraud detection, possible.
Other sources of real-time data include applications using Java Management Extensions (JMX) [8], an emerging standard for management instrumentation within applications. Relational databases, when polled regularly, can also provide “near” real-time data. Additionally, real-time infrastructure monitoring data are available from systems like Big Brother, and others.
By tapping into these many sources of real-time data, analyzing and presenting the content, it becomes possible to provide a system for Business Activity Monitoring. Each is a rich source of raw data whose content contains a wealth of information about the health and status of a business operation.
IV. MULTI-DIMENSIONAL DATA STRUCTURES
The nature of real-time data obtained in various types of
monitoring systems has changed over the years. Traditional
process control and telemetry systems operate on many
individual data “points,” each with its own timestamp. A
simple example of data from two valves is shown below. Note
that each contains its own timestamp.

3
Table 2 – Example of Individual Data Points
Time Valve 1
7:01 Open
7:02 Open
7:03 Closed
Time Valve 2
7:01 Open
7:02 Closed
7:03 Open
Messaging middleware systems, on the other hand,
evolved around the need to transmit a group of related data
points in a single message. For example, a message between
applications might contain information about a purchase order,
including the purchaser, quantity of goods, price, and other
related information. A typical message consists of a “row”
comprised of a number of individual data fields, along with a
common timestamp for the entire row.
Table 3 – Rows of Structured Data
Timestamp Branch Agent Bookings Cancels Failed
7:05 North Mary 1 0 0
7:05 East Joe 2 1 1
7:10 East Bob 0 1 1
7:15 North Mary 2 2 0
7:15 East Bob 1 1 0
To the developers of enterprise applications, this notion of
a message with multiple fields is obvious. It is just a set of
structured data. Yet, this is very different from the data in
common process monitoring and control applications. As a
consequence, the systems used to collect, transmit, analyze
and archive traditional real-time process data cannot readily be
used in the monitoring of enterprise applications. Much can be
learned and carried forward by studying these systems, but
new techniques must be developed to handle the data.
Another important aspect of the data in business
applications has to do with the nature of the fields in the data.
In the row data example above, the fields can be organized
into time, index, and data columns as follows:
Table 4 – Sample Fields in Categories
Time Index Data
Timestamp Branch Agent Bookings Cancels Failed
All real-time data must contain a timestamp, whether
coming from message streams or from point data.
The message arrives at a specific time or there is a time-
stamp contained in the message indicating when the
measurements took place. This is necessary in order to
perform trend analysis.
The “index” fields are often related to the source of the
data. For example, in a reservations system, these fields might
include the Branch office and the Agent in the branch making
the reservation. In a different application it could be the page
on the web site from which a user placed an order. These are
often the fields by which data are analyzed. For example, in
monitoring the activity of a business web site, one might want
to know how many orders came through each page on the site,
or from each IP address that hit the site.
The “data” fields contain the actual measurements. These
are the values that are stored in the message. Often there can
be more than one value obtained in the same time interval
sample, or grouped together in some other way. For example,
the number of successful bookings made in the last minute and
the number of failed bookings could both be stored in the
same message. These are related but distinct metrics.
Data described in this fashion are referred to as multi-
dimensional. Rather than a single point dimension, there are
several columns of data related by a common timestamp, i.e.,
multiple dimensions. Understanding what is going on in the
business involves “slicing and dicing” the data along these
different dimensions.
The multi-dimensional nature of the data greatly influences how it will be analyzed and visualized.
V. VISUALIZATION
There are some useful parallels between visualization
applications for traditional process monitoring and for BAM
applications. One common requirement in both is to show the
current state of the system, either the business itself, or the
subsystems supporting it.
A. Abstract Nature of BAM Visualization
In traditional process monitoring systems, visualization
often involves the use of mimic diagrams, i.e., displays that
attempt to mimic the actual process or plant being monitored.
These show the current state of each valve or control in the
system, along with measurements like temperatures pressures,
and so on, as in the example below:
Figure 1 - Example of a typical process control mimic diagram

4
In Business Activity Monitoring, the process being
monitored is typically abstract. There is not a boiler or pump
performing some function or sensors that can be represented in
a mimic diagram.
Rather, business processes are software applications
funneling data from one subsystem to another. Such processes
are often represented as “bubbles” or circles, with an icon or
image inside to hint at the nature of the process. Many of these
processes can be chained together, as in the following
diagram:
Figure 2 - Example of a business process diagram
The state of the processes can be represented as values,
colors, or icons on the bubbles. Sometimes, it is the latency
between steps in the process that is of interest, or it is the total
number of orders processed or requests received. Instead of
sensor values being shown, it is a set of calculated values
representing the time difference between process steps. This
information can be shown on the lines connecting the bubbles.
Viewed in this way, the bubble diagrams seen in business
process displays are not unlike the mimic diagrams in
traditional process monitoring systems. The difference is that
the information being shown represents the state of abstract
software processes, not hardware elements.
In fact, there are many parallels between the two types of
systems, which can be highly instructive. One of these relates
to the parameterization of displays. This turns out to be one of
the most challenging and often overlooked issues in
visualization. The most successful process monitoring
products provide good techniques for parameterization.
B. Parameterization
A display used for visualization of real-time data must be
designed with references to data elements whose values will
be shown in the objects on the display. In order for a display to
be used multiple times against different sources of data, those
references need to be indirect, or parameterized.
Parameterization is found in two areas. In one, a
composite graphical object is designed to show several values
that are relevant to a specific process. This object could be
instanced several times on the same diagram, each attached to
a different row of data, uniquely identified by one of the index
columns in the table (a branch office, e.g.). In designing such a
display, the index value that is used to select the right data is
passed as a parameter to the object when it is drawn.
An example of this is shown below. Here information
about each subsystem is summarized in an icon representing
one row of data in a table.
Figure 3 - Object grid showing icons attached to multiple data rows
In a second case, there is a need to drill down to more
detailed data in order to determine what may be causing a
problem shown in a high-level display.
When the user selects an object in a display or a row in a
data table, there needs to be an easily configurable way for the
system to pick up the value of the parameter driving the
selected object, and pass that value down as a parameter to a
new display invoked in the drilldown process. The parameter
is used to show detailed data specific to that selected object.
Figure 4 - Same display showing data from different sources
Support for both of the above scenarios is important in an
effective BAM system. Without the support for
parameterization, multiple copies of a display must be
constructed, each making a specific data reference. In the
drilldown case, much programmer time could be spent writing
code to support the selection and parameterization process if
the tools used do not support parameterized navigation.
It is easy to pop up a trend chart showing data variable(s)
in real-time. How to develop parameterized displays that can
be reused in a variety of situations is the real problem, and is
often overlooked.
VI. PERSISTENCE OF REAL-TIME DATA
Real-time data is transient, that is, it comes in and then it
is gone when the next record comes in. In order to analyze and
present the data in useful ways, each data row must be stored
5
long enough to operate on it or compare it with previous data.
This requires some form of “persistence,” i.e. storage or
archival of the transient data.
Real-time data persistence is often confused with database
archival. A complete persistence implementation must include
archival, but there is a more important function that comes
into play with multi-dimensional data.
A. Current Value Table
Much of the real-time data seen in BAM systems arrives
asynchronously. When an event occurs, a message is sent and
is quickly received and processed. Events coming from
different sources may occur at different times and “out of
sync” with one another.
When multiple rows of real-time multi-dimensional data
arrive asynchronously, there is a problem. For example, if
several branch offices are sending events that register new
orders, there is no easy way to look at the data from all
branches at once. Each data event contains information from
only one branch and is overridden when the next event arrives.
To solve this problem, the system needs to maintain a
“current value table”, indexed by the columns of data that
uniquely identify the source of the data. The index could
consist of a single column, such as the Branch, but it could
also be a combination of multiple columns, like Branch and
Agent. When each data event arrives it is stored in a specific
slot in the current value table. In this way, access is provided
to the latest data for each uniquely indexed record.
Table 5- Example of a current value table
Branch Agent Bookings Cancels Failed
North Mary 4 2 0
North Sam 4 1 0
East Joe 0 2 1
East Bob 1 1 2
East Mary 2 3 1
It is common to archive real-time data to a relational
database (as discussed in next section). However, it is difficult
to maintain a current value table by using a relational
database. It would be necessary to continuously perform a
query against a large set of historical data to determine the
latest value for an individual source.
Instead, the ability to construct a current value table in-
memory is an important feature of a complete BAM solution.
There are numerous requirements that can make the
current value table somewhat complex. For one, objects in the
table must be removed when they are no longer active,
otherwise the table could grow too large in size. There are also
certain applications in which the table must be cleared when
switching to a view of a completely independent subsystem.
Some process monitoring applications, such as LABView
[9], do provide a current value table, primarily to provide
distributed access to current data. The implementation for
BAM applications extends this basic concept to include the
handling of multi-dimensional data.
B. In-Memory Cache
The current value table efficiently provides access to the
last row of data from each indexed source. If it is enhanced to
retain more than just the last row – i.e., some limited set of
prior rows – it can be referred to as an “in-memory cache.”
Like the current value table, the in-memory cache of prior
data must be indexed as well. The length of the cache may be
controlled by specifying either the number of rows, or the time
range for which storage is enabled.
By its nature, real-time data is time-series data. This
denotes a sequence of measurements that are ordered in time.
Analysis of such data is performed by plotting the data over
time.
A good in-memory cache system provides efficient access
to a rolling time window of stored time-series data. This is
essential for performing analytics on the data in real-time, e.g.,
the detection of short-term anomalous changes in trends in
order to alert operators to potential problems.
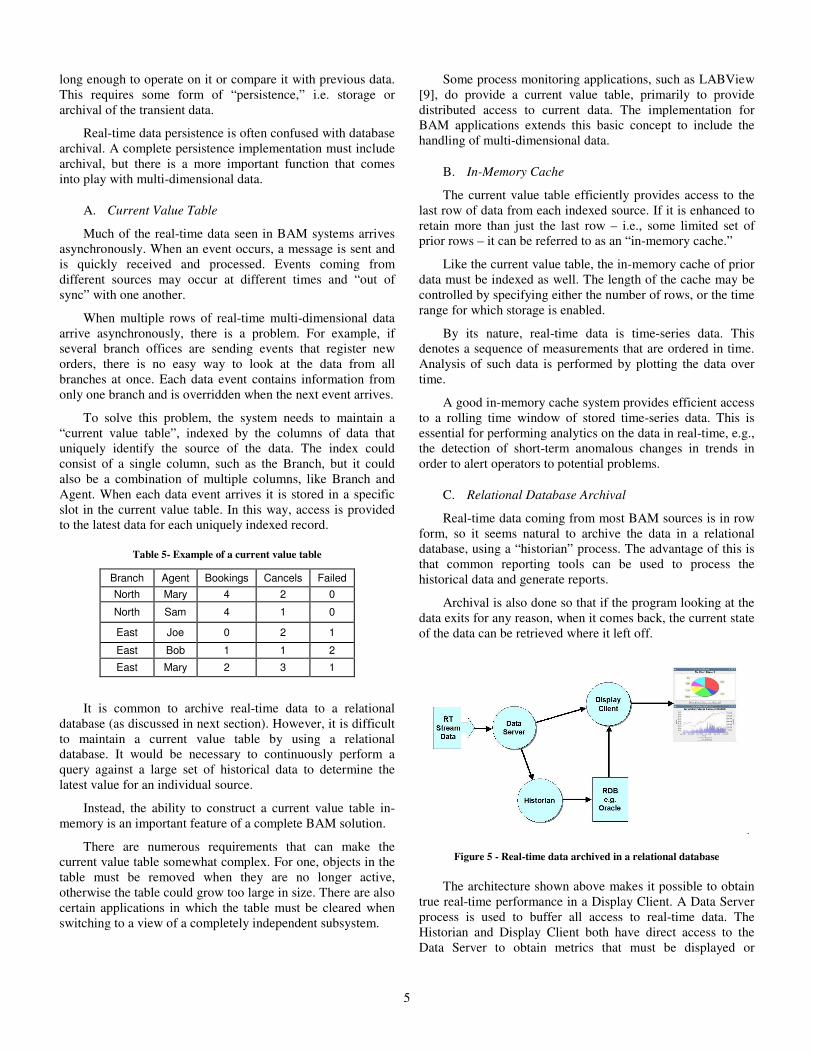
C. Relational Database Archival
Real-time data coming from most BAM sources is in row
form, so it seems natural to archive the data in a relational
database, using a “historian” process. The advantage of this is
that common reporting tools can be used to process the
historical data and generate reports.
Archival is also done so that if the program looking at the
data exits for any reason, when it comes back, the current state
of the data can be retrieved where it left off.
Figure 5 - Real-time data archived in a relational database
The architecture shown above makes it possible to obtain
true real-time performance in a Display Client. A Data Server
process is used to buffer all access to real-time data. The
Historian and Display Client both have direct access to the
Data Server to obtain metrics that must be displayed or

6
archived. The Display Client can obtain archived historical
data by making SQL queries from the database.
The in-memory cache provides efficient access to short-
term data for analysis, while the database provides access to
long-term data for analysis involving longer periods.
One problem with this approach is that relational
databases only partially share the definition of the SQL
language. It is not possible to perform time-range aggregations
on historical data in a way that is portable across all databases.
This is another reason for the use of an in-memory cache to
perform such functions.
A variation on this is to make use of an OLAP database,
especially one that performs time-series functions in-memory.
These provide more sophisticated functions for handling time-
series data. One drawback is that the syntax for OLAP queries
and configuring cubes is too complicated for most users.
There are very few OLAP developers compared to SQL
developers.
D. Special-Purpose Historian Databases
In traditional real-time process monitoring applications,
archival is an established and evolved technology. A number
of companies provide special-purpose historian products that
specialize in the archival of time-series data. For example, the
OSISoft PI System [10] is one of the most commonly used
historian databases found in many process control
applications. AspenTech produces a similar product [11].
A common feature of these systems is the ability to
compress many data points into a single record if the value of
the data point is unchanged. Additional options are provided to
average out the data primarily to reduce the amount of
memory that is required to store large amounts of such data.
The real-time data seen in BAM applications is typically
multi-dimensional. The traditional process control historians
deal with single point data. This introduces a complexity that
makes them difficult to use. Multiple related measures need to
be stored together in a single record. The point database does
not provide an easy way to do this. As a result, none of these
products has emerged to achieve real penetration in this area.
One product that has seen some penetration in BAM is an
open source product called the Round Robin Database, or
RRDtool [12]. The RRD product also compresses data over
time. The simplicity in the way it does this has made it a
viable option in some situations. However, it is point-based as
well.
Traditional process historians, such as the PI System,
have been used for years in mission-critical applications. A
full-featured BAM system must include important capabilities
found to be essential in these established systems, but must
also include support for more complex multi-dimensional data.
VII. ANALYSIS
Analysis and visualization of real-time data are highly
related, as analysis performed on incoming real-time data is
often part of a visualization process.
Analysis is often thought of as averages, totals, least-
squares trend, and the like. These are essential analytic
functions and are commonly used. It is easy to put these in
place, but BAM requires another type of function entirely.
Rather than mathematical analysis of the trends in the data,
much useful information can be extracted using simple
aggregation and breakdown functions.
The suggestion has been made that BAM is best served by
the capabilities of a Complex Event Processing engine. There
are valid use cases for a CEP solution, but these appear to be
in the higher strata of application complexity, such as
detection of fraudulent activities, involving complex time-
based relationships and determinations.
In practice, it has been found that the optimal solution for
BAM analysis and visualization is a tight coupling between
the analytic functions and the graphical objects used to present
the results. The functions provide aggregation and breakdown
of multi-dimensional data and the properties of the graphical
objects directly display the results of the analysis.
The analytic functions are essentially transformations of
tabular data from one form to another. A large percentage of
the requirements in BAM applications are served by a set of
aggregation and breakdown functions in various forms.
For example, an incoming stream of car reservation data
is stored in an in-memory cache. All the data are available in
a time-series table structure. A built-in time-range aggregation
function can be used to transform that table of data into a
smaller one breaking down the number of reservations made
each day by each reservation agent. The resulting table is fed
directly to a bar chart, which displays that important
information to users.
Figure 6 - Bar chart showing breakdown in two dimensions
7
The advantage of this approach is to greatly reduce or
even eliminate any programming involved in the development
of a sophisticated BAM application. A collection of analysis
and visualization patterns is provided. Most of the cases
encountered are variations on these patterns. It is simply a
matter of specifying a different source for the data.
Some of the common patterns that have been encountered
are briefly illustrated below. There are many others, but these
are representative.
A. Aggregation and Breakdown – Group By
Just like a SQL Group By, these patterns operate on data
tables containing multiple index columns, aggregating the data
in various ways. Users can do sum, average, min, max, etc.
over all the elements that belong to a certain index column or
set of indexes.
There are a number of variations on this pattern
depending on the number of dimensions in the index columns
and the type of object used to display the data (bar chart, table,
area graph, map, etc). A simple one-dimensional pattern is
shown below in which the total number of hits on a URL is
broken down by incoming IP address.
Figure 7 - Breakdown of message counts by IP address
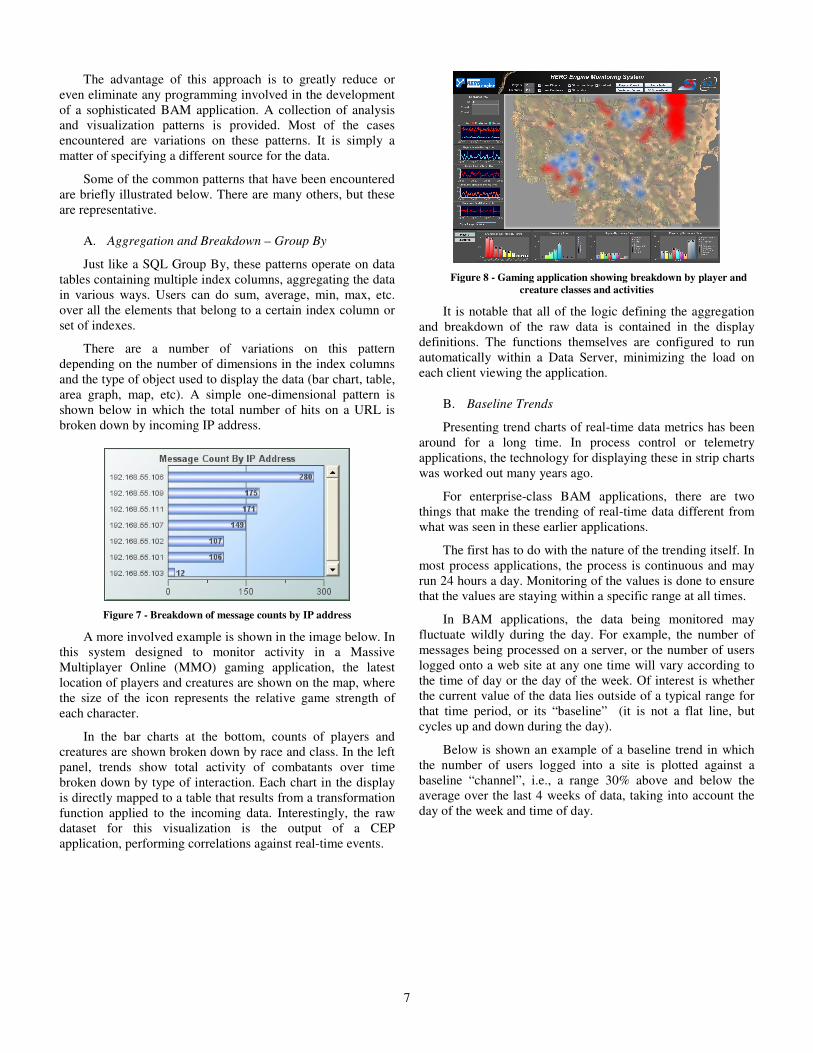
A more involved example is shown in the image below. In
this system designed to monitor activity in a Massive
Multiplayer Online (MMO) gaming application, the latest
location of players and creatures are shown on the map, where
the size of the icon represents the relative game strength of
each character.
In the bar charts at the bottom, counts of players and
creatures are shown broken down by race and class. In the left
panel, trends show total activity of combatants over time
broken down by type of interaction. Each chart in the display
is directly mapped to a table that results from a transformation
function applied to the incoming data. Interestingly, the raw
dataset for this visualization is the output of a CEP
application, performing correlations against real-time events.
Figure 8 - Gaming application showing breakdown by player and
creature classes and activities
It is notable that all of the logic defining the aggregation
and breakdown of the raw data is contained in the display
definitions. The functions themselves are configured to run
automatically within a Data Server, minimizing the load on
each client viewing the application.
B. Baseline Trends
Presenting trend charts of real-time data metrics has been
around for a long time. In process control or telemetry
applications, the technology for displaying these in strip charts
was worked out many years ago.
For enterprise-class BAM applications, there are two
things that make the trending of real-time data different from
what was seen in these earlier applications.
The first has to do with the nature of the trending itself. In
most process applications, the process is continuous and may
run 24 hours a day. Monitoring of the values is done to ensure
that the values are staying within a specific range at all times.
In BAM applications, the data being monitored may
fluctuate wildly during the day. For example, the number of
messages being processed on a server, or the number of users
logged onto a web site at any one time will vary according to
the time of day or the day of the week. Of interest is whether
the current value of the data lies outside of a typical range for
that time period, or its “baseline” (it is not a flat line, but
cycles up and down during the day).
Below is shown an example of a baseline trend in which
the number of users logged into a site is plotted against a
baseline “channel”, i.e., a range 30% above and below the
average over the last 4 weeks of data, taking into account the
day of the week and time of day.

8
Figure 9 - Example of a baseline trend comparison
The use of a baseline channel is one of the most important
ways that real-time business-related data is visualized in a
useful manner. Alerts can be configured to fire only when the
value of interest goes outside of the baseline channel.
Another area in which real-time business data is unique is
in the importance of aggregation along dimensional lines as
applied to trends. For example, a system might consist of eight
servers processing purchase orders, and you are interested in
analyzing the system to provide the best possible response
time for users. In this case, it is the total of all messages sent
across all servers that is important, not just the total on one
server. Automating this process of aggregation along different
dimensions, and permitting the user to select all or just one of
the servers is an important feature of any business-related
metrics monitoring system.
VIII. CONCLUSION
Historically, there has been an interesting evolution in the
nature of real-time data obtained in various types of
monitoring systems.
Traditional process monitoring and control systems deal
primarily with point-based data. Business Activity Monitoring
applications obtain data from messaging middleware and other
structured real-time data sources, introducing complexities in
the analysis and archival of these data. However, many of the
requirements for analysis and visualization are similar in both
systems.
Important lessons can be taken from traditional process
monitoring systems, as these systems have proven themselves
in a multitude of mission-critical applications. New
technology must be developed to address the requirements of
the new breed of BAM application, but companies that have
experience in these traditional applications have a leg up on
those starting from scratch.
It is often tempting to consider building a Business
Activity Monitoring application in-house, but given the wide
range and depth of features required, this should be given
careful thought. Specific requirements for handling real-time
data are often overlooked. Applications that make simplistic
assumptions about how to analyze and present data quickly
become unwieldy and difficult to maintain and enhance.
Techniques for the in-memory persistence and database
archival of real-time data are evolving. Current systems use
standard relational databases but are slowly evolving into
systems designed specifically for handling real-time multi-
dimensional data. In some cases, legacy database systems are
adapted to deal with faster real-time data. While this works to
some extent, dealing with real-time data is difficult in older
environments.
Techniques for analysis are also evolving, starting with standard SQL and attempts at applying stream processing. In practice, it has been found that most requirements are met by a standard set of transformation functions that operate on time-series multi-dimensional cached data.
In summary, to make BAM effective, real-time data must be dealt with efficiently. Relevant information must be extracted from real-time data streams, analyzed, and presented to a variety of users, typically in web-based dashboards or via alerts. Many lessons can be learned from earlier process monitoring applications dealing with real-time mission-critical data.
The important principles involved in developing a successful BAM solution are not dissimilar from those of process monitoring applications that have been established through decades of use, but with a new twist. One could almost think of BAM as a form of “process control for the enterprise”. It is clear that a combination of both old and new technologies is required to address the requirements for analysis and visualization of real-time data in a full-featured Business Activity Monitoring application.
REFERENCES
[1] McCoy, David – Business Activity Monitoring, ID Number: LE-15-9727, 1 April 2002
[2] Gassman, Bill – Guide to Process-Centric BI Terms, Gartner Research, ID Number: G00151682, 21 September 2007
[3] Kemsley, Sandy – Blog on Technology in Business, http://www.intelligententerprise.com/blog/archives/2007/09/gartner_bpm_day_1.html, September 18, 2007
[4] Schulte, Roy - "The Business Impact of Event Processing: Why Mainstream Companies Will Soon Use A Lot More EDA,", SCW, p. 51, IEEE Services Computing Workshops (SCW'06), 2006
[5] Iwanitz, Frank and Lange, Jurgen – OPC – Fundamentals, Implementation, and Application, Huthig Fachverlag, 2006
[6] Defining Technology, Inc - Middleware Resource Center – www.middleware.org, 2008
[7] Luckham, David – The Power of Events: An Introduction to Complex Event Processing in Distributed Systems, Addison-Wesley, 2002
[8] SUN – Java Management Extensions (JMX) - Best Practices, 2007
[9] National Instruments – A Current Value Table for LABView, http://zone.ni.com/devzone/cda/tut/p/id/6108, 2008
[10] OISsoft - PI System Data Sheet, www.osisoft.com, 2008
[11] AspenTech – Real-Time Data Historian Data Sheet, www.aspentech.com, 2008
[12] Oetiker, Tobias – RRDtool Documentation, http://oss.oetiker.ch/rrdtool, 2008

9