Embed Size (px)
Citation preview
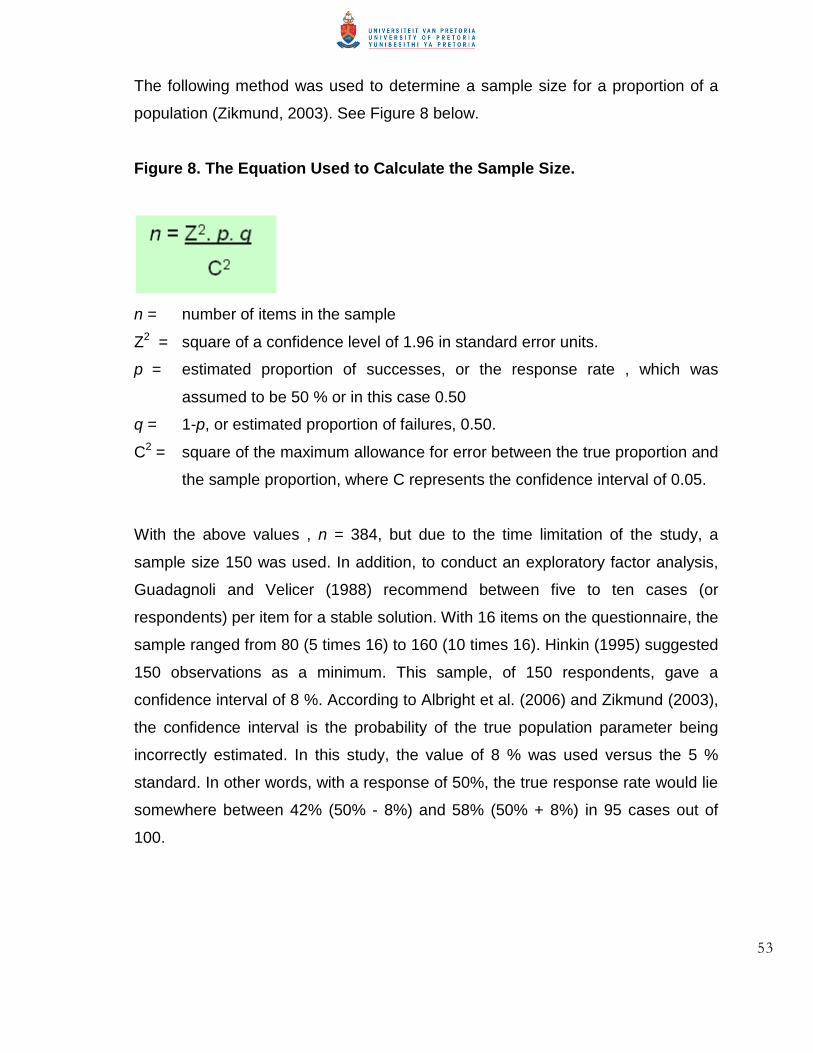
Business activities at the base of the pyramid (BOP) in South Africa
Kamlesh C Vasanjee 29612277
A research project submitted to the Gordon Institute of Business Science
University of Pretoria in partial fulfilment of the requirements for the degree
of Master of Business Administration
10 November 2010
copycopy UUnniivveerrssiittyy ooff PPrreettoorriiaa
ii
ABSTRACT
This research was designed to provide insight into South African financial
companiesrsquo activities among the poor or the BOP (Base Of the Pyramid) South
African businesses should build resources and capabilities with a strategic intent
to create and exploit the traditionally under serviced markets while delivering
goods and services that are of value In doing so managers marketers and
business leaders should view the South African adult population as households
and not individual decision makers
The aim of this study was to determine the applicability of an equal partnership
model for the BOP engagement in the South African economy In the investigation
of the equal partnership model it was found that the participants (including the
BOP as producers or consumers business local community members non-
governmental organisations and local government) could derive mutual value This
mutual value can be described as the enhancement in growth for the business
raising the BOP out of poverty involving the poor in the economy and boosting
national economic growth (through job creation tax revenue and investment)
Findings of this research supported the aspects of resource commitment
experiential preparation innovation and technology use in product or services
together with mutual value creation for all partners (especially the poor) In
addition there was support for the different levels of risk taken by the partners
responsibilities expected from participants the sustainability of the collaboration
and the required depth of understanding of BOP circumstances
Bank managers responded positively to there being value at the level of the poor
(such as profits poverty alleviation and improved reputation) The collectivist
nature of the poor in South Africa (in that the poor carry out financial decisions at
the household level) was not established in this research and needs further
investigation
iii
KEYWORDS BOP market equal partnership model mutual value creation poverty alleviation
iv
DECLARATION
I declare that this research project is my own work It is submitted in partial
fulfilment of the requirements for the degree of Master of Business Administration
at the Gordon Institute of Business Science University of Pretoria It has not been
submitted before for any degree or examination in any other university I further
declare that I have obtained the necessary authorisation and consent to carry out
this research
KAMLESH C VASANJEE _____________________ 10 NOVEMBER 2010
v
ACKNOWLEDGMENTS
I would like to express my sincere gratitude to the following
Sharita Thank you for your love and support for the last two years You were
patient and unselfish This was a joint effort and only possible with your help and
persistence
Umi Girish and Rakhi For tolerating us for the last two years when we were in
town We enjoyed the visits and hope you did too
Dr Clive Corder It has been an honour working with you as a supervisor Your
precious time and guidance is wholly appreciated
Ellie You always guided and helped when you could Thanks for the one-on-ones
especially when the wheel of pain kicked in
Lucian For holding the fort and picking up the pieces when things went bad It all
paid off in the end
Adriaan It was great having you around during this period with all your energy and
skill
Teddy Your little chat and idea led to this study Thank You
Ilona Kabira Sumaya Hennie Bheki colleagues at work and GIBS Your
encouragement ideas and support during the hard times assisted tremendously
vi
TABLE OF CONTENTS
CHAPTER 1 PROBLEM DEFINITION 1
11 RESEARCH PROBLEM 1 111 The BOP 1 112 Corporate Sustainability Poverty alleviation and Profit 2 12 SIGNIFICANCE OF STUDY 3 13 RESEARCH OBJECTIVES 4 14 SCOPE OF RESEARCH 5
CHAPTER 2 LITERATURE REVIEW 6
21 MARKETING STRATEGY AND AWARENESS 6 211 Awareness 6 212 The BOP Market 7 22 CORPORATE RESPONSIBILITY 7 221 Corporate Responsibility Corporate Social Responsibility and Corporate
Sustainability 8 222 Triple Bottom Line 9 223 Poverty Alleviation 10 23 MIND-SET SHIFT 12 24 IS THERE REALLY A FORTUNE AT THE BOP 12 25 BOP CHARACTERISTICS 14 251 BOP in the world 16 252 BOP 1 and BOP 2 17 253 Urban BOP 18 254 Poverty Factors and Forces 18 255 Valuing and Quantifying the BOP 20 256 BOP and the living Standard measure (LSM) 22 26 POVERTY REDUCTION- A MARKET BASED APPROACH 25 261 Managerial demands 26 262 Marketers and the BOP 27 263 Partnerships 29 27 EXAMPLES OF ENGAGING THE BOP 32 28 MODELS FOR WORKING WITH THE BOP 36 29 CONCLUSION 39
CHAPTER 3 RESEARCH PROPOSITIONS 43
31 COLLECTIVISM 43
vii
311 Proposition 311 43 32 BANK ACTIVITIES 43 321 Proposition 321 44 322 Proposition 322 44 323 Proposition 323 45 324 Proposition 324 45 325 Proposition 325 45 326 Proposition 326 45
CHAPTER 4 RESEARCH METHODOLOGY 46
41 RESEARCH CLASSIFICATION 46 42 RESEARCH DESIGN 47 43 DATA GATHERING PROCESS 47 44 QUESTIONNAIRE DESIGN 48 441 Pre-testing of the Questionnaire 49 442 Scale 49 45 UNIT OF MEASURE 51 46 POPULATION 51 47 SAMPLING METHOD AND SIZE 52 48 ANALYSIS APPROACH 54 481 Capturing of Data 54 482 Descriptive Statistics 55 483 Multivariate Analysis 55 49 LIMITATIONS OF THE STUDY 56
CHAPTER 5 RESULTS 58
51 INTRODUCTION 58 52 RESPONSE RATE AND DEMOGRAPHICS 58 53 EVALUATION OF PROPOSITIONS 59 531 Proposition 311 59 532 Proposition 321 60 533 Proposition 322 61 534 Proposition 323 62 535 Proposition 324 63 536 Proposition 325 64 537 Proposition 326 64 538 BOP as a profitable market 65
viii
54 RELATIONSHIPS BETWEEN THE ATTRIBUTES 66 55 METRIC MULTI-DIMENSIONAL SCALING (MMDS) 67 56 FACTOR ANALYSIS 67 57 RELIABILITY 71 58 DIFFERENCES BETWEEN GROUPS 73
CHAPTER 6 DISCUSSION 75
61 BANK ACTIVITIES 75 611 The poor in South Africa demonstrate collectivism in their economic activities and
are recognised as households and not individuals in developing partnerships
with a bank 76 612 Banks or branches need to commit long-term resources to a partnership at the
level of the poor 77 613 Banks need to experiment with different business models and prepare well before
going into an equal partnership venture with the poor 78 614 For a partnership venture with the poor there should be value created for the
bank at multiple levels such as increased profitability and improved reputation 80
615 There needs to be innovation by the bank in a simple technology new process or innovative product or service for a partnership with the poor 81
616 There is high financial risk for the bank in investing in the poor 81 617 The business or partnership with the bank should be economically and
environmentally sustainable for alleviation of poverty and careful use of
scarce resources These scarce resources required by the poor are money
electricity clean water and other raw materials 82 618 The BOP as a profitable market 83 62 UNDERLYING PERCEPTUAL DIMENSIONS 84 621 Enhancing stakeholder value 84 622 Customising solutions 86 623 Public perception 87 624 Financial risk 88 625 A profitable market 89 63 GROUP RESPONSES 89 631 Gender comparison 90 632 Age group comparison 90 633 Bank comparison 90 634 Race comparisons 91
ix
64 SUMMARY 91
CHAPTER 7 CONCLUSIONS AND RECOMMENDATIONS 93
71 KEY FINDINGS 93 72 RECOMMENDATIONS 95 73 IMPLICATIONS FOR FUTURE RESEARCH 96 74 LIMITATIONS OF RESEARCH 97
REFERENCE LIST 98
APPENDIX 1 EXAMPLES OF INVOLVING THE BOP IN THE ECONOMY 107
APPENDIX 2 THE CORNELL UNIVERSITY BOP PROTOCOL PROCESS 108
APPENDIX 3 THE INFORMED CONSENT LETTER AND STRUCTURED
QUESTIONNAIRE 113
APPENDIX 4 DESCRIPTIVE STATISTICS 119
APPENDIX 5 MULTIVARIATE STATISTICS 124
x
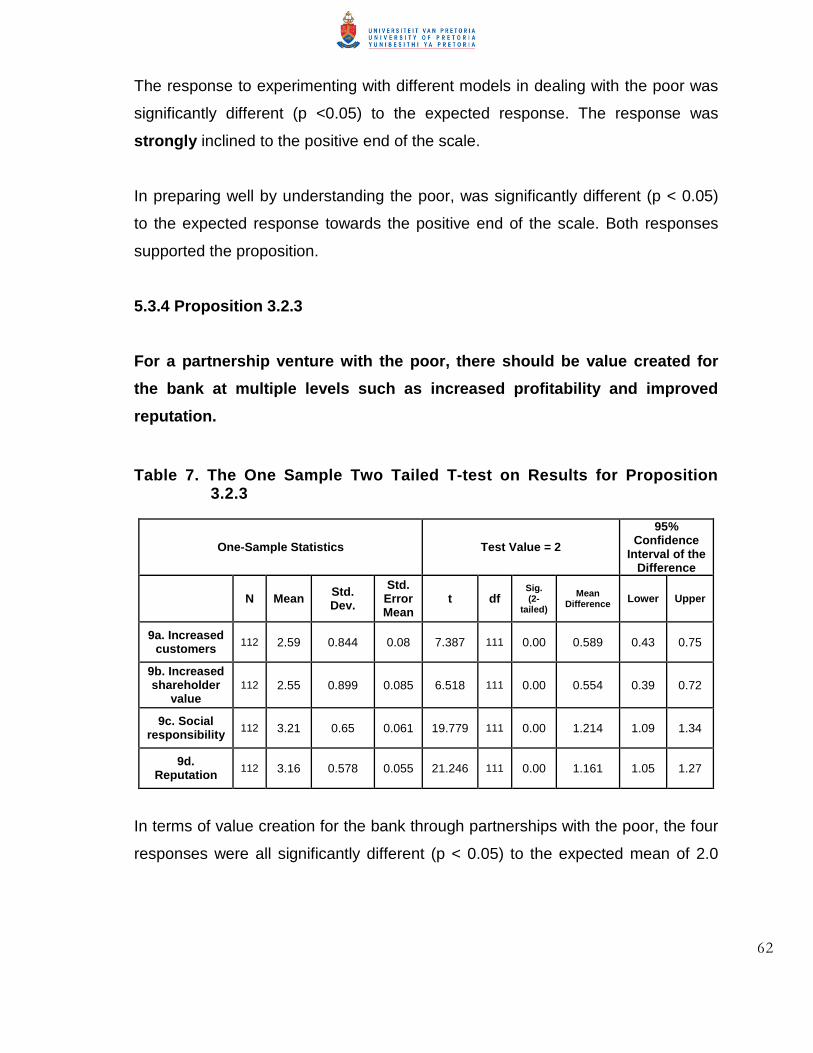
LIST OF TABLES 1 MIND-SET CHANGES REQUIRED FOR MANAGERS AND LEADERS TO INCLUDE THE BOP IN THE
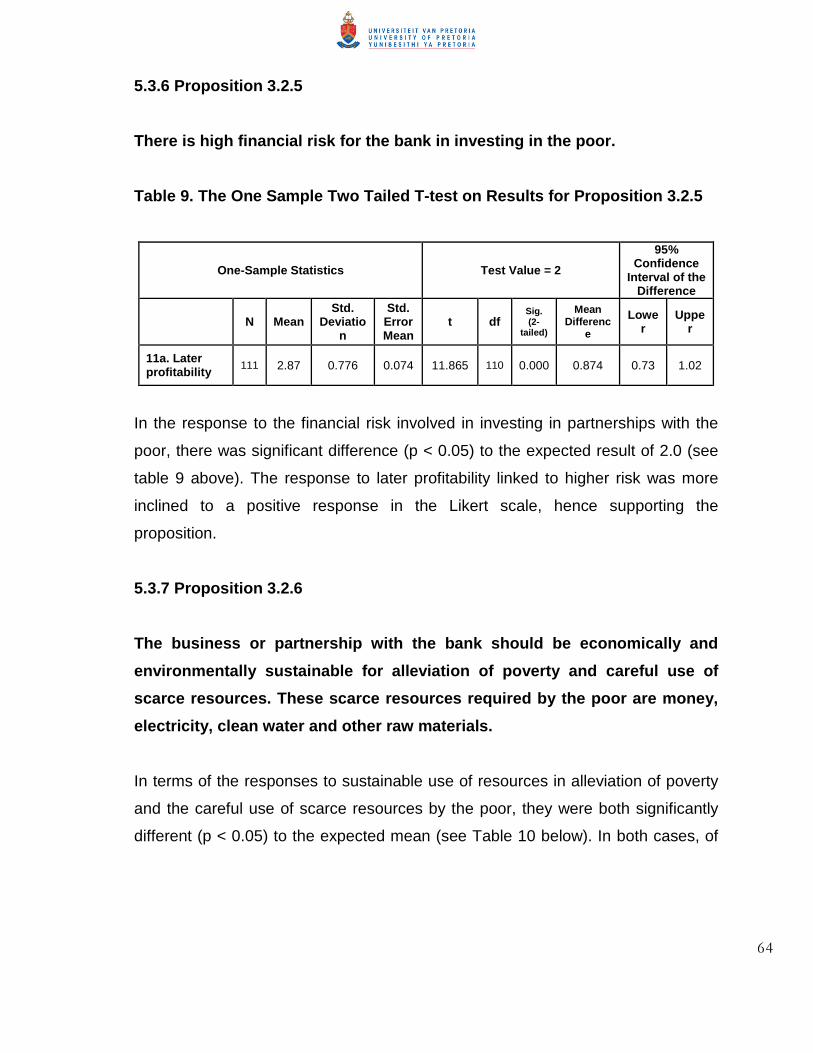
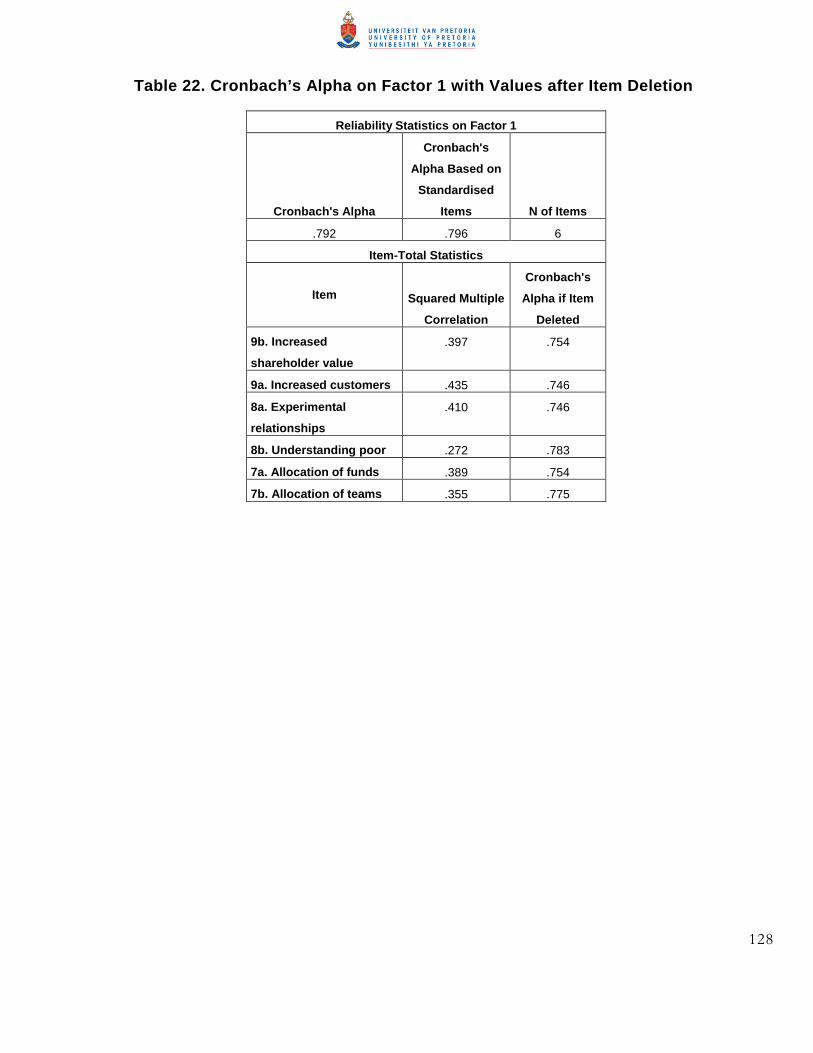
ECONOMY (PRAHALAD 2002) 13 2 THE SOUTH AFRICAN PYRAMID DEFINED (SOURCE CHIP amp CORDER 2010A) 26 3 A SUMMARY OF MAJOR FINDINGS RELATED TO DOING BUSINESS WITH THE BOP 33 4 THE ONE SAMPLE TWO TAILED T-TEST ON RESULTS FOR PROPOSITION 311 60 5 THE ONE SAMPLE TWO TAILED T-TEST ON RESULTS FOR PROPOSITION 321 61 6 THE ONE SAMPLE TWO TAILED T-TEST ON RESULTS FOR PROPOSITION 322 61 7 THE ONE SAMPLE TWO TAILED T-TEST ON RESULTS FOR PROPOSITION 323 62 8 THE ONE SAMPLE TWO TAILED T-TEST ON RESULTS FOR PROPOSITION 324 63 9 THE ONE SAMPLE TWO TAILED T-TEST ON RESULTS FOR PROPOSITION 325 64 10 THE ONE SAMPLE TWO TAILED T-TEST ON RESULTS FOR PROPOSITION 326 65 11 THE ONE SAMPLE TWO TAILED T-TEST ON RESULTS FOR THE BOP AS A PROFITABLE MARKET 65 12 FACTOR VARIANCE AS DETERMINED BY EIGENVALUES 68 13 DESCRIPTIVE STATISTICS ON GENDER 119 14 DESCRIPTIVE STATISTICS ON RACE 120 15 DESCRIPTIVE STATISTICS ON AGE GROUPS 121 16 DESCRIPTIVE STATISTICS ON BANKS 122 17 DESCRIPTIVE STATISTICS ON TYPE OF BANKING 123 18 ONE SAMPLE TWO TAILED T-TEST RESULTS 124 19 CORRELATIONS OF THE BANKS PARTNERSHIP WITH THE POOR 125 20 ADJUSTED CORRELATIONS WITH FACTORS SUBTRACTED FROM ONE ndash (SMALLER VALUES
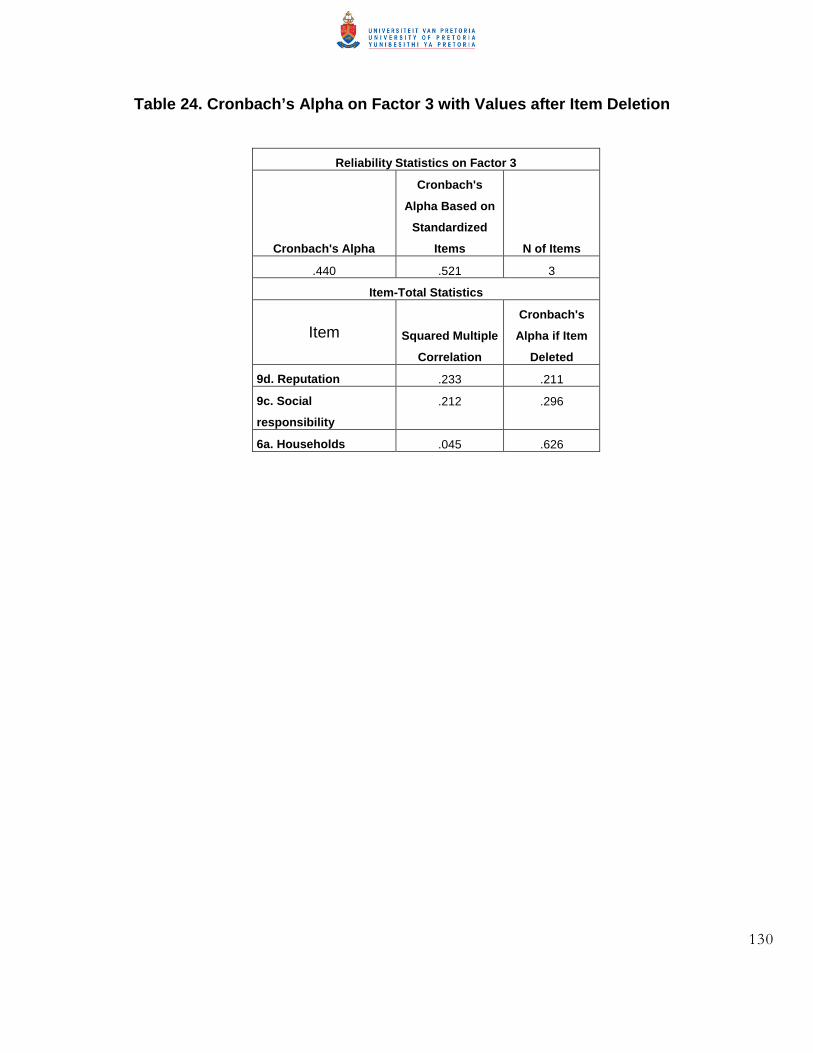
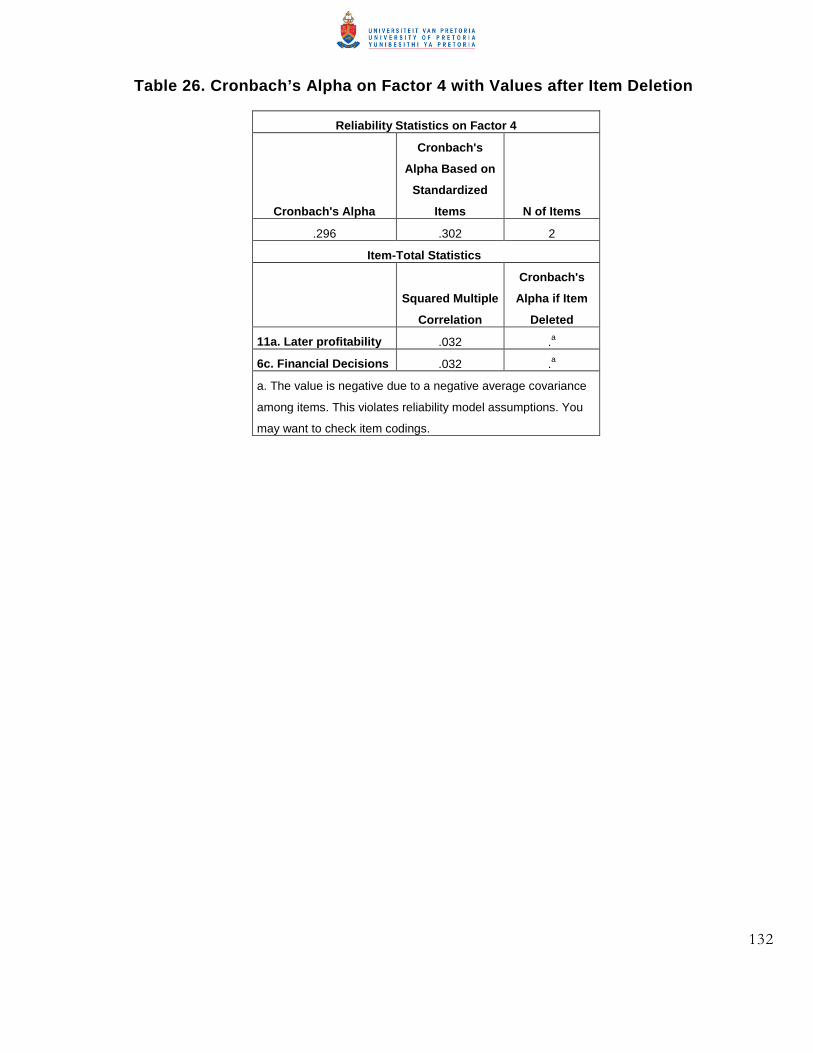
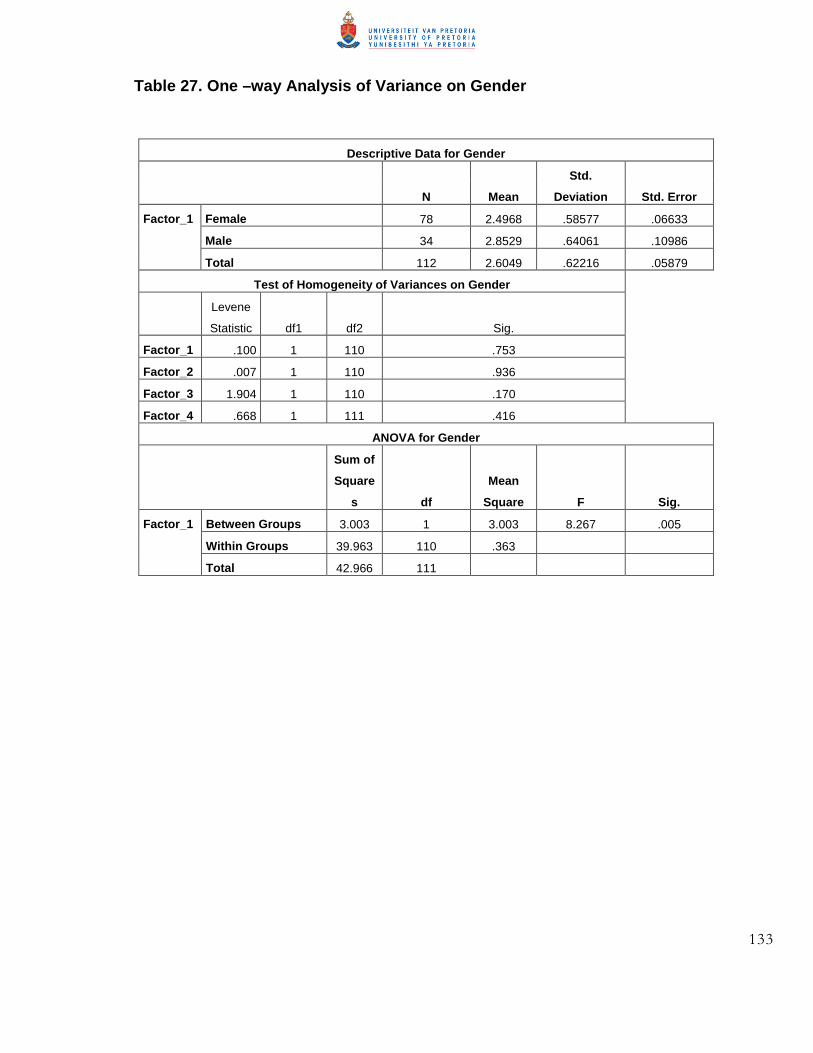
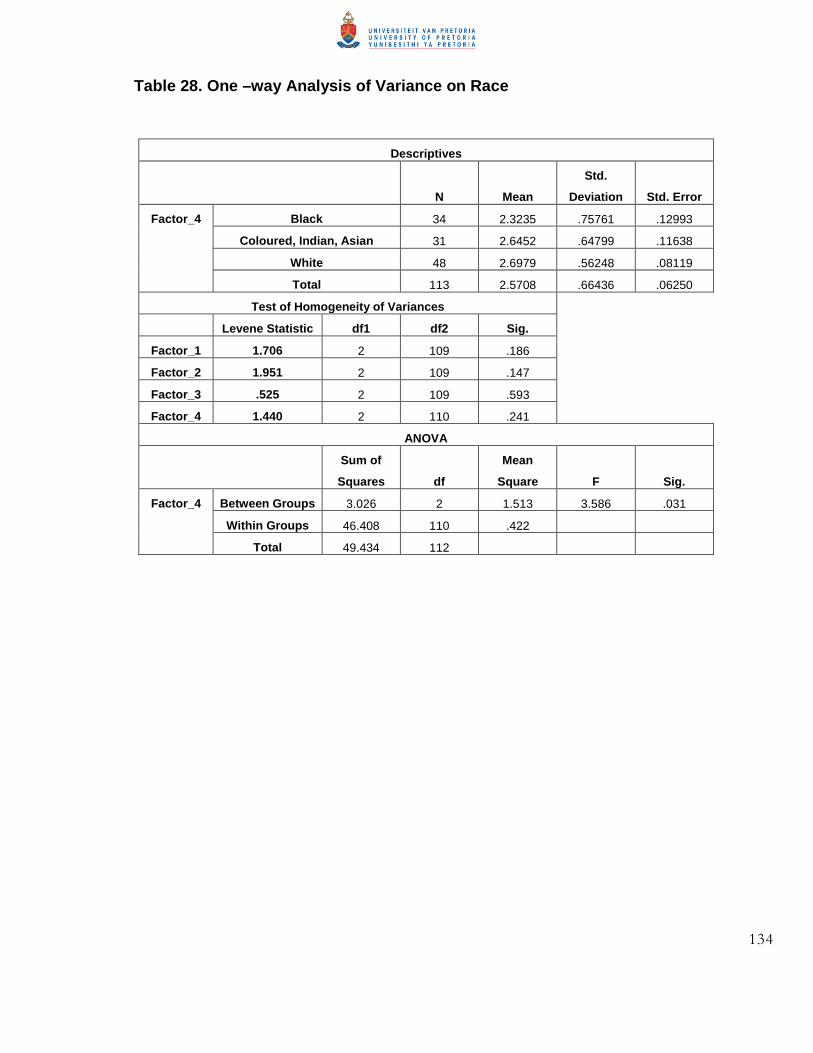
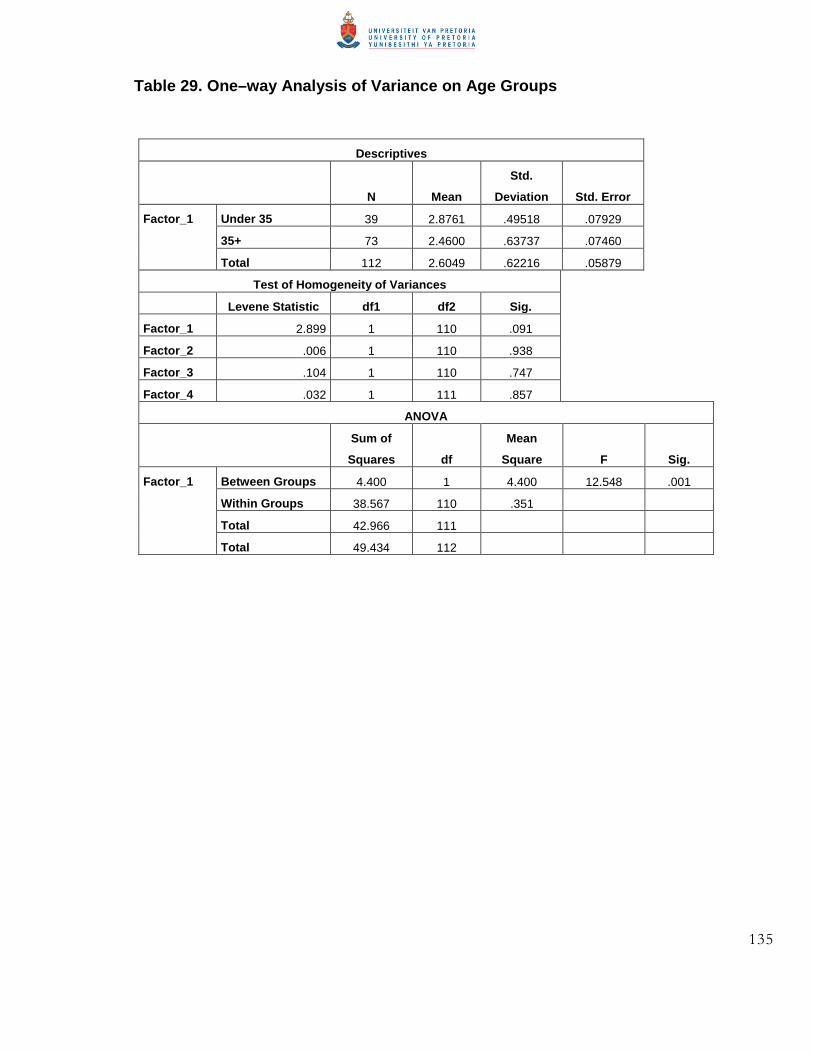
DEPICT CLOSENESS IN RELATIONSHIP AND LARGER MORE DISTANT) 126 21 A FIVE FACTOR PRINCIPAL COMPONENT ANALYSIS WITH VARIMAX ROTATION 127 22 CRONBACHrsquoS ALPHA ON FACTOR 1 WITH VALUES AFTER ITEM DELETION 128 23 CRONBACHrsquoS ALPHA ON FACTOR 2 WITH VALUES AFTER ITEM DELETION 129 24 CRONBACHrsquoS ALPHA ON FACTOR 3 WITH VALUES AFTER ITEM DELETION 130 25 CRONBACHrsquoS ALPHA ON FACTOR 3 WITHOUT ITEM ldquoHOUSEHOLDSrdquo 131 26 CRONBACHrsquoS ALPHA ON FACTOR 4 WITH VALUES AFTER ITEM DELETION 132 27 ONE ndashWAY ANALYSIS OF VARIANCE ON GENDER 133 28 ONE ndashWAY ANALYSIS OF VARIANCE ON RACE 134 29 ONEndashWAY ANALYSIS OF VARIANCE ON AGE GROUPS 135 30 ONEndashWAY ANALYSIS OF VARIANCE ON THE BANK GROUPS 136
xi
LIST OF FIGURES
1 C K PRAHALADrsquoS DEFINITION OF THE BOP AS THOSE THAT LIVE ON LESS THAN $4 PER DAY
(PRAHALAD 2002) 15
2 A BREAKDOWN OF THE SOUTH AFRICAN BOP (SOURCE AN EIGHTY20 AMPS 2008 ANALYSIS
WWWEIGHTY20COZAINSIGHTOUTMASS-MARKET-SOUTH-AFRICA) 22
3 BOP PRESENCE IN THE SA POPULATION IN LIVING STANDARDS MEASURE LSM)
TERMS (SOURCE AN EIGHTY20 AMPS 2008 ANALYSIS (2009) WWWEIGHTY20COZAINSIGHTOUTMASS-MARKET-SOUTH-AFRICA) 23
4 THE SOUTH AFRICAN PYRAMID (SOURCE CHIPP AND CORDER 2010A) 25
5 THE EQUAL PARTNERSHIP MODEL FOR THE ECONOMIC INVOLVEMENT OF THE BOP 41
6 BANK ACTIVITIES IN THE EQUAL PARTNERSHIP MODEL 44
7 LIKERT TYPE SCALE USED FOR THIS STUDY 50
8 THE EQUATION USED TO CALCULATE THE SAMPLE SIZE 53
9 VARIABLES RELATED TO THE PARTNERSHIP OF THE BANK WITH THE POOR 56
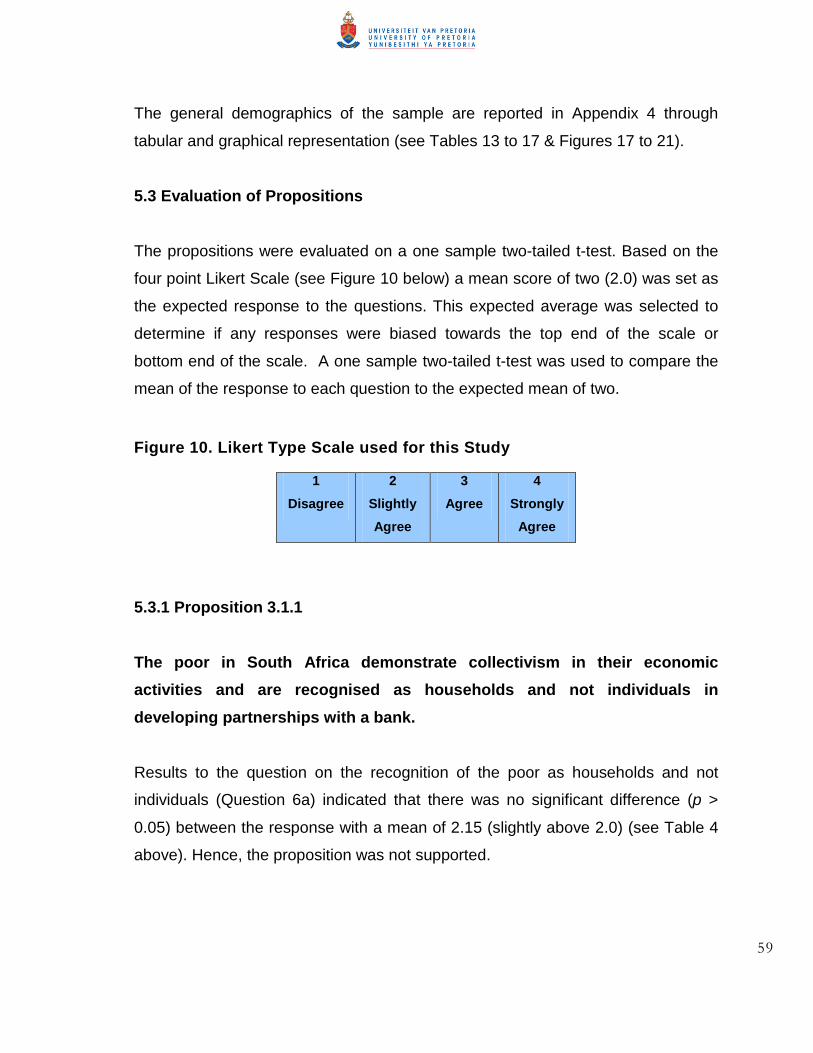
10 LIKERT TYPE SCALE USED FOR THIS STUDY 59
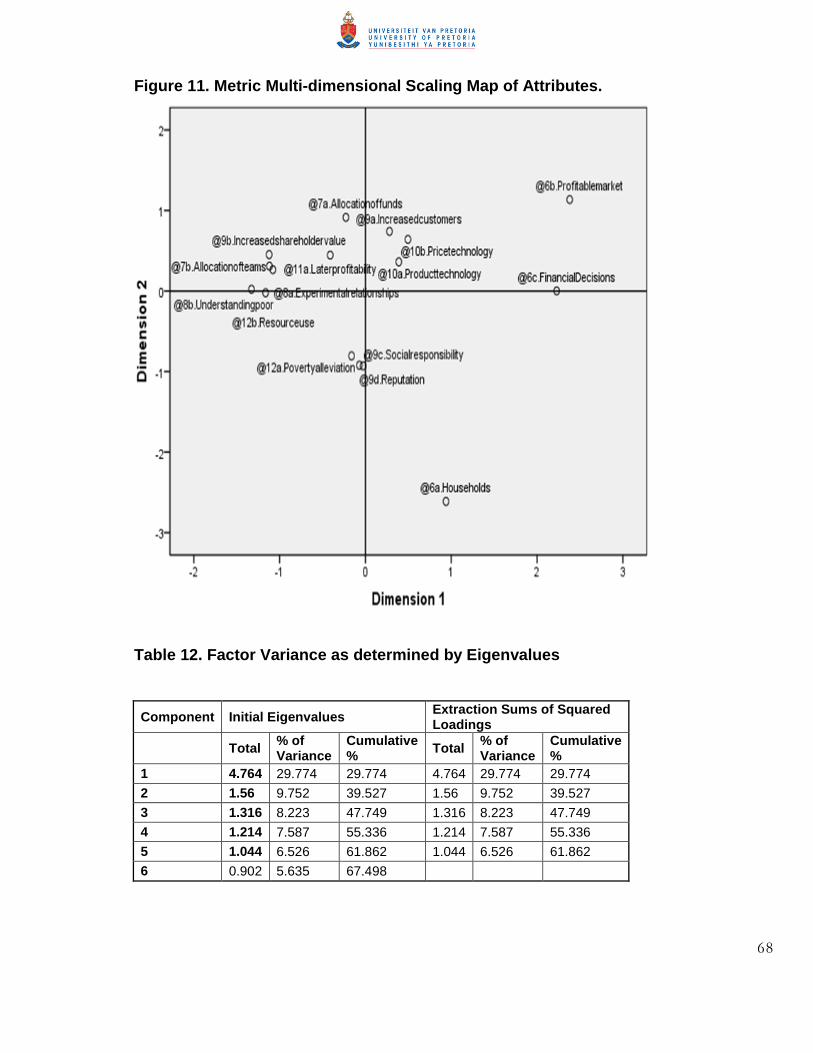
11 METRIC MULTI-DIMENSIONAL SCALING MAP OF ATTRIBUTES 68
12 METRIC MULTI-DIMENSIONAL SCALING MAP OF ATTRIBUTES WITH FACTORS 71
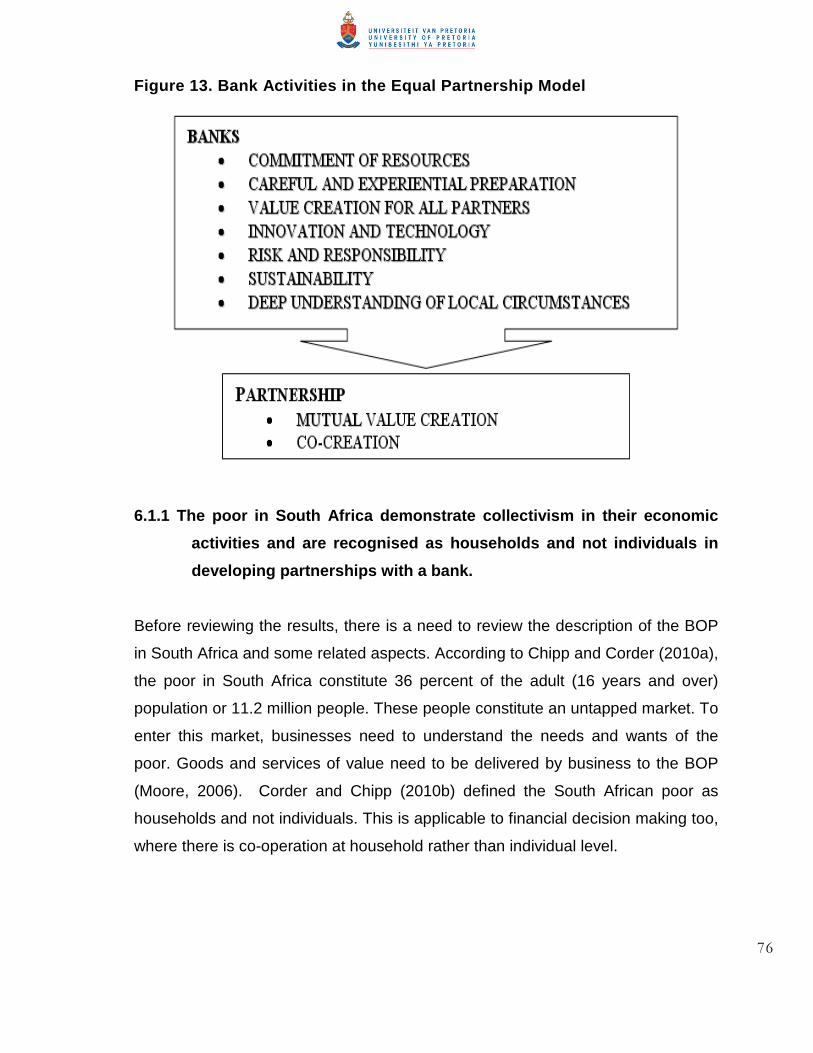
13 BANK ACTIVITIES IN THE EQUAL PARTNERSHIP MODEL 76
14 THE CYCLE OF ENHANCEMENT OF STAKEHOLDER VALUE THROUGH PARTNERSHIP WITH THE
POOR 85
15 OPTIMAL RESOURCE UTILISATION BY APPLICATION OF TECHNOLOGY IN COLLABORATING WITH
THE BOP FOR POVERTY ALLEVIATION 87
16 PARTICIPANTS FOR AN EQUAL PARTNERSHIP WITH THE POOR (OR BOP) 95
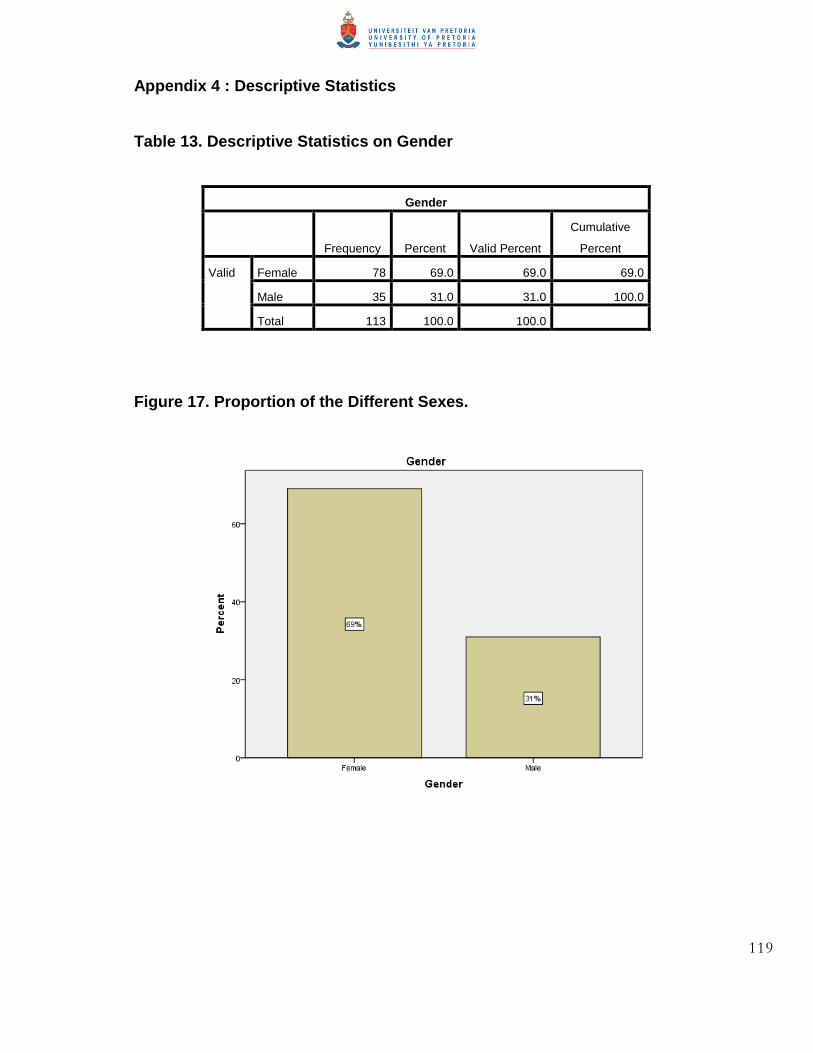
17 PROPORTION OF THE DIFFERENT SEXES 119
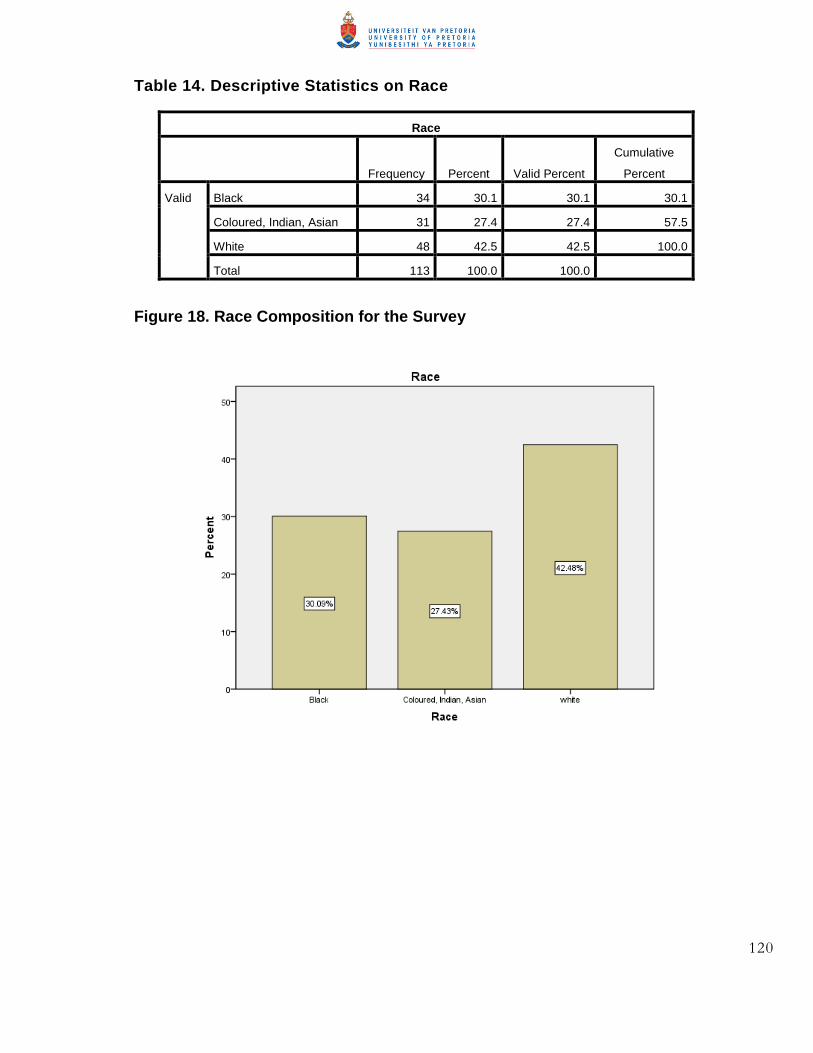
18 RACE COMPOSITION FOR THE SURVEY 120
19 AGE GROUP DISTRIBUTION 121
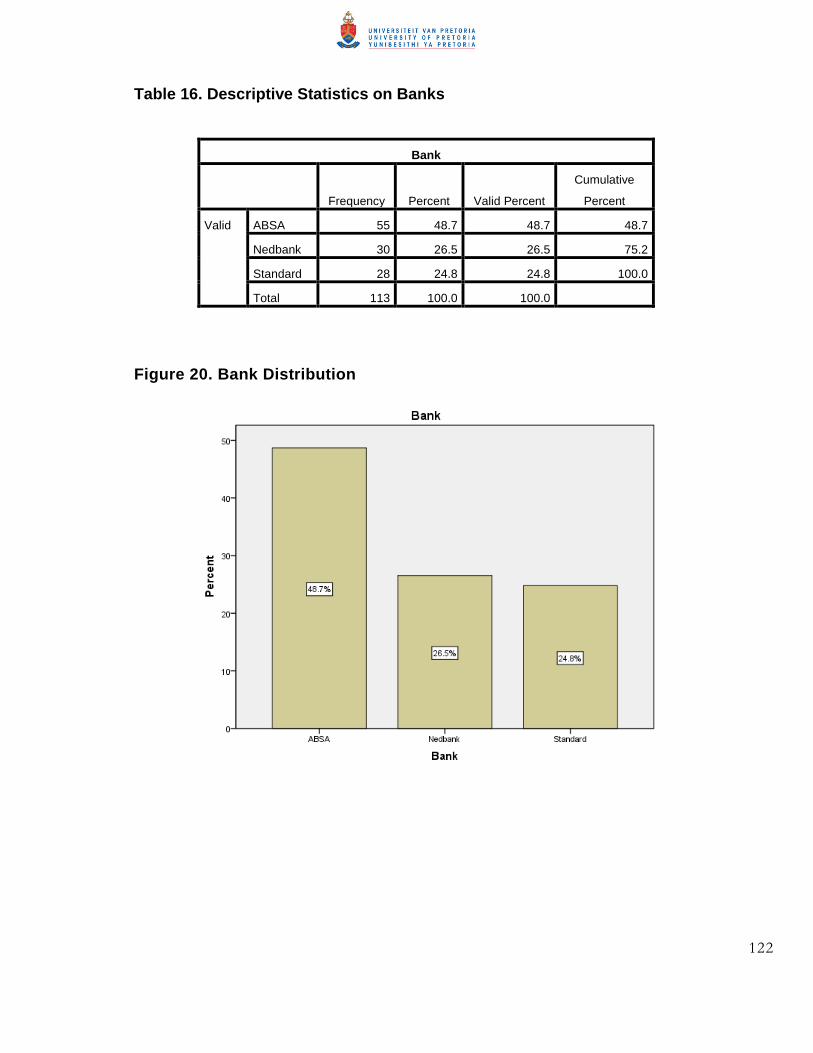
20 BANK DISTRIBUTION 122
21 TYPE OF BANKING 123
xii
ABBREVIATIONS
AMPS All Media and Products Survey
BOP Base Of the economic pyramid or the poor
CR Corporate responsibility
CS Corporate sustainability
CSR Corporate social responsibility
FMCG Fast moving consumer goods
GINI Measure of inequality of inequality of income or wealth
LSM Living standards measure
MMDS Metric multi-dimensional scaling
NGO Non-governmental organisation
PPP Purchasing power parity
SAARF South African Advertising Research Foundation
US$ United States Dollar
1
CHAPTER 1 PROBLEM DEFINITION
11 Research Problem Managers must be aware of the environment in which their businesses are
operating so that they can use their capabilities to take advantage of opportunities
to increase revenue or profitability (Andrews 1999) Hamel and Prahalad (1994)
supported the idea of businesses reinventing their industries It is apparent that
there is immense opportunity for business with the poor particularly when they are
regarded as both consumers and producers wielding trillions of dollars in
economic power (Prahalad 2006)
Prahalad and Hart (2002) expressed the need for business to profitably tap into
the huge consumer market at the base of the economic pyramid (BOP) in their
article ldquoThe Fortune at the Bottom of the Pyramidrdquo This may require firms to re-
define their ldquoprojected and served marketrdquo in order to capture a larger share of
future opportunities (Hamel and Prahalad 1994) Bottom and Base are used
interchangeably for the definition of BOP in this paper though the concept takes
on the same fundamental implication of the clientele that has in traditional
business mindsets been ignored and left untapped
111 The BOP
There are many conceptualisations of the BOP Olsen and Boxenbaum (2009
p101) define the base of the pyramid (BOP) within a context as ldquothe creation of a
new profit-seeking market opportunity to low-income segments in the developing
world with the simultaneous goal of contributing to the resolution of significant
societal problems ldquo Prahalad and Hart (2002) defined the BOP as the poor who
earn less than four United States dollars a day at purchasing power parity
2
Prahalad (2006) described the BOP as wielding trillions of dollars in economic
power especially considering the vast numbers that constitute this segment of any
economically active population
Hammond Kramer Katz Tran and Walker (2007) have identified four billion low
income consumers who constitute the base of the pyramid In all cases above the
BOP definitions are based on the principle of the tiered economic pyramid with the
poor at the base and in most cases making up the majority Karnani (2005)
however questioned the Prahalad and Hartrsquos (2002) definition of the BOP the
size of this population and argued that the BOP can be producers and not just
consumers In this perspective the BOP have immense influence in the success
or failure of a business venture that intends to tap into them from the view that
they are a potential and acquiescent market
South African Marketers need a definition of the BOP so that they can measure
track and investigate activities at the level of the BOP This is accomplished using
the Chipp and Corder (2010a) South African pyramid (comprising the foundation
core buttress and apex) developed through analysis of personal and household
data Chipp and Corder (2010a) used the South African Advertising Research
Foundation Living Standard Measure (SAARF LSM) that cuts across race and
other outdated techniques of categorising people LSMs one to four include the
poor based on criteria such as degree of urbanisation and ownership of cars plus
other appliances (SAARF 2010) and these four groups constitute 36 percent of
the South African Population
112 Corporate Sustainability Poverty alleviation and Profit There is increased recognition and popularity in the business world today of
corporate sustainability as a driver to the creation of a new market space such as
at the Base of the Pyramid (Margolis amp Walsh 2000) This recognition fits well with
3
the United Nations Millennium Development Goals that amongst many others
include hunger alleviation universal education environmental sustainability and
global partnerships (UN 2006)
Several authors (Hahn 2009 Sanchez Ricart and Rodriguez 2006) support the
principle of business corporations having corporate social responsibility for the
BOP because they must uphold the basic human rights of freedom and full
development as stated in the Universal Declaration of Human Rights (UN 1948)
Altman Rego and Ross (2009) also highlight that engaging with the BOP markets
will lead to organisational transformation with increased employee engagement
and stronger community relations Such an organisation will be attractive to both
customers and employees
Moore (2006) supports the need for business to look at the BOP market and
deliver goods and services that are of value to the BOP In doing so companies
will find new profitable markets which will increase both the values of the
companies and the lives of the customers they serve The emphasis is on enabling
the worldrsquos poor to create wealth by empowering the BOP through inclusion Kotler
and Lee (2009 p ix) emphasise that the cost of poverty exceeds by far the cost
that the poor themselves bear and therefore argue that such poverty ldquohellippours its
poison on the rest of mankindrdquo
The aim of this study is to develop a model that includes the BOP in the economy
as producers or partners The model developed from the literature review would
then be tested in the financial sector for applicability
12 Significance of Study
Business in South Africa needs to build resources and capabilities with a strategic
intent to create and exploit future markets A sustainable business strategy should
4
include the development of relationships with non-traditional partners co-inventing
custom solutions building local capacity creating markets creating lifestyles and
innovating Such a strategy would involve engaging with the BOP as consumers
and producers
Almost three million South Africans live on less than R5 per day 95 million live on
less than R10 per day and 182 million live on less than R20 a day (Eighty20
2009) This in total comprised 41 percent of the total population in SA in 2008
Chipp and Corder (2010a) defined the South African adult population as
households and not individuals and classified the BOP or poor in the LSM one to
four groups LSM one to four comprised of 36 percent of the Population in South
Africa a large and untapped market of 112 million adults
According to Corder and Chipp (2010b) the business need is as follows
ldquoMonitoring the Pyramid over time in an emerging economy should have
implications for the GINI coefficient the impact of government social grants
on household living standards and upward mobility of the poorest group in
society Business could track the impact of their anti-poverty efforts and reap
the rewards of consumer upliftment in the long term In turn the
attractiveness of emerging markets and their appetite for various products
and services would increase for many producersrdquo (p 18)
This research aims to give insight into the financial companiesrsquo activities among
the poor or the BOP
13 Research Objectives This research aims to identify the activities taking place with the BOP in the South
African financial sector The investigation intends to reveal the different aspects
5
found to be important to managers in engaging the BOP in comparison to the
model developed from the literature review in chapter 2
14 Scope of Research
This research is limited to the aspects of the relationship developed between
financial institutions and the BOP or poor
6
CHAPTER 2 LITERATURE REVIEW
This literature review identifies aspects of business strategy and business
activities within Bottom of Pyramid (BOP) markets or low-income groups
Firstly the link between strategy market and business is identified and developed
Then the aspect of the relationship between corporate responsibility and the poor
is investigated Next the mind-set shift of business and managers necessary for
an inclusive approach to the BOP is described Following the discussion on the
existence of the BOP characteristics of the BOP are presented The market based
approach to poverty reduction is raised next followed by examples of engagement
with the BOP or poor Finally models for engaging the BOP are explained and
integrated to the current research problem
21 Marketing Strategy and Awareness
211 Awareness
Synonyms to awareness are consciousness alertness responsiveness
sensitivity concern and knowledge Managers and leaders need to be aware of
sensitive to and concerned about their ecological and potential market
surroundings Andrews (1999) states that managers must be aware of the
environment in which they are operating This awareness leads to the ability of a
company to use its capabilities and profitably take advantage of opportunities This
implies that companies must adopt a global perspective and therefore take into
consideration the world the nation the community the industry and themselves
when making choices on a business opportunity This statement may not be
applicable to smaller businesses or concerns because of their limited reach and
constraining forces beyond the communities that they intend to serve
7
212 The BOP Market
Hamel and Prahalad (1994) express that for a firm to compete as a challenger it
must reinvent its industry continually This is the basis of the firm challenging its
own orthodoxies traditional practices that inhibit the potential of the firm In
addition Hamel et al (1994) describe a laggard as
ldquoa company where senior managers believe they know more about how the industry works than they actually do and what they do know is out of date rdquo (p60)
The definition of the firmrsquos ldquoserved marketrdquo (ibid p61) has to change in order to
capture a larger share of future opportunities and for the company to compete
favourably in the future Examples given by Warnholz (2008) are of Norway based
Telenor (which operates in Bangladesh and Pakistan) and Jamaican based Digicel
(which operates in Haiti) who have refused to accept the perceived inability of the
low income groups to take part in consumer markets Instead these two
companies have successfully created local consumer markets at the Base of the
Pyramid (BOP) The two companies have boosted both corporate and national
economic growth by amongst other achievements job creation tax revenue and
investment
The review above identifies the need for environmental awareness such as market
or industry knowledge understanding and utilising business capabilities and
industry innovation as crucial strategic aspects for a competitive and successful
business
22 Corporate Responsibility
Hammond et al (2007) state that
ldquoAddressing the unmet needs of the BOP is essential to raising welfare productivity and incomehellipEngaging the BOP in the formal economy must be a critical part of any wealth-generating and inclusive growth
8
strategyhellipto the extent that unmet needs informality traps and BOP penaltieshellipaddressing these barriers may also create significant market opportunities for businessesrdquo (p 5)
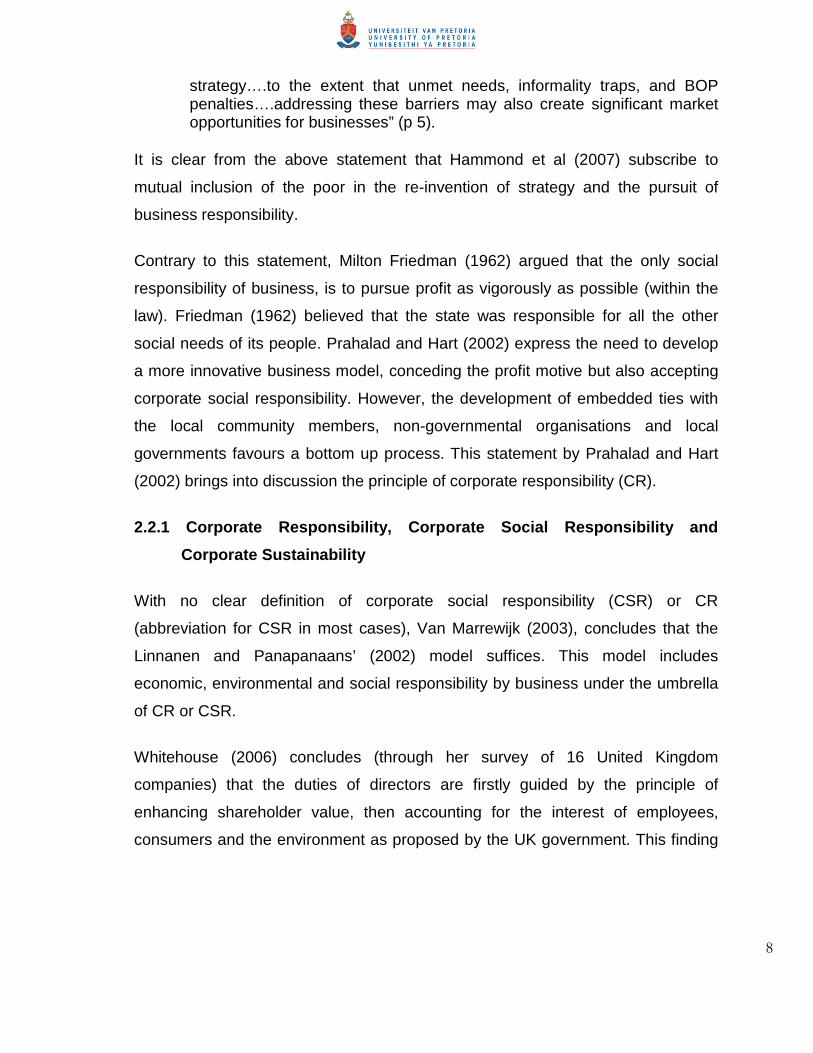
It is clear from the above statement that Hammond et al (2007) subscribe to
mutual inclusion of the poor in the re-invention of strategy and the pursuit of
business responsibility
Contrary to this statement Milton Friedman (1962) argued that the only social
responsibility of business is to pursue profit as vigorously as possible (within the
law) Friedman (1962) believed that the state was responsible for all the other
social needs of its people Prahalad and Hart (2002) express the need to develop
a more innovative business model conceding the profit motive but also accepting
corporate social responsibility However the development of embedded ties with
the local community members non-governmental organisations and local
governments favours a bottom up process This statement by Prahalad and Hart
(2002) brings into discussion the principle of corporate responsibility (CR)
221 Corporate Responsibility Corporate Social Responsibility and Corporate Sustainability
With no clear definition of corporate social responsibility (CSR) or CR
(abbreviation for CSR in most cases) Van Marrewijk (2003) concludes that the
Linnanen and Panapanaansrsquo (2002) model suffices This model includes
economic environmental and social responsibility by business under the umbrella
of CR or CSR
Whitehouse (2006) concludes (through her survey of 16 United Kingdom
companies) that the duties of directors are firstly guided by the principle of
enhancing shareholder value then accounting for the interest of employees
consumers and the environment as proposed by the UK government This finding
9
opposes the first Millennium Development Goal of the United Nations (UN 2006)
which calls for the eradication of extreme poverty and hunger in the world
There is increased popularity of corporate sustainability (CS) as a driver to the
creation of a new market space such as at the Base of the Pyramid (Margolis and
Walsh 2000) CS discussed in Van Marrewijksrsquo (2003) article focuses on value
creation environmental management environmental friendly production systems
human capital management and social issues Both CS and CSR are voluntary
company activities that demonstrate the inclusion of social and environmental
concerns in business operations and in interactions with stakeholders Naidoo
(2009) found commonalities between the concept of BOP and corporate social
initiatives but found no evidence of corporate social initiatives and loyalty by the
BOP These are the concepts of creating or increasing company profits and the
upliftment of the poor
222 Triple Bottom Line
Cummings and Worley (2009) below describe the triple bottom line as a
multidimensional view of corporate sustainability
ldquohelliptriple-bottom-line proposes that organisational change and globalisation should be guided by the economic social and ecological values that are added or destroyedhellipThis involves being clear about the companyrsquos purpose and taking into consideration the needs of all stakeholders shareholders customers employees business partners governments the ecology local communities and the publicrdquo (p 708)
Considering the above elaborate definition corporate sustainability covers both
concepts of ldquodoing businessrdquo or making a profit and ldquodoing goodrdquo or making a
difference to the community in which the corporate organisation operates
(Martinez and Carbonell 2007 p52) These principles of corporate responsibility
corporate sustainability and triple-bottom-line all link in the broader sense with
doing business profitably in a responsible or ethical manner and in a manner
10
which meets the needs of today without compromising the needs of future
generations
The UK governmentrsquos definition of sustainable development (Rost and Ydreacuten
2006) is about ensuring a better quality of life for everyone now and for
generations to come Adapting this perception to the South African context the
implication is that a BOP-strategy developed by business together with its market
will result in a sustainable market development strategy When these strategies
are pursued responsibly they can lead to a triple-win situation for the poor private
enterprises and the environment Olsen and Boxenbaum (2009) in their research
identified external barriers (which include lack of infrastructure low education
levels and lack of buying power) and internal barriers (which include conflicting
mindsets radical changes to routines project evaluation criteria incentive
structures and discrepant mandates) as pivotal factors that prevent organisations
from taking this strategic step
223 Poverty Alleviation
Hahn (2009) emphasises the opportunities to do business at the BOP and
highlights the aspect of corporate citizenship for the purpose of poverty alleviation
as an important consideration Additionally Hahn (2009) states that corporate
citizenship offers an ethical and pragmatic reason for business to engage in
poverty alleviation In Hahnsrsquo (2009) paper he reiterates that corporations are
responsible for the BOP because they must uphold the basic human rights of
freedom and their operations should be committed to human development as
stated in the Universal Declaration of Human Rights (UN 1948)
Additionally Hahn (2009) states that multinational corporations have a special
influence on the global situation and over national states which then extends their
obligation to the above mentioned human right of poverty alleviation The manner
in which the development of the BOP takes place must be without causing
11
disastrous effects on the ecological environment (Hahn 2009) Hahn (2009) then
described a model where measures to reduce poverty are linked to a slow-down of
population growth to prevent excessive pressure on the environment
Organisations stimulating commerce and economic development in low income
groups (such as the BOP) may improve the lives of billions of people and create a
more stable sustainable and inclusive world (Sanchez et al 2006) Altman Rego
and Ross (2009) express that engaging with the BOP markets will lead to
organisational transformation increased employee engagement and stronger
community relations In their article Altman et al (2009) state that as the demand
for a triple-bottom-line business model grows companies that serve the BOP can
be more attractive to both customers and employees This is the critical point in
terms of employee engagement because there is a demonstrable link that
enhances mutual community relations
Business in South Africa needs to build resources and capabilities with a strategic
intent to create and exploit future BOP markets A sustainable business strategy
should include the development of relationships with non-traditional partners co-
inventing custom solutions building local capacity creating markets creating
lifestyles and innovating Such a strategy would involve engaging with the BOP as
consumers and producers
With innovative business models companies can develop embedded ties with the
local community members non-governmental organisations (NGOs) and local
governments with opportunities to do business at the BOP Corporate citizenship
offers an ethical and pragmatic reason for business to engage in poverty
alleviation Corporate social initiatives will require organisational transformation
with increased employee engagement and stronger community relations
12
23 Mind-Set Shift
South Africa as an emerging economy has a high GINI coefficient of 679
(Pressley 2009) which effectively measures the big difference in the wealth
between the rich and the poor amongst other factors The poor being in the
majority of the population (36 percent or 112 million people 16 years or older as
specified by Chipp and Corder (2010a)) constitute a potential market which has
not been tapped to its fullest in South Africa
Prahalad (2002) comments that the solution to the increasing divide between rich
and poor throughout the world requires a significant shift in the mind-sets not just
of managers and entrepreneurs but also of politicians non-governmental
organizations (NGOs) and bureaucrats (p6) Prahalad (2002) continues the
argument by stating that the focus should be on experimentation and not on
refining the already unsuccessful business models and solutions Successful
business innovation needs to be made visible and the principles should then be
applicable elsewhere
Mind-set changes necessary for an inclusive approach to the BOP in the economy
of a country are included in Table 1 below as adapted from Prahalad (2002)
Moore (2006) supports the need for business to look at the BOP market and
deliver the goods and services that are of value to the BOP The importance of
mind-set change is on enabling the worldrsquos poor to participate in the enterprise and
create wealth for them in turn
24 Is There Really A Fortune At The BOP
Karnani (2005) counters Prahaladrsquos (2006) argument in stating that
ldquohellipnot only is there no fortune there is not even glory at the bottom of the pyramid It is a fallacy to claim that there is much ldquountappedrdquo purchasing power at the BOP hellipThe only way to help the poor and alleviate poverty is to raise the real income of the poor There are only two ways to do this
13
lower prices of the goods that the poor buy (which will in effect raise their income) or raise the income that the poor earnrdquo (p 100)
For Karnani there is no inherent fortune at the bottom of the pyramid as
prescribed by Prahalad (2005) Karnani (2005) then provides solutions to market
to the poor which include significant reduction in price by innovatively changing the
price-quality trade-off with a value offer to the poor
Table 1 Mind-set Changes Required for Managers and Leaders to Include the BOP in the Economy (Prahalad 2002)
From To Poor as a problem Poor as an opportunity to innovate a global
market Poor as dependants of the state or welfare
Poor as an active market or consumers
Old technology in business Bundling of most advanced technology with a local flavour
Follow Western principles in business Selectively ldquoleap-frogrdquo the West and innovate
Focus of the business on resources and constraints
Focus on creativity and entrepreneurship
Capital limitations or access No limitations to information hence enhanced access
Efficiency in a known model Innovation of a new model
Another aspect highlighted by Karnani (2005) where business can profit is by
focusing on the poor as producers rather than focusing on the poor as
consumers Karnani (2005) states that the importance of making markets more
efficient is for the poor to retain more value from their outputs The best way to do
this is through training the poor to upgrade their skills and improve productivity
There is a need to create more opportunities for the employment of these very
poor Karnani (2005 p109) considers these steps as the real ldquoFortune at the
Bottom of the Pyramidldquo
14
Warholtz (2007 p1) counters Prahaladrsquos (2005) view as an ldquoopportunity missedrdquo
Selling to the poor may not eradicate poverty (Warnholz 2007) Instead it will hurt
small businesses and threaten local jobs and in the process incomes Warholtz
(2007) indicates that household surveys throughout the world show a smaller BOP
size a view supported by Karnani (2005) of less than five percent of the
household survey population Karnani (2005) and Warholtz (2007 p3) have
expressed their concern that everyone in developing countries has been classified
as a lsquopoorrsquo consumer in most of the BOP literature clouding the reality that there is
a rich segment at the top
Taking into consideration the arguments presented above there does exist a large
population of the poor who must be involved in the economy in the best way
possible to pull them out of poverty What stands out in this whole review is the
fact that the BOP should not be imagined as consumers but most importantly as
producers Incorporating them at this level empowers them more than a
consumerist perception
25 BOP Characteristics
According to Hammond et al (2007) and Warnholz (2007) the BOP occurs at two
different levels those one billion individuals that earn below one United States
dollar a day in local purchasing power and those four billion individuals who earn
well below any Western poverty line (which is approximately four dollars in local
purchasing power) Hammond et al (2007) have further identified four billion low-
income consumers who constitute the BOP and make up the majority of the
worldrsquos population
However Olsen and Boxenbaum (2009 p101) define the base of the pyramid
(BOP) as ldquothe creation of a new profit-seeking market opportunity in the low-
income segments in the developing world with the simultaneous goal of
contributing to the resolution of significant economic and societal problems in
15
these regionsrdquo This defines the BOP within a context in comparison to the
Prahalad and Hart (2002) definition of the BOP as the poor who earn less than
four United States dollars a day at purchasing power parity and exist as an
untapped yet potential target for firms facing market saturation in established high
income markets (see Figure 1 below) Prahalad (2006) therefore logically
perceived the BOP as wielding trillions of dollars in economic power
Contrary to most other definitions Simanis (2009) argues that the BOP is not
actually a market Simanis perceives rather a consumer market as a lifestyle built
around a product or service Therefore Simanis (2009) reiterates that companies
must create markets or lifestyles among the poor that will stimulate the poor into
recognising their power not just as consumers but also as an empowered market
There is benefit for both the BOP households and corporate business to serve
these traditionally unlikely markets
Figure 1 C K Prahaladrsquos Definition Of The BOP As Those That Live On Less Than $4 Per Day (Prahalad 2002)
16
251 BOP in the World
Hammond et al (2007) have revealed that the 72 percent of the worldrsquos 5575
million make up the BOP with a large proportion of this population resident in
Africa Asia Eastern Europe Latin America and the Caribbean In Africa generally
the BOP is predominant in the rural areas though it is a fact that the urban areas
also have their significant share of the marginalised and poor
According to the economic statistics website NationMaster (CIA World
Factbooks 2003 to 2008) fifty percent of the South African population was lying
below the poverty line in 2000 and the country is ranked twenty third amongst the
poor and developing countries listed This poverty estimate is based on economic
surveys of population subgroups and the definition of poverty is specific to South
Africa
In describing the BOP it is evident that they are not involved or integrated in the
global market economy (Hammond et al 2007) They have significant unmet
needs such as financial services housing and utilities such as electricity water
sanitation telephone service and health care The BOP is dependent on informal
or a subsistence source of income which are considered poverty traps in the vast
literature on developing and underdeveloped economies Intermediaries exploit
their handcraft artefacts crops and labour
The same bottom of the pyramid sector tends to pay higher prices for goods and
services than other income groups and often they receive lower quality goods
Examples of these goods or services are the cost of transport health care and
financial services (when they have to borrow from established financial institutions
and informally)
17
252 BOP 1 and BOP 2
Louw (2008) in his paper describes the confusion that existed with regards to the
BOP market size and market value Louw (2008) identified the following BOP
venture characteristics in his research
bull The target markets were both implicit and explicit
bull The offering was a product or service
bull Partnerships were important for a BOP venture
bull There was need for an innovative business process product or technology
bull Technological novelty was important
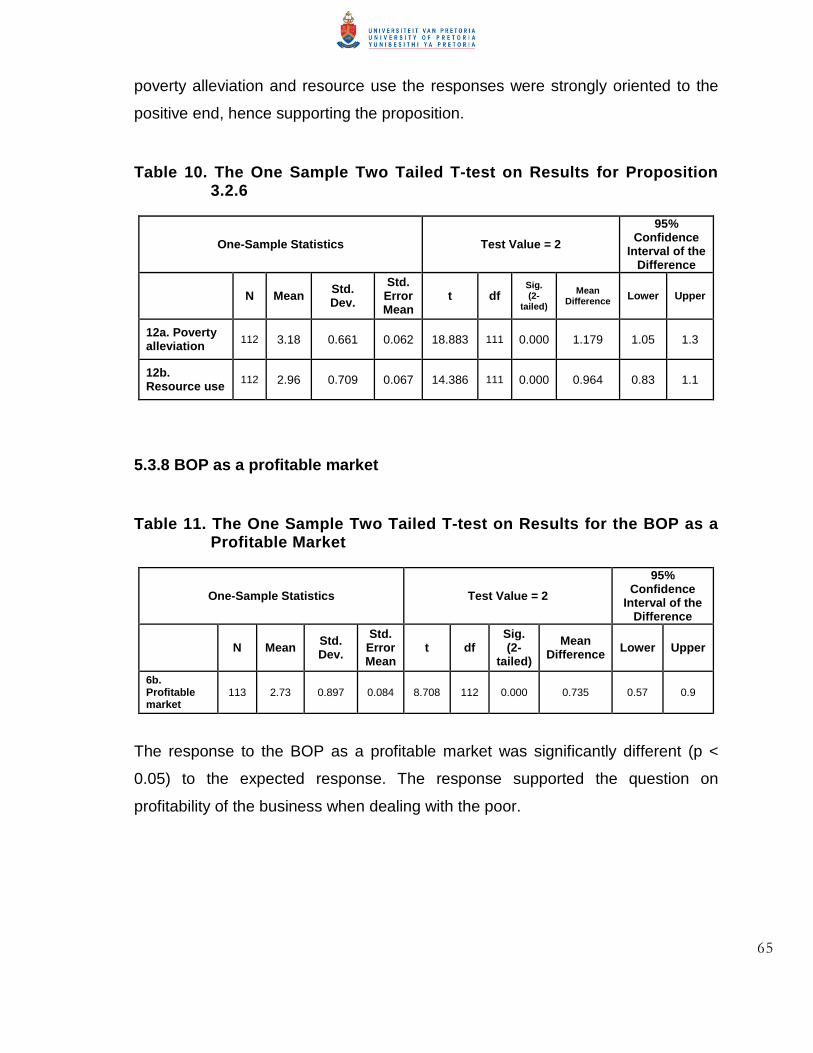
bull Profitability and Sustainability were interlinked
Louw (2008) then went on to define the BOP at two market levels BOP1 and
BOP2
The BOP1 were defined as those individuals who earn below two United States
dollars a day the absolute poverty line defined by the World Bank adjusted for
local purchasing power parity (PPP) This population of BOP1 accounts for 28
billion people in the world which is about 70 percent of the four billion BOP
defined by Prahalad and Hart (2002) Louw (2008) attributed the following traits
and attributes to the BOP1 market in his case analysis
bull Sales to them consisted of mainly services with some consumer goods
and products
bull The successful market sectors were health financial services
(particularly in the form of short term high interest loans) and fast moving
consumer goods (FMCGs)
bull There was an improvement of business processes through the
involvement of Government or NGOs
bull Branding was important
18
The BOP 2 market included those individuals who earn more than two United
States dollars a day adjusted for local PPP The characteristics of the BOP2
market identified by Louw (2008) were the following
bull Greater than two dollars a day was a typical income of customers in this
market
bull There was need for product or business process innovation for success
bull Technology was important and played a key role in all cases
bull Products and services were successful in this sector but local partners
and NGOs were required for delivery and distribution
bull Multi National Corporations were the only examples where local partners
or NGOs were not required
253 Urban BOP
Ireland (2008) in his study defined the urban BOP and found them to be a more
attractive clientele than the rural BOP The two reasons cited by Ireland (2008)
were firstly that the urban BOP is a large growing market that spends most of its
income on consumer goods Secondly the urban poor do not require any of the
adaptations needed for marketing to the rural BOP Therefore for Ireland (2008)
the urban BOP is exploitable in comparison to the rural BOP who might be more
conservative There is a great deal more entrepreneurship with informal trade in
the form of backyard industries workshops and stalls that make the urban BOP
market a little more complex as they are both consumers and producers
254 Poverty Factors and Forces
Kotler et al (2009) cited factors and forces that contribute to the continued poverty
of the BOP as the following
bull Poor health which may be due to the lack of affordable health care the
spread of disease such as malaria low levels of physical activity and
19
inadequate nutrition This statement implies that disease is more
prevalent in poverty stricken societies than others
bull The difficulties encountered in the presence of adverse environmental
factors These include examples such as low soil fertility due to
erosion deforestation and water contamination
bull Difficult economic conditions such as unemployment low wages and
government failure both economic and political that result in little or no
support for the poor
bull Inefficient infrastructure and services such as roads sewage water
supply and electricity
bull Limited access to education
bull Social factors such as crime domestic violence wealth distribution and
beliefs
bull Lack of family planning such as access to counselling and related
services
bull High energy prices in recent years
bull The rise of China with its strong economic growth and thirst for world
resources The rise of China has created a perceived threat to
ldquoestablishedrsquo business It has brought in a lot of competition and
therefore there is no longer ldquobusiness as usualrdquo A lot more aggressive
strategies have had to be adopted in order to lsquostoprsquo Chinese infiltration
bull The advent of bio-fuels which utilise farmland commonly abundant in
the BOP areas and the resulting rise in the price of food further making
basic needs out of reach for the BOP
bull Droughts which have reduced the output of food
bull Dietary changes in growth economies and hence higher demand for
better quality (which those in the BOP cannot afford) and volumes of
food
bull Global warming (which largely emanates from developed economies
but has devastating effects on the BOP) which has contributed to
20
drought conditions and lower food production in equatorial and tropical
areas
bull The recession due to the financial meltdown in 2008 which led to
factories closing lost jobs and hence an added increase in the number
of poor particularly in the developing and under-developed economies
These factors continue to contribute and exacerbate the economic position of the
poor
255 Valuing and Quantifying the BOP
Hammond et al (2007) have valued the BOP as a five Trillion dollar market
Additionally Hammond et al (2007) state that significant opportunities exist for
market based approaches to better meet these four billion consumersrsquo needs This
would increase their productivity improve their incomes and empower them for
entry into the formal economy In their report Hammond et al (2007) determined
that the people at the BOP earn less than $3000 (in local purchasing power parity
with the reference year being 2002) Examples of other BOP incomes range from
US$156 a day in India to US$335 a day in Brazil (these incomes were based on
2007 surveys and are in US dollars)
The four billion BOP market with an income of four trillion dollars (in purchasing
price parity) makes up the following percentages in the respective regions
identified below (Hammond et al 2007)
bull Africa ndash 95 percent of the population (surveyed) and 71 percent of the
purchasing power
bull Asia inclusive of the Middle East ndash 83 percent of the population and 42
percent of the purchasing power
bull Latin America and Caribbean -70 percent of the regionrsquos population and
28 percent of purchasing power
21
bull Eastern Europe ndash 64 percent of the regionrsquos population and 36 percent
of the purchasing power
The sector markets for the BOP range in size from the largest being food and
medium being health transportation housing and the least being energy
Hammond et al (2007) identified the smallest market sectors for BOP as water
and information and communication technology
Chen and Ravallion (2008) describe the main poverty line at $125 a day at 2005
prices being the average poverty line found in the poorest ten to twenty countries
investigated Estimates by Chen and Ravallion (2008) place the number of people
living on less than $125 per day (at 2005 prices) at 14 billion people A billion
people will still live on less than $125 a day in 2015 and those that escape this
level will still earn much less than the middle-income and rich of their respective
countries In Sub-Saharan Africa the number of poor has nearly doubled from 202
million in 1981 to 384 million in 2005 (Chen and Ravallion 2008) but there have
been signs of progress from 1996 to 2005 where the poverty rate has fallen from
58 percent (or 348 million) to 50 percent (or 384 million) due to improved
economic stability
According to a 2009 Eighty20 report (for which data was sourced from All Media
and Products Survey [AMPS] 2008 RA of the South African Advertising Research
Foundation [SAARF] that has been conducted annually for over thirty years)
almost three million South Africans live on less than five Rand per day (see Figure
2 below) 95 million live on less than ten Rand per day and 182 million live on
less than R20 a day Most of the BOP in SA survive on government grants and the
BOP figure would significantly increase if it excluded those catered for by
government social grants The government grants amount to substantial quantities
when unemployment old age pension and child grants amongst others are taken
into account
22
Figure 2 A Breakdown of the South African BOP (Source An Eighty20 AMPS 2008 analysis eighty20cozainsightoutmass-market-south-africa)
256 BOP and the Living Standards Measure (LSM)
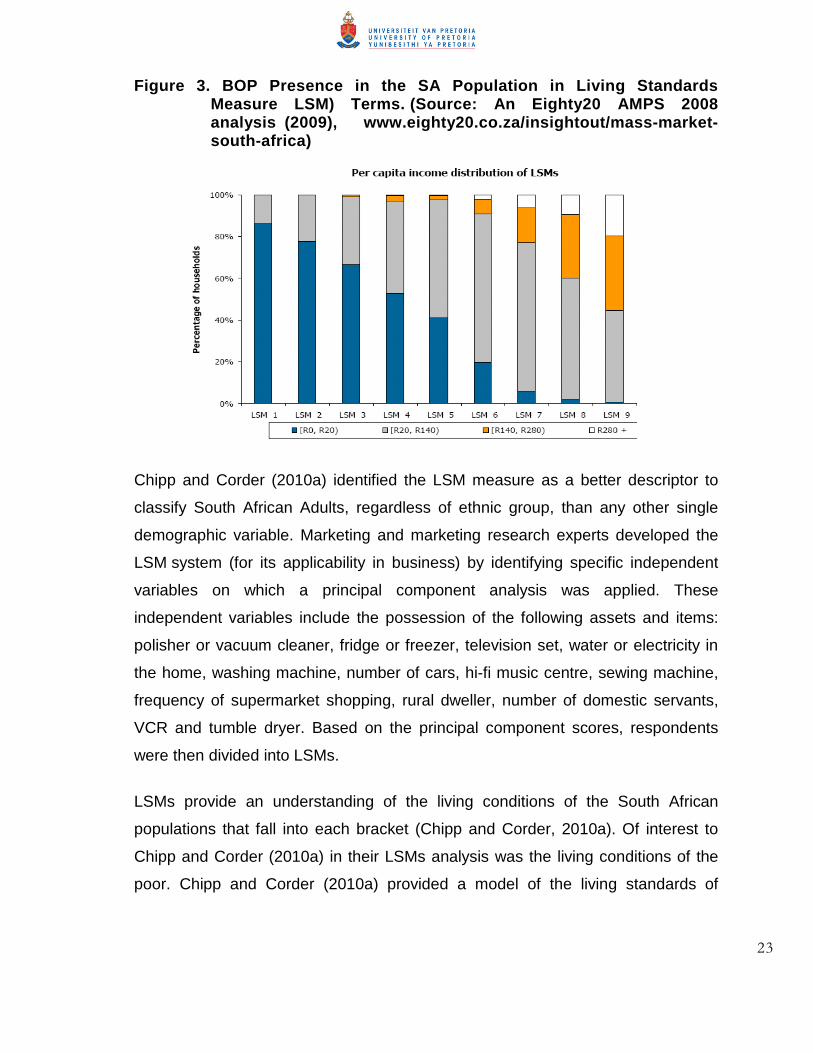
Approximately 50 percent of households in South Africa in the Living Standards
Measure (LSM) range of one to eight consist of those who earn less than R20 per
day based on the 2008 figures (see Figure 3 below) Of the total population in
2008 41 percent constitute the BOP (Eighty20 2009)
Based on the Eighty20 analysis (2009) BOP households in SA in 2005 spent 35
percent of their income on food ten percent on transport ten percent on clothing
nine percent on furniture and six percent on recreation (which includes
entertainment personal care and culture) Other spending is in areas such as
social protection communication financial services transfer of funds to others
education health alcohol tobacco and savings The last two tobacco and
savings accounted for one percent each The implications are for corporations to
tap into the BOP consumers in the areas of food transport clothing and furniture
in SA
23
Figure 3 BOP Presence in the SA Population in Living Standards Measure LSM) Terms (Source An Eighty20 AMPS 2008 analysis (2009) wwweighty20cozainsightoutmass-market-south-africa)
Chipp and Corder (2010a) identified the LSM measure as a better descriptor to
classify South African Adults regardless of ethnic group than any other single
demographic variable Marketing and marketing research experts developed the
LSM system (for its applicability in business) by identifying specific independent
variables on which a principal component analysis was applied These
independent variables include the possession of the following assets and items
polisher or vacuum cleaner fridge or freezer television set water or electricity in
the home washing machine number of cars hi-fi music centre sewing machine
frequency of supermarket shopping rural dweller number of domestic servants
VCR and tumble dryer Based on the principal component scores respondents
were then divided into LSMs
LSMs provide an understanding of the living conditions of the South African
populations that fall into each bracket (Chipp and Corder 2010a) Of interest to
Chipp and Corder (2010a) in their LSMs analysis was the living conditions of the
poor Chipp and Corder (2010a) provided a model of the living standards of
24
different household groups in South Africa using the LSM variables stated earlier
(with source data from the 2008 to 2009 AMPS reports and South African
Advertising Research Foundation [SAARF] reports in 2009)
The model in Figure 4 and Table 2 below divides the population of South African
adults (16 years and older) into four categories of a pyramid Firstly the Apex or
group A (which includes LSMs 9 and 10) makes up 143 percent of the South
African population Next the Buttress or group B (LSMs 7 and 8) comprises 163
percent of the population Thirdly the Core of group C (LSMs 5 and 6) makes up
336 percent of the population and lastly the Foundation of group D (LSMs 1 to 4)
comprises 358 percent of the South African adult population
Chipp and Corder (2010a) stated that their ldquostudy provides strong support for a
clear dollar and household definition of BOP based on living standard and thus
dollars earned per day are descriptors rather than determinants of the BOP ldquo (p1)
A household definition characterises the manner in which South African
households operate financial matters require joint decision-making and co-
operation at household level not at individual levels The Chipp and Corder
(2010a) South African pyramid indicates that there is collectivism rather than
individualism at the lower levels of the SA Pyramid This collectivism is a result of
the scarcity of the dollar the irregularity of income at times the absence of any
income to the extent that whatever has been earned is extended to cover every
household member and to buy only the most immediate and basic needs
In addition to their previous report Corder and Chipp (2010b) reported that ldquoa
higher incidence of collectivism among the lower tiers of the South African
Pyramid indicate that from an African perspective therefore the BOP should be
considered from a group perspective rather than a Western view of the individualrdquo
(p10) Hence Corder and Chipprsquos (2010b) recommendation to marketing
researchers and managers
25
ldquoThus to view the low income consumer and their earnings per day in isolation from their households and dependencies would limit researchers from gaining a fuller perspective on this segmentrdquo (p10)
Figure 4 The South African Pyramid (Source Chipp and Corder 2010a)
Foundation 36
Core 34
Buttress 16
Apex 14
0
10
20
30
40
50
60
70
80
90
100
SA Pyramid
26 Poverty Reduction- A Market Based Approach
Businesses need to identify opportunities consider robust business models
develop products and expand investment into the BOP markets This is even
more important in the developing world (Hammond et al 2007) where it is
possible for poverty alleviation to be framed as an enabling opportunity and
less in terms of aid A market based approach views the BOP as consumers
and producers and aims at finding solutions and making markets more
efficient competitive and inclusive (Karnani 2005) The BOP can then benefit
from these markets A market-oriented approach looks at goods and services
provision at affordable prices and in a sustainable manner to meet the needs
of the BOP market
26
Table 2 The South African Pyramid Defined (Source Chip amp Corder 2010a)
TOTAL The South African Pyramid lsquo000 The Adult Population (lsquo000) equivalent to 16+ years 31305 100 The Apex of the Pyramid (Group A ndash LSMs 9 amp10) 4463 143 The Buttress of the Pyramid (Group B - LSMs 7 amp 8) 5105 163 The Core of the Pyramid (Group C - LSMs 5 amp 6) 10534 336 The Foundation of the Pyramid (Group F - LSMs 1-4) 11194 358
261 Managerial demands
Prahalad (2002) outlines the following as critical managerial demands in creating a
market at the BOP
bull The price-performance view of products must change It must not be
necessary that good quality and adequately sized products be
expensive
bull Business models must be scaleable or transferable to address the
needs of the hundreds of millions at the BOP
bull The business models must be environmentally sustainable due to
shortages of resources critically financial in rural areas The production
methods or processes must consume little or limited resources without
sacrificing product performance
bull Innovation integrating advanced technologies and local conditions for
innovative solutions should lead towards opportunity at the BOP for
experimentation
Rangan (2002) in his commentary on Prahaladrsquos (2002) paper added two
more aspects to the managerial demands which are
27
bull The economic sustainability of the business model (and not just
environmental sustainability) and
bull The societal value-add of a product or service as a criterion so that
there is an enhancement in the consumerrsquos quality of life
262 Marketers and the BOP
Nilesen and Samia (2008) reveal three major implications for marketing managers
to serving the BOP marketplace These are
bull BOP consumers and producers are intertwined Their interrelationships
must be taken into consideration in strategic business planning
bull There are many lessons to be learnt from BOP entrepreneurs who have
developed innovative products pricing promotion and distribution
strategies to meet the needs of BOP consumers and
bull Co-operation with facilitating organisations such as local businesses
public agencies and non-governmental organisations can lead to win-
win solutions for BOP producers and consumers This then ensures
long-term business relationships and success in the BOP marketplace
Pitta Guesalaga and Marshall (2008) state the need for management or marketing
strategists to view the BOP as both consumers and producers To better design a
business approach to the BOP companies must understand their market needs
perceptions and behaviour In so doing companies must recognise that dealing
with the BOP will require a different business model that encompasses access to
micro-credit the establishment of alliances and the adaptation of the marketing
mix BOP markets involve many challenges in terms of technical and economic
infrastructure education financial resources and cultural differences
Stuart L Hart in a journal interview by Powell (2006) stated the urgent need for a
BOP model to work by finding
28
ldquohellipthe right partners on the ground ndash people who are locally embedded who really understand who are trusted and are visible in the space that yoursquore trying to reach hellipYou canrsquot really know who the appropriate partners are until you get there and spend some time on the ground hellip The network or eco-system of partners that you put together is not going to look anything like the partnerships that you have been accustomed to dealing with at the top of the pyramidldquo (p 1482)
Marketersrsquo approach to the BOP (Pitta et al 2008) should be in an innovative and
different manner by reinventing themselves and their strategies Modifying
products (as sold to the market at the top of the pyramid) and selling them will lead
to business failure Knowing the BOP intimately is a key to success with sources
of intelligence being at the grass roots level in order for the business entity to
understand the voice of the BOP consumer Hence collaborating effectively with
agents ldquoon the groundrdquo is critical Trust and visibility of the agent are paramount in
this regard Should the BOP ecosystem perceive the business entity in their midst
as an outsider then they are likely to resist or even boycott the services and
products offered leading to an inevitable loss and consequent collapse of the
entity
Pricing is of utmost importance in servicing the BOP Micro-credit at the BOP
provides one possible solution to providing finance for the purchase of value
creating products and services (Pitta et al 2008) Investment in the BOP will be for
long-term involvement There is high risk in investing in the BOP such that if profits
come they will come later rather than sooner Finally some products are just not
for the poorest of the BOP such as those of questionable value and others which
are too expensive
One of the lessons stressed by Hammond and Prahalad (2004) was that
ldquoSuccessful product development requires a deep understanding of local
circumstances so that critical features and functionalitycan be incorporated into
the productrsquos designrdquo (p34)
29
263 Partnerships
Willie and Barham (2009) in their report identified areas that need attention to
achieve business success in collaboration with the BOP These areas of attention
are such that they would benefit both sides
bull There should be more coverage in literature the financial press other
media and politics of investment by business for the emergence of the
BOP from poverty The focus of this reporting should be on the potential
for business at the base of the economic pyramid
bull Businessrsquo role in society is to gain and maintain a good reputation apart
from just wealth creation It is in the interest of companies to be seen to
be contributing to society
bull Some altruism and philanthropy by business go hand-in-hand with the
profit motive
bull There should be harmony and cooperation between NGOs and
companies Companies should seek the advice and cooperation of the
NGOs when engaging with the BOP
bull Companies should set up a specific commercial unit to engage with the
BOP and other needy populations Profit maximisation must not be the
main goal
bull Companies should coordinate their efforts with the BOP to address a
number of problems simultaneously Companies must avoid a synergy
of failures
bull Coordinating efforts with others would complement efforts with the
BOP Systems that are simple with limited bureaucracy can be
developed with NGOs and government
bull A government department could form a coalition with companies with
different core competencies to deal with the needs of specific
communities
30
bull Companies could adopt the Cornell University BOP Protocol system
(Simanis and Hart 2008b) to consider whether to adopt it See
Appendix 2 for more details on the Cornell University BOP Protocol
The Cornell University BOP protocol covers processes under the
banners of pre-field processes (including identifying sites for project set
up team selection plus preparation and partner selection) in-field
processes (including building the business and embedding it in the
community through three phases) and finally scaling out which involves
efficient transfer and re-embedding the model in hundreds of other
communities
bull Companies planning ventures with the BOP would need to recognise
the need for careful and meticulous preparation
bull Companies both big and small in countries with a large number of
people living in dire poverty must recognise their social and corporate
responsibility to these people
Good work has been done in the area of lsquobusiness and the BOPrsquo but in the global
sense it is very limited according to Willie and Barham (2009) If the BOP are to be
left in poverty then business will suffer the consequences of global instability and
depletion of vital natural resources
Sanchez et al (2006 p20) define social embeddedness in a low-income market as
ldquoThe integration into diverse local networks that leads to the development of long-term and co-operative relationships which result in the achievement of common benefits for all the players involved in the networkrdquo
The authors describe three conditions under which firms have greater incentives to
build embedded ties and partnerships and these are
31
bull An under-developed market oriented system meaning a framework
which allows both private sector and social participants to work together
in a symbiotic relationship
bull A high psychic distance between the organisation and the low-income
markets or in other words the degree to which a firm is uncertain of the
characteristics of a BOP market and
bull The degree of personalised co-creation experiences offered by the firm
which are the processes in which the consumer interacts with different
actors and co-creates value in each business interaction
Social embeddedness contributes to creating the competitive business advantage
and may create more total value both socially and economically (Sanchez et al
2006)
Taking their cue from the submissions above Martinez and Carbonell (2007)
describe the following factors for sustainable ldquoBusiness Social Actionrdquo
bull It must be voluntary triggered by the possibility of a business
opportunity
bull The action must tie in with the business strategy and align with key
skills
bull Funds must be committed fully and consistently
bull There should be openness in application for anyone to participate
bull Extends the opportunity as lessons learned for replication in other
similar environments
Sanchez et al (2006) support this argument for successful competition in low-
income segments This is achieved by training and educating partners across all
levels to get responsible partners providing incentives and building the ability to
self govern
32
Simanis (2009) supports the idea of organisations ldquogetting the community involved
in creating implementing and shaping the business itselfrdquo (p 7) In addition
Simanis (2009) recommends that companies present as many uses of their
product in their marketing strategy as possible Altman et al (2009) maintain the
idea that organisations should meet the demands of the BOP by developing
relationships with local delivery providers social development players
entrepreneurs government officials and potential customers Organisations will
need to develop people or teams who can work in BOP environments and with
non-profit organisations that have scarce resources (Altman et al 2009) These
individuals and teams will need to learn how to create alliances build economically
sensitive movements tap passion and unlock the business potential Table 3
below summarises the aspects of working with the BOP identified in this literature
review
27 Examples of Engaging the BOP
Experience with viable business strategies (Hammond et al 2007) justify far closer
business attention to the opportunities that the BOP present to ecologically
conscious business ventures (see Appendix 1 for more details on the examples
below) Examples cited by Hammond et al (2007) and others include
bull CEMEX (the largest cement producer in the Americas) based in Mexico
which is an enterprise that focused on making housing accessible to the
poor by providing a lsquopay-as-you-gorsquo system for materials and
instructions as needed
bull Jaipur foot which is an Indian business that focused on providing
artificial limbs
bull HLL salt Annaoura in India (a company that aimed at improving health
through supplying iodised salt)
33
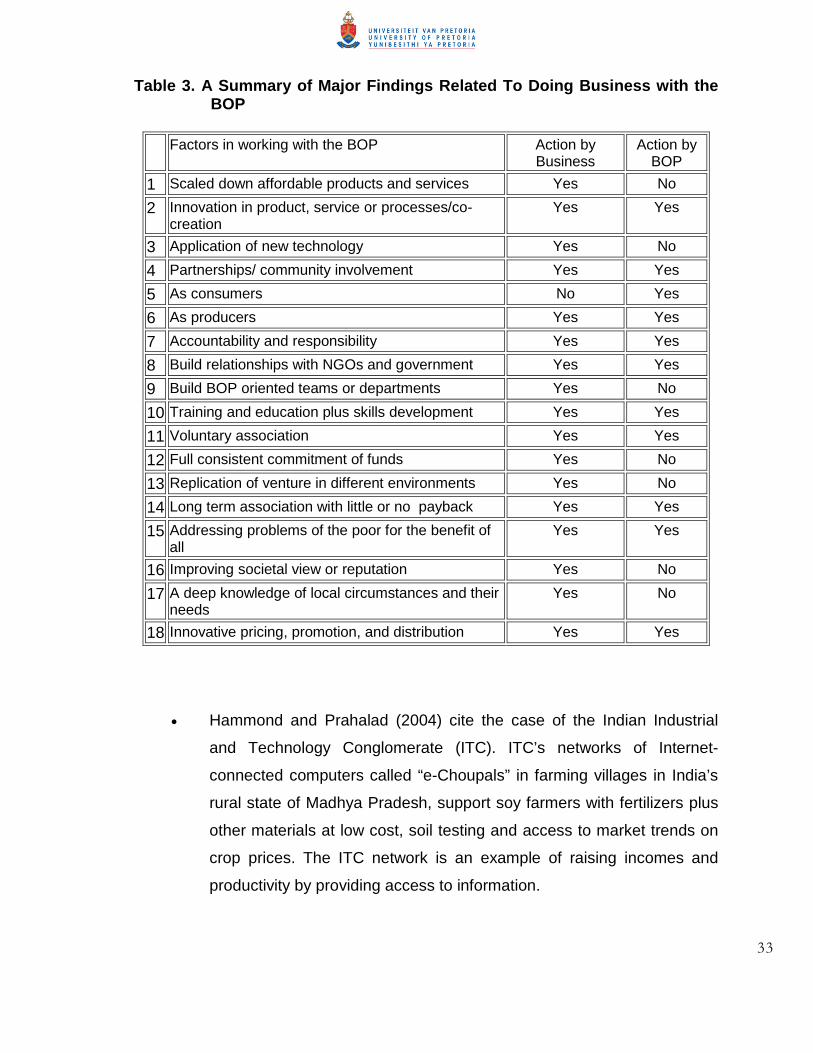
Table 3 A Summary of Major Findings Related To Doing Business with the BOP
Factors in working with the BOP Action by Business
Action by BOP
1 Scaled down affordable products and services Yes No
2 Innovation in product service or processesco-creation
Yes Yes
3 Application of new technology Yes No
4 Partnerships community involvement Yes Yes
5 As consumers No Yes
6 As producers Yes Yes
7 Accountability and responsibility Yes Yes
8 Build relationships with NGOs and government Yes Yes
9 Build BOP oriented teams or departments Yes No
10 Training and education plus skills development Yes Yes
11 Voluntary association Yes Yes
12 Full consistent commitment of funds Yes No
13 Replication of venture in different environments Yes No
14 Long term association with little or no payback Yes Yes
15 Addressing problems of the poor for the benefit of all
Yes Yes
16 Improving societal view or reputation Yes No
17 A deep knowledge of local circumstances and their needs
Yes No
18 Innovative pricing promotion and distribution Yes Yes
bull Hammond and Prahalad (2004) cite the case of the Indian Industrial
and Technology Conglomerate (ITC) ITCrsquos networks of Internet-
connected computers called ldquoe-Choupalsrdquo in farming villages in Indiarsquos
rural state of Madhya Pradesh support soy farmers with fertilizers plus
other materials at low cost soil testing and access to market trends on
crop prices The ITC network is an example of raising incomes and
productivity by providing access to information
34
bull Mobile phone banking in Johannesburg South Africa (a more secure
way of receiving salaries and making payments in the crime-ridden
capital)
bull Low cost drinking water filtration in Tianjin China (developed by
entrepreneurs to clean heavily polluted and high-risk river water)
Ireland (2008) developed the notion of targeting the urban BOP residents in
emerging market slums that in his case were the 80 percent of the Venezuelan
poor who live in unplanned shantytowns called ldquobarriosrdquo (p431) He cites that the
key difference between the rural and urban BOP marketing is that the urban BOP
can purchase products or services in shopping malls and large supermarkets
whereas the rural BOP shop daily and generally at the same location
Ireland (2008) found that the urban poor buy middle-class products and services
and receive information about these products through mass media ldquoCustomers
also paid more for convenience social integration brand meaning reliable quality
or status or versatilityrdquo (Ireland 2008 p436) in addition to reliable quality or
technical superiority This observation has great implications in SA considering the
urban population growth in the form of informal settlements since 1994
Karnani (2007) cites the case of lsquoFair amp Lovelyrsquo a skin whitening cream for women
marketed by Unilever in many countries in Asia and Africa Karnani (2007) feels
that Unilever has unwittingly helped to sustain and perpetuate sexist and racist
prejudices that feed the demand for this product lsquoFair amp Lovelyrsquo is doing well it is
profitable and it is a high-growth brand for Unilever in many countries especially in
India Hindustan Lever Limited (the Indian subsidiary of Unilever) marketed the
product in lsquoaffordablersquo small size pouches targeted for the poor For such a market
the more the sales of the smaller pouches the higher the financial returns for
Hindustan Lever Limited
35
Hammond and Prahalad (2004) describe businesses that are packaging products
in smaller units These smaller units allow for immediate use and allow the poor to
purchase an otherwise unaffordable product Examples cited are of a Mexican
retail chain selling chicken in smaller portions and Hindustan lever limited with
personal health-care products such as shampoo and detergents packaged in a
lsquosingle-servingrsquo version packages
Hammond and Prahalad (2004) cited another example of prepaid phone cards
being the dominant business model for the cell phone market worldwide which
squashes the perception that business with the poor is risky Prepaid cards
eliminate collection costs and debt Payment is made before a call is connected In
addition to the advantage pointed out here the pre-paid vouchers are sold in
various small denominations such that even the BOP market apparently sees
these vouchers as affordable
lsquoPerson-to-personrsquo cosmetic giants such as Amway Corp and Avon Products have
modernised distribution channels in India and Brazil (Hammond amp Prahalad
2004) The two companies have used direct distribution strategies to sell beauty
products to the poor and have hired poor people as entrepreneurs
Vikram Akularsquos SKS Microfinance Company (Akula 2008) provided finance to
women in rural India so that they can start small businesses and get out of
poverty The companyrsquos business strategy is based on three principles Firstly a
profit-oriented approach was applied to access commercial capital Secondly
there was standardisation of products training and other processes to boost
capacity and finally there was use of technology to reduce costs and limit errors in
the business
The principles running through most of the examples in dealing with the poor
above are of entrepreneurship alliances or partnerships and technology
implementation There is gain for business in the form of increased profit or market
36
share The BOP or poor gain access to better products services or they engage in
partnerships which ultimately assist in poverty alleviation
28 Models for Working with the BOP
Simanis Duke and Hart (2008) in their article presented three models for investing
with the BOP These models by Simanis et al (2008) are the Provider model the
Empowerment model and the Equal Partnership model described by Willie and
Barham (2009) below
bull The Provider model or lsquoBasic Needsrsquo model is where companies match
community needs with their products to discover new markets
Affordable and high quality products are sold to the poor These
products are based on customs within communities hence providing a
benefit and advancing market development
bull The Empowerment model or lsquoEmpowerment and participationrsquo model
creates localised products and services based on the unique needs and
conditions of the poor community There is dialogue between the
business and potential customers although initiated by the former
Through the active participation of the poor they are likely to build or
develop new capabilities
bull The Equal Partnership model or lsquoNew Commonsrsquo school aims to share
initiatives with the community on equal terms so that results are
embedded in the community The businesses aim to improve a whole
range of areas which would make life worthwhile Both the business
and the community harness their capabilities resources and creativity
The process aims to build a deep base of entrepreneurship and
management capability within the community The approach is
enhanced through a process of engagement that changes the terms of
the relationship between the business and the community
37
In their discussion on the models above Willie and Barham (2009) emphasise the
need for the Equal partnership model such as that of the BOP Protocol Model by
Simanis and Hart (2008b) The involvement of the local BOP in every step of the
investment as partners and co-creators almost ensures success due to the shared
ownership and responsibility of the initiative The BOP Protocol is based on the
assumption that poor communities are resource rich full of skills and highly
competent This ability of local communities combined with the companies can
result in an original business opportunity to serve the community
London Anupindi and Sheth (2010) in their analysis of 64 ventures serving BOP
producers found three common themes proposed earlier by Willie and Barham
(2009) Firstly they found that in overcoming constraints the ventures built trust
and long-term relationships with BOP producers and other partners Secondly all
the ventures demonstrated opportunity for mutual value creation Technological
and economic limitations were noted to work against mutual value creation
Finally most of the ventures collaborated with socially oriented organisations
(such as NGOs) that require the creation of adequate local value
Willie and Barham (2009) in comparing the BOP protocol and the two other
models (Empowerment and Provider models) state the need for all three models
because of the different companies goals Some companies may be working to
provide a base for the future others may be philanthropic and others may be using
the process as part of its corporate social responsibility or public relations and
finally some may be looking to make a profit
The partnership model takes time to set up and for the business to make a profit
The first two models are based on the presumption that the company knows what
the community needs or wants Taking these in consideration Willie and Barham
(2009) stress the need for all three models to be dynamically integrated due to the
large number of the poor who need urgent action Additionally corporations may
not be willing to wait for the slow process of implementing the third Equal
38
Partnerships model All models need to operate together if the UN Millennium
Development Goals are to be achieved
Anderson and Markides (2007) propose the need for innovation at the BOP in
developing markets through their ldquoFour Arsquos (p84) framework affordability
acceptability availability and awareness
bull ldquoAffordability is the degree to which a companyrsquos goods or services are
affordable to consumers at the low end of the marketrdquo (ibid p 84) The
offerings must be at a price point that enables consumption by even the
poorest The example cited here was of Smart Communications in the
Philippines with small denomination mobile airtime Honda in India with
their generators as prizes (for shopkeepers in a lottery) and Tata
Motorsrsquo low cost car
bull Acceptability is the extent to which consumers in the value chain are
willing to consume distribute or sell a product or service Companies
respond to specific needs nationally or regionally either cultural or
socio-economic or respond to unique requirements of local businesses
Hindustan Leverrsquos shampoo for women in India and the Haier Grouprsquos
multipurpose washing machine in China are examples of modifying
products for local acceptability Examples of note of innovations in
distribution are the Eveready Industries India van-distribution system
and Avon Products sales women in Brazil
bull Availability is the level to which the product or service can be acquired
and used ldquoStrategic innovators are resourceful about distributing or
delivering products and services to the most isolated communitiesrdquo
(ibid p 84)
bull Awareness is the customerrsquos level of knowledge about a product or
service Conventional advertising may not reach poor customers
Companies need to use other modes and methods of communication
39
Smart Communications of the Philippines used modes such as
billboards visits to tertiary education institutions dealer recruitment and
dealer training in low income communities
Therefore companies in developing markets such as South Africa find gaps in the
industry-positioning map they go after them and exploit the opportunities just as
they do in developed markets (Anderson and Markides 2007)
29 Conclusion
The aim of this research is to investigate the extent of involvement of businesses
and their actions thereof in an emerging market such as South Africa Uplifting the
BOP (poor) in South Africa would have a positive impact on the macro-economic
situation in the country and this literature review has demonstrated the specific
principles that could be adapted for the South African context
The following partnership model was developed for the South African context
drawing information from the literature The model has been designed for the
retail-banking sector in South Africa The other partners are the poor or BOP with
government and NGOs as intermediaries or facilitators The model in Figure 5
describes the critical requirements from each partner or intermediary for the
success of an alliance or partnership between the BOP and Banks
In terms of the Bank as a partner the important features are expanded on below
The banks commitment of resources involves the full allocation of funds
consistent application of resources a long-term view sustainability (both
economic and environmental) and the allocation of a specific commercial unit to
the partnership Careful and experiential preparation in developing the
40
partnership due to the high risk involvement for the long run to understand the
situation of the poor and a deep understanding of local community circumstances
Value creation is through new market opportunities improved or increased
profitability the increase in shareholder value the social responsibility of business
to the community the economic value add to society and the improved reputation
of the business
Innovation takes place with low cost simple and local technology processes or
products Products or services should be inexpensive and appropriately priced
with the creation of markets for these products There is high risk to the business
due to finances involved or allocated with the resulting profits expected later
rather than earlier and all parties (bank BOP NGOs and government) responsible
for the long-term success of the partnership There is need for economic and
environmental sustainability due to the social responsibility of business to
alleviate poverty and ensure the careful use of scarce resources
The following aspects important for the BOP are discussed below
The BOP are to be considered as producers forming alliances or partnerships and
involving entrepreneurship at their level Skills development involves training to
acquire management capabilities and unlimited access to information All parties
jointly hold responsibility of the partnership or venture success with ownership split
between the bank and the BOP entrepreneur
Poverty alleviation takes place as an incentive for action by the BOP with the
need for an enhanced quality of life Local solutions are required through building
local capacity to produce and innovate at the level of the poor and so empowering
them The South African BOP demonstrate collectivism in their economic
activities and so should be viewed as households and not individuals
41
Important features for government involvement in the partnership are discussed
below
Figure 5 The Equal Partnership Model for the Economic Involvement of the BOP
Government support creates local value through its delivery or distribution
networks at grass root level and acting as agents on the ground to understand the
needs of the BOP A coalition with business will assist in dealing with specific
needs of communities for co-operation or advice and for the long-term success of
42
the business Governmentrsquos role is to regulate and monitor the partnerships for
fairness and to simplify difficult processes for progress Ultimately the goal is
national economic growth through investment job creation tax revenue
generated poverty alleviation application of human rights and the reputation of
the country
The NGOrsquos role in the partnership covers the following aspects
The NGO acts as an intermediary to better understand the BOP (cultural
financial technical education and infrastructure) and forms embedded ties
between the BOP government and business as agents on the ground for delivery
or distribution and creating value in communities The upholding of human rights
requires that fairness in treatment of the BOP poverty alleviation and societal
problems be addressed The NGO would focus on the need for training including
skills development entrepreneurship and basic management skills for the success
of the venture Sustainability of the venture or partnership would require
environmental and resource protection by delineating responsibilities to all parties
for the long-term success of the venture
All the aspects described above are important for the successful application of the
equal partnership model
43
CHAPTER 3 RESEARCH PROPOSITIONS
Zikmund (2003) defines a proposition as a statement concerned with the
relationships among concepts A proposition describes the logical linkage between
certain concepts by asserting a universal connection between concepts
31 Collectivism As per Chipp and Corder (2010a) and Corder and Chipp (2010b) the base of the
pyramid (BOP) should be defined empirically for South Africa Defining the BOP in
terms of individual earnings would not work in the South African society that
displays collectivism when dealing with earnings and money spent There is a
need for managers to understand this aspect of collectivism and the resulting
actions by households rather than individuals A deep understanding of household
decisions in earnings and spending will provide managers and marketers the
ability to devise actions for tapping into this market The aim of the proposition
below is to determine the level of manager awareness regarding the collectivistic
nature of the poor
311 Proposition 311 The poor in South Africa demonstrate collectivism in their economic activities and are recognised as households and not individuals in developing partnerships with a bank
32 Bank activities Simanis and Hart (2008b) stress the need for business and the BOP to come
together as partners and co-creators to ensure success of a BOP venture due to
44
the shared ownership and responsibility of the initiative It is essential for mutual
value creation in partnerships with the BOP as specified in Figure 6 below The
aim of this study is to determine the level of activities by retail banks at the level of
the BOP The results of this study are expected to assist banks in defining areas
for improvement in penetrating these low income markets
Figure 6 Bank Activities in the Equal Partnership Model
321 Proposition 321 Banks or branches need to commit long-term resources to a partnership at the level of the poor
322 Proposition 322 Banks need to experiment with different business models and prepare well before going into an equal partnership venture with the poor
45
323 Proposition 323 For a partnership venture with the poor there should be value created for the bank at multiple levels such as increased profitability and improved reputation These areas of value for the bank are
bull Increase in the number of customers and resulting revenue
bull Increase in the value of the bank to shareholders
bull Increased social responsibility of the bank to the poor
bull Improvement in reputation to society
324 Proposition 324 There needs to be innovation by the bank in a simple technology new process or innovative product or service for a partnership with the poor
325 Proposition 325 There is high financial risk for the bank in investing in the poor
326 Proposition 326 The business or partnership with the bank should be economically and environmentally sustainable for alleviation of poverty and careful use of scarce resources These scarce resources required by the poor are money electricity clean water and other raw materials
46
CHAPTER 4 RESEARCH METHODOLOGY
This chapter presents the research philosophy approach design population
sample selection and data collection tools used to address the problem as
outlined in Chapter one In addition possible limitations to the study will be
discussed
41 Research Classification
This study aimed to determine the applicability of the equal partnership model for
BOP engagement in the South African economy Different aspects were drawn
from literature to develop the equal partnership model as described in Figure 5
(Chapter 2) Case studies of BOP strategies such as those of Cemex Tetra Pak
Unilever Telenor Digicel and Nike have been mentioned in most literature
(Sanchez et al 2006 Warnholz 2008) Some BOP strategies have been
successful (Cemex Tetra Pak Unilever Telenor and Digicel) and others failures
(Nike)
The research design was both quantitative and descriptive in nature The purpose
of this study was to produce information which reduced uncertainty (Zikmund
2003) about South African business activities in the area of the BOP As stated by
Zikmund (2003 p 55) descriptive research aims to answer questions such as
ldquowho what when where and howrdquo by way of a survey questionnaire Quantitative
approaches especially surveys of individual responses are often more practical in
terms of time and cost (Wreathall 1995)
47
42 Research Design Descriptive research was chosen for this investigation because of the previous
qualitative and quantitative work done in the area of business and the BOP The
aim of this research was to expand on previous qualitative studies done in the
area of the BOP and business Quantitative analysis was selected to test
theoretical predictions with precise measures of variables (Tharenou Donohue amp
Cooper 2007) As stated by Zikmund (2003) descriptive research studies are
based on some prior understanding of the problem The aspects of the relationship
of those involved in the partnership model with the BOP were tested in this
research
43 Data Gathering Process
The method used in gathering data is through a survey Zikmund (2003 p175)
defines the survey as ldquoa method of gathering primary data based on
communication with a representative sample of individualsrdquo The information was
gathered by way of a telephonic interview with a structured questionnaire The
quality of this data may be comparable to data obtained through personal interview
(Zikmund 2003) According to King (1994) interviews are appropriate when the
researcher wants to see the topic from the perspective of the interviewee and to
see how or why the interviewee comes to have this perspective Zikmund (2003)
stressed that respondents may be more willing to provide detailed and reliable
information over the telephone than through personal interviews Seidman (1996)
stated that structured interviews are composed of completely pre-set standardised
questions which are normally closed-ended
Surveys are extremely valuable to academics and managers when conducted
properly (Zikmund 2003) The choice of survey for this study was the telephone
interview due to the time limitations of this study and due to the flexibility of its
48
application to studies such as the current one Telephone interviewing was chosen
because of ease of access to the respondents who were branch managers of
banks The availability of these managers for personal interviews was questioned
and the travelling cost for face-to-face interviews was a restriction For this study
a detailed structured questionnaire was designed to draw out the different
relationships being tested in the partnership model for BOP involvement
44 Questionnaire Design
The instrument used in this survey was a questionnaire designed from a literature
survey of the subject area For the design of a new instrument the principles of
questionnaire and scale construction was investigated (Mouton 2009) A
questionnaire is relevant if no unnecessary information is collected and if the
information needed to elaborate on the problem is obtained The accuracy of a
questionnaire is determined by ensuring it is valid in that it must measure and
predict relevant criteria of the construct (Tharenou et al 2007)
In this research a multiple measures approach as recommended by Tharenou et
al (2007) was used to determine if a number of measures converge for evidence
of construct validity The questionnaire has been included (see Appendix 3)
The survey was carried out telephonically using a structured questionnaire The
questionnaire was designed to ask questions that are more general and then focus
on specific questions This funnel technique (Zikmund 2003) of asking general
questions before specific questions was carried out to avoid biased responses
The approach used in designing the questionnaire followed the general principles
outlined by Foddy (1993) Questions for telephone surveys must be less complex
versus questions used in personal interviews because there is less time for
elaboration or explanation
49
Social desirability error or response (Richman Kiesler Weisband and Drasgow
1999) is the tendency for a respondent to choose the socially desirable response
whether true or not The respondent wishes to represent himself or herself in a
favourable light no matter what they actually feel about an issue or topic and
would contaminate any results obtained Acquiescence response is the tendency
for respondents to agree to positively phrased questions regardless of the content
(Spector 1987) The correct design and application of the structured questionnaire
would reduce the occurrence of the above response errors
441 Pre-testing of the Questionnaire Pre-testing of the questionnaire was done in order to refine categories and clarify
other questions that were initially unclear and needed both refinement and
improvement In addition pre-testing ensured that the questionnaire timing was
appropriate As a result of the pre-test definitions were simplified to make them
more understandable These simplified definitions were presented during the
process of questioning by stating them prior to asking the questions pertinent to
them
442 Scale
Attitude is a complex and difficult to define concept (SAARF 2010 Zikmund
2003) Attitudes as described by Zikmund (2003) are an enduring disposition to
respond consistently in a given manner to various aspects of the world including
persons events and objects However attitudes are subject to change in shorter
periods in comparison to values and traits The three components of attitude are
affective cognitive and behavioural The affective component relates to an
individualrsquos general feeling or emotions to an object The cognitive component
represents onersquos awareness of and knowledge about an object The behavioural
50
component represents a predisposition to action including both intentions and
behavioural expectations
Attitudes can be measured using the ranking rating sorting or choice techniques
The function of an attitude scale is to locate an individualrsquos position on a
continuum (Zikmund 2003) This study focuses on the cognitive component of
attitude and so a rating scale was used A Likert type scale was used in this study
During the survey ldquorespondents indicate their attitudes by how strongly they agree
or disagree with carefully constructed statements that range from very positive to
very negative towards the attitudinal objectrdquo (Zikmund 2003 p312) As described
by Tharenou et al (2007) there are numerous benefits in using multi-item
measures in research Some of these benefits are superior validity and composite
scores can be used to represent the construct of interest Respondents were
asked to rate the magnitude of awareness and knowledge in a specific area
To measure the attitudes and for data analysis purposes a weighting score was
attached to each response The scale was biased towards the positive because it
was expected that most managers would respond in a positive manner This bias
in scaling was effected to give a larger range of more positive answers The
neutral option was not included in this scale to force the respondents to take a
stance Scoring was carried out as described in Figure 7 below Weightings were
attached based on the questions asked
Figure 7 Likert Type Scale Used for this Study
51
45 Unit of Measure The unit of analysis chosen was the retail (or personal) bank manager of branches
belonging to the three bank groups in South Africa These banks included the
Amalgamated Bank of South Africa (ABSA) Standard Bank and Nedbank Each
bank managerrsquos response was considered as an individual data source (Tharenou
et al 2007)
46 Population Zikmund (2003) described the need for selection of the appropriate target
population to ensure that the data collected is from the correct source
Respondents were identified from the retail-banking sector in South Africa which
has recently been involved with the BOP The target population consisted of all
retail bank managers of three banks in South Africa (ABSA Standard Bank and
Nedbank) Geographically the population covers all the nine provinces in South
Africa These market-oriented organisations provide a robust investment plan and
strategy for the anticipated BOP market Such organisations have modelled their
business practices around economic environmental and social spheres with the
goal of doing good while being profitable
The banking sector in South Africa has recently launched an industry wide project
the lsquoMzansi initiativersquo to involve the ldquounder-banked and un-bankedrdquo in society by
providing cost effective products to the entry level account holder and the informal
sector (Standard Bank 2009 p17) Standard bank (2009) has launched a new
banking model to extend affordable and accessible financial services to the
underserved market which includes low-income earners and the informal sector
This model combines cell phone banking community retailers and community
banks without the need for a physical branch and automated teller infrastructure
ABSA (2009) planned to launch new low-cost channels and basic banking
52
products in 2010 to grow value from the entry-level group of the South African
population
The total number of branches of the three banks was estimated at 1600 (ABSA
2010 Standard Bank 2010 Nedbank 2010)
47 Sampling Method and Size The purpose of statistics is to describe the characteristics of a population or
sample and to generalise from the sample to the population (Zikmund 2003) The
principle of sampling was to obtain a large enough sample of retail banking branch
managers to be able to generalise the findings to draw conclusions and make
recommendations to the whole population of retail banking branch managers
Albright Winston and Zappe (2006) encouraged researchers to obtain as large a
sample as possible to reduce sampling error In doing so the authors
recommended compromising the sample size considering the opposing forces
The opposing forces to consider were those of the cost of sampling the timely
collection of data and non-sampling error
In this study the main issue of concern was the time spent in collecting the data
considering that the method selected was of a telephone survey
Zikmund (2003) prescribed the following three factors in determining sample size
bull Variance or heterogeneity of the population which is an estimate for the
standard deviation of the population
bull Magnitude of acceptable error and
bull Confidence Level
53
The following method was used to determine a sample size for a proportion of a
population (Zikmund 2003) See Figure 8 below
Figure 8 The Equation Used to Calculate the Sample Size
n = number of items in the sample
Z2 = square of a confidence level of 196 in standard error units
p = estimated proportion of successes or the response rate which was
assumed to be 50 or in this case 050
q = 1-p or estimated proportion of failures 050
C2 = square of the maximum allowance for error between the true proportion and
the sample proportion where C represents the confidence interval of 005
With the above values n = 384 but due to the time limitation of the study a
sample size 150 was used In addition to conduct an exploratory factor analysis
Guadagnoli and Velicer (1988) recommend between five to ten cases (or
respondents) per item for a stable solution With 16 items on the questionnaire the
sample ranged from 80 (5 times 16) to 160 (10 times 16) Hinkin (1995) suggested
150 observations as a minimum This sample of 150 respondents gave a
confidence interval of 8 According to Albright et al (2006) and Zikmund (2003)
the confidence interval is the probability of the true population parameter being
incorrectly estimated In this study the value of 8 was used versus the 5
standard In other words with a response of 50 the true response rate would lie
somewhere between 42 (50 - 8) and 58 (50 + 8) in 95 cases out of
100
54
The sample was of the probability type because it was based on some random
procedure of selection A systematic random sampling technique was used for this
study (Zikmund 2003) In systematic random sampling the population is listed
according to some criteria (such as alphabetical) an interval is determined based
on the sample required and finally one item is randomly selected within that
interval as a starting point
For this study to ensure a proportional sample from each bank group (ABSA
Standard Bank and Nedbank) the population of bank branches within each group
was listed alphabetically after stratification by bank (Zikmund 2003) An interval
was then determined by dividing the total number of branches of the three banks
by the sample size required of 150 The sample was then drawn according to this
interval after a random start
48 Analysis Approach Data collected has little or no value as data and extracting meaning from this data
is important (Babbie 2005) Zikmund (2003 p473) refers to descriptive data as
ldquothe transformation of raw data into a form that will make them easy to understand
and interpretrdquo The three main stages of data analysis were performed as
prescribed by Tharenou et al (2007) These included data management prior to
data entry initial data analysis to check suitability of the data after data entry and
finally the data analysis to test the propositions
481 Capturing of Data
Data was captured manually on survey questionnaires following the procedure
described by Tharenou et al (2007) Before entering the data on an electronic
spreadsheet all questionnaires were numbered by source bank (andor province)
checked for missing data (for a decision to include in the data entry or not) the
55
data was coded and then only was the data transferred on to a Microsoft Excel
spreadsheet Analysis of the data was then carried out using both Microsoft Excel
and NCSS 2007 statistical software
482 Descriptive Statistics
The data obtained from the survey will be analysed using descriptive statistics
such as frequency tables quadrant analysis and box-and-whisker plots (Babbie
2005) Descriptive statistics is concerned with the explanation and summarisation
of data obtained for a unit of analysis (Welman amp Kruger 2001) In analysing and
interpreting the results of the survey a comparison of the descriptive statistics was
undertaken to make the results more meaningful The different banks were
compared According to Welman and Kruger (2001) without comparative data a
survey is of little or no use
483 Multivariate Analysis
Multivariate analysis was carried out on the data to draw a relationship between
the different variables listed below in Figure 9
Multivariate analysis assesses the relationships among three or more variables
(Tharenou et al 2007) An exploratory factor analysis was undertaken for the
purpose of analysing scores from the variables to see if they could be reduced to
underlying dimensions According to Tharenou et al (2007) the most common
method of exploratory factor analysis in organisational research is principal
component analysis (PCA) The goal of PCA is to arrive at a relatively small
number of factors or components that will extract most of the total variance from a
large set of variables
56
Principal components analysis (Hinkin 1995) was performed on the raw data to
identify factors or underlying perceptual dimensions
Figure 9 Variables Related to the Partnership of the Bank with the Poor
49 Limitations of the Study The following limitations were expected in this study
bull Restricting the population to the three major banks limited the projection of
data beyond this population (Zikmund 2003)
bull The ability of the interviewer to ensure that the interviewee understood the
questions and that the resulting responses were valid
bull Non-response error due to the managers approached refusing to participate
in this survey Access to the population was an issue because of the level of
the managers in the business that were targeted Getting the branch
managers on the telephone did prove difficult
57
bull Response bias was prominent in this research due to the unfamiliarity of the
subject area the use of extremes when responding and by the desire of the
respondents to appear socially right when responding (also known as the
social desirability bias)
58
CHAPTER 5 RESULTS
51 Introduction This section reviews the results of the telephonic survey The data on the
responses to the questions are compared to expected values in order to evaluate
the propositions This evaluation of the responses was undertaken to determine
the awareness of bank managers to activities taking place in their businesses
Support by managers of the aspects queried in the questionnaire indicates
familiarity and action by the banking sector in the area of the BOP In this manner
the model described in Chapter 4 (Figure 9 page 56) would be tested
Commentary is given on the inter-relationship of questions or attributes through a
correlation analysis This inter-relationship could give insight or understanding into
underlying perceptual dimensions These commonalities are then uncovered
through a best-fit factor analysis After identifying the underlying perceptual
dimensions (or factors) the different groups are tested for significant difference
between them The different groupings are of age gender race and bank
52 Response Rate and Demographics
Of the initial sample of a 158 113 (or 71) were willing to respond In three cases
two questions were omitted The response rate was highest for Nedbank (88)
then ABSA (71) and finally Standard Bank (58) Most respondents were
female (69) In terms of racial groupings the highest response was from whites
(43) next were blacks (30) and finally Coloured or Asian (27) Most
respondents were aged 35 to 49 years (59) Of the sample personal and business banking constituted the higher proportion (65) then personal banking (31) and finally business with the lowest proportion (4)
59
The general demographics of the sample are reported in Appendix 4 through
tabular and graphical representation (see Tables 13 to 17 amp Figures 17 to 21)
53 Evaluation of Propositions
The propositions were evaluated on a one sample two-tailed t-test Based on the
four point Likert Scale (see Figure 10 below) a mean score of two (20) was set as
the expected response to the questions This expected average was selected to
determine if any responses were biased towards the top end of the scale or
bottom end of the scale A one sample two-tailed t-test was used to compare the
mean of the response to each question to the expected mean of two
Figure 10 Likert Type Scale used for this Study
1
Disagree
2
Slightly
Agree
3
Agree
4
Strongly
Agree
531 Proposition 311 The poor in South Africa demonstrate collectivism in their economic activities and are recognised as households and not individuals in developing partnerships with a bank Results to the question on the recognition of the poor as households and not
individuals (Question 6a) indicated that there was no significant difference (p gt
005) between the response with a mean of 215 (slightly above 20) (see Table 4
above) Hence the proposition was not supported
60
Table 4 The One Sample Two Tailed T-test on Results for Proposition 311
One-Sample Statistics Test Value = 2
95 Confidence
Interval of the Difference
Question N Mean Std Dev
Std Error Mean
t df Significance (2-tailed)
Mean Difference Lower Upper
6a Households 113 215 1063 01 1505 112 0135 015 -005 035
6c Financial Decisions 113 227 0954 009 2957 112 0004 0265 009 044
In terms of the poor making financial decisions collectively (Question 6c) there
was a significant difference (p lt 005) between the response mean of 227 than
that expected (20) (see Table 4 above) This response to collective financial
decisions was more inclined towards the positive end of the scale and so
supporting the proposition
532 Proposition 321 Banks or branches need to commit long-term resources to a partnership at the level of the poor In terms of allocation of resources (such as funds and teams to deal with
partnerships with the poor) there was a significant difference (p lt 005) in the
responses in both cases in comparison to the expected response (see Table 5
below) Both responses of allocation of funds and of allocation of teams to deal
with partnerships were directed more to the positive end of the scale
61
Table 5 The One Sample Two Tailed T-test on Results for Proposition 321
One-Sample Statistics Test Value = 2
95 Confidence Interval of
the Difference
Question N Mean Std Dev
Std Error Mean
t df Significance (2-tailed)
Mean Diff Lower Upper
7a Allocation of funds
111 253 098 0093 5714 110 0000 0532 035 072
7b Allocation of teams
111 25 098 0093 5324 110 0000 0495 031 068
533 Proposition 322 Banks need to experiment with different business models and prepare well before going into an equal partnership venture with the poor Table 6 The One Sample Two Tailed T-test on Results for Proposition 322
One-Sample Statistics Test Value = 2
95 Confidence Interval of
the Difference
N Mean Std Dev
Std Error Mean
t df Sig (2-tailed)
Mean Difference Lower Upper
8a Experimental relationships
112 283 0746 007 1178 111 000 083 069 097
8b Understanding poor
110 264 0864 0082 772 109 000 0636 047 08
62
The response to experimenting with different models in dealing with the poor was
significantly different (p lt005) to the expected response The response was
strongly inclined to the positive end of the scale
In preparing well by understanding the poor was significantly different (p lt 005)
to the expected response towards the positive end of the scale Both responses
supported the proposition
534 Proposition 323 For a partnership venture with the poor there should be value created for the bank at multiple levels such as increased profitability and improved reputation
Table 7 The One Sample Two Tailed T-test on Results for Proposition 323
One-Sample Statistics Test Value = 2 95
Confidence Interval of the
Difference
N Mean Std Dev
Std Error Mean
t df Sig (2-
tailed)
Mean Difference Lower Upper
9a Increased customers 112 259 0844 008 7387 111 000 0589 043 075
9b Increased shareholder
value 112 255 0899 0085 6518 111 000 0554 039 072
9c Social responsibility 112 321 065 0061 19779 111 000 1214 109 134
9d Reputation 112 316 0578 0055 21246 111 000 1161 105 127
In terms of value creation for the bank through partnerships with the poor the four
responses were all significantly different (p lt 005) to the expected mean of 20
63
(see Table 7 above) The responses to an increase in customers and the increase
in shareholder value were oriented to a positive response
There was a strong inclination to a positive response for the social responsibility of
the bank and the improved reputation of the bank All responses to these
questions (9a 9b 9c and 9d) supported the proposition
535 Proposition 324 There needs to be innovation by the bank in a simple technology new process or innovative product or service for a partnership with the poor Both responses to innovation by the bank using simple technology for product and
services for the poor were significantly different (plt 005) to the expected (Table 8
below) In terms of using technology to deliver a product or service the response
was towards the positive end of the scale and supporting the proposition The
same was true for using technology to price services and goods for the poor
Table 8 The One Sample Two Tailed T-test on Results for Proposition 324
One-Sample Statistics Test Value = 2 95
Confidence Interval of the
Difference
N Mean Std Dev
Std Error Mean
t df Sig (2-
tailed)
Mean Difference Lower Upper
10a Product technology 112 285 0808 0076 11113 111 000 0848 07 1
10b Price technology 112 29 0735 0069 12989 111 000 0902 076 104
64
536 Proposition 325 There is high financial risk for the bank in investing in the poor Table 9 The One Sample Two Tailed T-test on Results for Proposition 325
One-Sample Statistics Test Value = 2
95 Confidence
Interval of the Difference
N Mean Std
Deviation
Std Error Mean
t df Sig (2-
tailed)
Mean Differenc
e
Lower
Upper
11a Later profitability 111 287 0776 0074 11865 110 0000 0874 073 102
In the response to the financial risk involved in investing in partnerships with the
poor there was significant difference (p lt 005) to the expected result of 20 (see
table 9 above) The response to later profitability linked to higher risk was more
inclined to a positive response in the Likert scale hence supporting the
proposition
537 Proposition 326 The business or partnership with the bank should be economically and environmentally sustainable for alleviation of poverty and careful use of scarce resources These scarce resources required by the poor are money electricity clean water and other raw materials In terms of the responses to sustainable use of resources in alleviation of poverty
and the careful use of scarce resources by the poor they were both significantly
different (p lt 005) to the expected mean (see Table 10 below) In both cases of
65
poverty alleviation and resource use the responses were strongly oriented to the
positive end hence supporting the proposition
Table 10 The One Sample Two Tailed T-test on Results for Proposition 326
One-Sample Statistics Test Value = 2 95
Confidence Interval of the
Difference
N Mean Std Dev
Std Error Mean
t df Sig (2-
tailed) Mean
Difference Lower Upper
12a Poverty alleviation 112 318 0661 0062 18883 111 0000 1179 105 13
12b Resource use 112 296 0709 0067 14386 111 0000 0964 083 11
538 BOP as a profitable market
Table 11 The One Sample Two Tailed T-test on Results for the BOP as a Profitable Market
One-Sample Statistics Test Value = 2 95
Confidence Interval of the
Difference
N Mean Std Dev
Std Error Mean
t df Sig (2-
tailed) Mean
Difference Lower Upper
6b Profitable market
113 273 0897 0084 8708 112 0000 0735 057 09
The response to the BOP as a profitable market was significantly different (p lt
005) to the expected response The response supported the question on
profitability of the business when dealing with the poor
66
54 Relationships between the Attributes The relationship between attributes was assessed using correlation coefficients
The correlation coefficients calculate the strength of the linear relationship
between the different attributes or items
The results indicated a strong relationship between the attributes of an increase in customer base and an increase in shareholder value (with a correlation of
06) In addition findings implied a strong relationship between the attributes of
technology used in product or services to derive value and the attribute of technology used to reduce the price of the product or service (with a
correlation of 06)
There was a medium strength (or a correlation of 05) relationship indicated
between the attributes of allocation of funds and allocation of teams from the
responses in the area of commitment of resources The same relationship (or
correlation of 05) was found for the responses between the attribute of
experimenting in mutually beneficial relationships with deep understanding of the poor and with an increase in profitable customers
In addition a medium strength relationship (or correlation of 05) was indicated
from the responses between the attributes of improved reputation of the branch
with social responsibility of the bank and the alleviation of poverty The final
relationship of note was between the alleviation of poverty and the careful use of resources with a correlation of 05 (refer to Table 19 Appendix 5)
Other attributes tended to be independent (refer to Table 19 Appendix 5)
67
55 Metric Multi-Dimensional Scaling (MMDS) According to Agarwal Lanckriet Willis Kriegman Cayton and Belongie (2007)
ldquomultidimensional scaling (MDS) refers to the general task of assigning Euclidean coordinates to a set of objects such that given a set of dissimilarity similarity or ordinal relations between the objects the relations are obeyed as closely as possible by the embedded points hellipMultidimensional scalinghellipmetric algorithmshellipseek an embedding with inter-point distances closely matching the input dissimilaritieshelliprdquo (p 2)
In order to get a clearer understanding of the inter-relationships between the
attributes metric multi-dimensional scaling was carried out on the correlation
coefficients after subtracting them from one (see Table 20 Appendix 5) A map of
attributes was then drawn which visually displays items with high loadings
Attributes with high correlations will tend to be closer together and vice versa (see
Figure 11 below)
56 Factor Analysis In order to get insights into underlying perceptual dimensions a principal
component analysis (PCA) was carried out on the data PCA is a process that
allows for the verification of whether an item within a factor has significance in
relation to other items in the same factor (Tharenou et al 2007) Firstly the
eigenvalues were determined (see Table 12) and based on the eigenvalues two
three four and five factors were examined
On the basis that eigenvalues were greater than one and on marketing sense a
five-factor solution was determined as the optimal solution (see Table 21
Appendix 5)
68
Figure 11 Metric Multi-dimensional Scaling Map of Attributes
Table 12 Factor Variance as determined by Eigenvalues
Component Initial Eigenvalues Extraction Sums of Squared Loadings
Total of Variance
Cumulative Total of
Variance Cumulative
1 4764 29774 29774 4764 29774 29774 2 156 9752 39527 156 9752 39527 3 1316 8223 47749 1316 8223 47749 4 1214 7587 55336 1214 7587 55336 5 1044 6526 61862 1044 6526 61862 6 0902 5635 67498
69
Factor one has the highest loadings for
bull Increased shareholder value
bull increased customers
bull experimental relationships
bull understanding the poor
bull allocation of funds and
bull allocation of teams
This factor refers to the dimension of enhancing stakeholder value through
collaboration with the poor Stakeholders include customers shareholders
employees partners government local communities and the public Processes
need to be in place for an inclusive partnership with the poor
Factor two has the highest loadings for
bull Resource use
bull Product technology
bull Price technology and
bull Poverty alleviation (shared with factor three)
Factor two could be described as the dimension of customising solutions for the
poor In other words this involves the alleviation of poverty through co-inventing
solutions for the poor using technology and available scarce resources
Factor three has the highest loadings for
bull Poverty alleviation (shared with factor two)
bull Reputation
bull Social responsibility
bull Households
70
The dimension for factor three covers the aspect of the public perception of the
business The business needs to be viewed as socially responsible with the
intention of understanding the poor in the process The result would be the
alleviation of poverty and the consequential improved reputation for the business
Factor four has the highest loadings for
bull Financial decisions
bull Later profitability
Factor four could be described as the dimension of financial risk in understanding
how the poor make financial decisions and the expected returns from dealing with
the poor
Factor five has a high loading for
bull Profitable market
Factor five is simple and explains that there is a profitable market at the BOP
The factors are then identified on the map by grouping items with high loadings as
seen in Figure 12 below
The lengths of the two dimensions are very similar in the plot (about four units
wide) If the one dimension were longer than the other then the former dimension
would be more important in describing the differences between the factors If the
attribute of ldquoHouseholdsrdquo was ignored then dimension one (four units wide) would
describe the differences in factor more than dimension two (25 units wide)
71
Figure 12 Metric Multi-dimensional Scaling Map of Attributes with Factors
57 Reliability An internal consistency method of establishing reliability was used namely
Cronbachrsquos alpha coefficient When Cronbachrsquos alpha for a factor is above 07
then it is statistically possible that the items within a factor are strongly related to
each other or they are consistent with each other (Tharenou et al 2007)
72
Cronbachrsquos alpha of 079 was determined for Factor 1 consisting of six items
(Table 22 Appendix 5) These items included
bull Increased shareholder value
bull Increased customers
bull Experimental relationships
bull Understanding the poor
bull Allocation of funds
bull Allocation of teams
Even with individual items deleted (Table 22 Appendix 5) the Cronbachrsquos alpha
values were above 07 (ranging from 075 to 078) indicating a strong relationship
between the different items and of the items with the scale total
Cronbachrsquos alpha of 072 was determined for Factor 2 consisting of four items
(Table 23 Appendix 5) These items included
bull Product technology
bull Price technology
bull Resource use
bull Poverty alleviation
When individual items were deleted (Table 23 Appendix 5) Cronbachrsquos alpha
values ranged from 064 to 070 indicating a strong relationship between the
different factors The exclusion of any one item did not result in a higher
Cronbachrsquos alpha representing reliability between the items
A low Cronbachrsquos alpha was determined for Factor 3 (of 044) consisting of three
items (Table 24 Appendix 5) These items included
bull Reputation
73
bull Social Responsibility
bull Household
When ldquoHouseholdsrdquo was removed (Table 25 Appendix 5) Cronbachrsquos alpha value
increased (to 063) indicating a better relationship between the two other items
ldquoreputationrdquo and ldquosocial responsibilityrdquo Therefore the item ldquohouseholdsrdquo does not
appear to fit well in this factor
Cronbachrsquos alpha for Factor 4 was very low (at 030) and consisted of the two
items (Table 26 Appendix 5)
bull Later profitability
bull Financial decisions
There appears to be a weak relationship between the two items
The fifth factor only had one item ldquoprofitable marketrdquo so no internal consistency of
reliability was determined
58 Differences Between Groups In order to find out if there was a significant difference in the scores on the five
factors for men and women younger (under 35) and older (over 35) people race
groups (Black Coloured Indian Asian White) and bank (ABSA Nedbank and
Standard Bank) a one-way ANOVA (analysis of variance) was used (Tharenou et
al 2007)
The results showed that on Factor one men (mean = 285) scored significantly
higher (p lt 005) than women (mean 25) See Table 27 Appendix 5 for additional
data
74
For Factor four the results showed that the Black (mean 232) groups scored
lower than the Coloured Indian or Asian (mean = 265) and the White group
(mean = 270) There was a significant difference (p lt 005) in means within factor
4 but from the previous analysis on reliability Factor 4 scored a very low
Cronbachrsquos alpha Therefore this data was interpreted with caution (see Table 28
Appendix 5)
The results showed that on Factor one there was a significant difference (p lt
005) in the means of the two age groups of less than 35 years old (mean = 288)
and greater than 35 years old ( mean = 246) See Table 29 Appendix 5
In comparing the means of the different bank groups for Factor one the results
showed that there was significant difference (p lt 005) in means between ABSA
(mean = 263) Nedbank (mean = 234) and Standard Bank (mean = 283) See
Table 30 Appendix 5 for more details on the data
75
CHAPTER 6 DISCUSSION
Collaborating with the poor is important for business to capture a larger share of
future opportunities (Hamel et al 1994) In doing so the poor are uplifted
economically and socially Investment in the BOP should be for the elevation of
the BOP from poverty so that it can take part in the economic activity of the
country Both the increased opportunity for business for growth and the economic
involvement of the poor result in the growth of a nation Therefore companies can
boost both corporate and national economic growth by collaborating with the BOP
A partnership model for business with the poor for the South African retail-banking
sector includes
bull The poor or BOP
bull The government
bull NGOs as intermediaries or facilitators
Figure 13 (below) describes the critical requirements from the banking point of
view for the success of an alliance or partnership between the BOP and Banks
61 Bank Activities
Through this research it was evident that managers were conscious of the
environment in which they were operating and they were sensitive to how best to
serve this potential market (the BOP) This awareness indicated involvement of
the banks and their branches in collaborating with the BOP now and in the future
Hence a BOP strategy developed by banks will result in a sustainable
development strategy where ldquodoing businessrdquo will also lead to ldquodoing goodrdquo
(Karnani 2007b)
76
Figure 13 Bank Activities in the Equal Partnership Model
611 The poor in South Africa demonstrate collectivism in their economic activities and are recognised as households and not individuals in developing partnerships with a bank
Before reviewing the results there is a need to review the description of the BOP
in South Africa and some related aspects According to Chipp and Corder (2010a)
the poor in South Africa constitute 36 percent of the adult (16 years and over)
population or 112 million people These people constitute an untapped market To
enter this market businesses need to understand the needs and wants of the
poor Goods and services of value need to be delivered by business to the BOP
(Moore 2006) Corder and Chipp (2010b) defined the South African poor as
households and not individuals This is applicable to financial decision making too
where there is co-operation at household rather than individual level
77
The results of the responses by the bank branch managers indicated little
difference as to whether the poor should be treated as individuals or households
There was a significant shift when understanding how the poor dealt with financial
decisions Managers in the banking sector do support the understanding that the
poor make financial decisions collectively It is possible that bank managers
understand better the collective decision making when it comes to financial
matters and less on household activities
South African low-income groups need to be viewed from a group perspective
such as households in terms of their income and consumption for better
understanding of their wants and needs (Corder and Chipp 2010b) Hence for a
better design of a business approach to the BOP managers and marketers must
understand their market needs perceptions and behaviour (Pitta et al 2008)
612 Banks or branches need to commit long-term resources to a
partnership at the level of the poor
In dealing with resources allocated to working with the poor companies and their
leaders need to recognise that investment of funds and specialised teams will be
for the long-term Willie and Barham (2009) identified the need to set up a specific
commercial unit to engage with the poor and other needy groups Based on the
survey results this does seem to be the case in most banks or branches
According to Altman et al (2009 page 51) these teams need to create alliances
build economically sensitive movements tap the passion and unlock the business
potential of the poor According to Martinez and Carbonell (2007) funds need to
be invested fully and consistently
This research supports the idea of allocating resources such as funds and teams
in the long-term when dealing in partnerships with the poor There was recognition
by the managers of the need for specialised teams and long term funding for the
78
poor Based on the response in this research there does appear to be movement
towards long-term funding and dedicated teams or departments from the banks
and their branches when dealing with the BOP
613 Banks need to experiment with different business models and prepare well before going into an equal partnership venture with the poor
Long-term involvement is required to understand the voice of the BOP consumer
or producer Pitta et al (2008) emphasised that knowing the BOP intimately is the
key to success in joint ventures Managers in the banking sector do seem to
understand the BOP market needs perceptions and behaviours based on
responses in this research These banks are collaborating with agents ldquoon the
groundrdquo as sources of intelligence at grass roots level to understand the voice of
the BOP consumer Hammond and Prahalad (2004) speak of ldquohellipa deep
understanding of local circumstances so that critical features and functionality
hellipcan be incorporatedrdquo (p34) into the design of products and services This
would include Willie and Barhamsrsquo (2009) need for careful and meticulous
planning as one of the many areas that need management attention when
planning ventures with the BOP
Following on with the deep understanding of the BOP markets banks and their
leaders appear to recognise that a different business model will be required in
dealing with the BOP (Pitta et al 2008 Powell 2006) This business model seems
to be developed through experimentation based on the response to the survey in
this research Experimentation can be viewed as a process or discipline consisting
of trial and error directed by insight into which a solution might lie (Geldenhuys
2008) Cash and Pearlson (2005) defined experimentation as a controlled cost
effective iterative approach to learning about potential successes or failures of a
new product service or process Findings indicated support for engaging in
experimentation when innovating and providing products and services to the poor
79
The model recommended (see Figure 5 on page 41) would include aspects of
access to micro-credit (or financial resources) the establishment of alliances or
mutually beneficial relationships (with governments and NGOs) and the adaptation
of a marketing mix (through a deep understanding of the poor) Rangan (2002)
identified the need for an economically sustainable business model as one of
many managerial demands when dealing with the poor
In developing the business model companies could adopt the Cornell University
BOP Protocol system (Simanis and Hart 2008b) which considers all the different
aspects The model in Figure 5 (page 41) included all these aspects through the
literature review (including the Cornell University BOP Protocol system) There
was support from the bank managers for this all encompassing model developed
for the South African context
Branch Managers in the South African banking sector responded positively and
supported the necessity to ensure a deep understanding of the BOP market This
included the need to understand local community circumstances and to use that
information in developing products and services This research supported the
requirement by business to develop mutually beneficial relationships with the BOP
through deep understanding and experimentation There was evidence through
the positive responses for partnership models with the BOP which have been or
would be developed in the long-term through deep understanding and planned
experimentation
80
614 For a partnership venture with the poor there should be value created for the bank at multiple levels such as increased profitability and improved reputation
The value created for the banks and their branches by collaborating in ventures
with the poor include aspects of social responsibility the reputation of the business
and an increase in number of profitable customers which in turn results in an
increase in returns to the business Bank managers are agreeable to the idea that
all of these put together create greater value for the business in the view of
shareholders and so the shares are valued higher on the market In their analysis
of BOP London et al (2010) emphasised that all ventures demonstrated
opportunity for mutual value creation According to Willie and Barham (2009)
business with the BOP aims to improve a range of areas and so making life
worthwhile for the poor This positive social impact in communities then improves
the reputation of the business
Stating Hammond et al (2007)
ldquoAddressing the unmet needs of the BOP is essential to raising welfare productivity and incomehellipEngaging the BOP in the formal economy must be a critical part of any wealth-generating and inclusive growth strategyhellipto the extent that unmet needs informality traps and BOP penaltieshellipaddressing these barriers may also create significant market opportunities for businessesrdquo (p 5)
There was consensus from the bank branch managers that there needs to be
value created for the bank at multiple levels (especially in social responsibility and
reputation) The managers responded very positively to the notion of increasing
the profitable customer base the increase in value of the bank (hence benefiting
shareholders) and the need for a socially responsible bank which in turn results in
an improved reputation
81
615 There needs to be innovation by the bank in a simple technology new process or innovative product or service for a partnership with the poor
In marketing to the poor there must be a significant reduction in price by banks
through a simple technology process product or service by innovatively changing
the price-quality trade-off with an offer of value This was emphasised by Karnani
(2005) the need for a marketndashoriented approach to the BOP by providing goods
and services at affordable prices and in a sustainable manner In addition Rangan
(2002) commented on the need for value-added products and services for the
enhancement of quality of life Based on the responses in this research there is
support for such initiatives from bank managers and hence the banks themselves
Prahalad (2002) recommended bundling of the most advanced technology with a
local flavour such as money transfers through cell phone texts or managing
accounts through mobile recorders from remote areas This ldquobundlingldquo proposed
by Prahalad (2002) would require creativity and entrepreneurship from both the
business and the BOP partner Banks in South Africa based on the positive
survey responses are in support of the development of innovative products
pricing promotion and distribution strategies which meet the needs of the BOP
consumers and producers An example of such a case is mobile banking offered
by nearly all banks in South Africa (Hammond et al 2007)
616 There is high financial risk for the bank in investing in the poor
Banks should not expect early returns when forming joint ventures with the BOP
(Pitta et al 2008) Profit bearing returns if any are expected later when venturing
with the poor This high risk in doing business with the BOP was endorsed by the
positive response received from the bank managers BOP ventures will be
82
experimental at best and may fail most of the time but once a replicable model is
developed then profits will come Such experimentation will take time and some
businesses will not be profitable until the foundations have settled In addition
there is the emphasis in literature of the social aspect of business and not just the
profit motive The aspect of later profits seems evident in the South African
banking sector based on the responses received in this research
617 The business or partnership with the bank should be economically and environmentally sustainable for alleviation of poverty and careful use of scarce resources These scarce resources required by the poor are money electricity clean water and other raw materials
An area that is receiving attention by business in partnerships with the BOP is that
of social and corporate responsibility in a sustainable manner Willie and Barham
(2009) stated that good work is being done by global businesses but in a limited
sense and leaving the BOP in poverty will result in more global instability and
depletion of vital natural resources As per Hahn (2009) corporations are
responsible for the BOP because they must uphold the basic human rights of
freedom and poverty alleviation There is recognition by banks in South Africa for
the need of environmental and economically sustainable business in conjunction
with the alleviation of poverty There were positive results received in this
research to the responsibility of banks to alleviate poverty as part of their corporate
citizenship
South African bank managers corroborated the statement that the development of
the BOP needs to take place without causing disastrous effects on the
environment by careful and optimal use of scarce resources
83
There is agreement from this research and the literature that banks in South Africa
are already implementing or need to implement sustainable business strategies
that include
bull The development of relationships with non-traditional partners
bull Co-inventing custom solutions
bull Building local capacity
bull Creating markets
bull Creating life styles
bull Innovating Such strategies would involve engaging with the BOP as consumers producers
and partners Programmes stated earlier include the Mzansi initiative (providing
cost effective products to the entry-level account holder and the informal sector) by
the South African banking sector and Community Banking (a banking model
extending affordable and accessible financial services to the underserved market
which includes low-income earners and the informal sector) by Standard Bank
(Standard Bank 2009)
Tied into these strategies is the demand for a triple-bottom-line business model
(which includes profit the community and the environment) which serves to attract
customers and employees
618 The BOP as a profitable market Bank managers responded positively to there being a profitable market at the level
of the poor which is untapped South African banks have not fully exploited this
market but the Mzansi initiative and Community banking (Standard Bank 2009)
are indications that there is activity by banks at the level of the BOP There
appears to be an understanding as per Hammond et al (2007) that raising the
84
poor into economic activity (into the formal sector) may create significant market
opportunities for business Therefore addressing the needs of the BOP will raise
their welfare productivity and income Examples such as the Norway based
Telenor and Jamaican based Digicel (Warnholz 2008) have proven that there is a
profitable market at the BOP
62 Underlying Perceptual Dimensions
Through the survey analysis process (using correlation coefficients factor analysis
and metric multidimensional scaling) the following underlying perceptual
dimensions were identified when banks collaborate or do business with the poor
bull Enhancing stakeholder value
bull Customising solutions
bull Public perception
bull Financial risk
bull A profitable market
621 Enhancing Stakeholder Value
Stakeholders include customers shareholders employees partners government
local communities and the public In enhancing stakeholder value processes need
to be in place for an inclusive partnership with the poor
The attributes that fall into this category of enhancing stakeholder value are
bull Increased shareholder value
bull Increased customers
bull Experimental relationships
bull Understanding the poor
85
bull Allocation of funds
bull Allocation of teams
Figure 14 The cycle of enhancement of stakeholder value through partnership with the poor
Karnani (2005) Prahalad (2005) and Warnholz (2007) have argued that the BOP
need to be viewed as producers and not solely as consumers There would be
much more gained by all stakeholders including the poor in treating them as
producers and empowering them The process of enhancing the stakeholder value is described above in Figure 14
Through the survey analysis the strongest relationships and reliability of
association were obtained for the attributes above This showed awareness and
86
possible application by managers of the process of collaborating with the poor and
the benefits of this collaboration to all participants direct or indirect There appears
to be a simplified or generalised model of partnerships with the poor available to
bank managers in this respect This simplified model includes some of the core
aspects of this partnership its processes and benefits
Each aspect in Figure 14 above could be investigated further for more insight and
a better understanding into underlying processes involved in achieving success in
the BOP partnerships
622 Customising Solutions Customising solutions involves the alleviation of poverty through co-inventing
solutions for the poor using technology and available scarce resources The
themes coming under this dimension are
bull Product technology
bull Price technology
bull Resource use
bull Poverty alleviation
When serving the poor there is need for a marketndashoriented approach from
business by providing value-added products or services at affordable prices and in
a sustainable manner (Karnani 2005 Rangan 2002) There is the requirement of
creativity and entrepreneurship from both business and the poor for the application
of the most advanced technology suitable for the local context (Prahalad 2002) In
addition Prahalad (2002) emphasised the environmental sustainability of the new
business models due to shortages of critical resources These shortages of critical
resources would lead to services or product manufacturing processes which use
little or limited resources without sacrificing service or product performance
87
Consequently Hahn (2009) recommended that poverty alleviation should take
place without causing disastrous effects on the ecological and social environment
Awareness or application by bank managers to customising solutions through
technology was evident due to there being strong relationships and internal
consistency in the items reported (such as product technology price technology
resource use and poverty alleviation) The detailed process of technology use is
beyond this research but can be generalised from the results and possible
understanding by bank managers as follows in Figure 15 below
Figure 15 Optimal Resource Utilisation by Application of Technology in Collaborating with the BOP for Poverty Alleviation
623 Public Perception
Public perception is the dimension of how the market the public investors
shareholders the community management and the employees view the banks or
branches The aspects under the dimension of public perception included
bull Poverty alleviation (which was shared with customising solutions)
bull Reputation
bull Social responsibility
bull Households
88
The banking fraternity needs to be viewed as socially responsible in the eyes of
stakeholders In addition the business must project a view that it aims to alleviate
poverty through understanding the poor and responding to alleviate this poverty
The expected result to the banks and their managers according to the literature
survey is an improved reputation
There was positive correlation and internal consistency between the attributes of
social responsibility poverty alleviation and the resulting reputation of the
business The aspect of treating the poor as households and not individuals
(because decisions by the poor are made at household level and not individual
level) did not correlate well and when removed the internal consistency of the
relationship between social responsibility and reputation improved
Therefore there is question as to whether the bank branch managers understood
the aspect of treating the poor as households clearly This concept derived by
Corder and Chipp (2010b) needs to be further emphasised to management and
marketers to fully engage the poor in the economics of a country Corder and
Chipp (2010b) reported that ldquo a higher incidence of collectivism among the lower
tiers of the South African Pyramid indicate that from an African perspective
therefore the BOP should be considered from a group perspective rather than a
Western view of the individualrdquo(p10) Viewing the poor segment of consumers and
producers in isolation of their households and dependencies would limit the
perspective of marketing researchers and managers
624 Financial Risk
The aspects that encompass the dimension for financial risk were that of financial decisions made by the poor and later profitability expected by the business
There was a weak relationship (in both correlation and internal consistency)
between the two aspects of financial decisions by the poor and later profitability by
89
business in dealing with the poor There is an impression that the financial risk for
both the poor and the banks is high (in the partnership) In comparison the aspect
of financial decisions by the poor is more related to the requirement for the poor in
South Africa in making decisions (financial or other) as a household Therefore
there is need for managers and marketers to recognise the collectivist nature of
the poor in Africa
This financial risk dimension consisting of two attributes is not substantial and so
further research in the area is required In addition bank branch managers did not
seem to connect the two attributes well The association seems to be made
through the impression that both attributes are financial in nature
625 A Profitable Market
There is consensus through the literature and from the survey results that there is
a profitable market at the BOP but there is disagreement as to the manner in
tapping into this market (Hammond et al 2007 Karnani 2005 Prahalad 2006
Rangan 2002 Warnholz 2007) The examples cited in Chapter 2 (section 27)
are of products and services targeted at the BOP with both poverty alleviation (or
serving the poor) and the profit motive as drivers The fifth dimension of a
profitable market could not be expanded on much because it had only one
attribute linked to it Therefore the profitable market at the level of the BOP needs
further investigation and research into its underlying associations
63 Group Responses
The different perceptual dimensions described in the previous section (such as
enhancing stakeholder value customising solutions public perception and
financial risk) were then compared within the sample population between gender
races age groups and banks The results with significant differences between
90
groups (p lt 005) were then analysed to extrapolate to the population of bank
managers or leaders The most significant comparisons were for the enhancing stakeholder value dimension (or Factor 1) See Appendix 5 Tables 27 to 30 for
details of the comparative analysis
631 Gender Comparison
Men scored higher (mean = 285) on enhancing stakeholder value than women
(mean 25) Based on these results men appear to be more open to forming
partnerships with the poor than women This finding needs further investigation
into the gender response to working with the BOP
632 Age Group Comparison
On enhancing stakeholder value the less than 35 year olds scored higher
(mean = 288) than the greater than 35 year olds (mean = 246) This difference in
response was significant There are possible generational gap issues here
resulting in such a significant difference in the responses The younger seem to be
more appreciable to collaborating with the poor for the benefit of all parties This
could be due to the entrepreneurial experimental or risk acceptance nature of the
young The older respondents could be responding less positively because of their
negative experiences when dealing with the poor in the past The two age groups
seem to have different mental models of BOP partnerships the younger model
being more open that the older to engaging with the poor
633 Bank Comparison
On the same dimension of enhancing stakeholder value Standard Bank
respondents scored the highest (mean = 283) with ABSA second (mean = 263)
and the weakest response was Nedbank (mean = 234) There are many possible
91
reasons why the responses were different between the banks The reasons may
range from different levels of awareness of managers of initiatives taking place
within the banking sector levels of communication within banks of such initiatives
to the restriction of such initiatives to head office and specialist teams The
responses could be different due to the different management structures in the
bank groups These variances in underlying perceptual dimensions need to be
further investigated and the results would be of interest to the banks scoring low
Banks need to focus in this area if they intend on doing business with the 112
million poor (16 years and older) in South Africa (Corder and Chipp 2010b)
634 Race Comparisons
In terms of financial risk the Black respondents scored (mean = 232) lower than
the Coloured Indian or Asian groups (mean = 265) and the White respondents
(mean = 270) There were significant differences in the responses from the race
groups Considering that there was little internal consistency in the financial risk
dimension this comparison was weak to interpretation Further research needs to
be carried out for findings that are more substantial
64 Summary
In summary the findings in this research supported the BOP partnership model in
the banking sector from a branch or bank manager perspective All aspects of the
partnership model were supported by the findings Unfortunately there was not
enough data to support the definition of the poor as households in their activities
from a management perspective The underlying perceptual dimensions of
enhancing stakeholder value customising solutions public perception financial
risk and a profitable market further supported the portion of the model tested in
this research The existence of groups that understood the model (at different
92
levels) and drew their own conclusions from the model together with its
dimensions further substantiated that they have this or a similar model in mind
93
CHAPTER 7 CONCLUSIONS AND RECOMMENDATIONS
71 Key Findings
The findings in this research supported the role of banks in the equal
partnership model for the economic involvement of the BOP (see Figure 5
page 41) Companies that collaborate with the BOP have great potential in
boosting both corporate and economic growth through job creation tax
revenue and investment amongst others
Managers of the banks involved in this research showed awareness of the
processes entailed in developing a partnership with the poor This alluded to the
fact that banks have been or are intending to engage with the poor and recognise
the BOP as an untapped market These activities taking place by the banks are
through products and services designed for the poor The introduction of a
different business model for this collaboration between banks and the poor
appeared to be accepted by managers
Through a deep understanding of the BOP and their lifestyles the banks have
designed their products and services for this market There are implications that
the poor would only be fully comprehended through agents on the ground or at
grass roots level Consequently experimentation has taken place at the level of
the poor with their cooperation over extended periods for the joint development of
these products and services
To deliver products and services of value to the poor simple technology was
required to provide an offering at the right price process and value There was
innovation by both the business and BOP for there to be a successful partnership
The implementation of simple technology and innovation has resulted in careful
94
use of the scarce resources (such as finances utilities and other natural
resources) available to the BOP
There was support for the allocation of resources over the long term and in a
sustainable manner towards the BOP partnership These resources would be in
the form of finances and teams or departments fully committed to dealing with the
poor The high risk in these partnerships was recognised because of the time it
would take the BOP to turn a profit Therefore there was support of the aspect of
the banks receiving profits later rather than sooner
Ultimately there was recognition of a profitable market at the BOP This value
creation is in the form of increased customers and higher returns to shareholders
In addition to the profit motive the poverty alleviation motive was supported by the
managers and hence the banks It was for the most part agreed that improving the
lifestyles of the poor allowed them to engage in the economy and boost economic
growth with the result of enhancing the reputation of the business
One area in which support was unclear was the treatment of the poor as
households and not individuals by marketers and managers The aspect of the
collectivist nature of the poor in Africa in terms of their financial decisions (which
include earnings savings and purchases) was not evident in this research
The most prominent dimension was that of enhancing stakeholder value that
captured most of the aspects of collaborating with the poor This further
substantiated the impact of the equal partnership model between the BOP and
business
There were different opinions between the categories of gender race age and
bank group in the equal partnership model These perceptions differed on the
95
underlying dimensions of enhancing stakeholder value customising solutions
public perception financial risk and a profitable market
72 Recommendations Banks should look at their business strategy and incorporate initiatives that lead to
collaboration with the poor There is vast potential in the 112 million poor (of 16
years or older) who are not fully engaged in the economy of South Africa These
programmes of engaging the poor should be developed using the model
prescribed in this research (see figure 16 below) Involvement in this untapped
BOP market can lead to community development business growth profitability
country growth and ultimately improving the general well being of the poor
Figure 16 Participants for an Equal Partnership with the Poor (or BOP)
Initiatives leading to collaborating with the BOP as producers as well as just
consumers should permeate at all levels of business to encourage
experimentation innovation and involvement by all employees The focus on
ldquodoing goodrdquo as well as ldquodoing wellrdquo will lead to an improved reputation internal
and external to the business All employees need to understand the potential in
96
themselves their communities and their businesses for the economic growth of a
nation
When collaborating with the poor the partnership needs to be considered
holistically Resources which include money electricity materials and others
need to be sourced carefully and used sparingly for a sustainable venture
Managers marketers and business leaders need to consider the poor as
households as expressed throughout this research and the literature This is
applicable especially in Southern Africa (Corder and Chipp 2010b) where the poor
deal with most financial issues collectively in their households
73 Implications for Future Research Further research is needed into the profitability or value drawn from collaborating
with the poor by business government and NGOs It would be beneficial to have
some metrics to measure the value drawn from this collaboration As this
research only relates to the collaboration of the BOP and business the
relationship with government and NGOs needs to be explored on further
investigation of the equal partnership model
The collectivism displayed by the South African poor in their financial decision-
making needs further investigation Household decision making by the poor was
not clarified or substantiated by this research
Further research is required on the financial risk dimension for more supportive
findings related to the equal partnership with the BOP More investigation could be
done on gender race age and brand of bank to determine the reason for and
result of the differences identified
97
This research could be extended to cover employees of banks at different levels
In addition managers or employees of other retail businesses could be
considered
74 Limitations of Research
There was a limitation to the level of insight gained into the other aspects of the
cycle of enhancement of stakeholder value (see Figure 14 page 85) The areas of
government facilitation NGO involvement and the BOP were not covered
Managers of banks were selected as the population and so the results of this
research can only be extrapolated to managers in the financial sector in South
Africa Additionally this research was limited to three banks in South Africa and so
cannot be extrapolated to other retail businesses or outside of South Africa
98
References
ABSA (2009) ABSA Group Limited Annual report for the year ended 31 December
2009 Retrieved from absacoza (accessed 20 June 2010)
ABSA (2010) Branch listing Retrieved from absacoza (accessed 20 July
2010)
Agarwal S Lanckriet G Wills J Kriegman D Cayton L amp Belongie S (2007
March) Generalized Non-metric Multidimensional Scaling In Meila M (Chair) and
Shen X (Chair) AI amp Statistics 2007 Symposium conducted at the meeting of
AISTATS San Juan Puerto Rico
Akula V (2008) Business Basics at the Base of the Pyramid Harvard Business
Review June p53
Albright CS Winston W L amp Zappe C (2006) Data Analysis and Decision
Making Mason Ohio Thompson South-Western
Altman D G Rego L amp Ross P (2009) Expanding Opportunity at the Base of
the Pyramid People and Strategy 32 46-51
Anderson J amp Markides C (2007) Strategic Innovation at the Base of the
Pyramid MIT Sloan Management Review 49 (1) 83-88
Andrews K R (1999) The Concept of Corporate Strategy (3rd ed) New York
McGraw Hill
Babbie E R (2005) The basics of social research Canada Thompson Learning
99
Cash J amp Pearlson K (2005) Why you should experiment with your business
How to use business experimentation to grow your company CIO 19 (2) 1
Chen S amp Ravallion M (2008) The Developing World is Poorer than we
Thought but no Less Successful in the Fight against Poverty Policy Research
Working Paper World Bank Retrieved from econworldbankorgdocsearch
(accessed 20 June 2010)
Chipp K amp Corder C (2010a) Where practice meets theory Defining and
reviewing the bottom of the pyramid for South African marketers Manuscript
submitted for publication
CIA World Factbooks (2003 to 2008) Population Below the Poverty Line by
Country 18 December 2003 to 18 December 2008 Retrieved from
nationmastercomgrapheco_pop_bel_pov_lin-economy-population-below-
poverty-line (accessed 20 June 2010)
Corder C amp Chipp K (2010b) The role of Collectivism in the BOP Should the
Bottom of the Pyramid be considered from a household or an individual viewpoint
Manuscript submitted for publication
Cummings T amp Worley C (2009) Organization Development amp Change (9th
ed) Mason Ohio South-Western
Eighty20 (2009) The BOP in SA 2009 ndash An Eighty20 AMPS 2008 Analysis
Eighty20 Retrieved from eighty20cozainsightoutmass-market-south-africa
(accessed 27 April 2010)
100
FNB (2010) Branch Locator Retrieved from fnbcoza (accessed 20 July
2010)
Foddy W (1993) Constructing questions for interviews and questionnaires New
York Cambridge University Press
Friedman M (1962) Capitalism and Freedom Chicago The University of
Chicago Press
Geldenhuys J (2008) Building an experimentation process model for financial
institutions developing personal finance products for the bottom of the pyramid
Unpublished MBA thesis GIBS University of Pretoria
Guadagnoli E amp Velicer WF (1988) Relation of sample size to the stability of
component patterns Psychological Bulletin 103 pp 265-275
Hahn R (2009) The Ethical Rational of Business for the Poor ndash Integrating the
Concepts Bottom of the Pyramid Sustainable Development and Corporate
Citizenship Journal of Business Ethics (84) pp 313-324
Hamel G amp Prahalad C K (1994) Competing for the Future Boston Harvard
Business School Press
Hammond AL Kramer WJ Katz RS Tran JT amp Walker C (2007) The
Next 4 Billion Market Size and Business Strategy at the Base of the Pyramid
Washington DC International Bank for Reconstruction and developmentWorld
Bank group
101
Hammond AL amp Prahalad CK (2004) Selling to the Poor Foreign Policy
MayJune pp 30-37 Retrieved from foriegnpolicycom (accessed 27 April
2010)
Hinkin TR (1995) A review of scale development practices in the study of
organizations Journal of Management 21 pp 967-988
Ireland J (2008) Lessons for successful BOP marketing from Caracasrsquo slums
Journal of Consumer Marketing 25 (7) pp 430-438
Karnani A (2005) Misfortune at the Bottom of the Pyramid Greener
Management International 51 pp 99-110
Karnani A (2007) Research Notes and Commentaries Doing Well by Doing
GoodmdashCase Study lsquoFair amp lovelyrsquo Whitening Cream Strategic Management
Journal 28 (13) pp 1351ndash1357 doi101002smj645
Karnani A (2007b) Doing Well by Doing GoodmdashCase Study lsquoFair amp lovelyrsquo
Whitening Cream Strategic Management Journal 28 (13) pp 1351ndash1357
doi101002smj645
King N (1994) The qualitative research interview In C Cassell and G Symon
(Eds) Qualitative methods in organisational research pp 14-36 London Sage
Publications
Kotler P amp Lee NR (2009) Up and Out of Poverty The Social Marketing
Solution Upper Saddle River Wharton School Publishing
102
Linnanen L amp Panapanaan V (2002) Roadmapping CSR in Finish Companies
Helsinki Helsinki University of Technology
London T Anupindi R amp Sheth S (2010) Creating mutual value Lessons
learned from ventures serving base of the pyramid producers Journal of Business
Research 63 (6) pp582-594
Louw A I (2008) Redefining BOP In Pursuit of Sustainable Opportunity at the
Base of the Economic Pyramid Unpublished MBA thesis GIBS University of
Pretoria
Margolis J amp Walsh J (2001) People and Profits The Search for a Link
between a Companyrsquos Social and Financial Performance Mahwah New Jersey
Lawrence Earlbaum
Martinez JL amp Carbonell M (2007) Value at the bottom of the Pyramid
Business Strategy Review18 (3) pp50-55
Moore G (2006) Exploring the Bottom of the Pyramid Perspectives in Business
pp15-18
Mouton J (2009) How to succeed in your Masterrsquos and Doctoral Studies Pretoria
Van Schaik Publishers
Naidoo K (2009) Corporate social investment as a driver of customer loyalty at
the bottom of the pyramid Unpublished MBA thesis GIBS University of Pretoria
Nedbank (2010) Branch Locator Retrieved from nedbankcoza (accessed 20
July 2010)
103
Nielsen C amp Samia PM (2008) Understanding key factors in social enterprise
development of the BOP a systems approach applied to case studies in the
Philippines Journal of Consumer Marketing 25 (7) pp 446-454
Olsen M amp Boxenbaum E (2009) Bottomndashof-the-Pyramid Organisational
Barriers to Implementation California Management Review 51(4) pp100-125
Pitta D A Guesalaga R amp Marshall P (2008) The quest for the fortune at the
bottom of the pyramid Potential and challenges Journal of Consumer Marketing
25 (7) pp 393-401
Powell S (2006) Spotlight on Stuart L Hart Management Decision 44 (10) pp
1476-1484
Prahalad CK (2002) Strategies for the Bottom of the Economic Pyramid India
as a source of innovation Reflections The Society for Organisational Learning
and MIT Vol3 No4 pp6-17
Prahalad C K (2005) The Fortune at the Bottom of the Pyramid A Mirage
London Pearson Education
Prahalad C K (2006) The fortune at the bottom of the Pyramid Eradicating
poverty through profits Upper Saddle River New Jersey Pearson
Prahalad CK amp Hart S L (2002) The Fortune at the Bottom of the Pyramid
Strategy and Business 8 (26) pp1-16
104
Pressly D (2009 September) South Africa has the widest gap between rich and
the poor Business Report 28 Retrieved from
busrepcozaindexphpfArticleId=5181018 (accessed 21 February 2010)
Rangan VK (2002) Commentary on Strategies for the Bottom of the Economic
Pyramid India as a source of innovation Reflections The Society for
Organisational Learning and MIT Vol3 No 4 pp6-17
Richman WL Kiesler S Weisband S amp Drasgow F (1999) A meta-analytic
study of social desirability distortion in computer-administered questionnaires
Journal of applied Psychology 84 pp 754-775
Rost C amp Ydreacuten E (2006) Profit for the Poor Sustainable Market Development
in BOP Markets Joumlnkoumlping International Business School
SAARF (2010) The South African Advertising Research Foundation Living
Standards Measure Retrieved from wwwSaarfcozaLSMlsmshtm (accessed
19 July 2010)
Sanchez P Ricart JE amp Rodriguez MA (2006) Influential factors in becoming
socially embedded in Low-Income Markets Greener Management International
IESE Business School 5 pp 19-51
Seidman I E (2006) Interviewing as qualitative research a guide for researchers
in education and the social sciences (3rd ed) New York Teacher College
Process
105
Simanis E (2009 October 26) Marketing at the base of the pyramid When
selling to poor consumers companies need to begin by doing something basic
They need to create the market Wall Street Journal New York p R7
Simanis E amp Hart S (2008b) The Base of the Pyramid Protocol Towards Next
Generation BOP Strategy (Second ed) New York Cornell University Johnson
School of Management
Simanis E Duke D amp Hart S (2008) The Base of the Pyramid Protocol
Beyond Basic Needs Strategies Innovations Winter
Spector PE (1987) Method variance as an artifact in self-reported affect and
perceptions at work Myth or significant problem Journal of Applied Psychology
72 pp 483-443
Standard Bank 2009 The Standard Bank of South Africa Annual Report for 2009
Retrieved from wwwstandardbankcoza (accessed 18 July 2010)
Standard Bank (2010) Branch Locator Retrieved from standardbankcoza
(accessed 21 July 2010)
Tharenou P Donohue R amp Cooper B (2007) Management Research
Methods Melbourne Cambridge University Press
United Nations (1948) The Universal Declaration of Human Rights New York
United Nations Retrieved from wwwohchrorgenudhrpagesintroductionaspx
(accessed 20 June 2010)
106
United Nations (2006) The Millennium Development Goals Report 2006 New
York United Nations p4
Van Marrewijk M (2003) Concepts and definitions of CSR and Corporate
Sustainability Between Agency and Communion Journal of Business Ethics 44
pp 95-105
Warnholz J (2007) Poverty Reduction for Profit A critical examination of
business opportunities at the Bottom of the Pyramid Queen Elizabeth House
Working Paper Series Oxford University
Warnholz J (2008) Even the poorest can be a thriving market Harvard Business
Review May p 26
Welman J amp Kruger S ( 2001) Research Methodology Cape Town Oxford
University Press
Whitehouse L (2006) Corporate Social Responsibility Views from the Frontline
Journal of Business Ethics 63 pp 279-296
Willie E amp Barham K (2009) A Role for Business at the Bottom of the Pyramid
Berkhamstead Ashridge
Wreathall J (1995) Organizational culture behavior norms and safety In A
Carnino amp G Weiman (Eds) Proceedings of the International Topical Meeting on
Safety Culture in Nuclear Installations (pp 24-28) Vienna Austria American
Nuclear Society of Austria
Zikmund WG (2003) Business Research Methods Mason Ohio South-
Western
107
Appendix 1 Examples of Involving the BOP in the Economy Real examples of involving the BOP in the economy from the survey reported by
Hammond et al (2007) (p13)
ldquoIn an informal suburb of Guadalajara Mexico a growing family is struggling to
expand their small house Help arrives from a major industrial company in the
form of construction designs credit and as-needed delivery of materials
enabling rapid completion of the project at less overall cost
In rural Madhya Pradesh an Indian farmer gains access to soil testing services
to market price trends that help him decide what to grow and when to sell and
to higher prices for his crop than he can obtain in the local auction market The
new system is an innovation of a large grain-buying corporation which also
benefits from cost saving and more direct market access
A South African who lives in an impoverished crime-ridden neighbourhood of
Johannesburg has no bank account cannot order items from a distant store
and is sometimes robbed of her pay packet She finds that a new financial
service offered by a local start-up company allows her mobile phone to become
a solutionmdashher pay is deposited directly to her phone-based account she can
make purchases via an associated debit card and she carries no cash to steal
In a small community outside Tianjin China a small merchant whose children
have been repeatedly sickened by drinking water from a heavily- polluted river
is distraught He finds help not from the overwhelmed municipal government but
from a new low-cost filtering system developed by an entrepreneurial
companyrdquo
108
Appendix 2 The Cornell University BOP Protocol Process
This appendix summarises the processes involved in the BOP Protocol developed
at Cornell University by Stuart Hart Erik Simanis and their colleagues (2008b) as
discussed in the report by Willie and Barham (2009)
Pre-field processes
The corporation needs to spend time in careful preparation before actually starting
the work of setting up a joint venture with a community The aim is to set up a new
business in the community of which members of the BOP should have a sense of
ownership on equal terms with the corporation Such a new business should be in
an area of BOP need in which the corporation has capabilities but this is allowed
to emerge rather than laid down from the start It is not an initial objective The
pre-field work may take as much as four months It includes three interdependent
activities
1 The selection of appropriate project sites
The criteria for this should be that the chosen community has a prima facie
need for the exercise of the specific capabilities of the corporation The
choice of country or region should be based on the corporationrsquos long term
strategic interests and the existence of some of the corporate facilities
nearby though not necessarily of an extensive entrenched business
presence in the country
2 Team formation and preparation
A multi-functional team from the corporation consisting possibly of four
people should be formed They should between them have the knowledge
109
and experience to be able to draw on and apply their companyrsquos core
competences to the local situation as it emerges Ideally they should be
selected from the people already employed in the corporationrsquos activities in
the country in which the project is to be based Once local partnership is
established one or two additional members linked with the community may
be added The team is then trained in the philosophy and practice of the
Protocol ndash other corporate staff may conduct this training and it should
include awareness of how to access support and resources from the
corporation itself whilst being able to operate independently and not
constrained by the culture and procedures of the parent corporation
3 Local partner selection
As ldquooutsidersrdquo initially the team will depend on the trust and community
knowledge of local partners These should be open to new ideas have
experience of participatory working and be ldquosocially embeddedrdquo in the
community NGOs operating in a community may be able to help identify
the right people Such partners will be compensated for their time
In-field processes
These are the three interdependent phases of activity that build the new business
and embed it in the community and make progress in developing a market for the
products or services It also begins to establish a community team who will be able
eventually to take over and lead the new business while the corporation moves on
to embedding the proven business in other communities
110
Phase I ndash Opening up
The company representatives are immersed in the life of the community living
with the local people for a week or two (home-stays) and taking part in their normal
life with all its limitations The team from the community joins with the company
team in developing business ideas and there are a series of participatory
workshops to establish a common business language leading to a shared concept
of a single practicable outline business action plan In this period deep dialogue
with the community is established a wider project team involving people from the
community reflecting its diversity (caste income age occupation) is developed
trust and mutual respect grows After some months of working together this phase
arrives at an idea of the resources wants and needs of all involved leading to a
clear value proposition exceeding anything currently done
Phase II ndash Building the ecosystem
This creates the organisational foundation for the new business and by action
learning methods develops an initial prototype through small-scale
experimentation at a low level of complexity This practical work furthers the
uniting of the community with the corporation Further members join the team on a
full-time basis and the work is divided up between groups of 4-6 who gradually
withdraw from their other occupations All new members undergo induction
training
Phase II will last about six months and transition from Phase 1 to Phase II should
not exceed six weeks Phase II moves from development of the project team to
building shared commitment and new capability development with the outcome of
the creation of a viable business prototype that has passed through an initial
ldquomarket screenrdquo Generating some quick income has to be balanced with longer-
term activity which will generate sustainable income
111
Phase III ndash Enterprise creation
This phase aims ldquoto establish both a committed market base and a new
organisation capable of sustaining and growing the enterprise while evolving and
expanding the initial prototype into a complete business model ready for scaling
out ndash for replicating the business in communities in other geographical districts and
regionsrdquo The community members of the project team learn the skills to operate
as an independent business unit Corporate influence increasingly fades out
during this phase The new business should avoid becoming a mere link in
someone elsersquos supply chain and should maintain an identity of its own
Scaling out
The next step is to transfer efficiently and re-embed the business model in
hundreds or even thousands of other communities in new geographical areas
Three steps are proposed
bull Reaching out to new communities through business ambassadors planting
the seed and creating extended project teams
bull Linking the ecosystem by formal connections between the initial BOP
business and the new project teams thus helping further businesses to
adopt the organisational culture and guide business roll-out
bull Creating a network of interdependent business communities
Scaling out is seen as a process without end as more and more communities seek
to build on the original ldquopilotrdquo parent community From pre-field processes to the
point where the pilot BOP business is ready to spread its concepts takes between
112
two and three years The practical outworking in a scaling out process will take
further time which is difficult to estimate as it will vary according to specific
conditions However scaling out is expected to enable other communities to form
businesses much more quickly than the initial establishment of the business
113
Appendix 3 The Informed Consent Letter and Structured Questionnaire
A Informed Consent Letter ndash Researcher administered version
Good day my name is Kamlesh Vasanjee and I am an MBA student at the Gordon
Institute of Business science (GIBS) which is part of the University of Pretoria I am
conducting research on the business relationship between banks and the poor I am
aiming to find out more about the activities by banks that engage the poor as partners
This interview will take approximately 15 minutes of your time
Please note that
bull Any information obtained from the surveys will be used exclusively for the
purposes of the research
bull All information will be treated with strict confidentiality and your name will not be
reflected in the dissertation
bull Your participation is voluntary and you can withdraw at any time without penalty
bull The interviews are close-ended and will not be tape recorded or transcribed
bull You are under no financial obligation or commitment
The direct benefit to you participating in this study is that this information will provide a
better understanding of market requirements By participating and completing this
interview you indicate that you voluntarily participate in this research
If you have any concerns please contact me or my supervisor Dr Clive Corder Our
contact details are as follows
Kamlesh Vasanjee Clive Corder
ppccoza clivecoiconcoza
0826035762 0826556740
I can email or fax this letter of consent to you if you provide me with your email address or fax number so you will have our contact details
114
B Informed Consent Letter ndash Version administered by other Good day my name is helliphelliphelliphelliphelliphelliphelliphelliphelliphellip and I am conducting research for Kamlesh
Vasanjee who is an MBA student at the Gordon Institute of Business science (GIBS)
which is part of the University of Pretoria The research is on the business relationship
between banks and the poor The aim of the research is to find out more about the
activities by banks that engage the poor as partners This interview will take approximately
15 minutes of your time
Please note that
bull Any information obtained from the surveys will be used exclusively for the
purposes of the research
bull All information will be treated with strict confidentiality and your name will not be
reflected in the dissertation
bull Your participation is voluntary and you can withdraw at any time without penalty
bull The interviews are close-ended and will not be tape recorded or transcribed
bull You are under no financial obligation or commitment
The direct benefit to you participating in this study is that this information will provide a
better understanding of market requirements By participating and completing this
interview you indicate that you voluntarily participate in this research
If you have any concerns please contact Kamlesh Vasanjee or his supervisor Dr Clive
Corder Their contact details are as follows
Kamlesh Vasanjee Clive Corder
ppccoza clivecoiconcoza
0826035762 0826556740
I can email or fax this letter of consent to you if you provide me with your email address or fax number so you will have our contact details
115
Structured Questionnaire
Questions
Demographics
1 Record Gender
Male Female
2 Record race
Which racial group do you belong to
Black Coloured Indian or
Asian White
3 Record Age group
Which of the following age groups do you fall into
Under 35 35 to 49 Above 50 Refused
4 Record Bank
ABSA Nedbank Standard Bank
5 What levels of banking does your branch handle
Personal Business
I will be reading out some definitions for you so please take note
116
The adult population in South Africa has been divided into ten groupings termed Living Standards Measure (LSMs) (SAARF 2010) The LSMs are based on ownership of a
range of household items such as a television or vacuum cleaner (as examples) and on
urbanisation such as availability of hot running water and electricity (as examples)
Please note that the poor
are defined (as per Chipp and Corder 2010a) in this study as
those adult South Africans (16+ years) in LSM 1 to 4 (the four lowest groups of living
standards)
I am going to read out a few statements and as I read each statement please tell me to
what extent you disagree or agree with the statement by using the numbers 1 to 4 where
1 equals disagree 2 equates to slightly agree 3 equals agree and 4 equates to strongly
agree You may choose any number you want
6 1 Disagree
2 Slightly Agree
3 Agree
4 Strongly
agree a When considering the financial state of
the poor they should be treated as
households rather than individuals Remember 1 = disagree 2 = slightly agree 3 = agree and 4 = strongly agree
b There is a profitable market at the
level of the poor (LSM 1 to 4) which has
not been tapped to its fullest
c Poor households or families in SA
make financial decisions together
I am now going to ask you about partnerships between the bank and the poor (Simanis
Duke amp Hart 2008) The partners
would be members in a business project or
association where each member is responsible for the success of the business
117
7 This branch commits resources in partnerships with the poor by
1 Disagree
2 Slightly Agree
3 Agree
4 Strongly
agree a Allocating funds for many years to
new business partnerships Remember 1 = disagree 2 = slightly agree 3 = agree and 4 = strongly agree
b Allocation of a department or team
specifically responsible for dealing with
the partnerships
8 This branch prepared well for partnering with the poor by
1 Disagree
2 Slightly Agree
3 Agree
4 Strongly
agree a Experimenting with different ways of
forming mutually beneficial relationships
b Spending lots of time with the poor to
get a deep understanding of the real
situation in these communities
9 The value created for this branch by partnering with the poor is
1 Disagree
2 Slightly Agree
3 Agree
4 Strongly
agree a An increase in the number of
profitable customers
b An increase in the value of the bank
to the shareholders because of higher
returns
c Part of the social responsibility of the
bank to the poor
d The improved reputation of the branch Just as a reminder the scale is as follows 1=disagree 2=slightly agree 3=agree and
4=strongly agree
118
10 Innovative technology has been implemented by this branch when partnering with the poor through
1 Disagree
2 Slightly Agree
3 Agree
4 Strongly
agree
a Value for money simple or local
processes products or services
b Quality products and services which
are priced for the poor
11 When partnering with the poor profits are expected
1 Disagree
2 Slightly Agree
3 Agree
4 Strongly
agree a Later rather than sooner
12 The bank has a responsibility to ensure long term success of the partnership
1 Disagree
2 Slightly Agree
3 Agree
4 Strongly
agree
a To alleviate poverty
b And to ensure the careful use of
resources such as money electricity
clean water and other natural resources
Thank you for your participation and enjoy the rest of your day
119
Appendix 4 Descriptive Statistics
Table 13 Descriptive Statistics on Gender
Gender
Frequency Percent Valid Percent
Cumulative
Percent
Valid Female 78 690 690 690
Male 35 310 310 1000
Total 113 1000 1000
Figure 17 Proportion of the Different Sexes
120
Table 14 Descriptive Statistics on Race
Race
Frequency Percent Valid Percent
Cumulative
Percent
Valid Black 34 301 301 301
Coloured Indian Asian 31 274 274 575
White 48 425 425 1000
Total 113 1000 1000
Figure 18 Race Composition for the Survey
121
Table 15 Descriptive Statistics on Age Groups
Age Group
Frequency Percent Valid Percent
Cumulative
Percent
Valid 35-49 67 593 593 593
Above 50 6 53 53 646
Under 35 40 354 354 1000
Total 113 1000 1000 Figure 19 Age Group Distribution
122
Table 16 Descriptive Statistics on Banks
Bank
Frequency Percent Valid Percent
Cumulative
Percent
Valid ABSA 55 487 487 487
Nedbank 30 265 265 752
Standard 28 248 248 1000
Total 113 1000 1000
Figure 20 Bank Distribution
123
Table 17 Descriptive Statistics on Type of Banking
Business or personal banking
Frequency Percent Valid Percent
Cumulative
Percent
Valid Both 73 646 646 646
Business 5 44 44 690
Personal 35 310 310 1000
Total 113 1000 1000
Figure 21 Type of Banking
124
Appendix 5 Multivariate Statistics Table 18 One Sample Two Tailed T-test Results
One-Sample Statistics Test Value = 2 95 Confid Inter of the
Diff
N Mean Std Deviation
Std Error Mean
t df Sig (2-
tailed) Mean
Difference Lower Upper
6a Households 113 215 1063 01 1505 112 0135 015 -005 035
6b Profitable market 113 273 0897 0084 8708 112 0000 0735 057 09
6c Financial Decisions 113 227 0954 009 2957 112 0004 0265 009 044
7a Allocation of funds 111 253 098 0093 5714 110 0000 0532 035 072
7b Allocation of teams 111 25 098 0093 5324 110 0000 0495 031 068
8a Experimental relationships
112 283 0746 007 11779 111 0000 083 069 097
8b Understanding poor
110 264 0864 0082 7721 109 0000 0636 047 08
9a Increased customers 112 259 0844 008 7387 111 0000 0589 043 075
9b Increased shareholder value
112 255 0899 0085 6518 111 0000 0554 039 072
9c Social responsibility 112 321 065 0061 19779 111 0000 1214 109 134
9d Reputation 112 316 0578 0055 21246 111 0000 1161 105 127
10a Product technology 112 285 0808 0076 11113 111 0000 0848 07 1
10b Price technology 112 29 0735 0069 12989 111 0000 0902 076 104
11a Later profitability 111 287 0776 0074 11865 110 0000 0874 073 102
12a Poverty alleviation 112 318 0661 0062 18883 111 0000 1179 105 13
12b Resource use 112 296 0709 0067 14386 111 0000 0964 083 11
125
Table 19 Correlations of the Banks Partnership with the Poor
Question 6a 6b 6c 7a 7b 8a 8b 9a 9b 9c 9d 10a 10b 11a 12a 12b
6a Households 10
6b Profitable market 01 10
6c Financial Decisions
-01 02 10
7a Allocation of funds 01 02 00 10
7b Allocation of teams 01 01 00 05 10
8a Experimental relationships
00 00 00 04 04 10
8b Understanding poor
00 -01 01 03 02 05 10
9a Increased customers 00 01 02 04 03 05 04 10
9b Increased shareholder value
00 01 01 04 03 04 04 06 10
9c Social responsibility 02 01 02 02 03 04 02 02 01 10
9d Reputation 02 00 02 02 03 04 03 02 03 05 10
10a Product technology 01 01 01 02 03 04 03 03 02 03 03 10
10b Price technology 01 02 03 02 03 03 03 03 02 03 03 06 10
11a Later profitability 01 01 02 01 02 02 02 02 02 03 03 04 02 10
12a Poverty alleviation 02 -
01 01 02 03 04 04 03 02 04 05 04 03 04 10
12b Resource use 00 -
01 00 03 02 02 01 02 01 02 02 03 03 01 05 10
126
Table 20 Adjusted Correlations with Factors Subtracted from One ndash (smaller values depict closeness in relationship and larger more distant)
Question 6a 6b 6c 7a 7b 8a 8b 9a 9b 9c 9d 10a
10b
11a
12a
12b
6a Households 000
6b Profitable market 090 000
6c Financial Decisions 108 086 000
7a Allocation of funds 094 079 096 000
7b Allocation of teams 095 092 100 046 000
8a Experimental relationships
100 097 099 060 057 000
8b Understanding poor
099 109 094 074 081 053 000
9a Increased customers 107 086 079 054 069 055 066 000
9b Increased shareholder value
107 092 093 062 071 059 063 040 000
9c Social responsibility 087 094 089 073 068 065 075 081 085 000
9d Reputation 079 103 083 079 076 062 074 075 069 054 000
10a Product technology 090 086 087 078 074 059 069 068 077 077 074 000
10b Price technology 091 084 076 077 071 067 069 075 084 069 075 045 000
11a Later profitability 094 091 082 090 081 077 077 075 082 073 071 063 082 000
12a Poverty alleviation 082 106 086 079 068 055 065 071 079 059 046 059 067 064 000
12b Resource use 097 106 101 069 081 086 086 077 081 071 077 070 075 085 047 000
127
Table 21 A Five Factor Principal Component Analysis with Varimax Rotation
Item Component
1 2 3 4 5 9b Increased shareholder value 08
9a Increased customers 0752 021
8a Experimental relationships 0691 024 0279
8b Understanding poor 0604 -0312
7a Allocation of funds 0592 0252 -0264 0451
7b Allocation of teams 0478 0308 0285 -0231 0328
12b Resource use 0775
10a Product technology 0233 0678 0288
10b Price technology 0649 0341 021
12a Poverty alleviation 0245 0568 0529 -023
9d Reputation 0312 0719
9c Social responsibility 0234 0665
6a Households 0659 0255
6c Financial Decisions 077
11a Later profitability 0221 0315 0455
6b Profitable market 0238 0805
128
Table 22 Cronbachrsquos Alpha on Factor 1 with Values after Item Deletion
Reliability Statistics on Factor 1
Cronbachs Alpha
Cronbachs
Alpha Based on
Standardised
Items N of Items
792 796 6
Item-Total Statistics
Item Squared Multiple
Correlation
Cronbachs
Alpha if Item
Deleted
9b Increased
shareholder value
397 754
9a Increased customers 435 746
8a Experimental
relationships
410 746
8b Understanding poor 272 783
7a Allocation of funds 389 754
7b Allocation of teams 355 775
129
Table 23 Cronbachrsquos Alpha on Factor 2 with Values after Item Deletion
Reliability Statistics on Factor 2
Cronbachs Alpha
Cronbachs
Alpha Based on
Standardized
Items N of Items
723 725 4
Item-Total Statistics
Item Squared Multiple
Correlation
Cronbachs
Alpha if Item
Deleted
10a Product technology 364 635
10b Price technology 320 669
12b Resource use 295 696
12a Poverty alleviation 357 642
130
Table 24 Cronbachrsquos Alpha on Factor 3 with Values after Item Deletion
Reliability Statistics on Factor 3
Cronbachs Alpha
Cronbachs
Alpha Based on
Standardized
Items N of Items
440 521 3
Item-Total Statistics
Item Squared Multiple
Correlation
Cronbachs
Alpha if Item
Deleted
9d Reputation 233 211
9c Social
responsibility
212 296
6a Households 045 626
131
Table 25 Cronbachrsquos Alpha on Factor 3 without item ldquoHouseholdsrdquo
Reliability Statistics on Factor 3 without Households
Cronbachs Alpha
Cronbachs
Alpha Based
on
Standardized
Items N of Items
626 629 2
Item-Total Statistics
Item Squared
Multiple
Correlation
Cronbachs
Alpha if Item
Deleted
9d Reputation 211 a
9c Social responsibility 211 a
a The value is negative due to a negative average covariance
among items This violates reliability model assumptions You
may want to check item codings
132
Table 26 Cronbachrsquos Alpha on Factor 4 with Values after Item Deletion
Reliability Statistics on Factor 4
Cronbachs Alpha
Cronbachs
Alpha Based on
Standardized
Items N of Items
296 302 2
Item-Total Statistics
Squared Multiple
Correlation
Cronbachs
Alpha if Item
Deleted
11a Later profitability 032 a
6c Financial Decisions 032 a
a The value is negative due to a negative average covariance
among items This violates reliability model assumptions You
may want to check item codings
133
Table 27 One ndashway Analysis of Variance on Gender
Descriptive Data for Gender
N Mean
Std
Deviation Std Error
Factor_1 Female 78 24968 58577 06633
Male 34 28529 64061 10986
Total 112 26049 62216 05879
Test of Homogeneity of Variances on Gender
Levene
Statistic df1 df2 Sig
Factor_1 100 1 110 753
Factor_2 007 1 110 936
Factor_3 1904 1 110 170
Factor_4 668 1 111 416
ANOVA for Gender
Sum of
Square
s df
Mean
Square F Sig
Factor_1 Between Groups 3003 1 3003 8267 005
Within Groups 39963 110 363 Total 42966 111
134
Table 28 One ndashway Analysis of Variance on Race
Descriptives
N Mean
Std
Deviation Std Error
Factor_4 Black 34 23235 75761 12993
Coloured Indian Asian 31 26452 64799 11638
White 48 26979 56248 08119
Total 113 25708 66436 06250
Test of Homogeneity of Variances
Levene Statistic df1 df2 Sig
Factor_1 1706 2 109 186
Factor_2 1951 2 109 147
Factor_3 525 2 109 593
Factor_4 1440 2 110 241
ANOVA
Sum of
Squares df
Mean
Square F Sig
Factor_4 Between Groups 3026 2 1513 3586 031
Within Groups 46408 110 422
Total 49434 112
135
Table 29 Onendashway Analysis of Variance on Age Groups
Descriptives
N Mean
Std
Deviation Std Error
Factor_1 Under 35 39 28761 49518 07929
35+ 73 24600 63737 07460
Total 112 26049 62216 05879
Test of Homogeneity of Variances Levene Statistic df1 df2 Sig
Factor_1 2899 1 110 091
Factor_2 006 1 110 938
Factor_3 104 1 110 747
Factor_4 032 1 111 857
ANOVA
Sum of
Squares df
Mean
Square F Sig
Factor_1 Between Groups 4400 1 4400 12548 001
Within Groups 38567 110 351 Total 42966 111 Total 49434 112
136
Table 30 Onendashway Analysis of Variance on the Bank Groups
Descriptives
N Mean
Std
Deviation Std Error
Factor_1 ABSA 54 26312 50766 06908
Nedbank 30 23444 76305 13931
Standard 28 28333 57378 10843
Total 112 26049 62216 05879
Test of Homogeneity of Variances Levene Statistic df1 df2 Sig
Factor_1 2490 2 109 088
Factor_2 1102 2 109 336
Factor_3 2730 2 109 070
Factor_4 748 2 110 476
ANOVA
Sum of
Squares df Mean Square F Sig
Factor_1 Between
Groups
3533 2 1767 4884 009
Within Groups 39433 109 362 Total 42966 111
ii
ABSTRACT
This research was designed to provide insight into South African financial
companiesrsquo activities among the poor or the BOP (Base Of the Pyramid) South
African businesses should build resources and capabilities with a strategic intent
to create and exploit the traditionally under serviced markets while delivering
goods and services that are of value In doing so managers marketers and
business leaders should view the South African adult population as households
and not individual decision makers
The aim of this study was to determine the applicability of an equal partnership
model for the BOP engagement in the South African economy In the investigation
of the equal partnership model it was found that the participants (including the
BOP as producers or consumers business local community members non-
governmental organisations and local government) could derive mutual value This
mutual value can be described as the enhancement in growth for the business
raising the BOP out of poverty involving the poor in the economy and boosting
national economic growth (through job creation tax revenue and investment)
Findings of this research supported the aspects of resource commitment
experiential preparation innovation and technology use in product or services
together with mutual value creation for all partners (especially the poor) In
addition there was support for the different levels of risk taken by the partners
responsibilities expected from participants the sustainability of the collaboration
and the required depth of understanding of BOP circumstances
Bank managers responded positively to there being value at the level of the poor
(such as profits poverty alleviation and improved reputation) The collectivist
nature of the poor in South Africa (in that the poor carry out financial decisions at
the household level) was not established in this research and needs further
investigation
iii
KEYWORDS BOP market equal partnership model mutual value creation poverty alleviation
iv
DECLARATION
I declare that this research project is my own work It is submitted in partial
fulfilment of the requirements for the degree of Master of Business Administration
at the Gordon Institute of Business Science University of Pretoria It has not been
submitted before for any degree or examination in any other university I further
declare that I have obtained the necessary authorisation and consent to carry out
this research
KAMLESH C VASANJEE _____________________ 10 NOVEMBER 2010
v
ACKNOWLEDGMENTS
I would like to express my sincere gratitude to the following
Sharita Thank you for your love and support for the last two years You were
patient and unselfish This was a joint effort and only possible with your help and
persistence
Umi Girish and Rakhi For tolerating us for the last two years when we were in
town We enjoyed the visits and hope you did too
Dr Clive Corder It has been an honour working with you as a supervisor Your
precious time and guidance is wholly appreciated
Ellie You always guided and helped when you could Thanks for the one-on-ones
especially when the wheel of pain kicked in
Lucian For holding the fort and picking up the pieces when things went bad It all
paid off in the end
Adriaan It was great having you around during this period with all your energy and
skill
Teddy Your little chat and idea led to this study Thank You
Ilona Kabira Sumaya Hennie Bheki colleagues at work and GIBS Your
encouragement ideas and support during the hard times assisted tremendously
vi
TABLE OF CONTENTS
CHAPTER 1 PROBLEM DEFINITION 1
11 RESEARCH PROBLEM 1 111 The BOP 1 112 Corporate Sustainability Poverty alleviation and Profit 2 12 SIGNIFICANCE OF STUDY 3 13 RESEARCH OBJECTIVES 4 14 SCOPE OF RESEARCH 5
CHAPTER 2 LITERATURE REVIEW 6
21 MARKETING STRATEGY AND AWARENESS 6 211 Awareness 6 212 The BOP Market 7 22 CORPORATE RESPONSIBILITY 7 221 Corporate Responsibility Corporate Social Responsibility and Corporate
Sustainability 8 222 Triple Bottom Line 9 223 Poverty Alleviation 10 23 MIND-SET SHIFT 12 24 IS THERE REALLY A FORTUNE AT THE BOP 12 25 BOP CHARACTERISTICS 14 251 BOP in the world 16 252 BOP 1 and BOP 2 17 253 Urban BOP 18 254 Poverty Factors and Forces 18 255 Valuing and Quantifying the BOP 20 256 BOP and the living Standard measure (LSM) 22 26 POVERTY REDUCTION- A MARKET BASED APPROACH 25 261 Managerial demands 26 262 Marketers and the BOP 27 263 Partnerships 29 27 EXAMPLES OF ENGAGING THE BOP 32 28 MODELS FOR WORKING WITH THE BOP 36 29 CONCLUSION 39
CHAPTER 3 RESEARCH PROPOSITIONS 43
31 COLLECTIVISM 43
vii
311 Proposition 311 43 32 BANK ACTIVITIES 43 321 Proposition 321 44 322 Proposition 322 44 323 Proposition 323 45 324 Proposition 324 45 325 Proposition 325 45 326 Proposition 326 45
CHAPTER 4 RESEARCH METHODOLOGY 46
41 RESEARCH CLASSIFICATION 46 42 RESEARCH DESIGN 47 43 DATA GATHERING PROCESS 47 44 QUESTIONNAIRE DESIGN 48 441 Pre-testing of the Questionnaire 49 442 Scale 49 45 UNIT OF MEASURE 51 46 POPULATION 51 47 SAMPLING METHOD AND SIZE 52 48 ANALYSIS APPROACH 54 481 Capturing of Data 54 482 Descriptive Statistics 55 483 Multivariate Analysis 55 49 LIMITATIONS OF THE STUDY 56
CHAPTER 5 RESULTS 58
51 INTRODUCTION 58 52 RESPONSE RATE AND DEMOGRAPHICS 58 53 EVALUATION OF PROPOSITIONS 59 531 Proposition 311 59 532 Proposition 321 60 533 Proposition 322 61 534 Proposition 323 62 535 Proposition 324 63 536 Proposition 325 64 537 Proposition 326 64 538 BOP as a profitable market 65
viii
54 RELATIONSHIPS BETWEEN THE ATTRIBUTES 66 55 METRIC MULTI-DIMENSIONAL SCALING (MMDS) 67 56 FACTOR ANALYSIS 67 57 RELIABILITY 71 58 DIFFERENCES BETWEEN GROUPS 73
CHAPTER 6 DISCUSSION 75
61 BANK ACTIVITIES 75 611 The poor in South Africa demonstrate collectivism in their economic activities and
are recognised as households and not individuals in developing partnerships
with a bank 76 612 Banks or branches need to commit long-term resources to a partnership at the
level of the poor 77 613 Banks need to experiment with different business models and prepare well before
going into an equal partnership venture with the poor 78 614 For a partnership venture with the poor there should be value created for the
bank at multiple levels such as increased profitability and improved reputation 80
615 There needs to be innovation by the bank in a simple technology new process or innovative product or service for a partnership with the poor 81
616 There is high financial risk for the bank in investing in the poor 81 617 The business or partnership with the bank should be economically and
environmentally sustainable for alleviation of poverty and careful use of
scarce resources These scarce resources required by the poor are money
electricity clean water and other raw materials 82 618 The BOP as a profitable market 83 62 UNDERLYING PERCEPTUAL DIMENSIONS 84 621 Enhancing stakeholder value 84 622 Customising solutions 86 623 Public perception 87 624 Financial risk 88 625 A profitable market 89 63 GROUP RESPONSES 89 631 Gender comparison 90 632 Age group comparison 90 633 Bank comparison 90 634 Race comparisons 91
ix
64 SUMMARY 91
CHAPTER 7 CONCLUSIONS AND RECOMMENDATIONS 93
71 KEY FINDINGS 93 72 RECOMMENDATIONS 95 73 IMPLICATIONS FOR FUTURE RESEARCH 96 74 LIMITATIONS OF RESEARCH 97
REFERENCE LIST 98
APPENDIX 1 EXAMPLES OF INVOLVING THE BOP IN THE ECONOMY 107
APPENDIX 2 THE CORNELL UNIVERSITY BOP PROTOCOL PROCESS 108
APPENDIX 3 THE INFORMED CONSENT LETTER AND STRUCTURED
QUESTIONNAIRE 113
APPENDIX 4 DESCRIPTIVE STATISTICS 119
APPENDIX 5 MULTIVARIATE STATISTICS 124
x
LIST OF TABLES 1 MIND-SET CHANGES REQUIRED FOR MANAGERS AND LEADERS TO INCLUDE THE BOP IN THE
ECONOMY (PRAHALAD 2002) 13 2 THE SOUTH AFRICAN PYRAMID DEFINED (SOURCE CHIP amp CORDER 2010A) 26 3 A SUMMARY OF MAJOR FINDINGS RELATED TO DOING BUSINESS WITH THE BOP 33 4 THE ONE SAMPLE TWO TAILED T-TEST ON RESULTS FOR PROPOSITION 311 60 5 THE ONE SAMPLE TWO TAILED T-TEST ON RESULTS FOR PROPOSITION 321 61 6 THE ONE SAMPLE TWO TAILED T-TEST ON RESULTS FOR PROPOSITION 322 61 7 THE ONE SAMPLE TWO TAILED T-TEST ON RESULTS FOR PROPOSITION 323 62 8 THE ONE SAMPLE TWO TAILED T-TEST ON RESULTS FOR PROPOSITION 324 63 9 THE ONE SAMPLE TWO TAILED T-TEST ON RESULTS FOR PROPOSITION 325 64 10 THE ONE SAMPLE TWO TAILED T-TEST ON RESULTS FOR PROPOSITION 326 65 11 THE ONE SAMPLE TWO TAILED T-TEST ON RESULTS FOR THE BOP AS A PROFITABLE MARKET 65 12 FACTOR VARIANCE AS DETERMINED BY EIGENVALUES 68 13 DESCRIPTIVE STATISTICS ON GENDER 119 14 DESCRIPTIVE STATISTICS ON RACE 120 15 DESCRIPTIVE STATISTICS ON AGE GROUPS 121 16 DESCRIPTIVE STATISTICS ON BANKS 122 17 DESCRIPTIVE STATISTICS ON TYPE OF BANKING 123 18 ONE SAMPLE TWO TAILED T-TEST RESULTS 124 19 CORRELATIONS OF THE BANKS PARTNERSHIP WITH THE POOR 125 20 ADJUSTED CORRELATIONS WITH FACTORS SUBTRACTED FROM ONE ndash (SMALLER VALUES
DEPICT CLOSENESS IN RELATIONSHIP AND LARGER MORE DISTANT) 126 21 A FIVE FACTOR PRINCIPAL COMPONENT ANALYSIS WITH VARIMAX ROTATION 127 22 CRONBACHrsquoS ALPHA ON FACTOR 1 WITH VALUES AFTER ITEM DELETION 128 23 CRONBACHrsquoS ALPHA ON FACTOR 2 WITH VALUES AFTER ITEM DELETION 129 24 CRONBACHrsquoS ALPHA ON FACTOR 3 WITH VALUES AFTER ITEM DELETION 130 25 CRONBACHrsquoS ALPHA ON FACTOR 3 WITHOUT ITEM ldquoHOUSEHOLDSrdquo 131 26 CRONBACHrsquoS ALPHA ON FACTOR 4 WITH VALUES AFTER ITEM DELETION 132 27 ONE ndashWAY ANALYSIS OF VARIANCE ON GENDER 133 28 ONE ndashWAY ANALYSIS OF VARIANCE ON RACE 134 29 ONEndashWAY ANALYSIS OF VARIANCE ON AGE GROUPS 135 30 ONEndashWAY ANALYSIS OF VARIANCE ON THE BANK GROUPS 136
xi
LIST OF FIGURES
1 C K PRAHALADrsquoS DEFINITION OF THE BOP AS THOSE THAT LIVE ON LESS THAN $4 PER DAY
(PRAHALAD 2002) 15
2 A BREAKDOWN OF THE SOUTH AFRICAN BOP (SOURCE AN EIGHTY20 AMPS 2008 ANALYSIS
WWWEIGHTY20COZAINSIGHTOUTMASS-MARKET-SOUTH-AFRICA) 22
3 BOP PRESENCE IN THE SA POPULATION IN LIVING STANDARDS MEASURE LSM)
TERMS (SOURCE AN EIGHTY20 AMPS 2008 ANALYSIS (2009) WWWEIGHTY20COZAINSIGHTOUTMASS-MARKET-SOUTH-AFRICA) 23
4 THE SOUTH AFRICAN PYRAMID (SOURCE CHIPP AND CORDER 2010A) 25
5 THE EQUAL PARTNERSHIP MODEL FOR THE ECONOMIC INVOLVEMENT OF THE BOP 41
6 BANK ACTIVITIES IN THE EQUAL PARTNERSHIP MODEL 44
7 LIKERT TYPE SCALE USED FOR THIS STUDY 50
8 THE EQUATION USED TO CALCULATE THE SAMPLE SIZE 53
9 VARIABLES RELATED TO THE PARTNERSHIP OF THE BANK WITH THE POOR 56
10 LIKERT TYPE SCALE USED FOR THIS STUDY 59
11 METRIC MULTI-DIMENSIONAL SCALING MAP OF ATTRIBUTES 68
12 METRIC MULTI-DIMENSIONAL SCALING MAP OF ATTRIBUTES WITH FACTORS 71
13 BANK ACTIVITIES IN THE EQUAL PARTNERSHIP MODEL 76
14 THE CYCLE OF ENHANCEMENT OF STAKEHOLDER VALUE THROUGH PARTNERSHIP WITH THE
POOR 85
15 OPTIMAL RESOURCE UTILISATION BY APPLICATION OF TECHNOLOGY IN COLLABORATING WITH
THE BOP FOR POVERTY ALLEVIATION 87
16 PARTICIPANTS FOR AN EQUAL PARTNERSHIP WITH THE POOR (OR BOP) 95
17 PROPORTION OF THE DIFFERENT SEXES 119
18 RACE COMPOSITION FOR THE SURVEY 120
19 AGE GROUP DISTRIBUTION 121
20 BANK DISTRIBUTION 122
21 TYPE OF BANKING 123
xii
ABBREVIATIONS
AMPS All Media and Products Survey
BOP Base Of the economic pyramid or the poor
CR Corporate responsibility
CS Corporate sustainability
CSR Corporate social responsibility
FMCG Fast moving consumer goods
GINI Measure of inequality of inequality of income or wealth
LSM Living standards measure
MMDS Metric multi-dimensional scaling
NGO Non-governmental organisation
PPP Purchasing power parity
SAARF South African Advertising Research Foundation
US$ United States Dollar
1
CHAPTER 1 PROBLEM DEFINITION
11 Research Problem Managers must be aware of the environment in which their businesses are
operating so that they can use their capabilities to take advantage of opportunities
to increase revenue or profitability (Andrews 1999) Hamel and Prahalad (1994)
supported the idea of businesses reinventing their industries It is apparent that
there is immense opportunity for business with the poor particularly when they are
regarded as both consumers and producers wielding trillions of dollars in
economic power (Prahalad 2006)
Prahalad and Hart (2002) expressed the need for business to profitably tap into
the huge consumer market at the base of the economic pyramid (BOP) in their
article ldquoThe Fortune at the Bottom of the Pyramidrdquo This may require firms to re-
define their ldquoprojected and served marketrdquo in order to capture a larger share of
future opportunities (Hamel and Prahalad 1994) Bottom and Base are used
interchangeably for the definition of BOP in this paper though the concept takes
on the same fundamental implication of the clientele that has in traditional
business mindsets been ignored and left untapped
111 The BOP
There are many conceptualisations of the BOP Olsen and Boxenbaum (2009
p101) define the base of the pyramid (BOP) within a context as ldquothe creation of a
new profit-seeking market opportunity to low-income segments in the developing
world with the simultaneous goal of contributing to the resolution of significant
societal problems ldquo Prahalad and Hart (2002) defined the BOP as the poor who
earn less than four United States dollars a day at purchasing power parity
2
Prahalad (2006) described the BOP as wielding trillions of dollars in economic
power especially considering the vast numbers that constitute this segment of any
economically active population
Hammond Kramer Katz Tran and Walker (2007) have identified four billion low
income consumers who constitute the base of the pyramid In all cases above the
BOP definitions are based on the principle of the tiered economic pyramid with the
poor at the base and in most cases making up the majority Karnani (2005)
however questioned the Prahalad and Hartrsquos (2002) definition of the BOP the
size of this population and argued that the BOP can be producers and not just
consumers In this perspective the BOP have immense influence in the success
or failure of a business venture that intends to tap into them from the view that
they are a potential and acquiescent market
South African Marketers need a definition of the BOP so that they can measure
track and investigate activities at the level of the BOP This is accomplished using
the Chipp and Corder (2010a) South African pyramid (comprising the foundation
core buttress and apex) developed through analysis of personal and household
data Chipp and Corder (2010a) used the South African Advertising Research
Foundation Living Standard Measure (SAARF LSM) that cuts across race and
other outdated techniques of categorising people LSMs one to four include the
poor based on criteria such as degree of urbanisation and ownership of cars plus
other appliances (SAARF 2010) and these four groups constitute 36 percent of
the South African Population
112 Corporate Sustainability Poverty alleviation and Profit There is increased recognition and popularity in the business world today of
corporate sustainability as a driver to the creation of a new market space such as
at the Base of the Pyramid (Margolis amp Walsh 2000) This recognition fits well with
3
the United Nations Millennium Development Goals that amongst many others
include hunger alleviation universal education environmental sustainability and
global partnerships (UN 2006)
Several authors (Hahn 2009 Sanchez Ricart and Rodriguez 2006) support the
principle of business corporations having corporate social responsibility for the
BOP because they must uphold the basic human rights of freedom and full
development as stated in the Universal Declaration of Human Rights (UN 1948)
Altman Rego and Ross (2009) also highlight that engaging with the BOP markets
will lead to organisational transformation with increased employee engagement
and stronger community relations Such an organisation will be attractive to both
customers and employees
Moore (2006) supports the need for business to look at the BOP market and
deliver goods and services that are of value to the BOP In doing so companies
will find new profitable markets which will increase both the values of the
companies and the lives of the customers they serve The emphasis is on enabling
the worldrsquos poor to create wealth by empowering the BOP through inclusion Kotler
and Lee (2009 p ix) emphasise that the cost of poverty exceeds by far the cost
that the poor themselves bear and therefore argue that such poverty ldquohellippours its
poison on the rest of mankindrdquo
The aim of this study is to develop a model that includes the BOP in the economy
as producers or partners The model developed from the literature review would
then be tested in the financial sector for applicability
12 Significance of Study
Business in South Africa needs to build resources and capabilities with a strategic
intent to create and exploit future markets A sustainable business strategy should
4
include the development of relationships with non-traditional partners co-inventing
custom solutions building local capacity creating markets creating lifestyles and
innovating Such a strategy would involve engaging with the BOP as consumers
and producers
Almost three million South Africans live on less than R5 per day 95 million live on
less than R10 per day and 182 million live on less than R20 a day (Eighty20
2009) This in total comprised 41 percent of the total population in SA in 2008
Chipp and Corder (2010a) defined the South African adult population as
households and not individuals and classified the BOP or poor in the LSM one to
four groups LSM one to four comprised of 36 percent of the Population in South
Africa a large and untapped market of 112 million adults
According to Corder and Chipp (2010b) the business need is as follows
ldquoMonitoring the Pyramid over time in an emerging economy should have
implications for the GINI coefficient the impact of government social grants
on household living standards and upward mobility of the poorest group in
society Business could track the impact of their anti-poverty efforts and reap
the rewards of consumer upliftment in the long term In turn the
attractiveness of emerging markets and their appetite for various products
and services would increase for many producersrdquo (p 18)
This research aims to give insight into the financial companiesrsquo activities among
the poor or the BOP
13 Research Objectives This research aims to identify the activities taking place with the BOP in the South
African financial sector The investigation intends to reveal the different aspects
5
found to be important to managers in engaging the BOP in comparison to the
model developed from the literature review in chapter 2
14 Scope of Research
This research is limited to the aspects of the relationship developed between
financial institutions and the BOP or poor
6
CHAPTER 2 LITERATURE REVIEW
This literature review identifies aspects of business strategy and business
activities within Bottom of Pyramid (BOP) markets or low-income groups
Firstly the link between strategy market and business is identified and developed
Then the aspect of the relationship between corporate responsibility and the poor
is investigated Next the mind-set shift of business and managers necessary for
an inclusive approach to the BOP is described Following the discussion on the
existence of the BOP characteristics of the BOP are presented The market based
approach to poverty reduction is raised next followed by examples of engagement
with the BOP or poor Finally models for engaging the BOP are explained and
integrated to the current research problem
21 Marketing Strategy and Awareness
211 Awareness
Synonyms to awareness are consciousness alertness responsiveness
sensitivity concern and knowledge Managers and leaders need to be aware of
sensitive to and concerned about their ecological and potential market
surroundings Andrews (1999) states that managers must be aware of the
environment in which they are operating This awareness leads to the ability of a
company to use its capabilities and profitably take advantage of opportunities This
implies that companies must adopt a global perspective and therefore take into
consideration the world the nation the community the industry and themselves
when making choices on a business opportunity This statement may not be
applicable to smaller businesses or concerns because of their limited reach and
constraining forces beyond the communities that they intend to serve
7
212 The BOP Market
Hamel and Prahalad (1994) express that for a firm to compete as a challenger it
must reinvent its industry continually This is the basis of the firm challenging its
own orthodoxies traditional practices that inhibit the potential of the firm In
addition Hamel et al (1994) describe a laggard as
ldquoa company where senior managers believe they know more about how the industry works than they actually do and what they do know is out of date rdquo (p60)
The definition of the firmrsquos ldquoserved marketrdquo (ibid p61) has to change in order to
capture a larger share of future opportunities and for the company to compete
favourably in the future Examples given by Warnholz (2008) are of Norway based
Telenor (which operates in Bangladesh and Pakistan) and Jamaican based Digicel
(which operates in Haiti) who have refused to accept the perceived inability of the
low income groups to take part in consumer markets Instead these two
companies have successfully created local consumer markets at the Base of the
Pyramid (BOP) The two companies have boosted both corporate and national
economic growth by amongst other achievements job creation tax revenue and
investment
The review above identifies the need for environmental awareness such as market
or industry knowledge understanding and utilising business capabilities and
industry innovation as crucial strategic aspects for a competitive and successful
business
22 Corporate Responsibility
Hammond et al (2007) state that
ldquoAddressing the unmet needs of the BOP is essential to raising welfare productivity and incomehellipEngaging the BOP in the formal economy must be a critical part of any wealth-generating and inclusive growth
8
strategyhellipto the extent that unmet needs informality traps and BOP penaltieshellipaddressing these barriers may also create significant market opportunities for businessesrdquo (p 5)
It is clear from the above statement that Hammond et al (2007) subscribe to
mutual inclusion of the poor in the re-invention of strategy and the pursuit of
business responsibility
Contrary to this statement Milton Friedman (1962) argued that the only social
responsibility of business is to pursue profit as vigorously as possible (within the
law) Friedman (1962) believed that the state was responsible for all the other
social needs of its people Prahalad and Hart (2002) express the need to develop
a more innovative business model conceding the profit motive but also accepting
corporate social responsibility However the development of embedded ties with
the local community members non-governmental organisations and local
governments favours a bottom up process This statement by Prahalad and Hart
(2002) brings into discussion the principle of corporate responsibility (CR)
221 Corporate Responsibility Corporate Social Responsibility and Corporate Sustainability
With no clear definition of corporate social responsibility (CSR) or CR
(abbreviation for CSR in most cases) Van Marrewijk (2003) concludes that the
Linnanen and Panapanaansrsquo (2002) model suffices This model includes
economic environmental and social responsibility by business under the umbrella
of CR or CSR
Whitehouse (2006) concludes (through her survey of 16 United Kingdom
companies) that the duties of directors are firstly guided by the principle of
enhancing shareholder value then accounting for the interest of employees
consumers and the environment as proposed by the UK government This finding
9
opposes the first Millennium Development Goal of the United Nations (UN 2006)
which calls for the eradication of extreme poverty and hunger in the world
There is increased popularity of corporate sustainability (CS) as a driver to the
creation of a new market space such as at the Base of the Pyramid (Margolis and
Walsh 2000) CS discussed in Van Marrewijksrsquo (2003) article focuses on value
creation environmental management environmental friendly production systems
human capital management and social issues Both CS and CSR are voluntary
company activities that demonstrate the inclusion of social and environmental
concerns in business operations and in interactions with stakeholders Naidoo
(2009) found commonalities between the concept of BOP and corporate social
initiatives but found no evidence of corporate social initiatives and loyalty by the
BOP These are the concepts of creating or increasing company profits and the
upliftment of the poor
222 Triple Bottom Line
Cummings and Worley (2009) below describe the triple bottom line as a
multidimensional view of corporate sustainability
ldquohelliptriple-bottom-line proposes that organisational change and globalisation should be guided by the economic social and ecological values that are added or destroyedhellipThis involves being clear about the companyrsquos purpose and taking into consideration the needs of all stakeholders shareholders customers employees business partners governments the ecology local communities and the publicrdquo (p 708)
Considering the above elaborate definition corporate sustainability covers both
concepts of ldquodoing businessrdquo or making a profit and ldquodoing goodrdquo or making a
difference to the community in which the corporate organisation operates
(Martinez and Carbonell 2007 p52) These principles of corporate responsibility
corporate sustainability and triple-bottom-line all link in the broader sense with
doing business profitably in a responsible or ethical manner and in a manner
10
which meets the needs of today without compromising the needs of future
generations
The UK governmentrsquos definition of sustainable development (Rost and Ydreacuten
2006) is about ensuring a better quality of life for everyone now and for
generations to come Adapting this perception to the South African context the
implication is that a BOP-strategy developed by business together with its market
will result in a sustainable market development strategy When these strategies
are pursued responsibly they can lead to a triple-win situation for the poor private
enterprises and the environment Olsen and Boxenbaum (2009) in their research
identified external barriers (which include lack of infrastructure low education
levels and lack of buying power) and internal barriers (which include conflicting
mindsets radical changes to routines project evaluation criteria incentive
structures and discrepant mandates) as pivotal factors that prevent organisations
from taking this strategic step
223 Poverty Alleviation
Hahn (2009) emphasises the opportunities to do business at the BOP and
highlights the aspect of corporate citizenship for the purpose of poverty alleviation
as an important consideration Additionally Hahn (2009) states that corporate
citizenship offers an ethical and pragmatic reason for business to engage in
poverty alleviation In Hahnsrsquo (2009) paper he reiterates that corporations are
responsible for the BOP because they must uphold the basic human rights of
freedom and their operations should be committed to human development as
stated in the Universal Declaration of Human Rights (UN 1948)
Additionally Hahn (2009) states that multinational corporations have a special
influence on the global situation and over national states which then extends their
obligation to the above mentioned human right of poverty alleviation The manner
in which the development of the BOP takes place must be without causing
11
disastrous effects on the ecological environment (Hahn 2009) Hahn (2009) then
described a model where measures to reduce poverty are linked to a slow-down of
population growth to prevent excessive pressure on the environment
Organisations stimulating commerce and economic development in low income
groups (such as the BOP) may improve the lives of billions of people and create a
more stable sustainable and inclusive world (Sanchez et al 2006) Altman Rego
and Ross (2009) express that engaging with the BOP markets will lead to
organisational transformation increased employee engagement and stronger
community relations In their article Altman et al (2009) state that as the demand
for a triple-bottom-line business model grows companies that serve the BOP can
be more attractive to both customers and employees This is the critical point in
terms of employee engagement because there is a demonstrable link that
enhances mutual community relations
Business in South Africa needs to build resources and capabilities with a strategic
intent to create and exploit future BOP markets A sustainable business strategy
should include the development of relationships with non-traditional partners co-
inventing custom solutions building local capacity creating markets creating
lifestyles and innovating Such a strategy would involve engaging with the BOP as
consumers and producers
With innovative business models companies can develop embedded ties with the
local community members non-governmental organisations (NGOs) and local
governments with opportunities to do business at the BOP Corporate citizenship
offers an ethical and pragmatic reason for business to engage in poverty
alleviation Corporate social initiatives will require organisational transformation
with increased employee engagement and stronger community relations
12
23 Mind-Set Shift
South Africa as an emerging economy has a high GINI coefficient of 679
(Pressley 2009) which effectively measures the big difference in the wealth
between the rich and the poor amongst other factors The poor being in the
majority of the population (36 percent or 112 million people 16 years or older as
specified by Chipp and Corder (2010a)) constitute a potential market which has
not been tapped to its fullest in South Africa
Prahalad (2002) comments that the solution to the increasing divide between rich
and poor throughout the world requires a significant shift in the mind-sets not just
of managers and entrepreneurs but also of politicians non-governmental
organizations (NGOs) and bureaucrats (p6) Prahalad (2002) continues the
argument by stating that the focus should be on experimentation and not on
refining the already unsuccessful business models and solutions Successful
business innovation needs to be made visible and the principles should then be
applicable elsewhere
Mind-set changes necessary for an inclusive approach to the BOP in the economy
of a country are included in Table 1 below as adapted from Prahalad (2002)
Moore (2006) supports the need for business to look at the BOP market and
deliver the goods and services that are of value to the BOP The importance of
mind-set change is on enabling the worldrsquos poor to participate in the enterprise and
create wealth for them in turn
24 Is There Really A Fortune At The BOP
Karnani (2005) counters Prahaladrsquos (2006) argument in stating that
ldquohellipnot only is there no fortune there is not even glory at the bottom of the pyramid It is a fallacy to claim that there is much ldquountappedrdquo purchasing power at the BOP hellipThe only way to help the poor and alleviate poverty is to raise the real income of the poor There are only two ways to do this
13
lower prices of the goods that the poor buy (which will in effect raise their income) or raise the income that the poor earnrdquo (p 100)
For Karnani there is no inherent fortune at the bottom of the pyramid as
prescribed by Prahalad (2005) Karnani (2005) then provides solutions to market
to the poor which include significant reduction in price by innovatively changing the
price-quality trade-off with a value offer to the poor
Table 1 Mind-set Changes Required for Managers and Leaders to Include the BOP in the Economy (Prahalad 2002)
From To Poor as a problem Poor as an opportunity to innovate a global
market Poor as dependants of the state or welfare
Poor as an active market or consumers
Old technology in business Bundling of most advanced technology with a local flavour
Follow Western principles in business Selectively ldquoleap-frogrdquo the West and innovate
Focus of the business on resources and constraints
Focus on creativity and entrepreneurship
Capital limitations or access No limitations to information hence enhanced access
Efficiency in a known model Innovation of a new model
Another aspect highlighted by Karnani (2005) where business can profit is by
focusing on the poor as producers rather than focusing on the poor as
consumers Karnani (2005) states that the importance of making markets more
efficient is for the poor to retain more value from their outputs The best way to do
this is through training the poor to upgrade their skills and improve productivity
There is a need to create more opportunities for the employment of these very
poor Karnani (2005 p109) considers these steps as the real ldquoFortune at the
Bottom of the Pyramidldquo
14
Warholtz (2007 p1) counters Prahaladrsquos (2005) view as an ldquoopportunity missedrdquo
Selling to the poor may not eradicate poverty (Warnholz 2007) Instead it will hurt
small businesses and threaten local jobs and in the process incomes Warholtz
(2007) indicates that household surveys throughout the world show a smaller BOP
size a view supported by Karnani (2005) of less than five percent of the
household survey population Karnani (2005) and Warholtz (2007 p3) have
expressed their concern that everyone in developing countries has been classified
as a lsquopoorrsquo consumer in most of the BOP literature clouding the reality that there is
a rich segment at the top
Taking into consideration the arguments presented above there does exist a large
population of the poor who must be involved in the economy in the best way
possible to pull them out of poverty What stands out in this whole review is the
fact that the BOP should not be imagined as consumers but most importantly as
producers Incorporating them at this level empowers them more than a
consumerist perception
25 BOP Characteristics
According to Hammond et al (2007) and Warnholz (2007) the BOP occurs at two
different levels those one billion individuals that earn below one United States
dollar a day in local purchasing power and those four billion individuals who earn
well below any Western poverty line (which is approximately four dollars in local
purchasing power) Hammond et al (2007) have further identified four billion low-
income consumers who constitute the BOP and make up the majority of the
worldrsquos population
However Olsen and Boxenbaum (2009 p101) define the base of the pyramid
(BOP) as ldquothe creation of a new profit-seeking market opportunity in the low-
income segments in the developing world with the simultaneous goal of
contributing to the resolution of significant economic and societal problems in
15
these regionsrdquo This defines the BOP within a context in comparison to the
Prahalad and Hart (2002) definition of the BOP as the poor who earn less than
four United States dollars a day at purchasing power parity and exist as an
untapped yet potential target for firms facing market saturation in established high
income markets (see Figure 1 below) Prahalad (2006) therefore logically
perceived the BOP as wielding trillions of dollars in economic power
Contrary to most other definitions Simanis (2009) argues that the BOP is not
actually a market Simanis perceives rather a consumer market as a lifestyle built
around a product or service Therefore Simanis (2009) reiterates that companies
must create markets or lifestyles among the poor that will stimulate the poor into
recognising their power not just as consumers but also as an empowered market
There is benefit for both the BOP households and corporate business to serve
these traditionally unlikely markets
Figure 1 C K Prahaladrsquos Definition Of The BOP As Those That Live On Less Than $4 Per Day (Prahalad 2002)
16
251 BOP in the World
Hammond et al (2007) have revealed that the 72 percent of the worldrsquos 5575
million make up the BOP with a large proportion of this population resident in
Africa Asia Eastern Europe Latin America and the Caribbean In Africa generally
the BOP is predominant in the rural areas though it is a fact that the urban areas
also have their significant share of the marginalised and poor
According to the economic statistics website NationMaster (CIA World
Factbooks 2003 to 2008) fifty percent of the South African population was lying
below the poverty line in 2000 and the country is ranked twenty third amongst the
poor and developing countries listed This poverty estimate is based on economic
surveys of population subgroups and the definition of poverty is specific to South
Africa
In describing the BOP it is evident that they are not involved or integrated in the
global market economy (Hammond et al 2007) They have significant unmet
needs such as financial services housing and utilities such as electricity water
sanitation telephone service and health care The BOP is dependent on informal
or a subsistence source of income which are considered poverty traps in the vast
literature on developing and underdeveloped economies Intermediaries exploit
their handcraft artefacts crops and labour
The same bottom of the pyramid sector tends to pay higher prices for goods and
services than other income groups and often they receive lower quality goods
Examples of these goods or services are the cost of transport health care and
financial services (when they have to borrow from established financial institutions
and informally)
17
252 BOP 1 and BOP 2
Louw (2008) in his paper describes the confusion that existed with regards to the
BOP market size and market value Louw (2008) identified the following BOP
venture characteristics in his research
bull The target markets were both implicit and explicit
bull The offering was a product or service
bull Partnerships were important for a BOP venture
bull There was need for an innovative business process product or technology
bull Technological novelty was important
bull Profitability and Sustainability were interlinked
Louw (2008) then went on to define the BOP at two market levels BOP1 and
BOP2
The BOP1 were defined as those individuals who earn below two United States
dollars a day the absolute poverty line defined by the World Bank adjusted for
local purchasing power parity (PPP) This population of BOP1 accounts for 28
billion people in the world which is about 70 percent of the four billion BOP
defined by Prahalad and Hart (2002) Louw (2008) attributed the following traits
and attributes to the BOP1 market in his case analysis
bull Sales to them consisted of mainly services with some consumer goods
and products
bull The successful market sectors were health financial services
(particularly in the form of short term high interest loans) and fast moving
consumer goods (FMCGs)
bull There was an improvement of business processes through the
involvement of Government or NGOs
bull Branding was important
18
The BOP 2 market included those individuals who earn more than two United
States dollars a day adjusted for local PPP The characteristics of the BOP2
market identified by Louw (2008) were the following
bull Greater than two dollars a day was a typical income of customers in this
market
bull There was need for product or business process innovation for success
bull Technology was important and played a key role in all cases
bull Products and services were successful in this sector but local partners
and NGOs were required for delivery and distribution
bull Multi National Corporations were the only examples where local partners
or NGOs were not required
253 Urban BOP
Ireland (2008) in his study defined the urban BOP and found them to be a more
attractive clientele than the rural BOP The two reasons cited by Ireland (2008)
were firstly that the urban BOP is a large growing market that spends most of its
income on consumer goods Secondly the urban poor do not require any of the
adaptations needed for marketing to the rural BOP Therefore for Ireland (2008)
the urban BOP is exploitable in comparison to the rural BOP who might be more
conservative There is a great deal more entrepreneurship with informal trade in
the form of backyard industries workshops and stalls that make the urban BOP
market a little more complex as they are both consumers and producers
254 Poverty Factors and Forces
Kotler et al (2009) cited factors and forces that contribute to the continued poverty
of the BOP as the following
bull Poor health which may be due to the lack of affordable health care the
spread of disease such as malaria low levels of physical activity and
19
inadequate nutrition This statement implies that disease is more
prevalent in poverty stricken societies than others
bull The difficulties encountered in the presence of adverse environmental
factors These include examples such as low soil fertility due to
erosion deforestation and water contamination
bull Difficult economic conditions such as unemployment low wages and
government failure both economic and political that result in little or no
support for the poor
bull Inefficient infrastructure and services such as roads sewage water
supply and electricity
bull Limited access to education
bull Social factors such as crime domestic violence wealth distribution and
beliefs
bull Lack of family planning such as access to counselling and related
services
bull High energy prices in recent years
bull The rise of China with its strong economic growth and thirst for world
resources The rise of China has created a perceived threat to
ldquoestablishedrsquo business It has brought in a lot of competition and
therefore there is no longer ldquobusiness as usualrdquo A lot more aggressive
strategies have had to be adopted in order to lsquostoprsquo Chinese infiltration
bull The advent of bio-fuels which utilise farmland commonly abundant in
the BOP areas and the resulting rise in the price of food further making
basic needs out of reach for the BOP
bull Droughts which have reduced the output of food
bull Dietary changes in growth economies and hence higher demand for
better quality (which those in the BOP cannot afford) and volumes of
food
bull Global warming (which largely emanates from developed economies
but has devastating effects on the BOP) which has contributed to
20
drought conditions and lower food production in equatorial and tropical
areas
bull The recession due to the financial meltdown in 2008 which led to
factories closing lost jobs and hence an added increase in the number
of poor particularly in the developing and under-developed economies
These factors continue to contribute and exacerbate the economic position of the
poor
255 Valuing and Quantifying the BOP
Hammond et al (2007) have valued the BOP as a five Trillion dollar market
Additionally Hammond et al (2007) state that significant opportunities exist for
market based approaches to better meet these four billion consumersrsquo needs This
would increase their productivity improve their incomes and empower them for
entry into the formal economy In their report Hammond et al (2007) determined
that the people at the BOP earn less than $3000 (in local purchasing power parity
with the reference year being 2002) Examples of other BOP incomes range from
US$156 a day in India to US$335 a day in Brazil (these incomes were based on
2007 surveys and are in US dollars)
The four billion BOP market with an income of four trillion dollars (in purchasing
price parity) makes up the following percentages in the respective regions
identified below (Hammond et al 2007)
bull Africa ndash 95 percent of the population (surveyed) and 71 percent of the
purchasing power
bull Asia inclusive of the Middle East ndash 83 percent of the population and 42
percent of the purchasing power
bull Latin America and Caribbean -70 percent of the regionrsquos population and
28 percent of purchasing power
21
bull Eastern Europe ndash 64 percent of the regionrsquos population and 36 percent
of the purchasing power
The sector markets for the BOP range in size from the largest being food and
medium being health transportation housing and the least being energy
Hammond et al (2007) identified the smallest market sectors for BOP as water
and information and communication technology
Chen and Ravallion (2008) describe the main poverty line at $125 a day at 2005
prices being the average poverty line found in the poorest ten to twenty countries
investigated Estimates by Chen and Ravallion (2008) place the number of people
living on less than $125 per day (at 2005 prices) at 14 billion people A billion
people will still live on less than $125 a day in 2015 and those that escape this
level will still earn much less than the middle-income and rich of their respective
countries In Sub-Saharan Africa the number of poor has nearly doubled from 202
million in 1981 to 384 million in 2005 (Chen and Ravallion 2008) but there have
been signs of progress from 1996 to 2005 where the poverty rate has fallen from
58 percent (or 348 million) to 50 percent (or 384 million) due to improved
economic stability
According to a 2009 Eighty20 report (for which data was sourced from All Media
and Products Survey [AMPS] 2008 RA of the South African Advertising Research
Foundation [SAARF] that has been conducted annually for over thirty years)
almost three million South Africans live on less than five Rand per day (see Figure
2 below) 95 million live on less than ten Rand per day and 182 million live on
less than R20 a day Most of the BOP in SA survive on government grants and the
BOP figure would significantly increase if it excluded those catered for by
government social grants The government grants amount to substantial quantities
when unemployment old age pension and child grants amongst others are taken
into account
22
Figure 2 A Breakdown of the South African BOP (Source An Eighty20 AMPS 2008 analysis eighty20cozainsightoutmass-market-south-africa)
256 BOP and the Living Standards Measure (LSM)
Approximately 50 percent of households in South Africa in the Living Standards
Measure (LSM) range of one to eight consist of those who earn less than R20 per
day based on the 2008 figures (see Figure 3 below) Of the total population in
2008 41 percent constitute the BOP (Eighty20 2009)
Based on the Eighty20 analysis (2009) BOP households in SA in 2005 spent 35
percent of their income on food ten percent on transport ten percent on clothing
nine percent on furniture and six percent on recreation (which includes
entertainment personal care and culture) Other spending is in areas such as
social protection communication financial services transfer of funds to others
education health alcohol tobacco and savings The last two tobacco and
savings accounted for one percent each The implications are for corporations to
tap into the BOP consumers in the areas of food transport clothing and furniture
in SA
23
Figure 3 BOP Presence in the SA Population in Living Standards Measure LSM) Terms (Source An Eighty20 AMPS 2008 analysis (2009) wwweighty20cozainsightoutmass-market-south-africa)
Chipp and Corder (2010a) identified the LSM measure as a better descriptor to
classify South African Adults regardless of ethnic group than any other single
demographic variable Marketing and marketing research experts developed the
LSM system (for its applicability in business) by identifying specific independent
variables on which a principal component analysis was applied These
independent variables include the possession of the following assets and items
polisher or vacuum cleaner fridge or freezer television set water or electricity in
the home washing machine number of cars hi-fi music centre sewing machine
frequency of supermarket shopping rural dweller number of domestic servants
VCR and tumble dryer Based on the principal component scores respondents
were then divided into LSMs
LSMs provide an understanding of the living conditions of the South African
populations that fall into each bracket (Chipp and Corder 2010a) Of interest to
Chipp and Corder (2010a) in their LSMs analysis was the living conditions of the
poor Chipp and Corder (2010a) provided a model of the living standards of
24
different household groups in South Africa using the LSM variables stated earlier
(with source data from the 2008 to 2009 AMPS reports and South African
Advertising Research Foundation [SAARF] reports in 2009)
The model in Figure 4 and Table 2 below divides the population of South African
adults (16 years and older) into four categories of a pyramid Firstly the Apex or
group A (which includes LSMs 9 and 10) makes up 143 percent of the South
African population Next the Buttress or group B (LSMs 7 and 8) comprises 163
percent of the population Thirdly the Core of group C (LSMs 5 and 6) makes up
336 percent of the population and lastly the Foundation of group D (LSMs 1 to 4)
comprises 358 percent of the South African adult population
Chipp and Corder (2010a) stated that their ldquostudy provides strong support for a
clear dollar and household definition of BOP based on living standard and thus
dollars earned per day are descriptors rather than determinants of the BOP ldquo (p1)
A household definition characterises the manner in which South African
households operate financial matters require joint decision-making and co-
operation at household level not at individual levels The Chipp and Corder
(2010a) South African pyramid indicates that there is collectivism rather than
individualism at the lower levels of the SA Pyramid This collectivism is a result of
the scarcity of the dollar the irregularity of income at times the absence of any
income to the extent that whatever has been earned is extended to cover every
household member and to buy only the most immediate and basic needs
In addition to their previous report Corder and Chipp (2010b) reported that ldquoa
higher incidence of collectivism among the lower tiers of the South African
Pyramid indicate that from an African perspective therefore the BOP should be
considered from a group perspective rather than a Western view of the individualrdquo
(p10) Hence Corder and Chipprsquos (2010b) recommendation to marketing
researchers and managers
25
ldquoThus to view the low income consumer and their earnings per day in isolation from their households and dependencies would limit researchers from gaining a fuller perspective on this segmentrdquo (p10)
Figure 4 The South African Pyramid (Source Chipp and Corder 2010a)
Foundation 36
Core 34
Buttress 16
Apex 14
0
10
20
30
40
50
60
70
80
90
100
SA Pyramid
26 Poverty Reduction- A Market Based Approach
Businesses need to identify opportunities consider robust business models
develop products and expand investment into the BOP markets This is even
more important in the developing world (Hammond et al 2007) where it is
possible for poverty alleviation to be framed as an enabling opportunity and
less in terms of aid A market based approach views the BOP as consumers
and producers and aims at finding solutions and making markets more
efficient competitive and inclusive (Karnani 2005) The BOP can then benefit
from these markets A market-oriented approach looks at goods and services
provision at affordable prices and in a sustainable manner to meet the needs
of the BOP market
26
Table 2 The South African Pyramid Defined (Source Chip amp Corder 2010a)
TOTAL The South African Pyramid lsquo000 The Adult Population (lsquo000) equivalent to 16+ years 31305 100 The Apex of the Pyramid (Group A ndash LSMs 9 amp10) 4463 143 The Buttress of the Pyramid (Group B - LSMs 7 amp 8) 5105 163 The Core of the Pyramid (Group C - LSMs 5 amp 6) 10534 336 The Foundation of the Pyramid (Group F - LSMs 1-4) 11194 358
261 Managerial demands
Prahalad (2002) outlines the following as critical managerial demands in creating a
market at the BOP
bull The price-performance view of products must change It must not be
necessary that good quality and adequately sized products be
expensive
bull Business models must be scaleable or transferable to address the
needs of the hundreds of millions at the BOP
bull The business models must be environmentally sustainable due to
shortages of resources critically financial in rural areas The production
methods or processes must consume little or limited resources without
sacrificing product performance
bull Innovation integrating advanced technologies and local conditions for
innovative solutions should lead towards opportunity at the BOP for
experimentation
Rangan (2002) in his commentary on Prahaladrsquos (2002) paper added two
more aspects to the managerial demands which are
27
bull The economic sustainability of the business model (and not just
environmental sustainability) and
bull The societal value-add of a product or service as a criterion so that
there is an enhancement in the consumerrsquos quality of life
262 Marketers and the BOP
Nilesen and Samia (2008) reveal three major implications for marketing managers
to serving the BOP marketplace These are
bull BOP consumers and producers are intertwined Their interrelationships
must be taken into consideration in strategic business planning
bull There are many lessons to be learnt from BOP entrepreneurs who have
developed innovative products pricing promotion and distribution
strategies to meet the needs of BOP consumers and
bull Co-operation with facilitating organisations such as local businesses
public agencies and non-governmental organisations can lead to win-
win solutions for BOP producers and consumers This then ensures
long-term business relationships and success in the BOP marketplace
Pitta Guesalaga and Marshall (2008) state the need for management or marketing
strategists to view the BOP as both consumers and producers To better design a
business approach to the BOP companies must understand their market needs
perceptions and behaviour In so doing companies must recognise that dealing
with the BOP will require a different business model that encompasses access to
micro-credit the establishment of alliances and the adaptation of the marketing
mix BOP markets involve many challenges in terms of technical and economic
infrastructure education financial resources and cultural differences
Stuart L Hart in a journal interview by Powell (2006) stated the urgent need for a
BOP model to work by finding
28
ldquohellipthe right partners on the ground ndash people who are locally embedded who really understand who are trusted and are visible in the space that yoursquore trying to reach hellipYou canrsquot really know who the appropriate partners are until you get there and spend some time on the ground hellip The network or eco-system of partners that you put together is not going to look anything like the partnerships that you have been accustomed to dealing with at the top of the pyramidldquo (p 1482)
Marketersrsquo approach to the BOP (Pitta et al 2008) should be in an innovative and
different manner by reinventing themselves and their strategies Modifying
products (as sold to the market at the top of the pyramid) and selling them will lead
to business failure Knowing the BOP intimately is a key to success with sources
of intelligence being at the grass roots level in order for the business entity to
understand the voice of the BOP consumer Hence collaborating effectively with
agents ldquoon the groundrdquo is critical Trust and visibility of the agent are paramount in
this regard Should the BOP ecosystem perceive the business entity in their midst
as an outsider then they are likely to resist or even boycott the services and
products offered leading to an inevitable loss and consequent collapse of the
entity
Pricing is of utmost importance in servicing the BOP Micro-credit at the BOP
provides one possible solution to providing finance for the purchase of value
creating products and services (Pitta et al 2008) Investment in the BOP will be for
long-term involvement There is high risk in investing in the BOP such that if profits
come they will come later rather than sooner Finally some products are just not
for the poorest of the BOP such as those of questionable value and others which
are too expensive
One of the lessons stressed by Hammond and Prahalad (2004) was that
ldquoSuccessful product development requires a deep understanding of local
circumstances so that critical features and functionalitycan be incorporated into
the productrsquos designrdquo (p34)
29
263 Partnerships
Willie and Barham (2009) in their report identified areas that need attention to
achieve business success in collaboration with the BOP These areas of attention
are such that they would benefit both sides
bull There should be more coverage in literature the financial press other
media and politics of investment by business for the emergence of the
BOP from poverty The focus of this reporting should be on the potential
for business at the base of the economic pyramid
bull Businessrsquo role in society is to gain and maintain a good reputation apart
from just wealth creation It is in the interest of companies to be seen to
be contributing to society
bull Some altruism and philanthropy by business go hand-in-hand with the
profit motive
bull There should be harmony and cooperation between NGOs and
companies Companies should seek the advice and cooperation of the
NGOs when engaging with the BOP
bull Companies should set up a specific commercial unit to engage with the
BOP and other needy populations Profit maximisation must not be the
main goal
bull Companies should coordinate their efforts with the BOP to address a
number of problems simultaneously Companies must avoid a synergy
of failures
bull Coordinating efforts with others would complement efforts with the
BOP Systems that are simple with limited bureaucracy can be
developed with NGOs and government
bull A government department could form a coalition with companies with
different core competencies to deal with the needs of specific
communities
30
bull Companies could adopt the Cornell University BOP Protocol system
(Simanis and Hart 2008b) to consider whether to adopt it See
Appendix 2 for more details on the Cornell University BOP Protocol
The Cornell University BOP protocol covers processes under the
banners of pre-field processes (including identifying sites for project set
up team selection plus preparation and partner selection) in-field
processes (including building the business and embedding it in the
community through three phases) and finally scaling out which involves
efficient transfer and re-embedding the model in hundreds of other
communities
bull Companies planning ventures with the BOP would need to recognise
the need for careful and meticulous preparation
bull Companies both big and small in countries with a large number of
people living in dire poverty must recognise their social and corporate
responsibility to these people
Good work has been done in the area of lsquobusiness and the BOPrsquo but in the global
sense it is very limited according to Willie and Barham (2009) If the BOP are to be
left in poverty then business will suffer the consequences of global instability and
depletion of vital natural resources
Sanchez et al (2006 p20) define social embeddedness in a low-income market as
ldquoThe integration into diverse local networks that leads to the development of long-term and co-operative relationships which result in the achievement of common benefits for all the players involved in the networkrdquo
The authors describe three conditions under which firms have greater incentives to
build embedded ties and partnerships and these are
31
bull An under-developed market oriented system meaning a framework
which allows both private sector and social participants to work together
in a symbiotic relationship
bull A high psychic distance between the organisation and the low-income
markets or in other words the degree to which a firm is uncertain of the
characteristics of a BOP market and
bull The degree of personalised co-creation experiences offered by the firm
which are the processes in which the consumer interacts with different
actors and co-creates value in each business interaction
Social embeddedness contributes to creating the competitive business advantage
and may create more total value both socially and economically (Sanchez et al
2006)
Taking their cue from the submissions above Martinez and Carbonell (2007)
describe the following factors for sustainable ldquoBusiness Social Actionrdquo
bull It must be voluntary triggered by the possibility of a business
opportunity
bull The action must tie in with the business strategy and align with key
skills
bull Funds must be committed fully and consistently
bull There should be openness in application for anyone to participate
bull Extends the opportunity as lessons learned for replication in other
similar environments
Sanchez et al (2006) support this argument for successful competition in low-
income segments This is achieved by training and educating partners across all
levels to get responsible partners providing incentives and building the ability to
self govern
32
Simanis (2009) supports the idea of organisations ldquogetting the community involved
in creating implementing and shaping the business itselfrdquo (p 7) In addition
Simanis (2009) recommends that companies present as many uses of their
product in their marketing strategy as possible Altman et al (2009) maintain the
idea that organisations should meet the demands of the BOP by developing
relationships with local delivery providers social development players
entrepreneurs government officials and potential customers Organisations will
need to develop people or teams who can work in BOP environments and with
non-profit organisations that have scarce resources (Altman et al 2009) These
individuals and teams will need to learn how to create alliances build economically
sensitive movements tap passion and unlock the business potential Table 3
below summarises the aspects of working with the BOP identified in this literature
review
27 Examples of Engaging the BOP
Experience with viable business strategies (Hammond et al 2007) justify far closer
business attention to the opportunities that the BOP present to ecologically
conscious business ventures (see Appendix 1 for more details on the examples
below) Examples cited by Hammond et al (2007) and others include
bull CEMEX (the largest cement producer in the Americas) based in Mexico
which is an enterprise that focused on making housing accessible to the
poor by providing a lsquopay-as-you-gorsquo system for materials and
instructions as needed
bull Jaipur foot which is an Indian business that focused on providing
artificial limbs
bull HLL salt Annaoura in India (a company that aimed at improving health
through supplying iodised salt)
33
Table 3 A Summary of Major Findings Related To Doing Business with the BOP
Factors in working with the BOP Action by Business
Action by BOP
1 Scaled down affordable products and services Yes No
2 Innovation in product service or processesco-creation
Yes Yes
3 Application of new technology Yes No
4 Partnerships community involvement Yes Yes
5 As consumers No Yes
6 As producers Yes Yes
7 Accountability and responsibility Yes Yes
8 Build relationships with NGOs and government Yes Yes
9 Build BOP oriented teams or departments Yes No
10 Training and education plus skills development Yes Yes
11 Voluntary association Yes Yes
12 Full consistent commitment of funds Yes No
13 Replication of venture in different environments Yes No
14 Long term association with little or no payback Yes Yes
15 Addressing problems of the poor for the benefit of all
Yes Yes
16 Improving societal view or reputation Yes No
17 A deep knowledge of local circumstances and their needs
Yes No
18 Innovative pricing promotion and distribution Yes Yes
bull Hammond and Prahalad (2004) cite the case of the Indian Industrial
and Technology Conglomerate (ITC) ITCrsquos networks of Internet-
connected computers called ldquoe-Choupalsrdquo in farming villages in Indiarsquos
rural state of Madhya Pradesh support soy farmers with fertilizers plus
other materials at low cost soil testing and access to market trends on
crop prices The ITC network is an example of raising incomes and
productivity by providing access to information
34
bull Mobile phone banking in Johannesburg South Africa (a more secure
way of receiving salaries and making payments in the crime-ridden
capital)
bull Low cost drinking water filtration in Tianjin China (developed by
entrepreneurs to clean heavily polluted and high-risk river water)
Ireland (2008) developed the notion of targeting the urban BOP residents in
emerging market slums that in his case were the 80 percent of the Venezuelan
poor who live in unplanned shantytowns called ldquobarriosrdquo (p431) He cites that the
key difference between the rural and urban BOP marketing is that the urban BOP
can purchase products or services in shopping malls and large supermarkets
whereas the rural BOP shop daily and generally at the same location
Ireland (2008) found that the urban poor buy middle-class products and services
and receive information about these products through mass media ldquoCustomers
also paid more for convenience social integration brand meaning reliable quality
or status or versatilityrdquo (Ireland 2008 p436) in addition to reliable quality or
technical superiority This observation has great implications in SA considering the
urban population growth in the form of informal settlements since 1994
Karnani (2007) cites the case of lsquoFair amp Lovelyrsquo a skin whitening cream for women
marketed by Unilever in many countries in Asia and Africa Karnani (2007) feels
that Unilever has unwittingly helped to sustain and perpetuate sexist and racist
prejudices that feed the demand for this product lsquoFair amp Lovelyrsquo is doing well it is
profitable and it is a high-growth brand for Unilever in many countries especially in
India Hindustan Lever Limited (the Indian subsidiary of Unilever) marketed the
product in lsquoaffordablersquo small size pouches targeted for the poor For such a market
the more the sales of the smaller pouches the higher the financial returns for
Hindustan Lever Limited
35
Hammond and Prahalad (2004) describe businesses that are packaging products
in smaller units These smaller units allow for immediate use and allow the poor to
purchase an otherwise unaffordable product Examples cited are of a Mexican
retail chain selling chicken in smaller portions and Hindustan lever limited with
personal health-care products such as shampoo and detergents packaged in a
lsquosingle-servingrsquo version packages
Hammond and Prahalad (2004) cited another example of prepaid phone cards
being the dominant business model for the cell phone market worldwide which
squashes the perception that business with the poor is risky Prepaid cards
eliminate collection costs and debt Payment is made before a call is connected In
addition to the advantage pointed out here the pre-paid vouchers are sold in
various small denominations such that even the BOP market apparently sees
these vouchers as affordable
lsquoPerson-to-personrsquo cosmetic giants such as Amway Corp and Avon Products have
modernised distribution channels in India and Brazil (Hammond amp Prahalad
2004) The two companies have used direct distribution strategies to sell beauty
products to the poor and have hired poor people as entrepreneurs
Vikram Akularsquos SKS Microfinance Company (Akula 2008) provided finance to
women in rural India so that they can start small businesses and get out of
poverty The companyrsquos business strategy is based on three principles Firstly a
profit-oriented approach was applied to access commercial capital Secondly
there was standardisation of products training and other processes to boost
capacity and finally there was use of technology to reduce costs and limit errors in
the business
The principles running through most of the examples in dealing with the poor
above are of entrepreneurship alliances or partnerships and technology
implementation There is gain for business in the form of increased profit or market
36
share The BOP or poor gain access to better products services or they engage in
partnerships which ultimately assist in poverty alleviation
28 Models for Working with the BOP
Simanis Duke and Hart (2008) in their article presented three models for investing
with the BOP These models by Simanis et al (2008) are the Provider model the
Empowerment model and the Equal Partnership model described by Willie and
Barham (2009) below
bull The Provider model or lsquoBasic Needsrsquo model is where companies match
community needs with their products to discover new markets
Affordable and high quality products are sold to the poor These
products are based on customs within communities hence providing a
benefit and advancing market development
bull The Empowerment model or lsquoEmpowerment and participationrsquo model
creates localised products and services based on the unique needs and
conditions of the poor community There is dialogue between the
business and potential customers although initiated by the former
Through the active participation of the poor they are likely to build or
develop new capabilities
bull The Equal Partnership model or lsquoNew Commonsrsquo school aims to share
initiatives with the community on equal terms so that results are
embedded in the community The businesses aim to improve a whole
range of areas which would make life worthwhile Both the business
and the community harness their capabilities resources and creativity
The process aims to build a deep base of entrepreneurship and
management capability within the community The approach is
enhanced through a process of engagement that changes the terms of
the relationship between the business and the community
37
In their discussion on the models above Willie and Barham (2009) emphasise the
need for the Equal partnership model such as that of the BOP Protocol Model by
Simanis and Hart (2008b) The involvement of the local BOP in every step of the
investment as partners and co-creators almost ensures success due to the shared
ownership and responsibility of the initiative The BOP Protocol is based on the
assumption that poor communities are resource rich full of skills and highly
competent This ability of local communities combined with the companies can
result in an original business opportunity to serve the community
London Anupindi and Sheth (2010) in their analysis of 64 ventures serving BOP
producers found three common themes proposed earlier by Willie and Barham
(2009) Firstly they found that in overcoming constraints the ventures built trust
and long-term relationships with BOP producers and other partners Secondly all
the ventures demonstrated opportunity for mutual value creation Technological
and economic limitations were noted to work against mutual value creation
Finally most of the ventures collaborated with socially oriented organisations
(such as NGOs) that require the creation of adequate local value
Willie and Barham (2009) in comparing the BOP protocol and the two other
models (Empowerment and Provider models) state the need for all three models
because of the different companies goals Some companies may be working to
provide a base for the future others may be philanthropic and others may be using
the process as part of its corporate social responsibility or public relations and
finally some may be looking to make a profit
The partnership model takes time to set up and for the business to make a profit
The first two models are based on the presumption that the company knows what
the community needs or wants Taking these in consideration Willie and Barham
(2009) stress the need for all three models to be dynamically integrated due to the
large number of the poor who need urgent action Additionally corporations may
not be willing to wait for the slow process of implementing the third Equal
38
Partnerships model All models need to operate together if the UN Millennium
Development Goals are to be achieved
Anderson and Markides (2007) propose the need for innovation at the BOP in
developing markets through their ldquoFour Arsquos (p84) framework affordability
acceptability availability and awareness
bull ldquoAffordability is the degree to which a companyrsquos goods or services are
affordable to consumers at the low end of the marketrdquo (ibid p 84) The
offerings must be at a price point that enables consumption by even the
poorest The example cited here was of Smart Communications in the
Philippines with small denomination mobile airtime Honda in India with
their generators as prizes (for shopkeepers in a lottery) and Tata
Motorsrsquo low cost car
bull Acceptability is the extent to which consumers in the value chain are
willing to consume distribute or sell a product or service Companies
respond to specific needs nationally or regionally either cultural or
socio-economic or respond to unique requirements of local businesses
Hindustan Leverrsquos shampoo for women in India and the Haier Grouprsquos
multipurpose washing machine in China are examples of modifying
products for local acceptability Examples of note of innovations in
distribution are the Eveready Industries India van-distribution system
and Avon Products sales women in Brazil
bull Availability is the level to which the product or service can be acquired
and used ldquoStrategic innovators are resourceful about distributing or
delivering products and services to the most isolated communitiesrdquo
(ibid p 84)
bull Awareness is the customerrsquos level of knowledge about a product or
service Conventional advertising may not reach poor customers
Companies need to use other modes and methods of communication
39
Smart Communications of the Philippines used modes such as
billboards visits to tertiary education institutions dealer recruitment and
dealer training in low income communities
Therefore companies in developing markets such as South Africa find gaps in the
industry-positioning map they go after them and exploit the opportunities just as
they do in developed markets (Anderson and Markides 2007)
29 Conclusion
The aim of this research is to investigate the extent of involvement of businesses
and their actions thereof in an emerging market such as South Africa Uplifting the
BOP (poor) in South Africa would have a positive impact on the macro-economic
situation in the country and this literature review has demonstrated the specific
principles that could be adapted for the South African context
The following partnership model was developed for the South African context
drawing information from the literature The model has been designed for the
retail-banking sector in South Africa The other partners are the poor or BOP with
government and NGOs as intermediaries or facilitators The model in Figure 5
describes the critical requirements from each partner or intermediary for the
success of an alliance or partnership between the BOP and Banks
In terms of the Bank as a partner the important features are expanded on below
The banks commitment of resources involves the full allocation of funds
consistent application of resources a long-term view sustainability (both
economic and environmental) and the allocation of a specific commercial unit to
the partnership Careful and experiential preparation in developing the
40
partnership due to the high risk involvement for the long run to understand the
situation of the poor and a deep understanding of local community circumstances
Value creation is through new market opportunities improved or increased
profitability the increase in shareholder value the social responsibility of business
to the community the economic value add to society and the improved reputation
of the business
Innovation takes place with low cost simple and local technology processes or
products Products or services should be inexpensive and appropriately priced
with the creation of markets for these products There is high risk to the business
due to finances involved or allocated with the resulting profits expected later
rather than earlier and all parties (bank BOP NGOs and government) responsible
for the long-term success of the partnership There is need for economic and
environmental sustainability due to the social responsibility of business to
alleviate poverty and ensure the careful use of scarce resources
The following aspects important for the BOP are discussed below
The BOP are to be considered as producers forming alliances or partnerships and
involving entrepreneurship at their level Skills development involves training to
acquire management capabilities and unlimited access to information All parties
jointly hold responsibility of the partnership or venture success with ownership split
between the bank and the BOP entrepreneur
Poverty alleviation takes place as an incentive for action by the BOP with the
need for an enhanced quality of life Local solutions are required through building
local capacity to produce and innovate at the level of the poor and so empowering
them The South African BOP demonstrate collectivism in their economic
activities and so should be viewed as households and not individuals
41
Important features for government involvement in the partnership are discussed
below
Figure 5 The Equal Partnership Model for the Economic Involvement of the BOP
Government support creates local value through its delivery or distribution
networks at grass root level and acting as agents on the ground to understand the
needs of the BOP A coalition with business will assist in dealing with specific
needs of communities for co-operation or advice and for the long-term success of
42
the business Governmentrsquos role is to regulate and monitor the partnerships for
fairness and to simplify difficult processes for progress Ultimately the goal is
national economic growth through investment job creation tax revenue
generated poverty alleviation application of human rights and the reputation of
the country
The NGOrsquos role in the partnership covers the following aspects
The NGO acts as an intermediary to better understand the BOP (cultural
financial technical education and infrastructure) and forms embedded ties
between the BOP government and business as agents on the ground for delivery
or distribution and creating value in communities The upholding of human rights
requires that fairness in treatment of the BOP poverty alleviation and societal
problems be addressed The NGO would focus on the need for training including
skills development entrepreneurship and basic management skills for the success
of the venture Sustainability of the venture or partnership would require
environmental and resource protection by delineating responsibilities to all parties
for the long-term success of the venture
All the aspects described above are important for the successful application of the
equal partnership model
43
CHAPTER 3 RESEARCH PROPOSITIONS
Zikmund (2003) defines a proposition as a statement concerned with the
relationships among concepts A proposition describes the logical linkage between
certain concepts by asserting a universal connection between concepts
31 Collectivism As per Chipp and Corder (2010a) and Corder and Chipp (2010b) the base of the
pyramid (BOP) should be defined empirically for South Africa Defining the BOP in
terms of individual earnings would not work in the South African society that
displays collectivism when dealing with earnings and money spent There is a
need for managers to understand this aspect of collectivism and the resulting
actions by households rather than individuals A deep understanding of household
decisions in earnings and spending will provide managers and marketers the
ability to devise actions for tapping into this market The aim of the proposition
below is to determine the level of manager awareness regarding the collectivistic
nature of the poor
311 Proposition 311 The poor in South Africa demonstrate collectivism in their economic activities and are recognised as households and not individuals in developing partnerships with a bank
32 Bank activities Simanis and Hart (2008b) stress the need for business and the BOP to come
together as partners and co-creators to ensure success of a BOP venture due to
44
the shared ownership and responsibility of the initiative It is essential for mutual
value creation in partnerships with the BOP as specified in Figure 6 below The
aim of this study is to determine the level of activities by retail banks at the level of
the BOP The results of this study are expected to assist banks in defining areas
for improvement in penetrating these low income markets
Figure 6 Bank Activities in the Equal Partnership Model
321 Proposition 321 Banks or branches need to commit long-term resources to a partnership at the level of the poor
322 Proposition 322 Banks need to experiment with different business models and prepare well before going into an equal partnership venture with the poor
45
323 Proposition 323 For a partnership venture with the poor there should be value created for the bank at multiple levels such as increased profitability and improved reputation These areas of value for the bank are
bull Increase in the number of customers and resulting revenue
bull Increase in the value of the bank to shareholders
bull Increased social responsibility of the bank to the poor
bull Improvement in reputation to society
324 Proposition 324 There needs to be innovation by the bank in a simple technology new process or innovative product or service for a partnership with the poor
325 Proposition 325 There is high financial risk for the bank in investing in the poor
326 Proposition 326 The business or partnership with the bank should be economically and environmentally sustainable for alleviation of poverty and careful use of scarce resources These scarce resources required by the poor are money electricity clean water and other raw materials
46
CHAPTER 4 RESEARCH METHODOLOGY
This chapter presents the research philosophy approach design population
sample selection and data collection tools used to address the problem as
outlined in Chapter one In addition possible limitations to the study will be
discussed
41 Research Classification
This study aimed to determine the applicability of the equal partnership model for
BOP engagement in the South African economy Different aspects were drawn
from literature to develop the equal partnership model as described in Figure 5
(Chapter 2) Case studies of BOP strategies such as those of Cemex Tetra Pak
Unilever Telenor Digicel and Nike have been mentioned in most literature
(Sanchez et al 2006 Warnholz 2008) Some BOP strategies have been
successful (Cemex Tetra Pak Unilever Telenor and Digicel) and others failures
(Nike)
The research design was both quantitative and descriptive in nature The purpose
of this study was to produce information which reduced uncertainty (Zikmund
2003) about South African business activities in the area of the BOP As stated by
Zikmund (2003 p 55) descriptive research aims to answer questions such as
ldquowho what when where and howrdquo by way of a survey questionnaire Quantitative
approaches especially surveys of individual responses are often more practical in
terms of time and cost (Wreathall 1995)
47
42 Research Design Descriptive research was chosen for this investigation because of the previous
qualitative and quantitative work done in the area of business and the BOP The
aim of this research was to expand on previous qualitative studies done in the
area of the BOP and business Quantitative analysis was selected to test
theoretical predictions with precise measures of variables (Tharenou Donohue amp
Cooper 2007) As stated by Zikmund (2003) descriptive research studies are
based on some prior understanding of the problem The aspects of the relationship
of those involved in the partnership model with the BOP were tested in this
research
43 Data Gathering Process
The method used in gathering data is through a survey Zikmund (2003 p175)
defines the survey as ldquoa method of gathering primary data based on
communication with a representative sample of individualsrdquo The information was
gathered by way of a telephonic interview with a structured questionnaire The
quality of this data may be comparable to data obtained through personal interview
(Zikmund 2003) According to King (1994) interviews are appropriate when the
researcher wants to see the topic from the perspective of the interviewee and to
see how or why the interviewee comes to have this perspective Zikmund (2003)
stressed that respondents may be more willing to provide detailed and reliable
information over the telephone than through personal interviews Seidman (1996)
stated that structured interviews are composed of completely pre-set standardised
questions which are normally closed-ended
Surveys are extremely valuable to academics and managers when conducted
properly (Zikmund 2003) The choice of survey for this study was the telephone
interview due to the time limitations of this study and due to the flexibility of its
48
application to studies such as the current one Telephone interviewing was chosen
because of ease of access to the respondents who were branch managers of
banks The availability of these managers for personal interviews was questioned
and the travelling cost for face-to-face interviews was a restriction For this study
a detailed structured questionnaire was designed to draw out the different
relationships being tested in the partnership model for BOP involvement
44 Questionnaire Design
The instrument used in this survey was a questionnaire designed from a literature
survey of the subject area For the design of a new instrument the principles of
questionnaire and scale construction was investigated (Mouton 2009) A
questionnaire is relevant if no unnecessary information is collected and if the
information needed to elaborate on the problem is obtained The accuracy of a
questionnaire is determined by ensuring it is valid in that it must measure and
predict relevant criteria of the construct (Tharenou et al 2007)
In this research a multiple measures approach as recommended by Tharenou et
al (2007) was used to determine if a number of measures converge for evidence
of construct validity The questionnaire has been included (see Appendix 3)
The survey was carried out telephonically using a structured questionnaire The
questionnaire was designed to ask questions that are more general and then focus
on specific questions This funnel technique (Zikmund 2003) of asking general
questions before specific questions was carried out to avoid biased responses
The approach used in designing the questionnaire followed the general principles
outlined by Foddy (1993) Questions for telephone surveys must be less complex
versus questions used in personal interviews because there is less time for
elaboration or explanation
49
Social desirability error or response (Richman Kiesler Weisband and Drasgow
1999) is the tendency for a respondent to choose the socially desirable response
whether true or not The respondent wishes to represent himself or herself in a
favourable light no matter what they actually feel about an issue or topic and
would contaminate any results obtained Acquiescence response is the tendency
for respondents to agree to positively phrased questions regardless of the content
(Spector 1987) The correct design and application of the structured questionnaire
would reduce the occurrence of the above response errors
441 Pre-testing of the Questionnaire Pre-testing of the questionnaire was done in order to refine categories and clarify
other questions that were initially unclear and needed both refinement and
improvement In addition pre-testing ensured that the questionnaire timing was
appropriate As a result of the pre-test definitions were simplified to make them
more understandable These simplified definitions were presented during the
process of questioning by stating them prior to asking the questions pertinent to
them
442 Scale
Attitude is a complex and difficult to define concept (SAARF 2010 Zikmund
2003) Attitudes as described by Zikmund (2003) are an enduring disposition to
respond consistently in a given manner to various aspects of the world including
persons events and objects However attitudes are subject to change in shorter
periods in comparison to values and traits The three components of attitude are
affective cognitive and behavioural The affective component relates to an
individualrsquos general feeling or emotions to an object The cognitive component
represents onersquos awareness of and knowledge about an object The behavioural
50
component represents a predisposition to action including both intentions and
behavioural expectations
Attitudes can be measured using the ranking rating sorting or choice techniques
The function of an attitude scale is to locate an individualrsquos position on a
continuum (Zikmund 2003) This study focuses on the cognitive component of
attitude and so a rating scale was used A Likert type scale was used in this study
During the survey ldquorespondents indicate their attitudes by how strongly they agree
or disagree with carefully constructed statements that range from very positive to
very negative towards the attitudinal objectrdquo (Zikmund 2003 p312) As described
by Tharenou et al (2007) there are numerous benefits in using multi-item
measures in research Some of these benefits are superior validity and composite
scores can be used to represent the construct of interest Respondents were
asked to rate the magnitude of awareness and knowledge in a specific area
To measure the attitudes and for data analysis purposes a weighting score was
attached to each response The scale was biased towards the positive because it
was expected that most managers would respond in a positive manner This bias
in scaling was effected to give a larger range of more positive answers The
neutral option was not included in this scale to force the respondents to take a
stance Scoring was carried out as described in Figure 7 below Weightings were
attached based on the questions asked
Figure 7 Likert Type Scale Used for this Study
51
45 Unit of Measure The unit of analysis chosen was the retail (or personal) bank manager of branches
belonging to the three bank groups in South Africa These banks included the
Amalgamated Bank of South Africa (ABSA) Standard Bank and Nedbank Each
bank managerrsquos response was considered as an individual data source (Tharenou
et al 2007)
46 Population Zikmund (2003) described the need for selection of the appropriate target
population to ensure that the data collected is from the correct source
Respondents were identified from the retail-banking sector in South Africa which
has recently been involved with the BOP The target population consisted of all
retail bank managers of three banks in South Africa (ABSA Standard Bank and
Nedbank) Geographically the population covers all the nine provinces in South
Africa These market-oriented organisations provide a robust investment plan and
strategy for the anticipated BOP market Such organisations have modelled their
business practices around economic environmental and social spheres with the
goal of doing good while being profitable
The banking sector in South Africa has recently launched an industry wide project
the lsquoMzansi initiativersquo to involve the ldquounder-banked and un-bankedrdquo in society by
providing cost effective products to the entry level account holder and the informal
sector (Standard Bank 2009 p17) Standard bank (2009) has launched a new
banking model to extend affordable and accessible financial services to the
underserved market which includes low-income earners and the informal sector
This model combines cell phone banking community retailers and community
banks without the need for a physical branch and automated teller infrastructure
ABSA (2009) planned to launch new low-cost channels and basic banking
52
products in 2010 to grow value from the entry-level group of the South African
population
The total number of branches of the three banks was estimated at 1600 (ABSA
2010 Standard Bank 2010 Nedbank 2010)
47 Sampling Method and Size The purpose of statistics is to describe the characteristics of a population or
sample and to generalise from the sample to the population (Zikmund 2003) The
principle of sampling was to obtain a large enough sample of retail banking branch
managers to be able to generalise the findings to draw conclusions and make
recommendations to the whole population of retail banking branch managers
Albright Winston and Zappe (2006) encouraged researchers to obtain as large a
sample as possible to reduce sampling error In doing so the authors
recommended compromising the sample size considering the opposing forces
The opposing forces to consider were those of the cost of sampling the timely
collection of data and non-sampling error
In this study the main issue of concern was the time spent in collecting the data
considering that the method selected was of a telephone survey
Zikmund (2003) prescribed the following three factors in determining sample size
bull Variance or heterogeneity of the population which is an estimate for the
standard deviation of the population
bull Magnitude of acceptable error and
bull Confidence Level
53
The following method was used to determine a sample size for a proportion of a
population (Zikmund 2003) See Figure 8 below
Figure 8 The Equation Used to Calculate the Sample Size
n = number of items in the sample
Z2 = square of a confidence level of 196 in standard error units
p = estimated proportion of successes or the response rate which was
assumed to be 50 or in this case 050
q = 1-p or estimated proportion of failures 050
C2 = square of the maximum allowance for error between the true proportion and
the sample proportion where C represents the confidence interval of 005
With the above values n = 384 but due to the time limitation of the study a
sample size 150 was used In addition to conduct an exploratory factor analysis
Guadagnoli and Velicer (1988) recommend between five to ten cases (or
respondents) per item for a stable solution With 16 items on the questionnaire the
sample ranged from 80 (5 times 16) to 160 (10 times 16) Hinkin (1995) suggested
150 observations as a minimum This sample of 150 respondents gave a
confidence interval of 8 According to Albright et al (2006) and Zikmund (2003)
the confidence interval is the probability of the true population parameter being
incorrectly estimated In this study the value of 8 was used versus the 5
standard In other words with a response of 50 the true response rate would lie
somewhere between 42 (50 - 8) and 58 (50 + 8) in 95 cases out of
100
54
The sample was of the probability type because it was based on some random
procedure of selection A systematic random sampling technique was used for this
study (Zikmund 2003) In systematic random sampling the population is listed
according to some criteria (such as alphabetical) an interval is determined based
on the sample required and finally one item is randomly selected within that
interval as a starting point
For this study to ensure a proportional sample from each bank group (ABSA
Standard Bank and Nedbank) the population of bank branches within each group
was listed alphabetically after stratification by bank (Zikmund 2003) An interval
was then determined by dividing the total number of branches of the three banks
by the sample size required of 150 The sample was then drawn according to this
interval after a random start
48 Analysis Approach Data collected has little or no value as data and extracting meaning from this data
is important (Babbie 2005) Zikmund (2003 p473) refers to descriptive data as
ldquothe transformation of raw data into a form that will make them easy to understand
and interpretrdquo The three main stages of data analysis were performed as
prescribed by Tharenou et al (2007) These included data management prior to
data entry initial data analysis to check suitability of the data after data entry and
finally the data analysis to test the propositions
481 Capturing of Data
Data was captured manually on survey questionnaires following the procedure
described by Tharenou et al (2007) Before entering the data on an electronic
spreadsheet all questionnaires were numbered by source bank (andor province)
checked for missing data (for a decision to include in the data entry or not) the
55
data was coded and then only was the data transferred on to a Microsoft Excel
spreadsheet Analysis of the data was then carried out using both Microsoft Excel
and NCSS 2007 statistical software
482 Descriptive Statistics
The data obtained from the survey will be analysed using descriptive statistics
such as frequency tables quadrant analysis and box-and-whisker plots (Babbie
2005) Descriptive statistics is concerned with the explanation and summarisation
of data obtained for a unit of analysis (Welman amp Kruger 2001) In analysing and
interpreting the results of the survey a comparison of the descriptive statistics was
undertaken to make the results more meaningful The different banks were
compared According to Welman and Kruger (2001) without comparative data a
survey is of little or no use
483 Multivariate Analysis
Multivariate analysis was carried out on the data to draw a relationship between
the different variables listed below in Figure 9
Multivariate analysis assesses the relationships among three or more variables
(Tharenou et al 2007) An exploratory factor analysis was undertaken for the
purpose of analysing scores from the variables to see if they could be reduced to
underlying dimensions According to Tharenou et al (2007) the most common
method of exploratory factor analysis in organisational research is principal
component analysis (PCA) The goal of PCA is to arrive at a relatively small
number of factors or components that will extract most of the total variance from a
large set of variables
56
Principal components analysis (Hinkin 1995) was performed on the raw data to
identify factors or underlying perceptual dimensions
Figure 9 Variables Related to the Partnership of the Bank with the Poor
49 Limitations of the Study The following limitations were expected in this study
bull Restricting the population to the three major banks limited the projection of
data beyond this population (Zikmund 2003)
bull The ability of the interviewer to ensure that the interviewee understood the
questions and that the resulting responses were valid
bull Non-response error due to the managers approached refusing to participate
in this survey Access to the population was an issue because of the level of
the managers in the business that were targeted Getting the branch
managers on the telephone did prove difficult
57
bull Response bias was prominent in this research due to the unfamiliarity of the
subject area the use of extremes when responding and by the desire of the
respondents to appear socially right when responding (also known as the
social desirability bias)
58
CHAPTER 5 RESULTS
51 Introduction This section reviews the results of the telephonic survey The data on the
responses to the questions are compared to expected values in order to evaluate
the propositions This evaluation of the responses was undertaken to determine
the awareness of bank managers to activities taking place in their businesses
Support by managers of the aspects queried in the questionnaire indicates
familiarity and action by the banking sector in the area of the BOP In this manner
the model described in Chapter 4 (Figure 9 page 56) would be tested
Commentary is given on the inter-relationship of questions or attributes through a
correlation analysis This inter-relationship could give insight or understanding into
underlying perceptual dimensions These commonalities are then uncovered
through a best-fit factor analysis After identifying the underlying perceptual
dimensions (or factors) the different groups are tested for significant difference
between them The different groupings are of age gender race and bank
52 Response Rate and Demographics
Of the initial sample of a 158 113 (or 71) were willing to respond In three cases
two questions were omitted The response rate was highest for Nedbank (88)
then ABSA (71) and finally Standard Bank (58) Most respondents were
female (69) In terms of racial groupings the highest response was from whites
(43) next were blacks (30) and finally Coloured or Asian (27) Most
respondents were aged 35 to 49 years (59) Of the sample personal and business banking constituted the higher proportion (65) then personal banking (31) and finally business with the lowest proportion (4)
59
The general demographics of the sample are reported in Appendix 4 through
tabular and graphical representation (see Tables 13 to 17 amp Figures 17 to 21)
53 Evaluation of Propositions
The propositions were evaluated on a one sample two-tailed t-test Based on the
four point Likert Scale (see Figure 10 below) a mean score of two (20) was set as
the expected response to the questions This expected average was selected to
determine if any responses were biased towards the top end of the scale or
bottom end of the scale A one sample two-tailed t-test was used to compare the
mean of the response to each question to the expected mean of two
Figure 10 Likert Type Scale used for this Study
1
Disagree
2
Slightly
Agree
3
Agree
4
Strongly
Agree
531 Proposition 311 The poor in South Africa demonstrate collectivism in their economic activities and are recognised as households and not individuals in developing partnerships with a bank Results to the question on the recognition of the poor as households and not
individuals (Question 6a) indicated that there was no significant difference (p gt
005) between the response with a mean of 215 (slightly above 20) (see Table 4
above) Hence the proposition was not supported
60
Table 4 The One Sample Two Tailed T-test on Results for Proposition 311
One-Sample Statistics Test Value = 2
95 Confidence
Interval of the Difference
Question N Mean Std Dev
Std Error Mean
t df Significance (2-tailed)
Mean Difference Lower Upper
6a Households 113 215 1063 01 1505 112 0135 015 -005 035
6c Financial Decisions 113 227 0954 009 2957 112 0004 0265 009 044
In terms of the poor making financial decisions collectively (Question 6c) there
was a significant difference (p lt 005) between the response mean of 227 than
that expected (20) (see Table 4 above) This response to collective financial
decisions was more inclined towards the positive end of the scale and so
supporting the proposition
532 Proposition 321 Banks or branches need to commit long-term resources to a partnership at the level of the poor In terms of allocation of resources (such as funds and teams to deal with
partnerships with the poor) there was a significant difference (p lt 005) in the
responses in both cases in comparison to the expected response (see Table 5
below) Both responses of allocation of funds and of allocation of teams to deal
with partnerships were directed more to the positive end of the scale
61
Table 5 The One Sample Two Tailed T-test on Results for Proposition 321
One-Sample Statistics Test Value = 2
95 Confidence Interval of
the Difference
Question N Mean Std Dev
Std Error Mean
t df Significance (2-tailed)
Mean Diff Lower Upper
7a Allocation of funds
111 253 098 0093 5714 110 0000 0532 035 072
7b Allocation of teams
111 25 098 0093 5324 110 0000 0495 031 068
533 Proposition 322 Banks need to experiment with different business models and prepare well before going into an equal partnership venture with the poor Table 6 The One Sample Two Tailed T-test on Results for Proposition 322
One-Sample Statistics Test Value = 2
95 Confidence Interval of
the Difference
N Mean Std Dev
Std Error Mean
t df Sig (2-tailed)
Mean Difference Lower Upper
8a Experimental relationships
112 283 0746 007 1178 111 000 083 069 097
8b Understanding poor
110 264 0864 0082 772 109 000 0636 047 08
62
The response to experimenting with different models in dealing with the poor was
significantly different (p lt005) to the expected response The response was
strongly inclined to the positive end of the scale
In preparing well by understanding the poor was significantly different (p lt 005)
to the expected response towards the positive end of the scale Both responses
supported the proposition
534 Proposition 323 For a partnership venture with the poor there should be value created for the bank at multiple levels such as increased profitability and improved reputation
Table 7 The One Sample Two Tailed T-test on Results for Proposition 323
One-Sample Statistics Test Value = 2 95
Confidence Interval of the
Difference
N Mean Std Dev
Std Error Mean
t df Sig (2-
tailed)
Mean Difference Lower Upper
9a Increased customers 112 259 0844 008 7387 111 000 0589 043 075
9b Increased shareholder
value 112 255 0899 0085 6518 111 000 0554 039 072
9c Social responsibility 112 321 065 0061 19779 111 000 1214 109 134
9d Reputation 112 316 0578 0055 21246 111 000 1161 105 127
In terms of value creation for the bank through partnerships with the poor the four
responses were all significantly different (p lt 005) to the expected mean of 20
63
(see Table 7 above) The responses to an increase in customers and the increase
in shareholder value were oriented to a positive response
There was a strong inclination to a positive response for the social responsibility of
the bank and the improved reputation of the bank All responses to these
questions (9a 9b 9c and 9d) supported the proposition
535 Proposition 324 There needs to be innovation by the bank in a simple technology new process or innovative product or service for a partnership with the poor Both responses to innovation by the bank using simple technology for product and
services for the poor were significantly different (plt 005) to the expected (Table 8
below) In terms of using technology to deliver a product or service the response
was towards the positive end of the scale and supporting the proposition The
same was true for using technology to price services and goods for the poor
Table 8 The One Sample Two Tailed T-test on Results for Proposition 324
One-Sample Statistics Test Value = 2 95
Confidence Interval of the
Difference
N Mean Std Dev
Std Error Mean
t df Sig (2-
tailed)
Mean Difference Lower Upper
10a Product technology 112 285 0808 0076 11113 111 000 0848 07 1
10b Price technology 112 29 0735 0069 12989 111 000 0902 076 104
64
536 Proposition 325 There is high financial risk for the bank in investing in the poor Table 9 The One Sample Two Tailed T-test on Results for Proposition 325
One-Sample Statistics Test Value = 2
95 Confidence
Interval of the Difference
N Mean Std
Deviation
Std Error Mean
t df Sig (2-
tailed)
Mean Differenc
e
Lower
Upper
11a Later profitability 111 287 0776 0074 11865 110 0000 0874 073 102
In the response to the financial risk involved in investing in partnerships with the
poor there was significant difference (p lt 005) to the expected result of 20 (see
table 9 above) The response to later profitability linked to higher risk was more
inclined to a positive response in the Likert scale hence supporting the
proposition
537 Proposition 326 The business or partnership with the bank should be economically and environmentally sustainable for alleviation of poverty and careful use of scarce resources These scarce resources required by the poor are money electricity clean water and other raw materials In terms of the responses to sustainable use of resources in alleviation of poverty
and the careful use of scarce resources by the poor they were both significantly
different (p lt 005) to the expected mean (see Table 10 below) In both cases of
65
poverty alleviation and resource use the responses were strongly oriented to the
positive end hence supporting the proposition
Table 10 The One Sample Two Tailed T-test on Results for Proposition 326
One-Sample Statistics Test Value = 2 95
Confidence Interval of the
Difference
N Mean Std Dev
Std Error Mean
t df Sig (2-
tailed) Mean
Difference Lower Upper
12a Poverty alleviation 112 318 0661 0062 18883 111 0000 1179 105 13
12b Resource use 112 296 0709 0067 14386 111 0000 0964 083 11
538 BOP as a profitable market
Table 11 The One Sample Two Tailed T-test on Results for the BOP as a Profitable Market
One-Sample Statistics Test Value = 2 95
Confidence Interval of the
Difference
N Mean Std Dev
Std Error Mean
t df Sig (2-
tailed) Mean
Difference Lower Upper
6b Profitable market
113 273 0897 0084 8708 112 0000 0735 057 09
The response to the BOP as a profitable market was significantly different (p lt
005) to the expected response The response supported the question on
profitability of the business when dealing with the poor
66
54 Relationships between the Attributes The relationship between attributes was assessed using correlation coefficients
The correlation coefficients calculate the strength of the linear relationship
between the different attributes or items
The results indicated a strong relationship between the attributes of an increase in customer base and an increase in shareholder value (with a correlation of
06) In addition findings implied a strong relationship between the attributes of
technology used in product or services to derive value and the attribute of technology used to reduce the price of the product or service (with a
correlation of 06)
There was a medium strength (or a correlation of 05) relationship indicated
between the attributes of allocation of funds and allocation of teams from the
responses in the area of commitment of resources The same relationship (or
correlation of 05) was found for the responses between the attribute of
experimenting in mutually beneficial relationships with deep understanding of the poor and with an increase in profitable customers
In addition a medium strength relationship (or correlation of 05) was indicated
from the responses between the attributes of improved reputation of the branch
with social responsibility of the bank and the alleviation of poverty The final
relationship of note was between the alleviation of poverty and the careful use of resources with a correlation of 05 (refer to Table 19 Appendix 5)
Other attributes tended to be independent (refer to Table 19 Appendix 5)
67
55 Metric Multi-Dimensional Scaling (MMDS) According to Agarwal Lanckriet Willis Kriegman Cayton and Belongie (2007)
ldquomultidimensional scaling (MDS) refers to the general task of assigning Euclidean coordinates to a set of objects such that given a set of dissimilarity similarity or ordinal relations between the objects the relations are obeyed as closely as possible by the embedded points hellipMultidimensional scalinghellipmetric algorithmshellipseek an embedding with inter-point distances closely matching the input dissimilaritieshelliprdquo (p 2)
In order to get a clearer understanding of the inter-relationships between the
attributes metric multi-dimensional scaling was carried out on the correlation
coefficients after subtracting them from one (see Table 20 Appendix 5) A map of
attributes was then drawn which visually displays items with high loadings
Attributes with high correlations will tend to be closer together and vice versa (see
Figure 11 below)
56 Factor Analysis In order to get insights into underlying perceptual dimensions a principal
component analysis (PCA) was carried out on the data PCA is a process that
allows for the verification of whether an item within a factor has significance in
relation to other items in the same factor (Tharenou et al 2007) Firstly the
eigenvalues were determined (see Table 12) and based on the eigenvalues two
three four and five factors were examined
On the basis that eigenvalues were greater than one and on marketing sense a
five-factor solution was determined as the optimal solution (see Table 21
Appendix 5)
68
Figure 11 Metric Multi-dimensional Scaling Map of Attributes
Table 12 Factor Variance as determined by Eigenvalues
Component Initial Eigenvalues Extraction Sums of Squared Loadings
Total of Variance
Cumulative Total of
Variance Cumulative
1 4764 29774 29774 4764 29774 29774 2 156 9752 39527 156 9752 39527 3 1316 8223 47749 1316 8223 47749 4 1214 7587 55336 1214 7587 55336 5 1044 6526 61862 1044 6526 61862 6 0902 5635 67498
69
Factor one has the highest loadings for
bull Increased shareholder value
bull increased customers
bull experimental relationships
bull understanding the poor
bull allocation of funds and
bull allocation of teams
This factor refers to the dimension of enhancing stakeholder value through
collaboration with the poor Stakeholders include customers shareholders
employees partners government local communities and the public Processes
need to be in place for an inclusive partnership with the poor
Factor two has the highest loadings for
bull Resource use
bull Product technology
bull Price technology and
bull Poverty alleviation (shared with factor three)
Factor two could be described as the dimension of customising solutions for the
poor In other words this involves the alleviation of poverty through co-inventing
solutions for the poor using technology and available scarce resources
Factor three has the highest loadings for
bull Poverty alleviation (shared with factor two)
bull Reputation
bull Social responsibility
bull Households
70
The dimension for factor three covers the aspect of the public perception of the
business The business needs to be viewed as socially responsible with the
intention of understanding the poor in the process The result would be the
alleviation of poverty and the consequential improved reputation for the business
Factor four has the highest loadings for
bull Financial decisions
bull Later profitability
Factor four could be described as the dimension of financial risk in understanding
how the poor make financial decisions and the expected returns from dealing with
the poor
Factor five has a high loading for
bull Profitable market
Factor five is simple and explains that there is a profitable market at the BOP
The factors are then identified on the map by grouping items with high loadings as
seen in Figure 12 below
The lengths of the two dimensions are very similar in the plot (about four units
wide) If the one dimension were longer than the other then the former dimension
would be more important in describing the differences between the factors If the
attribute of ldquoHouseholdsrdquo was ignored then dimension one (four units wide) would
describe the differences in factor more than dimension two (25 units wide)
71
Figure 12 Metric Multi-dimensional Scaling Map of Attributes with Factors
57 Reliability An internal consistency method of establishing reliability was used namely
Cronbachrsquos alpha coefficient When Cronbachrsquos alpha for a factor is above 07
then it is statistically possible that the items within a factor are strongly related to
each other or they are consistent with each other (Tharenou et al 2007)
72
Cronbachrsquos alpha of 079 was determined for Factor 1 consisting of six items
(Table 22 Appendix 5) These items included
bull Increased shareholder value
bull Increased customers
bull Experimental relationships
bull Understanding the poor
bull Allocation of funds
bull Allocation of teams
Even with individual items deleted (Table 22 Appendix 5) the Cronbachrsquos alpha
values were above 07 (ranging from 075 to 078) indicating a strong relationship
between the different items and of the items with the scale total
Cronbachrsquos alpha of 072 was determined for Factor 2 consisting of four items
(Table 23 Appendix 5) These items included
bull Product technology
bull Price technology
bull Resource use
bull Poverty alleviation
When individual items were deleted (Table 23 Appendix 5) Cronbachrsquos alpha
values ranged from 064 to 070 indicating a strong relationship between the
different factors The exclusion of any one item did not result in a higher
Cronbachrsquos alpha representing reliability between the items
A low Cronbachrsquos alpha was determined for Factor 3 (of 044) consisting of three
items (Table 24 Appendix 5) These items included
bull Reputation
73
bull Social Responsibility
bull Household
When ldquoHouseholdsrdquo was removed (Table 25 Appendix 5) Cronbachrsquos alpha value
increased (to 063) indicating a better relationship between the two other items
ldquoreputationrdquo and ldquosocial responsibilityrdquo Therefore the item ldquohouseholdsrdquo does not
appear to fit well in this factor
Cronbachrsquos alpha for Factor 4 was very low (at 030) and consisted of the two
items (Table 26 Appendix 5)
bull Later profitability
bull Financial decisions
There appears to be a weak relationship between the two items
The fifth factor only had one item ldquoprofitable marketrdquo so no internal consistency of
reliability was determined
58 Differences Between Groups In order to find out if there was a significant difference in the scores on the five
factors for men and women younger (under 35) and older (over 35) people race
groups (Black Coloured Indian Asian White) and bank (ABSA Nedbank and
Standard Bank) a one-way ANOVA (analysis of variance) was used (Tharenou et
al 2007)
The results showed that on Factor one men (mean = 285) scored significantly
higher (p lt 005) than women (mean 25) See Table 27 Appendix 5 for additional
data
74
For Factor four the results showed that the Black (mean 232) groups scored
lower than the Coloured Indian or Asian (mean = 265) and the White group
(mean = 270) There was a significant difference (p lt 005) in means within factor
4 but from the previous analysis on reliability Factor 4 scored a very low
Cronbachrsquos alpha Therefore this data was interpreted with caution (see Table 28
Appendix 5)
The results showed that on Factor one there was a significant difference (p lt
005) in the means of the two age groups of less than 35 years old (mean = 288)
and greater than 35 years old ( mean = 246) See Table 29 Appendix 5
In comparing the means of the different bank groups for Factor one the results
showed that there was significant difference (p lt 005) in means between ABSA
(mean = 263) Nedbank (mean = 234) and Standard Bank (mean = 283) See
Table 30 Appendix 5 for more details on the data
75
CHAPTER 6 DISCUSSION
Collaborating with the poor is important for business to capture a larger share of
future opportunities (Hamel et al 1994) In doing so the poor are uplifted
economically and socially Investment in the BOP should be for the elevation of
the BOP from poverty so that it can take part in the economic activity of the
country Both the increased opportunity for business for growth and the economic
involvement of the poor result in the growth of a nation Therefore companies can
boost both corporate and national economic growth by collaborating with the BOP
A partnership model for business with the poor for the South African retail-banking
sector includes
bull The poor or BOP
bull The government
bull NGOs as intermediaries or facilitators
Figure 13 (below) describes the critical requirements from the banking point of
view for the success of an alliance or partnership between the BOP and Banks
61 Bank Activities
Through this research it was evident that managers were conscious of the
environment in which they were operating and they were sensitive to how best to
serve this potential market (the BOP) This awareness indicated involvement of
the banks and their branches in collaborating with the BOP now and in the future
Hence a BOP strategy developed by banks will result in a sustainable
development strategy where ldquodoing businessrdquo will also lead to ldquodoing goodrdquo
(Karnani 2007b)
76
Figure 13 Bank Activities in the Equal Partnership Model
611 The poor in South Africa demonstrate collectivism in their economic activities and are recognised as households and not individuals in developing partnerships with a bank
Before reviewing the results there is a need to review the description of the BOP
in South Africa and some related aspects According to Chipp and Corder (2010a)
the poor in South Africa constitute 36 percent of the adult (16 years and over)
population or 112 million people These people constitute an untapped market To
enter this market businesses need to understand the needs and wants of the
poor Goods and services of value need to be delivered by business to the BOP
(Moore 2006) Corder and Chipp (2010b) defined the South African poor as
households and not individuals This is applicable to financial decision making too
where there is co-operation at household rather than individual level
77
The results of the responses by the bank branch managers indicated little
difference as to whether the poor should be treated as individuals or households
There was a significant shift when understanding how the poor dealt with financial
decisions Managers in the banking sector do support the understanding that the
poor make financial decisions collectively It is possible that bank managers
understand better the collective decision making when it comes to financial
matters and less on household activities
South African low-income groups need to be viewed from a group perspective
such as households in terms of their income and consumption for better
understanding of their wants and needs (Corder and Chipp 2010b) Hence for a
better design of a business approach to the BOP managers and marketers must
understand their market needs perceptions and behaviour (Pitta et al 2008)
612 Banks or branches need to commit long-term resources to a
partnership at the level of the poor
In dealing with resources allocated to working with the poor companies and their
leaders need to recognise that investment of funds and specialised teams will be
for the long-term Willie and Barham (2009) identified the need to set up a specific
commercial unit to engage with the poor and other needy groups Based on the
survey results this does seem to be the case in most banks or branches
According to Altman et al (2009 page 51) these teams need to create alliances
build economically sensitive movements tap the passion and unlock the business
potential of the poor According to Martinez and Carbonell (2007) funds need to
be invested fully and consistently
This research supports the idea of allocating resources such as funds and teams
in the long-term when dealing in partnerships with the poor There was recognition
by the managers of the need for specialised teams and long term funding for the
78
poor Based on the response in this research there does appear to be movement
towards long-term funding and dedicated teams or departments from the banks
and their branches when dealing with the BOP
613 Banks need to experiment with different business models and prepare well before going into an equal partnership venture with the poor
Long-term involvement is required to understand the voice of the BOP consumer
or producer Pitta et al (2008) emphasised that knowing the BOP intimately is the
key to success in joint ventures Managers in the banking sector do seem to
understand the BOP market needs perceptions and behaviours based on
responses in this research These banks are collaborating with agents ldquoon the
groundrdquo as sources of intelligence at grass roots level to understand the voice of
the BOP consumer Hammond and Prahalad (2004) speak of ldquohellipa deep
understanding of local circumstances so that critical features and functionality
hellipcan be incorporatedrdquo (p34) into the design of products and services This
would include Willie and Barhamsrsquo (2009) need for careful and meticulous
planning as one of the many areas that need management attention when
planning ventures with the BOP
Following on with the deep understanding of the BOP markets banks and their
leaders appear to recognise that a different business model will be required in
dealing with the BOP (Pitta et al 2008 Powell 2006) This business model seems
to be developed through experimentation based on the response to the survey in
this research Experimentation can be viewed as a process or discipline consisting
of trial and error directed by insight into which a solution might lie (Geldenhuys
2008) Cash and Pearlson (2005) defined experimentation as a controlled cost
effective iterative approach to learning about potential successes or failures of a
new product service or process Findings indicated support for engaging in
experimentation when innovating and providing products and services to the poor
79
The model recommended (see Figure 5 on page 41) would include aspects of
access to micro-credit (or financial resources) the establishment of alliances or
mutually beneficial relationships (with governments and NGOs) and the adaptation
of a marketing mix (through a deep understanding of the poor) Rangan (2002)
identified the need for an economically sustainable business model as one of
many managerial demands when dealing with the poor
In developing the business model companies could adopt the Cornell University
BOP Protocol system (Simanis and Hart 2008b) which considers all the different
aspects The model in Figure 5 (page 41) included all these aspects through the
literature review (including the Cornell University BOP Protocol system) There
was support from the bank managers for this all encompassing model developed
for the South African context
Branch Managers in the South African banking sector responded positively and
supported the necessity to ensure a deep understanding of the BOP market This
included the need to understand local community circumstances and to use that
information in developing products and services This research supported the
requirement by business to develop mutually beneficial relationships with the BOP
through deep understanding and experimentation There was evidence through
the positive responses for partnership models with the BOP which have been or
would be developed in the long-term through deep understanding and planned
experimentation
80
614 For a partnership venture with the poor there should be value created for the bank at multiple levels such as increased profitability and improved reputation
The value created for the banks and their branches by collaborating in ventures
with the poor include aspects of social responsibility the reputation of the business
and an increase in number of profitable customers which in turn results in an
increase in returns to the business Bank managers are agreeable to the idea that
all of these put together create greater value for the business in the view of
shareholders and so the shares are valued higher on the market In their analysis
of BOP London et al (2010) emphasised that all ventures demonstrated
opportunity for mutual value creation According to Willie and Barham (2009)
business with the BOP aims to improve a range of areas and so making life
worthwhile for the poor This positive social impact in communities then improves
the reputation of the business
Stating Hammond et al (2007)
ldquoAddressing the unmet needs of the BOP is essential to raising welfare productivity and incomehellipEngaging the BOP in the formal economy must be a critical part of any wealth-generating and inclusive growth strategyhellipto the extent that unmet needs informality traps and BOP penaltieshellipaddressing these barriers may also create significant market opportunities for businessesrdquo (p 5)
There was consensus from the bank branch managers that there needs to be
value created for the bank at multiple levels (especially in social responsibility and
reputation) The managers responded very positively to the notion of increasing
the profitable customer base the increase in value of the bank (hence benefiting
shareholders) and the need for a socially responsible bank which in turn results in
an improved reputation
81
615 There needs to be innovation by the bank in a simple technology new process or innovative product or service for a partnership with the poor
In marketing to the poor there must be a significant reduction in price by banks
through a simple technology process product or service by innovatively changing
the price-quality trade-off with an offer of value This was emphasised by Karnani
(2005) the need for a marketndashoriented approach to the BOP by providing goods
and services at affordable prices and in a sustainable manner In addition Rangan
(2002) commented on the need for value-added products and services for the
enhancement of quality of life Based on the responses in this research there is
support for such initiatives from bank managers and hence the banks themselves
Prahalad (2002) recommended bundling of the most advanced technology with a
local flavour such as money transfers through cell phone texts or managing
accounts through mobile recorders from remote areas This ldquobundlingldquo proposed
by Prahalad (2002) would require creativity and entrepreneurship from both the
business and the BOP partner Banks in South Africa based on the positive
survey responses are in support of the development of innovative products
pricing promotion and distribution strategies which meet the needs of the BOP
consumers and producers An example of such a case is mobile banking offered
by nearly all banks in South Africa (Hammond et al 2007)
616 There is high financial risk for the bank in investing in the poor
Banks should not expect early returns when forming joint ventures with the BOP
(Pitta et al 2008) Profit bearing returns if any are expected later when venturing
with the poor This high risk in doing business with the BOP was endorsed by the
positive response received from the bank managers BOP ventures will be
82
experimental at best and may fail most of the time but once a replicable model is
developed then profits will come Such experimentation will take time and some
businesses will not be profitable until the foundations have settled In addition
there is the emphasis in literature of the social aspect of business and not just the
profit motive The aspect of later profits seems evident in the South African
banking sector based on the responses received in this research
617 The business or partnership with the bank should be economically and environmentally sustainable for alleviation of poverty and careful use of scarce resources These scarce resources required by the poor are money electricity clean water and other raw materials
An area that is receiving attention by business in partnerships with the BOP is that
of social and corporate responsibility in a sustainable manner Willie and Barham
(2009) stated that good work is being done by global businesses but in a limited
sense and leaving the BOP in poverty will result in more global instability and
depletion of vital natural resources As per Hahn (2009) corporations are
responsible for the BOP because they must uphold the basic human rights of
freedom and poverty alleviation There is recognition by banks in South Africa for
the need of environmental and economically sustainable business in conjunction
with the alleviation of poverty There were positive results received in this
research to the responsibility of banks to alleviate poverty as part of their corporate
citizenship
South African bank managers corroborated the statement that the development of
the BOP needs to take place without causing disastrous effects on the
environment by careful and optimal use of scarce resources
83
There is agreement from this research and the literature that banks in South Africa
are already implementing or need to implement sustainable business strategies
that include
bull The development of relationships with non-traditional partners
bull Co-inventing custom solutions
bull Building local capacity
bull Creating markets
bull Creating life styles
bull Innovating Such strategies would involve engaging with the BOP as consumers producers
and partners Programmes stated earlier include the Mzansi initiative (providing
cost effective products to the entry-level account holder and the informal sector) by
the South African banking sector and Community Banking (a banking model
extending affordable and accessible financial services to the underserved market
which includes low-income earners and the informal sector) by Standard Bank
(Standard Bank 2009)
Tied into these strategies is the demand for a triple-bottom-line business model
(which includes profit the community and the environment) which serves to attract
customers and employees
618 The BOP as a profitable market Bank managers responded positively to there being a profitable market at the level
of the poor which is untapped South African banks have not fully exploited this
market but the Mzansi initiative and Community banking (Standard Bank 2009)
are indications that there is activity by banks at the level of the BOP There
appears to be an understanding as per Hammond et al (2007) that raising the
84
poor into economic activity (into the formal sector) may create significant market
opportunities for business Therefore addressing the needs of the BOP will raise
their welfare productivity and income Examples such as the Norway based
Telenor and Jamaican based Digicel (Warnholz 2008) have proven that there is a
profitable market at the BOP
62 Underlying Perceptual Dimensions
Through the survey analysis process (using correlation coefficients factor analysis
and metric multidimensional scaling) the following underlying perceptual
dimensions were identified when banks collaborate or do business with the poor
bull Enhancing stakeholder value
bull Customising solutions
bull Public perception
bull Financial risk
bull A profitable market
621 Enhancing Stakeholder Value
Stakeholders include customers shareholders employees partners government
local communities and the public In enhancing stakeholder value processes need
to be in place for an inclusive partnership with the poor
The attributes that fall into this category of enhancing stakeholder value are
bull Increased shareholder value
bull Increased customers
bull Experimental relationships
bull Understanding the poor
85
bull Allocation of funds
bull Allocation of teams
Figure 14 The cycle of enhancement of stakeholder value through partnership with the poor
Karnani (2005) Prahalad (2005) and Warnholz (2007) have argued that the BOP
need to be viewed as producers and not solely as consumers There would be
much more gained by all stakeholders including the poor in treating them as
producers and empowering them The process of enhancing the stakeholder value is described above in Figure 14
Through the survey analysis the strongest relationships and reliability of
association were obtained for the attributes above This showed awareness and
86
possible application by managers of the process of collaborating with the poor and
the benefits of this collaboration to all participants direct or indirect There appears
to be a simplified or generalised model of partnerships with the poor available to
bank managers in this respect This simplified model includes some of the core
aspects of this partnership its processes and benefits
Each aspect in Figure 14 above could be investigated further for more insight and
a better understanding into underlying processes involved in achieving success in
the BOP partnerships
622 Customising Solutions Customising solutions involves the alleviation of poverty through co-inventing
solutions for the poor using technology and available scarce resources The
themes coming under this dimension are
bull Product technology
bull Price technology
bull Resource use
bull Poverty alleviation
When serving the poor there is need for a marketndashoriented approach from
business by providing value-added products or services at affordable prices and in
a sustainable manner (Karnani 2005 Rangan 2002) There is the requirement of
creativity and entrepreneurship from both business and the poor for the application
of the most advanced technology suitable for the local context (Prahalad 2002) In
addition Prahalad (2002) emphasised the environmental sustainability of the new
business models due to shortages of critical resources These shortages of critical
resources would lead to services or product manufacturing processes which use
little or limited resources without sacrificing service or product performance
87
Consequently Hahn (2009) recommended that poverty alleviation should take
place without causing disastrous effects on the ecological and social environment
Awareness or application by bank managers to customising solutions through
technology was evident due to there being strong relationships and internal
consistency in the items reported (such as product technology price technology
resource use and poverty alleviation) The detailed process of technology use is
beyond this research but can be generalised from the results and possible
understanding by bank managers as follows in Figure 15 below
Figure 15 Optimal Resource Utilisation by Application of Technology in Collaborating with the BOP for Poverty Alleviation
623 Public Perception
Public perception is the dimension of how the market the public investors
shareholders the community management and the employees view the banks or
branches The aspects under the dimension of public perception included
bull Poverty alleviation (which was shared with customising solutions)
bull Reputation
bull Social responsibility
bull Households
88
The banking fraternity needs to be viewed as socially responsible in the eyes of
stakeholders In addition the business must project a view that it aims to alleviate
poverty through understanding the poor and responding to alleviate this poverty
The expected result to the banks and their managers according to the literature
survey is an improved reputation
There was positive correlation and internal consistency between the attributes of
social responsibility poverty alleviation and the resulting reputation of the
business The aspect of treating the poor as households and not individuals
(because decisions by the poor are made at household level and not individual
level) did not correlate well and when removed the internal consistency of the
relationship between social responsibility and reputation improved
Therefore there is question as to whether the bank branch managers understood
the aspect of treating the poor as households clearly This concept derived by
Corder and Chipp (2010b) needs to be further emphasised to management and
marketers to fully engage the poor in the economics of a country Corder and
Chipp (2010b) reported that ldquo a higher incidence of collectivism among the lower
tiers of the South African Pyramid indicate that from an African perspective
therefore the BOP should be considered from a group perspective rather than a
Western view of the individualrdquo(p10) Viewing the poor segment of consumers and
producers in isolation of their households and dependencies would limit the
perspective of marketing researchers and managers
624 Financial Risk
The aspects that encompass the dimension for financial risk were that of financial decisions made by the poor and later profitability expected by the business
There was a weak relationship (in both correlation and internal consistency)
between the two aspects of financial decisions by the poor and later profitability by
89
business in dealing with the poor There is an impression that the financial risk for
both the poor and the banks is high (in the partnership) In comparison the aspect
of financial decisions by the poor is more related to the requirement for the poor in
South Africa in making decisions (financial or other) as a household Therefore
there is need for managers and marketers to recognise the collectivist nature of
the poor in Africa
This financial risk dimension consisting of two attributes is not substantial and so
further research in the area is required In addition bank branch managers did not
seem to connect the two attributes well The association seems to be made
through the impression that both attributes are financial in nature
625 A Profitable Market
There is consensus through the literature and from the survey results that there is
a profitable market at the BOP but there is disagreement as to the manner in
tapping into this market (Hammond et al 2007 Karnani 2005 Prahalad 2006
Rangan 2002 Warnholz 2007) The examples cited in Chapter 2 (section 27)
are of products and services targeted at the BOP with both poverty alleviation (or
serving the poor) and the profit motive as drivers The fifth dimension of a
profitable market could not be expanded on much because it had only one
attribute linked to it Therefore the profitable market at the level of the BOP needs
further investigation and research into its underlying associations
63 Group Responses
The different perceptual dimensions described in the previous section (such as
enhancing stakeholder value customising solutions public perception and
financial risk) were then compared within the sample population between gender
races age groups and banks The results with significant differences between
90
groups (p lt 005) were then analysed to extrapolate to the population of bank
managers or leaders The most significant comparisons were for the enhancing stakeholder value dimension (or Factor 1) See Appendix 5 Tables 27 to 30 for
details of the comparative analysis
631 Gender Comparison
Men scored higher (mean = 285) on enhancing stakeholder value than women
(mean 25) Based on these results men appear to be more open to forming
partnerships with the poor than women This finding needs further investigation
into the gender response to working with the BOP
632 Age Group Comparison
On enhancing stakeholder value the less than 35 year olds scored higher
(mean = 288) than the greater than 35 year olds (mean = 246) This difference in
response was significant There are possible generational gap issues here
resulting in such a significant difference in the responses The younger seem to be
more appreciable to collaborating with the poor for the benefit of all parties This
could be due to the entrepreneurial experimental or risk acceptance nature of the
young The older respondents could be responding less positively because of their
negative experiences when dealing with the poor in the past The two age groups
seem to have different mental models of BOP partnerships the younger model
being more open that the older to engaging with the poor
633 Bank Comparison
On the same dimension of enhancing stakeholder value Standard Bank
respondents scored the highest (mean = 283) with ABSA second (mean = 263)
and the weakest response was Nedbank (mean = 234) There are many possible
91
reasons why the responses were different between the banks The reasons may
range from different levels of awareness of managers of initiatives taking place
within the banking sector levels of communication within banks of such initiatives
to the restriction of such initiatives to head office and specialist teams The
responses could be different due to the different management structures in the
bank groups These variances in underlying perceptual dimensions need to be
further investigated and the results would be of interest to the banks scoring low
Banks need to focus in this area if they intend on doing business with the 112
million poor (16 years and older) in South Africa (Corder and Chipp 2010b)
634 Race Comparisons
In terms of financial risk the Black respondents scored (mean = 232) lower than
the Coloured Indian or Asian groups (mean = 265) and the White respondents
(mean = 270) There were significant differences in the responses from the race
groups Considering that there was little internal consistency in the financial risk
dimension this comparison was weak to interpretation Further research needs to
be carried out for findings that are more substantial
64 Summary
In summary the findings in this research supported the BOP partnership model in
the banking sector from a branch or bank manager perspective All aspects of the
partnership model were supported by the findings Unfortunately there was not
enough data to support the definition of the poor as households in their activities
from a management perspective The underlying perceptual dimensions of
enhancing stakeholder value customising solutions public perception financial
risk and a profitable market further supported the portion of the model tested in
this research The existence of groups that understood the model (at different
92
levels) and drew their own conclusions from the model together with its
dimensions further substantiated that they have this or a similar model in mind
93
CHAPTER 7 CONCLUSIONS AND RECOMMENDATIONS
71 Key Findings
The findings in this research supported the role of banks in the equal
partnership model for the economic involvement of the BOP (see Figure 5
page 41) Companies that collaborate with the BOP have great potential in
boosting both corporate and economic growth through job creation tax
revenue and investment amongst others
Managers of the banks involved in this research showed awareness of the
processes entailed in developing a partnership with the poor This alluded to the
fact that banks have been or are intending to engage with the poor and recognise
the BOP as an untapped market These activities taking place by the banks are
through products and services designed for the poor The introduction of a
different business model for this collaboration between banks and the poor
appeared to be accepted by managers
Through a deep understanding of the BOP and their lifestyles the banks have
designed their products and services for this market There are implications that
the poor would only be fully comprehended through agents on the ground or at
grass roots level Consequently experimentation has taken place at the level of
the poor with their cooperation over extended periods for the joint development of
these products and services
To deliver products and services of value to the poor simple technology was
required to provide an offering at the right price process and value There was
innovation by both the business and BOP for there to be a successful partnership
The implementation of simple technology and innovation has resulted in careful
94
use of the scarce resources (such as finances utilities and other natural
resources) available to the BOP
There was support for the allocation of resources over the long term and in a
sustainable manner towards the BOP partnership These resources would be in
the form of finances and teams or departments fully committed to dealing with the
poor The high risk in these partnerships was recognised because of the time it
would take the BOP to turn a profit Therefore there was support of the aspect of
the banks receiving profits later rather than sooner
Ultimately there was recognition of a profitable market at the BOP This value
creation is in the form of increased customers and higher returns to shareholders
In addition to the profit motive the poverty alleviation motive was supported by the
managers and hence the banks It was for the most part agreed that improving the
lifestyles of the poor allowed them to engage in the economy and boost economic
growth with the result of enhancing the reputation of the business
One area in which support was unclear was the treatment of the poor as
households and not individuals by marketers and managers The aspect of the
collectivist nature of the poor in Africa in terms of their financial decisions (which
include earnings savings and purchases) was not evident in this research
The most prominent dimension was that of enhancing stakeholder value that
captured most of the aspects of collaborating with the poor This further
substantiated the impact of the equal partnership model between the BOP and
business
There were different opinions between the categories of gender race age and
bank group in the equal partnership model These perceptions differed on the
95
underlying dimensions of enhancing stakeholder value customising solutions
public perception financial risk and a profitable market
72 Recommendations Banks should look at their business strategy and incorporate initiatives that lead to
collaboration with the poor There is vast potential in the 112 million poor (of 16
years or older) who are not fully engaged in the economy of South Africa These
programmes of engaging the poor should be developed using the model
prescribed in this research (see figure 16 below) Involvement in this untapped
BOP market can lead to community development business growth profitability
country growth and ultimately improving the general well being of the poor
Figure 16 Participants for an Equal Partnership with the Poor (or BOP)
Initiatives leading to collaborating with the BOP as producers as well as just
consumers should permeate at all levels of business to encourage
experimentation innovation and involvement by all employees The focus on
ldquodoing goodrdquo as well as ldquodoing wellrdquo will lead to an improved reputation internal
and external to the business All employees need to understand the potential in
96
themselves their communities and their businesses for the economic growth of a
nation
When collaborating with the poor the partnership needs to be considered
holistically Resources which include money electricity materials and others
need to be sourced carefully and used sparingly for a sustainable venture
Managers marketers and business leaders need to consider the poor as
households as expressed throughout this research and the literature This is
applicable especially in Southern Africa (Corder and Chipp 2010b) where the poor
deal with most financial issues collectively in their households
73 Implications for Future Research Further research is needed into the profitability or value drawn from collaborating
with the poor by business government and NGOs It would be beneficial to have
some metrics to measure the value drawn from this collaboration As this
research only relates to the collaboration of the BOP and business the
relationship with government and NGOs needs to be explored on further
investigation of the equal partnership model
The collectivism displayed by the South African poor in their financial decision-
making needs further investigation Household decision making by the poor was
not clarified or substantiated by this research
Further research is required on the financial risk dimension for more supportive
findings related to the equal partnership with the BOP More investigation could be
done on gender race age and brand of bank to determine the reason for and
result of the differences identified
97
This research could be extended to cover employees of banks at different levels
In addition managers or employees of other retail businesses could be
considered
74 Limitations of Research
There was a limitation to the level of insight gained into the other aspects of the
cycle of enhancement of stakeholder value (see Figure 14 page 85) The areas of
government facilitation NGO involvement and the BOP were not covered
Managers of banks were selected as the population and so the results of this
research can only be extrapolated to managers in the financial sector in South
Africa Additionally this research was limited to three banks in South Africa and so
cannot be extrapolated to other retail businesses or outside of South Africa
98
References
ABSA (2009) ABSA Group Limited Annual report for the year ended 31 December
2009 Retrieved from absacoza (accessed 20 June 2010)
ABSA (2010) Branch listing Retrieved from absacoza (accessed 20 July
2010)
Agarwal S Lanckriet G Wills J Kriegman D Cayton L amp Belongie S (2007
March) Generalized Non-metric Multidimensional Scaling In Meila M (Chair) and
Shen X (Chair) AI amp Statistics 2007 Symposium conducted at the meeting of
AISTATS San Juan Puerto Rico
Akula V (2008) Business Basics at the Base of the Pyramid Harvard Business
Review June p53
Albright CS Winston W L amp Zappe C (2006) Data Analysis and Decision
Making Mason Ohio Thompson South-Western
Altman D G Rego L amp Ross P (2009) Expanding Opportunity at the Base of
the Pyramid People and Strategy 32 46-51
Anderson J amp Markides C (2007) Strategic Innovation at the Base of the
Pyramid MIT Sloan Management Review 49 (1) 83-88
Andrews K R (1999) The Concept of Corporate Strategy (3rd ed) New York
McGraw Hill
Babbie E R (2005) The basics of social research Canada Thompson Learning
99
Cash J amp Pearlson K (2005) Why you should experiment with your business
How to use business experimentation to grow your company CIO 19 (2) 1
Chen S amp Ravallion M (2008) The Developing World is Poorer than we
Thought but no Less Successful in the Fight against Poverty Policy Research
Working Paper World Bank Retrieved from econworldbankorgdocsearch
(accessed 20 June 2010)
Chipp K amp Corder C (2010a) Where practice meets theory Defining and
reviewing the bottom of the pyramid for South African marketers Manuscript
submitted for publication
CIA World Factbooks (2003 to 2008) Population Below the Poverty Line by
Country 18 December 2003 to 18 December 2008 Retrieved from
nationmastercomgrapheco_pop_bel_pov_lin-economy-population-below-
poverty-line (accessed 20 June 2010)
Corder C amp Chipp K (2010b) The role of Collectivism in the BOP Should the
Bottom of the Pyramid be considered from a household or an individual viewpoint
Manuscript submitted for publication
Cummings T amp Worley C (2009) Organization Development amp Change (9th
ed) Mason Ohio South-Western
Eighty20 (2009) The BOP in SA 2009 ndash An Eighty20 AMPS 2008 Analysis
Eighty20 Retrieved from eighty20cozainsightoutmass-market-south-africa
(accessed 27 April 2010)
100
FNB (2010) Branch Locator Retrieved from fnbcoza (accessed 20 July
2010)
Foddy W (1993) Constructing questions for interviews and questionnaires New
York Cambridge University Press
Friedman M (1962) Capitalism and Freedom Chicago The University of
Chicago Press
Geldenhuys J (2008) Building an experimentation process model for financial
institutions developing personal finance products for the bottom of the pyramid
Unpublished MBA thesis GIBS University of Pretoria
Guadagnoli E amp Velicer WF (1988) Relation of sample size to the stability of
component patterns Psychological Bulletin 103 pp 265-275
Hahn R (2009) The Ethical Rational of Business for the Poor ndash Integrating the
Concepts Bottom of the Pyramid Sustainable Development and Corporate
Citizenship Journal of Business Ethics (84) pp 313-324
Hamel G amp Prahalad C K (1994) Competing for the Future Boston Harvard
Business School Press
Hammond AL Kramer WJ Katz RS Tran JT amp Walker C (2007) The
Next 4 Billion Market Size and Business Strategy at the Base of the Pyramid
Washington DC International Bank for Reconstruction and developmentWorld
Bank group
101
Hammond AL amp Prahalad CK (2004) Selling to the Poor Foreign Policy
MayJune pp 30-37 Retrieved from foriegnpolicycom (accessed 27 April
2010)
Hinkin TR (1995) A review of scale development practices in the study of
organizations Journal of Management 21 pp 967-988
Ireland J (2008) Lessons for successful BOP marketing from Caracasrsquo slums
Journal of Consumer Marketing 25 (7) pp 430-438
Karnani A (2005) Misfortune at the Bottom of the Pyramid Greener
Management International 51 pp 99-110
Karnani A (2007) Research Notes and Commentaries Doing Well by Doing
GoodmdashCase Study lsquoFair amp lovelyrsquo Whitening Cream Strategic Management
Journal 28 (13) pp 1351ndash1357 doi101002smj645
Karnani A (2007b) Doing Well by Doing GoodmdashCase Study lsquoFair amp lovelyrsquo
Whitening Cream Strategic Management Journal 28 (13) pp 1351ndash1357
doi101002smj645
King N (1994) The qualitative research interview In C Cassell and G Symon
(Eds) Qualitative methods in organisational research pp 14-36 London Sage
Publications
Kotler P amp Lee NR (2009) Up and Out of Poverty The Social Marketing
Solution Upper Saddle River Wharton School Publishing
102
Linnanen L amp Panapanaan V (2002) Roadmapping CSR in Finish Companies
Helsinki Helsinki University of Technology
London T Anupindi R amp Sheth S (2010) Creating mutual value Lessons
learned from ventures serving base of the pyramid producers Journal of Business
Research 63 (6) pp582-594
Louw A I (2008) Redefining BOP In Pursuit of Sustainable Opportunity at the
Base of the Economic Pyramid Unpublished MBA thesis GIBS University of
Pretoria
Margolis J amp Walsh J (2001) People and Profits The Search for a Link
between a Companyrsquos Social and Financial Performance Mahwah New Jersey
Lawrence Earlbaum
Martinez JL amp Carbonell M (2007) Value at the bottom of the Pyramid
Business Strategy Review18 (3) pp50-55
Moore G (2006) Exploring the Bottom of the Pyramid Perspectives in Business
pp15-18
Mouton J (2009) How to succeed in your Masterrsquos and Doctoral Studies Pretoria
Van Schaik Publishers
Naidoo K (2009) Corporate social investment as a driver of customer loyalty at
the bottom of the pyramid Unpublished MBA thesis GIBS University of Pretoria
Nedbank (2010) Branch Locator Retrieved from nedbankcoza (accessed 20
July 2010)
103
Nielsen C amp Samia PM (2008) Understanding key factors in social enterprise
development of the BOP a systems approach applied to case studies in the
Philippines Journal of Consumer Marketing 25 (7) pp 446-454
Olsen M amp Boxenbaum E (2009) Bottomndashof-the-Pyramid Organisational
Barriers to Implementation California Management Review 51(4) pp100-125
Pitta D A Guesalaga R amp Marshall P (2008) The quest for the fortune at the
bottom of the pyramid Potential and challenges Journal of Consumer Marketing
25 (7) pp 393-401
Powell S (2006) Spotlight on Stuart L Hart Management Decision 44 (10) pp
1476-1484
Prahalad CK (2002) Strategies for the Bottom of the Economic Pyramid India
as a source of innovation Reflections The Society for Organisational Learning
and MIT Vol3 No4 pp6-17
Prahalad C K (2005) The Fortune at the Bottom of the Pyramid A Mirage
London Pearson Education
Prahalad C K (2006) The fortune at the bottom of the Pyramid Eradicating
poverty through profits Upper Saddle River New Jersey Pearson
Prahalad CK amp Hart S L (2002) The Fortune at the Bottom of the Pyramid
Strategy and Business 8 (26) pp1-16
104
Pressly D (2009 September) South Africa has the widest gap between rich and
the poor Business Report 28 Retrieved from
busrepcozaindexphpfArticleId=5181018 (accessed 21 February 2010)
Rangan VK (2002) Commentary on Strategies for the Bottom of the Economic
Pyramid India as a source of innovation Reflections The Society for
Organisational Learning and MIT Vol3 No 4 pp6-17
Richman WL Kiesler S Weisband S amp Drasgow F (1999) A meta-analytic
study of social desirability distortion in computer-administered questionnaires
Journal of applied Psychology 84 pp 754-775
Rost C amp Ydreacuten E (2006) Profit for the Poor Sustainable Market Development
in BOP Markets Joumlnkoumlping International Business School
SAARF (2010) The South African Advertising Research Foundation Living
Standards Measure Retrieved from wwwSaarfcozaLSMlsmshtm (accessed
19 July 2010)
Sanchez P Ricart JE amp Rodriguez MA (2006) Influential factors in becoming
socially embedded in Low-Income Markets Greener Management International
IESE Business School 5 pp 19-51
Seidman I E (2006) Interviewing as qualitative research a guide for researchers
in education and the social sciences (3rd ed) New York Teacher College
Process
105
Simanis E (2009 October 26) Marketing at the base of the pyramid When
selling to poor consumers companies need to begin by doing something basic
They need to create the market Wall Street Journal New York p R7
Simanis E amp Hart S (2008b) The Base of the Pyramid Protocol Towards Next
Generation BOP Strategy (Second ed) New York Cornell University Johnson
School of Management
Simanis E Duke D amp Hart S (2008) The Base of the Pyramid Protocol
Beyond Basic Needs Strategies Innovations Winter
Spector PE (1987) Method variance as an artifact in self-reported affect and
perceptions at work Myth or significant problem Journal of Applied Psychology
72 pp 483-443
Standard Bank 2009 The Standard Bank of South Africa Annual Report for 2009
Retrieved from wwwstandardbankcoza (accessed 18 July 2010)
Standard Bank (2010) Branch Locator Retrieved from standardbankcoza
(accessed 21 July 2010)
Tharenou P Donohue R amp Cooper B (2007) Management Research
Methods Melbourne Cambridge University Press
United Nations (1948) The Universal Declaration of Human Rights New York
United Nations Retrieved from wwwohchrorgenudhrpagesintroductionaspx
(accessed 20 June 2010)
106
United Nations (2006) The Millennium Development Goals Report 2006 New
York United Nations p4
Van Marrewijk M (2003) Concepts and definitions of CSR and Corporate
Sustainability Between Agency and Communion Journal of Business Ethics 44
pp 95-105
Warnholz J (2007) Poverty Reduction for Profit A critical examination of
business opportunities at the Bottom of the Pyramid Queen Elizabeth House
Working Paper Series Oxford University
Warnholz J (2008) Even the poorest can be a thriving market Harvard Business
Review May p 26
Welman J amp Kruger S ( 2001) Research Methodology Cape Town Oxford
University Press
Whitehouse L (2006) Corporate Social Responsibility Views from the Frontline
Journal of Business Ethics 63 pp 279-296
Willie E amp Barham K (2009) A Role for Business at the Bottom of the Pyramid
Berkhamstead Ashridge
Wreathall J (1995) Organizational culture behavior norms and safety In A
Carnino amp G Weiman (Eds) Proceedings of the International Topical Meeting on
Safety Culture in Nuclear Installations (pp 24-28) Vienna Austria American
Nuclear Society of Austria
Zikmund WG (2003) Business Research Methods Mason Ohio South-
Western
107
Appendix 1 Examples of Involving the BOP in the Economy Real examples of involving the BOP in the economy from the survey reported by
Hammond et al (2007) (p13)
ldquoIn an informal suburb of Guadalajara Mexico a growing family is struggling to
expand their small house Help arrives from a major industrial company in the
form of construction designs credit and as-needed delivery of materials
enabling rapid completion of the project at less overall cost
In rural Madhya Pradesh an Indian farmer gains access to soil testing services
to market price trends that help him decide what to grow and when to sell and
to higher prices for his crop than he can obtain in the local auction market The
new system is an innovation of a large grain-buying corporation which also
benefits from cost saving and more direct market access
A South African who lives in an impoverished crime-ridden neighbourhood of
Johannesburg has no bank account cannot order items from a distant store
and is sometimes robbed of her pay packet She finds that a new financial
service offered by a local start-up company allows her mobile phone to become
a solutionmdashher pay is deposited directly to her phone-based account she can
make purchases via an associated debit card and she carries no cash to steal
In a small community outside Tianjin China a small merchant whose children
have been repeatedly sickened by drinking water from a heavily- polluted river
is distraught He finds help not from the overwhelmed municipal government but
from a new low-cost filtering system developed by an entrepreneurial
companyrdquo
108
Appendix 2 The Cornell University BOP Protocol Process
This appendix summarises the processes involved in the BOP Protocol developed
at Cornell University by Stuart Hart Erik Simanis and their colleagues (2008b) as
discussed in the report by Willie and Barham (2009)
Pre-field processes
The corporation needs to spend time in careful preparation before actually starting
the work of setting up a joint venture with a community The aim is to set up a new
business in the community of which members of the BOP should have a sense of
ownership on equal terms with the corporation Such a new business should be in
an area of BOP need in which the corporation has capabilities but this is allowed
to emerge rather than laid down from the start It is not an initial objective The
pre-field work may take as much as four months It includes three interdependent
activities
1 The selection of appropriate project sites
The criteria for this should be that the chosen community has a prima facie
need for the exercise of the specific capabilities of the corporation The
choice of country or region should be based on the corporationrsquos long term
strategic interests and the existence of some of the corporate facilities
nearby though not necessarily of an extensive entrenched business
presence in the country
2 Team formation and preparation
A multi-functional team from the corporation consisting possibly of four
people should be formed They should between them have the knowledge
109
and experience to be able to draw on and apply their companyrsquos core
competences to the local situation as it emerges Ideally they should be
selected from the people already employed in the corporationrsquos activities in
the country in which the project is to be based Once local partnership is
established one or two additional members linked with the community may
be added The team is then trained in the philosophy and practice of the
Protocol ndash other corporate staff may conduct this training and it should
include awareness of how to access support and resources from the
corporation itself whilst being able to operate independently and not
constrained by the culture and procedures of the parent corporation
3 Local partner selection
As ldquooutsidersrdquo initially the team will depend on the trust and community
knowledge of local partners These should be open to new ideas have
experience of participatory working and be ldquosocially embeddedrdquo in the
community NGOs operating in a community may be able to help identify
the right people Such partners will be compensated for their time
In-field processes
These are the three interdependent phases of activity that build the new business
and embed it in the community and make progress in developing a market for the
products or services It also begins to establish a community team who will be able
eventually to take over and lead the new business while the corporation moves on
to embedding the proven business in other communities
110
Phase I ndash Opening up
The company representatives are immersed in the life of the community living
with the local people for a week or two (home-stays) and taking part in their normal
life with all its limitations The team from the community joins with the company
team in developing business ideas and there are a series of participatory
workshops to establish a common business language leading to a shared concept
of a single practicable outline business action plan In this period deep dialogue
with the community is established a wider project team involving people from the
community reflecting its diversity (caste income age occupation) is developed
trust and mutual respect grows After some months of working together this phase
arrives at an idea of the resources wants and needs of all involved leading to a
clear value proposition exceeding anything currently done
Phase II ndash Building the ecosystem
This creates the organisational foundation for the new business and by action
learning methods develops an initial prototype through small-scale
experimentation at a low level of complexity This practical work furthers the
uniting of the community with the corporation Further members join the team on a
full-time basis and the work is divided up between groups of 4-6 who gradually
withdraw from their other occupations All new members undergo induction
training
Phase II will last about six months and transition from Phase 1 to Phase II should
not exceed six weeks Phase II moves from development of the project team to
building shared commitment and new capability development with the outcome of
the creation of a viable business prototype that has passed through an initial
ldquomarket screenrdquo Generating some quick income has to be balanced with longer-
term activity which will generate sustainable income
111
Phase III ndash Enterprise creation
This phase aims ldquoto establish both a committed market base and a new
organisation capable of sustaining and growing the enterprise while evolving and
expanding the initial prototype into a complete business model ready for scaling
out ndash for replicating the business in communities in other geographical districts and
regionsrdquo The community members of the project team learn the skills to operate
as an independent business unit Corporate influence increasingly fades out
during this phase The new business should avoid becoming a mere link in
someone elsersquos supply chain and should maintain an identity of its own
Scaling out
The next step is to transfer efficiently and re-embed the business model in
hundreds or even thousands of other communities in new geographical areas
Three steps are proposed
bull Reaching out to new communities through business ambassadors planting
the seed and creating extended project teams
bull Linking the ecosystem by formal connections between the initial BOP
business and the new project teams thus helping further businesses to
adopt the organisational culture and guide business roll-out
bull Creating a network of interdependent business communities
Scaling out is seen as a process without end as more and more communities seek
to build on the original ldquopilotrdquo parent community From pre-field processes to the
point where the pilot BOP business is ready to spread its concepts takes between
112
two and three years The practical outworking in a scaling out process will take
further time which is difficult to estimate as it will vary according to specific
conditions However scaling out is expected to enable other communities to form
businesses much more quickly than the initial establishment of the business
113
Appendix 3 The Informed Consent Letter and Structured Questionnaire
A Informed Consent Letter ndash Researcher administered version
Good day my name is Kamlesh Vasanjee and I am an MBA student at the Gordon
Institute of Business science (GIBS) which is part of the University of Pretoria I am
conducting research on the business relationship between banks and the poor I am
aiming to find out more about the activities by banks that engage the poor as partners
This interview will take approximately 15 minutes of your time
Please note that
bull Any information obtained from the surveys will be used exclusively for the
purposes of the research
bull All information will be treated with strict confidentiality and your name will not be
reflected in the dissertation
bull Your participation is voluntary and you can withdraw at any time without penalty
bull The interviews are close-ended and will not be tape recorded or transcribed
bull You are under no financial obligation or commitment
The direct benefit to you participating in this study is that this information will provide a
better understanding of market requirements By participating and completing this
interview you indicate that you voluntarily participate in this research
If you have any concerns please contact me or my supervisor Dr Clive Corder Our
contact details are as follows
Kamlesh Vasanjee Clive Corder
ppccoza clivecoiconcoza
0826035762 0826556740
I can email or fax this letter of consent to you if you provide me with your email address or fax number so you will have our contact details
114
B Informed Consent Letter ndash Version administered by other Good day my name is helliphelliphelliphelliphelliphelliphelliphelliphelliphellip and I am conducting research for Kamlesh
Vasanjee who is an MBA student at the Gordon Institute of Business science (GIBS)
which is part of the University of Pretoria The research is on the business relationship
between banks and the poor The aim of the research is to find out more about the
activities by banks that engage the poor as partners This interview will take approximately
15 minutes of your time
Please note that
bull Any information obtained from the surveys will be used exclusively for the
purposes of the research
bull All information will be treated with strict confidentiality and your name will not be
reflected in the dissertation
bull Your participation is voluntary and you can withdraw at any time without penalty
bull The interviews are close-ended and will not be tape recorded or transcribed
bull You are under no financial obligation or commitment
The direct benefit to you participating in this study is that this information will provide a
better understanding of market requirements By participating and completing this
interview you indicate that you voluntarily participate in this research
If you have any concerns please contact Kamlesh Vasanjee or his supervisor Dr Clive
Corder Their contact details are as follows
Kamlesh Vasanjee Clive Corder
ppccoza clivecoiconcoza
0826035762 0826556740
I can email or fax this letter of consent to you if you provide me with your email address or fax number so you will have our contact details
115
Structured Questionnaire
Questions
Demographics
1 Record Gender
Male Female
2 Record race
Which racial group do you belong to
Black Coloured Indian or
Asian White
3 Record Age group
Which of the following age groups do you fall into
Under 35 35 to 49 Above 50 Refused
4 Record Bank
ABSA Nedbank Standard Bank
5 What levels of banking does your branch handle
Personal Business
I will be reading out some definitions for you so please take note
116
The adult population in South Africa has been divided into ten groupings termed Living Standards Measure (LSMs) (SAARF 2010) The LSMs are based on ownership of a
range of household items such as a television or vacuum cleaner (as examples) and on
urbanisation such as availability of hot running water and electricity (as examples)
Please note that the poor
are defined (as per Chipp and Corder 2010a) in this study as
those adult South Africans (16+ years) in LSM 1 to 4 (the four lowest groups of living
standards)
I am going to read out a few statements and as I read each statement please tell me to
what extent you disagree or agree with the statement by using the numbers 1 to 4 where
1 equals disagree 2 equates to slightly agree 3 equals agree and 4 equates to strongly
agree You may choose any number you want
6 1 Disagree
2 Slightly Agree
3 Agree
4 Strongly
agree a When considering the financial state of
the poor they should be treated as
households rather than individuals Remember 1 = disagree 2 = slightly agree 3 = agree and 4 = strongly agree
b There is a profitable market at the
level of the poor (LSM 1 to 4) which has
not been tapped to its fullest
c Poor households or families in SA
make financial decisions together
I am now going to ask you about partnerships between the bank and the poor (Simanis
Duke amp Hart 2008) The partners
would be members in a business project or
association where each member is responsible for the success of the business
117
7 This branch commits resources in partnerships with the poor by
1 Disagree
2 Slightly Agree
3 Agree
4 Strongly
agree a Allocating funds for many years to
new business partnerships Remember 1 = disagree 2 = slightly agree 3 = agree and 4 = strongly agree
b Allocation of a department or team
specifically responsible for dealing with
the partnerships
8 This branch prepared well for partnering with the poor by
1 Disagree
2 Slightly Agree
3 Agree
4 Strongly
agree a Experimenting with different ways of
forming mutually beneficial relationships
b Spending lots of time with the poor to
get a deep understanding of the real
situation in these communities
9 The value created for this branch by partnering with the poor is
1 Disagree
2 Slightly Agree
3 Agree
4 Strongly
agree a An increase in the number of
profitable customers
b An increase in the value of the bank
to the shareholders because of higher
returns
c Part of the social responsibility of the
bank to the poor
d The improved reputation of the branch Just as a reminder the scale is as follows 1=disagree 2=slightly agree 3=agree and
4=strongly agree
118
10 Innovative technology has been implemented by this branch when partnering with the poor through
1 Disagree
2 Slightly Agree
3 Agree
4 Strongly
agree
a Value for money simple or local
processes products or services
b Quality products and services which
are priced for the poor
11 When partnering with the poor profits are expected
1 Disagree
2 Slightly Agree
3 Agree
4 Strongly
agree a Later rather than sooner
12 The bank has a responsibility to ensure long term success of the partnership
1 Disagree
2 Slightly Agree
3 Agree
4 Strongly
agree
a To alleviate poverty
b And to ensure the careful use of
resources such as money electricity
clean water and other natural resources
Thank you for your participation and enjoy the rest of your day
119
Appendix 4 Descriptive Statistics
Table 13 Descriptive Statistics on Gender
Gender
Frequency Percent Valid Percent
Cumulative
Percent
Valid Female 78 690 690 690
Male 35 310 310 1000
Total 113 1000 1000
Figure 17 Proportion of the Different Sexes
120
Table 14 Descriptive Statistics on Race
Race
Frequency Percent Valid Percent
Cumulative
Percent
Valid Black 34 301 301 301
Coloured Indian Asian 31 274 274 575
White 48 425 425 1000
Total 113 1000 1000
Figure 18 Race Composition for the Survey
121
Table 15 Descriptive Statistics on Age Groups
Age Group
Frequency Percent Valid Percent
Cumulative
Percent
Valid 35-49 67 593 593 593
Above 50 6 53 53 646
Under 35 40 354 354 1000
Total 113 1000 1000 Figure 19 Age Group Distribution
122
Table 16 Descriptive Statistics on Banks
Bank
Frequency Percent Valid Percent
Cumulative
Percent
Valid ABSA 55 487 487 487
Nedbank 30 265 265 752
Standard 28 248 248 1000
Total 113 1000 1000
Figure 20 Bank Distribution
123
Table 17 Descriptive Statistics on Type of Banking
Business or personal banking
Frequency Percent Valid Percent
Cumulative
Percent
Valid Both 73 646 646 646
Business 5 44 44 690
Personal 35 310 310 1000
Total 113 1000 1000
Figure 21 Type of Banking
124
Appendix 5 Multivariate Statistics Table 18 One Sample Two Tailed T-test Results
One-Sample Statistics Test Value = 2 95 Confid Inter of the
Diff
N Mean Std Deviation
Std Error Mean
t df Sig (2-
tailed) Mean
Difference Lower Upper
6a Households 113 215 1063 01 1505 112 0135 015 -005 035
6b Profitable market 113 273 0897 0084 8708 112 0000 0735 057 09
6c Financial Decisions 113 227 0954 009 2957 112 0004 0265 009 044
7a Allocation of funds 111 253 098 0093 5714 110 0000 0532 035 072
7b Allocation of teams 111 25 098 0093 5324 110 0000 0495 031 068
8a Experimental relationships
112 283 0746 007 11779 111 0000 083 069 097
8b Understanding poor
110 264 0864 0082 7721 109 0000 0636 047 08
9a Increased customers 112 259 0844 008 7387 111 0000 0589 043 075
9b Increased shareholder value
112 255 0899 0085 6518 111 0000 0554 039 072
9c Social responsibility 112 321 065 0061 19779 111 0000 1214 109 134
9d Reputation 112 316 0578 0055 21246 111 0000 1161 105 127
10a Product technology 112 285 0808 0076 11113 111 0000 0848 07 1
10b Price technology 112 29 0735 0069 12989 111 0000 0902 076 104
11a Later profitability 111 287 0776 0074 11865 110 0000 0874 073 102
12a Poverty alleviation 112 318 0661 0062 18883 111 0000 1179 105 13
12b Resource use 112 296 0709 0067 14386 111 0000 0964 083 11
125
Table 19 Correlations of the Banks Partnership with the Poor
Question 6a 6b 6c 7a 7b 8a 8b 9a 9b 9c 9d 10a 10b 11a 12a 12b
6a Households 10
6b Profitable market 01 10
6c Financial Decisions
-01 02 10
7a Allocation of funds 01 02 00 10
7b Allocation of teams 01 01 00 05 10
8a Experimental relationships
00 00 00 04 04 10
8b Understanding poor
00 -01 01 03 02 05 10
9a Increased customers 00 01 02 04 03 05 04 10
9b Increased shareholder value
00 01 01 04 03 04 04 06 10
9c Social responsibility 02 01 02 02 03 04 02 02 01 10
9d Reputation 02 00 02 02 03 04 03 02 03 05 10
10a Product technology 01 01 01 02 03 04 03 03 02 03 03 10
10b Price technology 01 02 03 02 03 03 03 03 02 03 03 06 10
11a Later profitability 01 01 02 01 02 02 02 02 02 03 03 04 02 10
12a Poverty alleviation 02 -
01 01 02 03 04 04 03 02 04 05 04 03 04 10
12b Resource use 00 -
01 00 03 02 02 01 02 01 02 02 03 03 01 05 10
126
Table 20 Adjusted Correlations with Factors Subtracted from One ndash (smaller values depict closeness in relationship and larger more distant)
Question 6a 6b 6c 7a 7b 8a 8b 9a 9b 9c 9d 10a
10b
11a
12a
12b
6a Households 000
6b Profitable market 090 000
6c Financial Decisions 108 086 000
7a Allocation of funds 094 079 096 000
7b Allocation of teams 095 092 100 046 000
8a Experimental relationships
100 097 099 060 057 000
8b Understanding poor
099 109 094 074 081 053 000
9a Increased customers 107 086 079 054 069 055 066 000
9b Increased shareholder value
107 092 093 062 071 059 063 040 000
9c Social responsibility 087 094 089 073 068 065 075 081 085 000
9d Reputation 079 103 083 079 076 062 074 075 069 054 000
10a Product technology 090 086 087 078 074 059 069 068 077 077 074 000
10b Price technology 091 084 076 077 071 067 069 075 084 069 075 045 000
11a Later profitability 094 091 082 090 081 077 077 075 082 073 071 063 082 000
12a Poverty alleviation 082 106 086 079 068 055 065 071 079 059 046 059 067 064 000
12b Resource use 097 106 101 069 081 086 086 077 081 071 077 070 075 085 047 000
127
Table 21 A Five Factor Principal Component Analysis with Varimax Rotation
Item Component
1 2 3 4 5 9b Increased shareholder value 08
9a Increased customers 0752 021
8a Experimental relationships 0691 024 0279
8b Understanding poor 0604 -0312
7a Allocation of funds 0592 0252 -0264 0451
7b Allocation of teams 0478 0308 0285 -0231 0328
12b Resource use 0775
10a Product technology 0233 0678 0288
10b Price technology 0649 0341 021
12a Poverty alleviation 0245 0568 0529 -023
9d Reputation 0312 0719
9c Social responsibility 0234 0665
6a Households 0659 0255
6c Financial Decisions 077
11a Later profitability 0221 0315 0455
6b Profitable market 0238 0805
128
Table 22 Cronbachrsquos Alpha on Factor 1 with Values after Item Deletion
Reliability Statistics on Factor 1
Cronbachs Alpha
Cronbachs
Alpha Based on
Standardised
Items N of Items
792 796 6
Item-Total Statistics
Item Squared Multiple
Correlation
Cronbachs
Alpha if Item
Deleted
9b Increased
shareholder value
397 754
9a Increased customers 435 746
8a Experimental
relationships
410 746
8b Understanding poor 272 783
7a Allocation of funds 389 754
7b Allocation of teams 355 775
129
Table 23 Cronbachrsquos Alpha on Factor 2 with Values after Item Deletion
Reliability Statistics on Factor 2
Cronbachs Alpha
Cronbachs
Alpha Based on
Standardized
Items N of Items
723 725 4
Item-Total Statistics
Item Squared Multiple
Correlation
Cronbachs
Alpha if Item
Deleted
10a Product technology 364 635
10b Price technology 320 669
12b Resource use 295 696
12a Poverty alleviation 357 642
130
Table 24 Cronbachrsquos Alpha on Factor 3 with Values after Item Deletion
Reliability Statistics on Factor 3
Cronbachs Alpha
Cronbachs
Alpha Based on
Standardized
Items N of Items
440 521 3
Item-Total Statistics
Item Squared Multiple
Correlation
Cronbachs
Alpha if Item
Deleted
9d Reputation 233 211
9c Social
responsibility
212 296
6a Households 045 626
131
Table 25 Cronbachrsquos Alpha on Factor 3 without item ldquoHouseholdsrdquo
Reliability Statistics on Factor 3 without Households
Cronbachs Alpha
Cronbachs
Alpha Based
on
Standardized
Items N of Items
626 629 2
Item-Total Statistics
Item Squared
Multiple
Correlation
Cronbachs
Alpha if Item
Deleted
9d Reputation 211 a
9c Social responsibility 211 a
a The value is negative due to a negative average covariance
among items This violates reliability model assumptions You
may want to check item codings
132
Table 26 Cronbachrsquos Alpha on Factor 4 with Values after Item Deletion
Reliability Statistics on Factor 4
Cronbachs Alpha
Cronbachs
Alpha Based on
Standardized
Items N of Items
296 302 2
Item-Total Statistics
Squared Multiple
Correlation
Cronbachs
Alpha if Item
Deleted
11a Later profitability 032 a
6c Financial Decisions 032 a
a The value is negative due to a negative average covariance
among items This violates reliability model assumptions You
may want to check item codings
133
Table 27 One ndashway Analysis of Variance on Gender
Descriptive Data for Gender
N Mean
Std
Deviation Std Error
Factor_1 Female 78 24968 58577 06633
Male 34 28529 64061 10986
Total 112 26049 62216 05879
Test of Homogeneity of Variances on Gender
Levene
Statistic df1 df2 Sig
Factor_1 100 1 110 753
Factor_2 007 1 110 936
Factor_3 1904 1 110 170
Factor_4 668 1 111 416
ANOVA for Gender
Sum of
Square
s df
Mean
Square F Sig
Factor_1 Between Groups 3003 1 3003 8267 005
Within Groups 39963 110 363 Total 42966 111
134
Table 28 One ndashway Analysis of Variance on Race
Descriptives
N Mean
Std
Deviation Std Error
Factor_4 Black 34 23235 75761 12993
Coloured Indian Asian 31 26452 64799 11638
White 48 26979 56248 08119
Total 113 25708 66436 06250
Test of Homogeneity of Variances
Levene Statistic df1 df2 Sig
Factor_1 1706 2 109 186
Factor_2 1951 2 109 147
Factor_3 525 2 109 593
Factor_4 1440 2 110 241
ANOVA
Sum of
Squares df
Mean
Square F Sig
Factor_4 Between Groups 3026 2 1513 3586 031
Within Groups 46408 110 422
Total 49434 112
135
Table 29 Onendashway Analysis of Variance on Age Groups
Descriptives
N Mean
Std
Deviation Std Error
Factor_1 Under 35 39 28761 49518 07929
35+ 73 24600 63737 07460
Total 112 26049 62216 05879
Test of Homogeneity of Variances Levene Statistic df1 df2 Sig
Factor_1 2899 1 110 091
Factor_2 006 1 110 938
Factor_3 104 1 110 747
Factor_4 032 1 111 857
ANOVA
Sum of
Squares df
Mean
Square F Sig
Factor_1 Between Groups 4400 1 4400 12548 001
Within Groups 38567 110 351 Total 42966 111 Total 49434 112
136
Table 30 Onendashway Analysis of Variance on the Bank Groups
Descriptives
N Mean
Std
Deviation Std Error
Factor_1 ABSA 54 26312 50766 06908
Nedbank 30 23444 76305 13931
Standard 28 28333 57378 10843
Total 112 26049 62216 05879
Test of Homogeneity of Variances Levene Statistic df1 df2 Sig
Factor_1 2490 2 109 088
Factor_2 1102 2 109 336
Factor_3 2730 2 109 070
Factor_4 748 2 110 476
ANOVA
Sum of
Squares df Mean Square F Sig
Factor_1 Between
Groups
3533 2 1767 4884 009
Within Groups 39433 109 362 Total 42966 111