Embed Size (px)
Citation preview
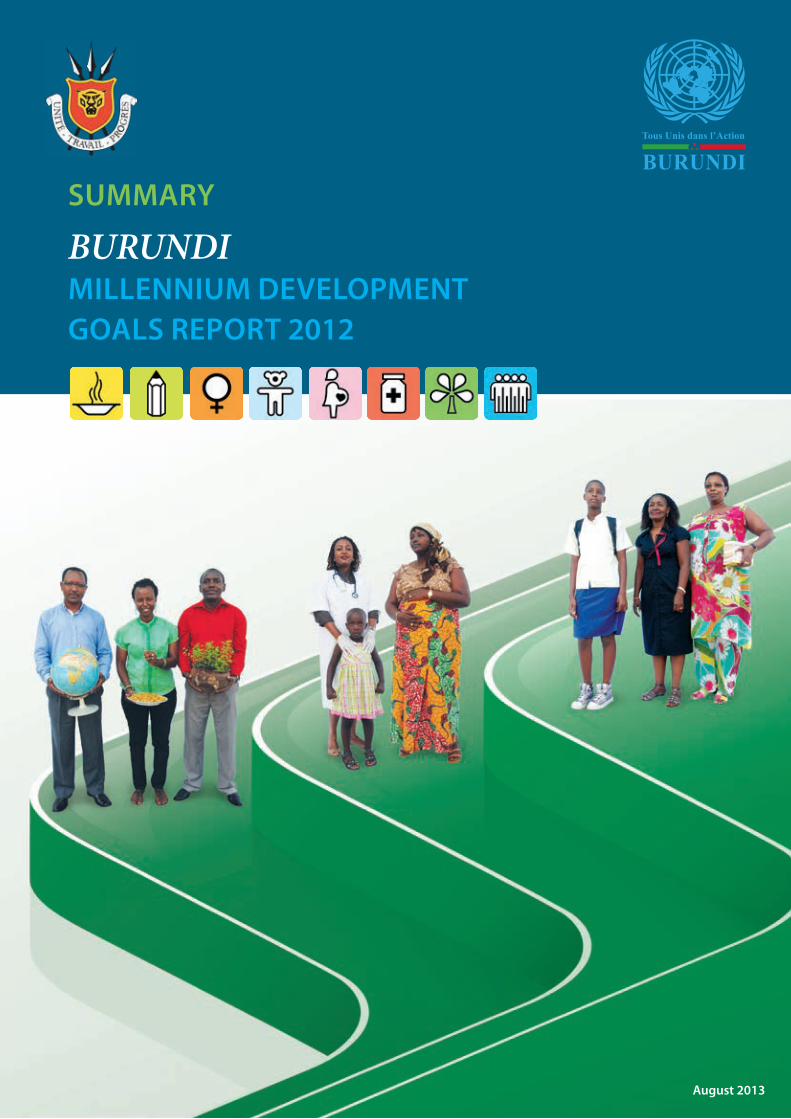
BURUNDIMillenniuM DevelopMent Goals RepoRt 2012
suMMaRY
august 2013
Tous Unis dans l’Action
BURUNDI
United Nations system in Burundi and Government of Burundi 2012
The United Nations system in Burundi has been supported national efforts for over forty years in designing and implementing sustainable development policies and programmes.
This National Report, the third in a series, assesses the progress made by the country towards the Millennium Development Goals (MDGs). It is the outcome of close cooperation between the United Nations and the government of Burundi.
Photos credits: ©UNDP Burundi/Aaron.Nsavyimana © UNDP Burundi/Aude.Rossignol
Design, layout and printing by Phoenix Design Aid A/S, Denmark ISO 14001/ISO 9000 certified. The opinions and recommandations expressed in this report do not necessarily reflect those of the United Nations.
Copyright ©2013
United Nations system in Burundi BNUB CompoundChaussée d’UviraP.O. Box 1490, Bujumbura, BurundiWebsites: www.bi.one.un.orgwww.bi.undp.org
Ministry of Finance and Economic Development PlanningAvenue de l’Indépendance no.1 P.O. Box 224, Bujumbura, Burundi
All rights reserved. The contents of this publication may be reproduced in whole or in part provided the intended use is for non-commercial purposes with the attribution of authorship to rights holders. This publication was issued on August 2013
suMMaRY
BURUNDIMillenniuM DevelopMent Goals RepoRt 2012
Tous Unis dans l’Action
BURUNDI
At the 55th ordinary session of the United Nations General Assembly
from 6 to 8 September 2000 in New-York, 189 countries approved
the Millennium Development Declaration. This declaration is a
global vision where developed and developing countries work
together for the advancement of everyone, particularly the most
disadvantaged nations. At the highest political level, participants
committed to setting goals which, once achieved, would end
extreme poverty around the world by 2015. In order to set up
a development framework to measure progress, the vision was
translated into eight Millennium Development Goals, 18 targets
and 48 indicators. In 2007, this monitoring framework was revised to
include four new targets determined by member states at the 2005
World Summit. Additional indicators to monitor progress as regards
new targets were also defined. These targets, along with a calendar,
constitute a true pact between the major world economic players.
The poorest countries, for their part, committed to making progress
in terms of domestic policies and governance and ensuring better
accountability to their citizens. The richest nations committed
in turn to providing support through a “global partnership for
development”.
The adoption of the Millennium Declaration raised high
expectations in Africa, particularly as, in addition to defining strategic
development guidelines for the world in general, it placed primary
importance on issues affecting the continent. The Declaration called
for a response to the particular needs of Africa, a continent where
the most vulnerable populations are concentrated, with the aim to
achieving sustainable peace and development, eliminating poverty
and bringing Africa into the mainstream of the world economy.
In Burundi, as in most poor countries, the MDGs are ambitious
in terms of the deadlines set. However, there is still time to
achieve some targets by 2015 if all parties take the necessary
steps, namely improving governance, empowering and actively
engaging civil society, promoting entrepreneurship and the private
sector, mobilising domestic resources, substantially increasing
development aid for priority investments required by the MDGs and
implementing significant budgetary and commercial reforms.
The 2012 MDG national report for Burundi is prepared and published
thanks to the collaboration among UNDP, the participation of
all United Nations agencies and the Government. This advocacy
tool aims at sensitising various development stakeholders on the
necessity to focus national debate on poverty issues, which remain
at the core of policies, strategies and development programmes. It
also aims to measure progress made in achieving MDG targets.
The report notes that Burundi has made important progress in most
MDG indicators. For instance, the likelihood of achieving the net
enrolment targets in primary school, eliminating gender disparity
in primary education, halting the spread of HIV/Aids, halting and
reversing the incidence of malaria and other major diseases and of
halving the percentage of the population without sustainable access
to safe drinking water is high. Other targets can be achieved if the
government makes considerable efforts with the assistance of the
development partners. These relate in particular to the targets of MDG
4 and 5.
However, apart from the above-mentioned progress, there is little
hope of achieving the other targets by 2015. The cost of the socio-
political crisis in the 90s continues to overshadow any real take-off
in the economy. In ten years of crisis, most human development
indicators regressed by 15 years, particularly poverty.
FoRewoRD
ii
The report encourages the government to step up its initiative to
mobilise resources by spending more public money on priority
investments. It also urges donors to finally honour their long-
standing commitments to significantly increase aid. This derives
from the fact that the technical constraints weighing on achieving
MDGs should not be confused with financial constraints. While
responsibility for reducing poverty primarily lies with the Burundian
government, achieving the MDGs calls for a substantial increase in
public development aid to break out of poverty trap.
We hope that the current discussions on the post-2015 framework
will provide a more global approach to eradicating poverty, placing
it in a wider political and economic context, covering the three
economic, social and environmental dimensions of sustainable
development and promoting approaches founded on the
upholding of rights.
As regards Burundi, the vision for 2015 shared by the Burundian
people and the priorities contained in PRSP II are assets that can
help drive poverty eradication. However, a number of challenges
and related costs in order to realise the recommendations of this
document with regard to MDGs must also be taken into account.
These include the following:
• Controlling demographic growth, a major challenge
• The necessity of initiating structural reforms both in how services
are delivered by favouring bottom-up development approaches
that are inclusive, participatory and equitable and by focusing
on strengthening human and institutional capacities. The low
level of human resource qualifications is a real handicap to the
employability of young people and to long-term development.
• Finally, mobilising resources to achieve MDGs is of capital
importance. This reflects the necessity of waging advocacy and
mobilisation campaigns based on participatory planning and of
seizing existing opportunities, in particular all funds set up by the
United Nations to support the achievement of MDGs.
In view of the above-mentioned challenges, we are launching an
appeal to all Burundi’s development partners to strengthen the
current partnership to enable the Burundian people to achieve their
legitimate aspirations.
His excellency Mr tabu abdallah Manirakiza Minister of Finance andeconomic Development planning
Ms Rosine sori-Coulibalyunited nations Resident Coordinatorand Resident Representative of unDp
Burundi Milennium Development Goals – summary of report 2012 iii

iv
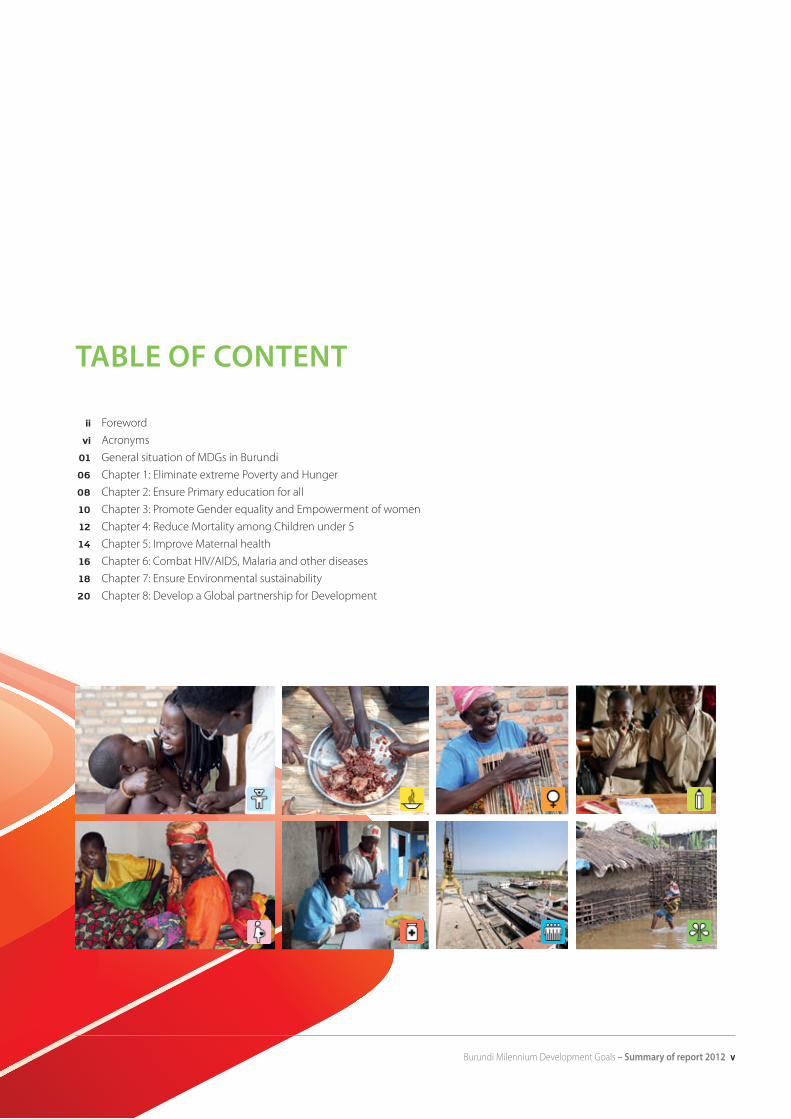
ii Foreword
vi Acronyms
01 General situation of MDGs in Burundi
06 Chapter 1: Eliminate extreme Poverty and Hunger
08 Chapter 2: Ensure Primary education for all
10 Chapter 3: Promote Gender equality and Empowerment of women
12 Chapter 4: Reduce Mortality among Children under 5
14 Chapter 5: Improve Maternal health
16 Chapter 6: Combat HIV/AIDS, Malaria and other diseases
18 Chapter 7: Ensure Environmental sustainability
20 Chapter 8: Develop a Global partnership for Development
taBle oF Content
Burundi Milennium Development Goals – summary of report 2012 v
ACT: Artemisin based Combination therapy
ARVs: Anti-retrovirals
BSS: Behavioral Surveillance Survey
CDIAC: Carbon Dioxide Information Analysis Center
CH4: Methane
CHERG: Child Health Epidemiology Reference Group
CO2: Carbon dioxide
CPN: Prenatal Care (PC)
CSLP: Strategic Framework for Poverty Reduction
DAC: Development Assistance Committee
DHS: Demographic and Health Survey
DRC: Democratic Republic of Congo
EAC: East African Community
ENECEF: National Survey on living conditions of Children and
Women
EU: European Union
FAD: African Development Fund
FDI: Foreign Direct Investment
FOSA: Health training
GAVI: Global Alliance for Vaccines and Immunization
GDP: Gross Domestic Product
GFATM: Global Fund to fight AIDS, Tuberculosis and Malaria
GHG: Greenhouse Gas
GNI: Gross National Income
GNP: Gross National Product
HIPC: Heavily Indebted Poor Countries
HIV/AIDS: Human Immunodeficiency Virus/Acquired
Immunodeficiency Syndrome
ICT: Information and Communication Technologies
IDA: International Development Association
IGME: Inter-agency Group for Child Mortality Estimation
IMCI: Integrated Management of Childhood Illness
IMF: International Monetary Fund
ISTEEBU: Institute of Statistical and Economic Studies of
Burundi
IUCN: International Union for Conservation of Nature
IUD: Intrauterine Device
LDCs: Least Developed Countries
LLIN: long-lasting insecticidal nets
MDGs: Millennium Development Goals
MDRI: Multilateral Debt Relief Initiative
MICS: Multiple Indicator Cluster Survey
MMEIG: Maternal Mortality Estimation Interagency Group
MPAs: Marine Protected Areas
MSP/PNILP: Ministry of Public Health/ National Integrated Malaria
Control Program
MSPLS: Ministry of Health and AIDS Control
NAS: National Agricultural Strategy
aCRonYMs
vi
NASA: National AIDS Spending Assessments
NCPTB: New cases of smear-positive or negative Pulmonary
Tuberculosis
NEIC: National Energy Information Centre
NGOs: Non-Governmental Organisations
NO2: Nitrogen dioxide
ODA: Official Development Assistance
ODS: Ozone depleting Substances
OECD: Organization for Economic Co-operation and
Development
PBF: Performance-Based Financing
PLHIVs: Persons Living With HIV
PMTCT: Prevention of Mother-to-Child Transmission (HIV/
AIDS)
PNIA: National Agriculture Investment Plan
PNLT: National Tuberculosis Control Programme
PNSR: National Programme on Reproductive Health
PRSP: Poverty Reduction Strategy Paper
RH/FP: Reproductive Health/Family Planning
SNIS: National Health Information System
SONU: Emergency Obstetric and Newborn Care
SONUB: Basic Emergency Obstetric and Newborn Care
SONUC: Comprehensive Emergency Obstetric and Newborn
Care
TFP: Technical and Financial Partners
TNCs: Transnational Corporations
UNAIDS: Joint United Nations Programme on HIV/AIDS
UNDESA: United Nations Department of Economic and Social
Affairs
UNCTAD: United Nations Conference on Trade and
Development
UNDP: United Nations Development Programme
UNESCO: United Nations Educational, Scientific, and Cultural
Organization
UNFCCC: United Nations Framework Convention on Climate
Change
UNICEF: United Nations Children’s Fund
UNITAID: International facility for the purchase of drugs against
HIV/AIDS, Malaria and Tuberculosis
UNSD: United Nations Statistics Division
UNSTAT: United Nations Statistics Division
VAM: Vulnerability Analysis and. Mapping
WB: World Bank
WFP: World Food Programme
WHO: World Health Organization
Burundi Milennium Development Goals – summary of report 2012 vii
viii
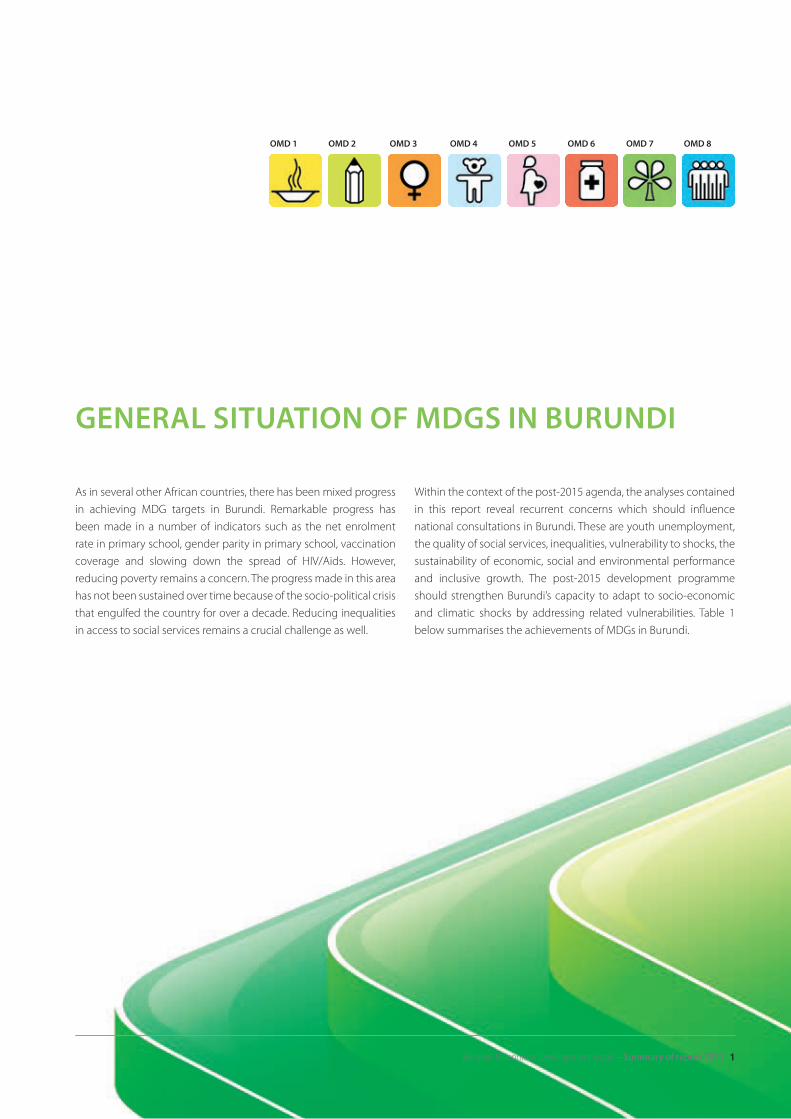
As in several other African countries, there has been mixed progress
in achieving MDG targets in Burundi. Remarkable progress has
been made in a number of indicators such as the net enrolment
rate in primary school, gender parity in primary school, vaccination
coverage and slowing down the spread of HIV/Aids. However,
reducing poverty remains a concern. The progress made in this area
has not been sustained over time because of the socio-political crisis
that engulfed the country for over a decade. Reducing inequalities
in access to social services remains a crucial challenge as well.
Within the context of the post-2015 agenda, the analyses contained
in this report reveal recurrent concerns which should influence
national consultations in Burundi. These are youth unemployment,
the quality of social services, inequalities, vulnerability to shocks, the
sustainability of economic, social and environmental performance
and inclusive growth. The post-2015 development programme
should strengthen Burundi’s capacity to adapt to socio-economic
and climatic shocks by addressing related vulnerabilities. Table 1
below summarises the achievements of MDGs in Burundi.
GeneRal situation oF MDGs in BuRunDi
oMD 1 oMD 2 oMD 3 oMD 4 oMD 5 oMD 6 oMD 7 oMD 8
Burundi Milennium Development Goals – summary of report 2012 1
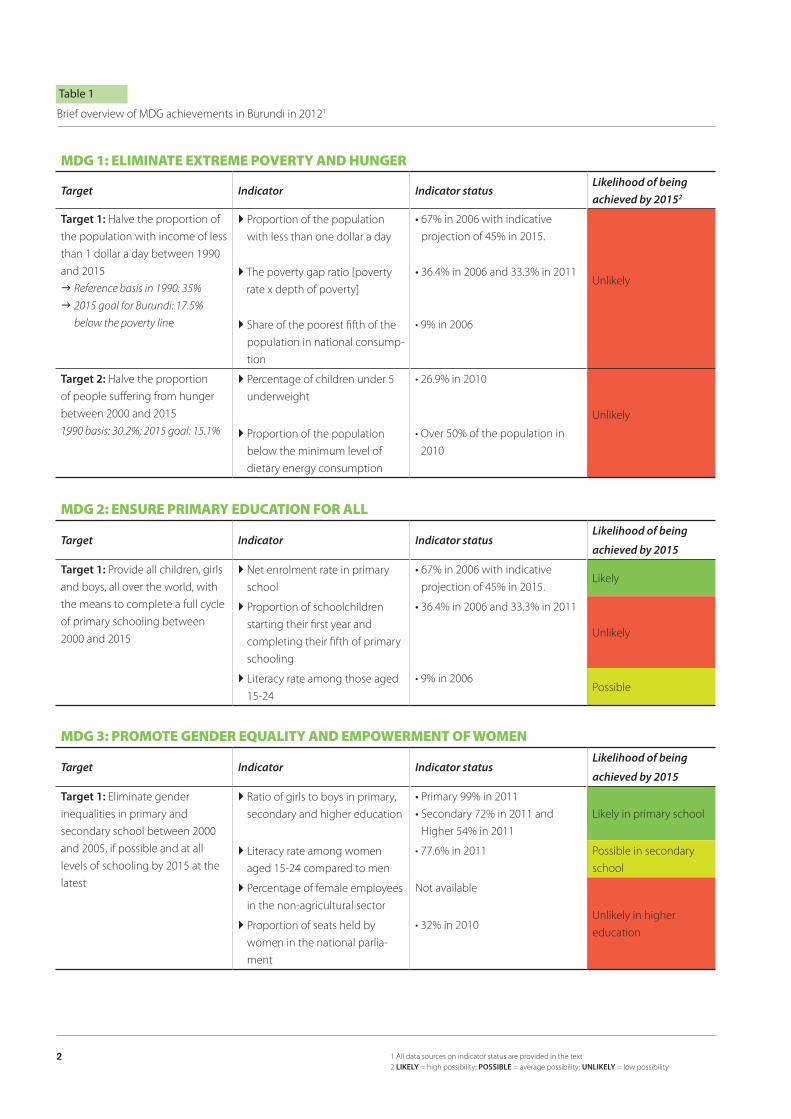
MDG 1: ELIMINATE EXTREME POVERTY AND HUNGER
Target Indicator Indicator statusLikelihood of being
achieved by 20152
target 1: Halve the proportion of
the population with income of less
than 1 dollar a day between 1990
and 2015
g Reference basis in 1990: 35%
g 2015 goal for Burundi: 17.5%
below the poverty line
} Proportion of the population
with less than one dollar a day
• 67% in 2006 with indicative
projection of 45% in 2015.
Unlikely} The poverty gap ratio [poverty
rate x depth of poverty]
• 36.4% in 2006 and 33.3% in 2011
} Share of the poorest fifth of the
population in national consump-
tion
• 9% in 2006
target 2: Halve the proportion
of people suffering from hunger
between 2000 and 2015
1990 basis: 30.2%; 2015 goal: 15.1%
} Percentage of children under 5
underweight
• 26.9% in 2010
Unlikely
} Proportion of the population
below the minimum level of
dietary energy consumption
• Over 50% of the population in
2010
MDG 2: ENSURE PRIMARY EDUCATION FOR ALL
Target Indicator Indicator statusLikelihood of being
achieved by 2015 target 1: Provide all children, girls
and boys, all over the world, with
the means to complete a full cycle
of primary schooling between
2000 and 2015
} Net enrolment rate in primary
school
• 67% in 2006 with indicative
projection of 45% in 2015.Likely
} Proportion of schoolchildren
starting their first year and
completing their fifth of primary
schooling
• 36.4% in 2006 and 33.3% in 2011
Unlikely
} Literacy rate among those aged
15-24
• 9% in 2006Possible
MDG 3: PROMOTE GENDER EQUALITY AND EMPOWERMENT OF WOMEN
Target Indicator Indicator statusLikelihood of being
achieved by 2015 target 1: Eliminate gender
inequalities in primary and
secondary school between 2000
and 2005, if possible and at all
levels of schooling by 2015 at the
latest
} Ratio of girls to boys in primary,
secondary and higher education
• Primary 99% in 2011
• Secondary 72% in 2011 and
Higher 54% in 2011
Likely in primary school
} Literacy rate among women
aged 15-24 compared to men
• 77.6% in 2011 Possible in secondary
school
} Percentage of female employees
in the non-agricultural sector
Not available
Unlikely in higher
education} Proportion of seats held by
women in the national parlia-
ment
• 32% in 2010
1 All data sources on indicator status are provided in the text2 liKelY = high possibility; possiBle = average possibility; unliKelY = low possibility
Table 1
Brief overview of MDG achievements in Burundi in 20121
2
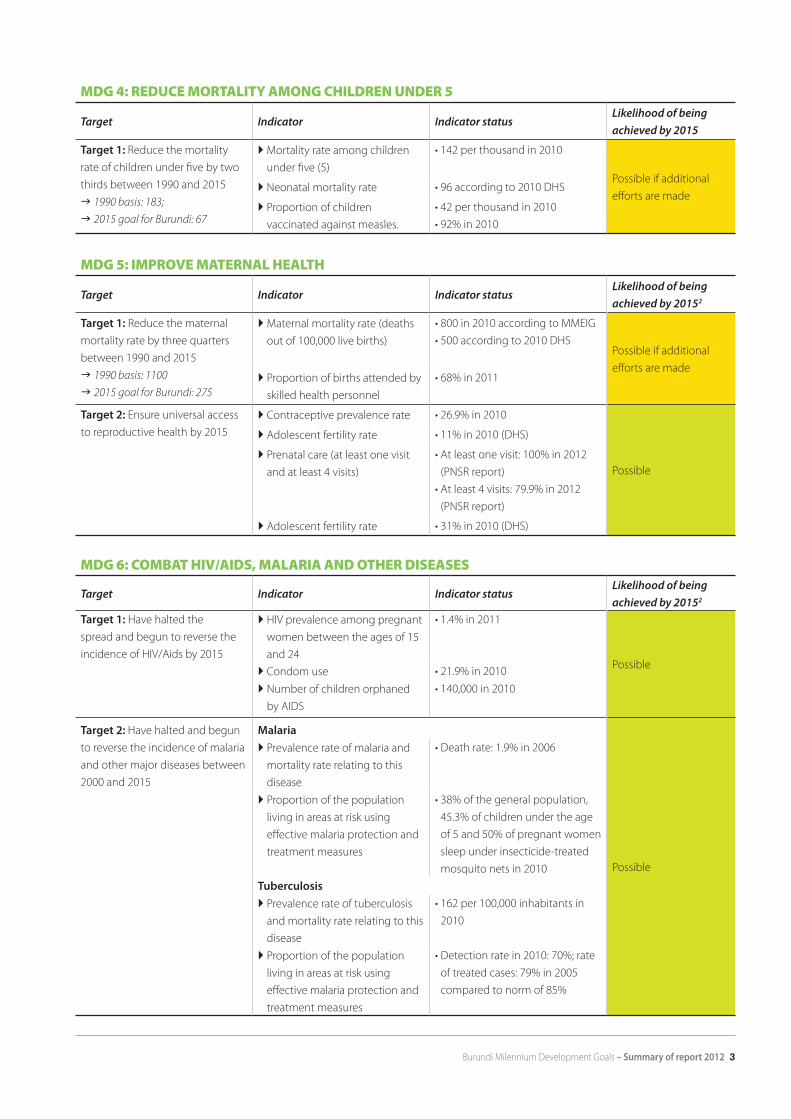
MDG 5: IMPROVE MATERNAL HEALTH
Target Indicator Indicator statusLikelihood of being
achieved by 20152
target 1: Reduce the maternal
mortality rate by three quarters
between 1990 and 2015
g 1990 basis: 1100
g 2015 goal for Burundi: 275
} Maternal mortality rate (deaths
out of 100,000 live births)
• 800 in 2010 according to MMEIG
• 500 according to 2010 DHSPossible if additional
efforts are made} Proportion of births attended by
skilled health personnel
• 68% in 2011
target 2: Ensure universal access
to reproductive health by 2015
} Contraceptive prevalence rate • 26.9% in 2010
Possible
} Adolescent fertility rate • 11% in 2010 (DHS)
} Prenatal care (at least one visit
and at least 4 visits)
• At least one visit: 100% in 2012
(PNSR report)
• At least 4 visits: 79.9% in 2012
(PNSR report)
} Adolescent fertility rate • 31% in 2010 (DHS)
MDG 6: COMBAT HIV/AIDS, MALARIA AND OTHER DISEASES
Target Indicator Indicator statusLikelihood of being
achieved by 20152
target 1: Have halted the
spread and begun to reverse the
incidence of HIV/Aids by 2015
} HIV prevalence among pregnant
women between the ages of 15
and 24
• 1.4% in 2011
Possible} Condom use • 21.9% in 2010
} Number of children orphaned
by AIDS
• 140,000 in 2010
target 2: Have halted and begun
to reverse the incidence of malaria
and other major diseases between
2000 and 2015
Malaria
Possible
} Prevalence rate of malaria and
mortality rate relating to this
disease
• Death rate: 1.9% in 2006
} Proportion of the population
living in areas at risk using
effective malaria protection and
treatment measures
• 38% of the general population,
45.3% of children under the age
of 5 and 50% of pregnant women
sleep under insecticide-treated
mosquito nets in 2010
tuberculosis} Prevalence rate of tuberculosis
and mortality rate relating to this
disease
• 162 per 100,000 inhabitants in
2010
} Proportion of the population
living in areas at risk using
effective malaria protection and
treatment measures
• Detection rate in 2010: 70%; rate
of treated cases: 79% in 2005
compared to norm of 85%
MDG 4: REDUCE MORTALITY AMONG CHILDREN UNDER 5
Target Indicator Indicator statusLikelihood of being
achieved by 2015
target 1: Reduce the mortality
rate of children under five by two
thirds between 1990 and 2015
g 1990 basis: 183;
g 2015 goal for Burundi: 67
} Mortality rate among children
under five (5)
• 142 per thousand in 2010
Possible if additional
efforts are made} Neonatal mortality rate • 96 according to 2010 DHS
} Proportion of children
vaccinated against measles.
• 42 per thousand in 2010
• 92% in 2010
Burundi Milennium Development Goals – summary of report 2012 3
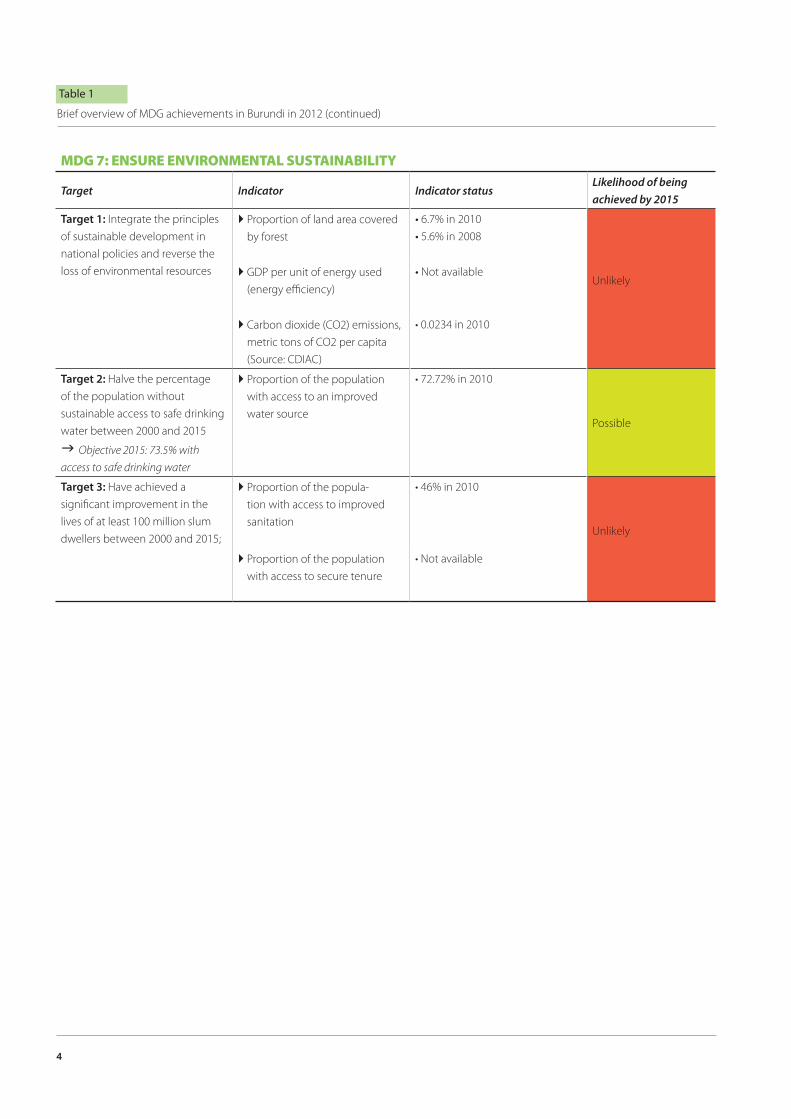
MDG 7: ENSURE ENVIRONMENTAL SUSTAINABILITY
Target Indicator Indicator statusLikelihood of being
achieved by 2015
target 1: Integrate the principles
of sustainable development in
national policies and reverse the
loss of environmental resources
} Proportion of land area covered
by forest
• 6.7% in 2010
• 5.6% in 2008
Unlikely} GDP per unit of energy used
(energy efficiency)
• Not available
} Carbon dioxide (CO2) emissions,
metric tons of CO2 per capita
(Source: CDIAC)
• 0.0234 in 2010
target 2: Halve the percentage
of the population without
sustainable access to safe drinking
water between 2000 and 2015
g Objective 2015: 73.5% with
access to safe drinking water
} Proportion of the population
with access to an improved
water source
• 72.72% in 2010
Possible
target 3: Have achieved a
significant improvement in the
lives of at least 100 million slum
dwellers between 2000 and 2015;
} Proportion of the popula-
tion with access to improved
sanitation
• 46% in 2010
Unlikely
} Proportion of the population
with access to secure tenure
• Not available
Table 1
Brief overview of MDG achievements in Burundi in 2012 (continued)
4
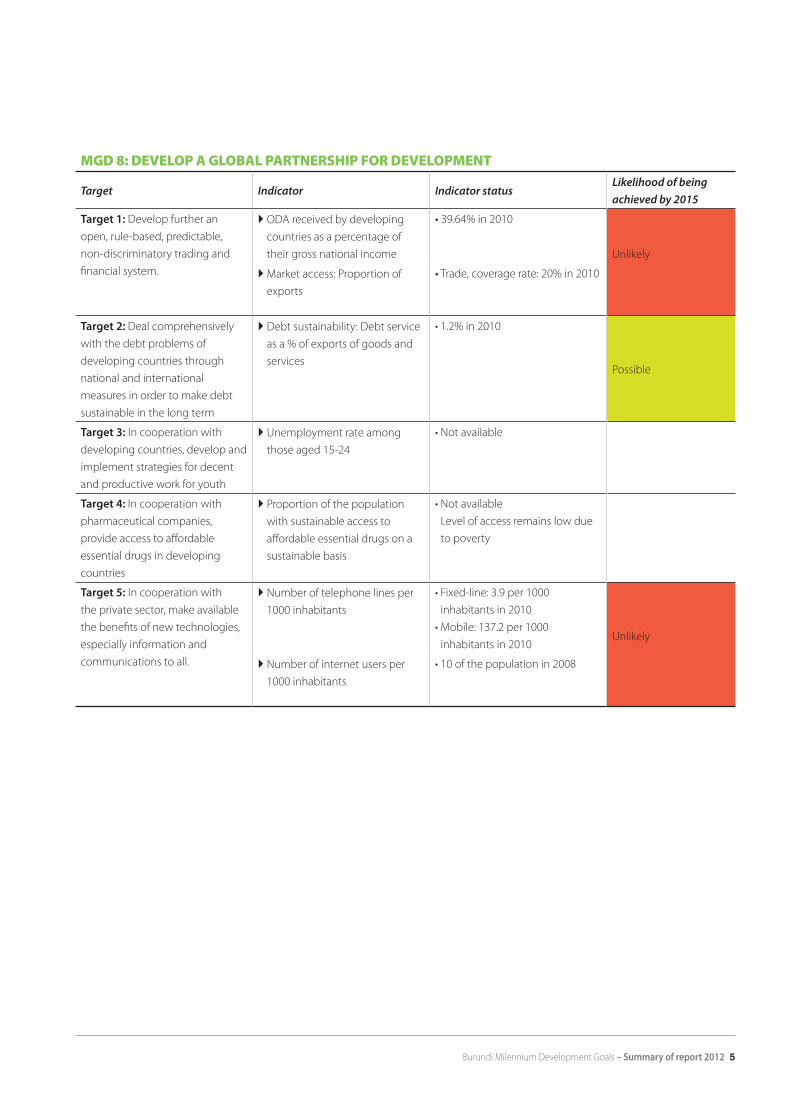
MGD 8: DEVELOP A GLOBAL PARTNERSHIP FOR DEVELOPMENT
Target Indicator Indicator statusLikelihood of being
achieved by 2015
target 1: Develop further an
open, rule-based, predictable,
non-discriminatory trading and
financial system.
} ODA received by developing
countries as a percentage of
their gross national income
• 39.64% in 2010
Unlikely
} Market access: Proportion of
exports
• Trade, coverage rate: 20% in 2010
target 2: Deal comprehensively
with the debt problems of
developing countries through
national and international
measures in order to make debt
sustainable in the long term
} Debt sustainability: Debt service
as a % of exports of goods and
services
• 1.2% in 2010
Possible
target 3: In cooperation with
developing countries, develop and
implement strategies for decent
and productive work for youth
} Unemployment rate among
those aged 15-24
• Not available
target 4: In cooperation with
pharmaceutical companies,
provide access to affordable
essential drugs in developing
countries
} Proportion of the population
with sustainable access to
affordable essential drugs on a
sustainable basis
• Not available
Level of access remains low due
to poverty
target 5: In cooperation with
the private sector, make available
the benefits of new technologies,
especially information and
communications to all.
} Number of telephone lines per
1000 inhabitants
• Fixed-line: 3.9 per 1000
inhabitants in 2010
• Mobile: 137.2 per 1000
inhabitants in 2010Unlikely
} Number of internet users per
1000 inhabitants
• 10 of the population in 2008
Burundi Milennium Development Goals – summary of report 2012 5

eliMinate eXtReMe poveRtY anD HunGeRChapter 1
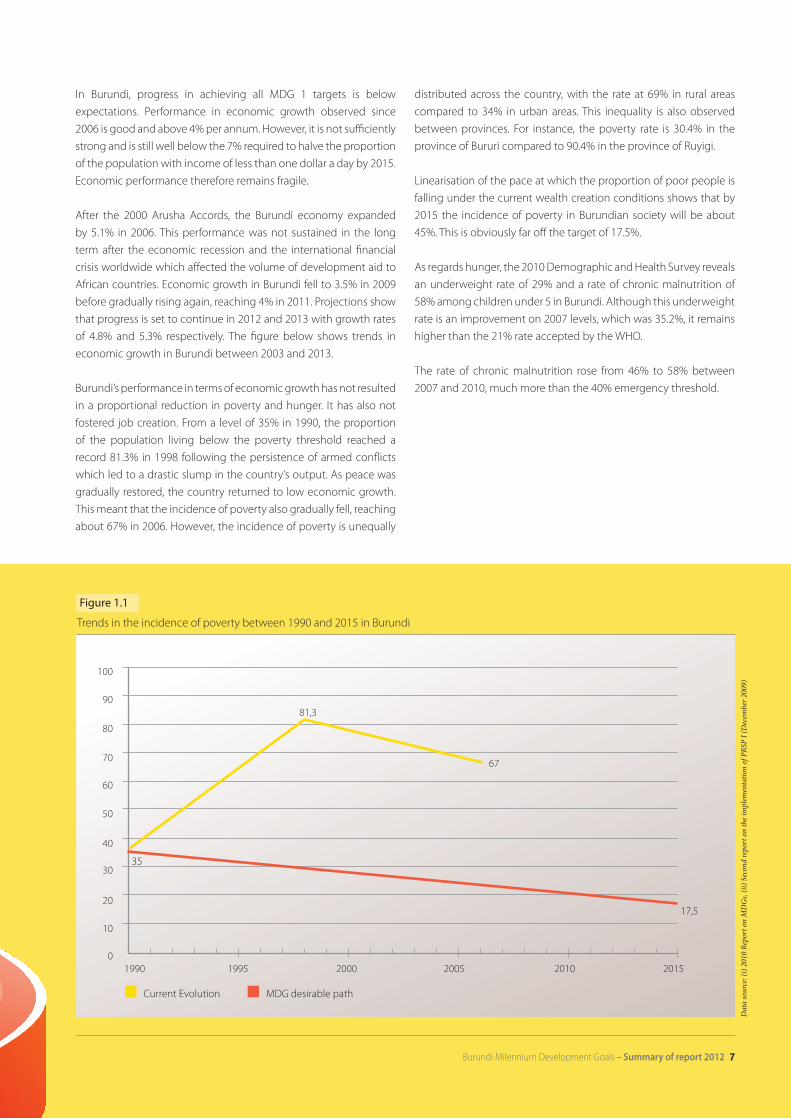
In Burundi, progress in achieving all MDG 1 targets is below
expectations. Performance in economic growth observed since
2006 is good and above 4% per annum. However, it is not sufficiently
strong and is still well below the 7% required to halve the proportion
of the population with income of less than one dollar a day by 2015.
Economic performance therefore remains fragile.
After the 2000 Arusha Accords, the Burundi economy expanded
by 5.1% in 2006. This performance was not sustained in the long
term after the economic recession and the international financial
crisis worldwide which affected the volume of development aid to
African countries. Economic growth in Burundi fell to 3.5% in 2009
before gradually rising again, reaching 4% in 2011. Projections show
that progress is set to continue in 2012 and 2013 with growth rates
of 4.8% and 5.3% respectively. The figure below shows trends in
economic growth in Burundi between 2003 and 2013.
Burundi’s performance in terms of economic growth has not resulted
in a proportional reduction in poverty and hunger. It has also not
fostered job creation. From a level of 35% in 1990, the proportion
of the population living below the poverty threshold reached a
record 81.3% in 1998 following the persistence of armed conflicts
which led to a drastic slump in the country’s output. As peace was
gradually restored, the country returned to low economic growth.
This meant that the incidence of poverty also gradually fell, reaching
about 67% in 2006. However, the incidence of poverty is unequally
distributed across the country, with the rate at 69% in rural areas
compared to 34% in urban areas. This inequality is also observed
between provinces. For instance, the poverty rate is 30.4% in the
province of Bururi compared to 90.4% in the province of Ruyigi.
Linearisation of the pace at which the proportion of poor people is
falling under the current wealth creation conditions shows that by
2015 the incidence of poverty in Burundian society will be about
45%. This is obviously far off the target of 17.5%.
As regards hunger, the 2010 Demographic and Health Survey reveals
an underweight rate of 29% and a rate of chronic malnutrition of
58% among children under 5 in Burundi. Although this underweight
rate is an improvement on 2007 levels, which was 35.2%, it remains
higher than the 21% rate accepted by the WHO.
The rate of chronic malnutrition rose from 46% to 58% between
2007 and 2010, much more than the 40% emergency threshold.
Dat
a so
urce
: (i)
2010
Rep
ort o
n M
DG
s, (ii
) Sec
ond
repo
rt o
n th
e im
plem
enta
tion
of P
RSP
I (D
ecem
ber 2
009)
Figure 1.1
Trends in the incidence of poverty between 1990 and 2015 in Burundi
1990 1995 2000 2005 2010 2015
100
90
80
70
60
50
40
30
20
10
0
Current Evolution MDG desirable path
35
67
17,5
81,3
Burundi Milennium Development Goals – summary of report 2012 7
ensuRe pRiMaRY eDuCation FoR allChapter 2
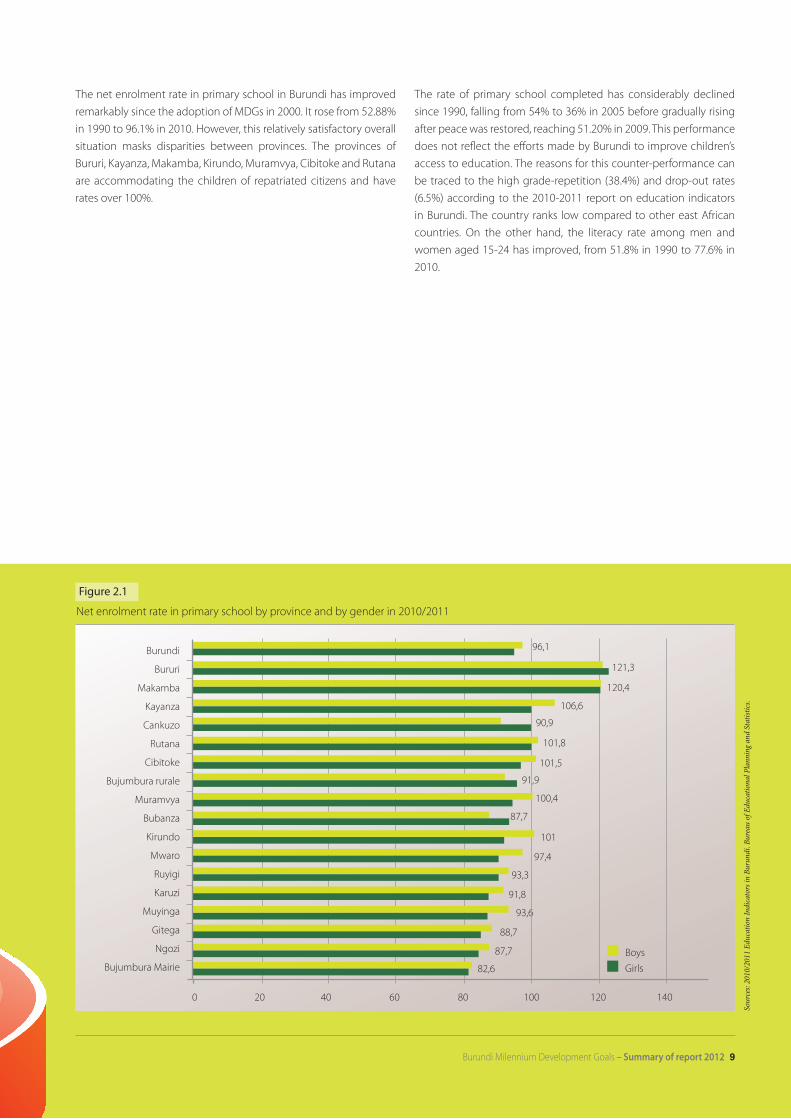
The net enrolment rate in primary school in Burundi has improved
remarkably since the adoption of MDGs in 2000. It rose from 52.88%
in 1990 to 96.1% in 2010. However, this relatively satisfactory overall
situation masks disparities between provinces. The provinces of
Bururi, Kayanza, Makamba, Kirundo, Muramvya, Cibitoke and Rutana
are accommodating the children of repatriated citizens and have
rates over 100%.
The rate of primary school completed has considerably declined
since 1990, falling from 54% to 36% in 2005 before gradually rising
after peace was restored, reaching 51.20% in 2009. This performance
does not reflect the efforts made by Burundi to improve children’s
access to education. The reasons for this counter-performance can
be traced to the high grade-repetition (38.4%) and drop-out rates
(6.5%) according to the 2010-2011 report on education indicators
in Burundi. The country ranks low compared to other east African
countries. On the other hand, the literacy rate among men and
women aged 15-24 has improved, from 51.8% in 1990 to 77.6% in
2010.
Sour
ces:
2010
/201
1 Ed
ucat
ion
Indi
cato
rs in
Bur
undi
. Bur
eau
of E
duca
tiona
l Pla
nnin
g an
d St
atist
ics.
Figure 2.1
Net enrolment rate in primary school by province and by gender in 2010/2011
Burundi
Bururi
Makamba
Kayanza
Cankuzo
Rutana
Cibitoke
Bujumbura rurale
Muramvya
Bubanza
Kirundo
Mwaro
Ruyigi
Karuzi
Muyinga
Gitega
Ngozi
Bujumbura Mairie
0 20 40 60
96,1
121,3
120,4
90,9
101,8
101,5
91,9
100,4
87,7
101
97,4
93,3
91,8
93,6
88,7
87,7
82,6
106,6
80 100 120 140
Boys
Girls
Burundi Milennium Development Goals – summary of report 2012 9
pRoMote GenDeR eQualitY anD eMpoweRMent oF woMen
Chapter 3
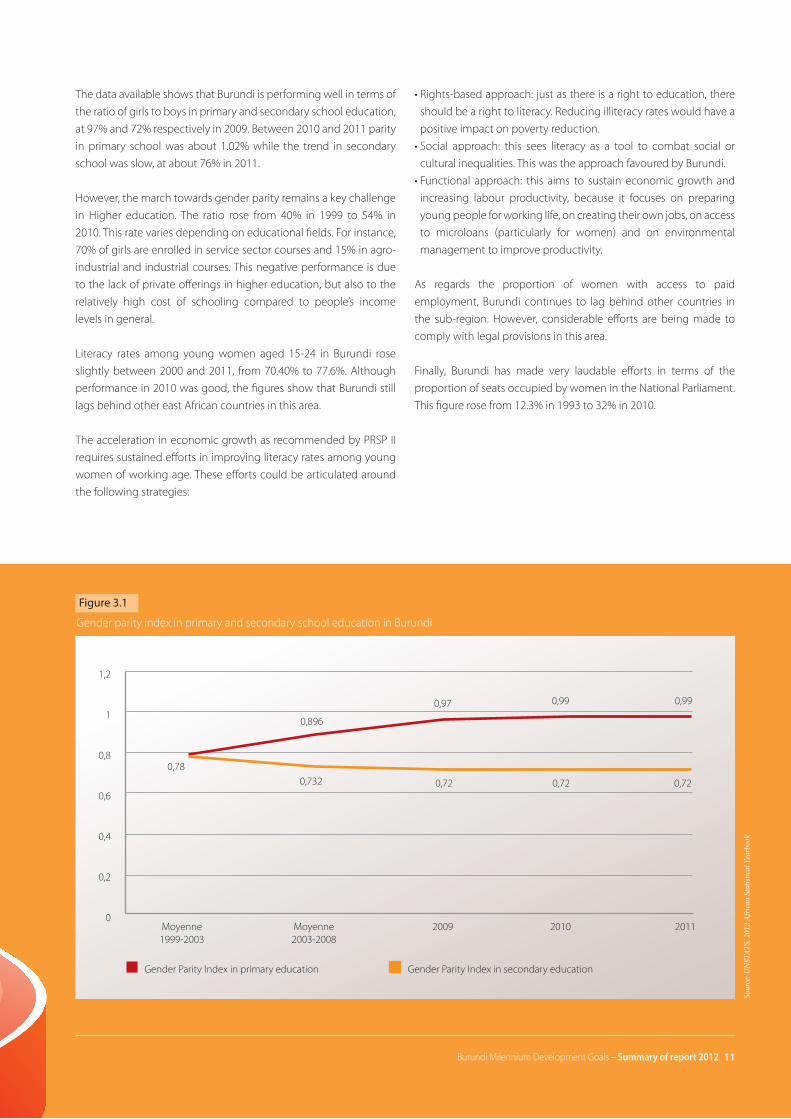
The data available shows that Burundi is performing well in terms of
the ratio of girls to boys in primary and secondary school education,
at 97% and 72% respectively in 2009. Between 2010 and 2011 parity
in primary school was about 1.02% while the trend in secondary
school was slow, at about 76% in 2011.
However, the march towards gender parity remains a key challenge
in Higher education. The ratio rose from 40% in 1999 to 54% in
2010. This rate varies depending on educational fields. For instance,
70% of girls are enrolled in service sector courses and 15% in agro-
industrial and industrial courses. This negative performance is due
to the lack of private offerings in higher education, but also to the
relatively high cost of schooling compared to people’s income
levels in general.
Literacy rates among young women aged 15-24 in Burundi rose
slightly between 2000 and 2011, from 70.40% to 77.6%. Although
performance in 2010 was good, the figures show that Burundi still
lags behind other east African countries in this area.
The acceleration in economic growth as recommended by PRSP II
requires sustained efforts in improving literacy rates among young
women of working age. These efforts could be articulated around
the following strategies:
• Rights-based approach: just as there is a right to education, there
should be a right to literacy. Reducing illiteracy rates would have a
positive impact on poverty reduction.
• Social approach: this sees literacy as a tool to combat social or
cultural inequalities. This was the approach favoured by Burundi.
• Functional approach: this aims to sustain economic growth and
increasing labour productivity, because it focuses on preparing
young people for working life, on creating their own jobs, on access
to microloans (particularly for women) and on environmental
management to improve productivity.
As regards the proportion of women with access to paid
employment, Burundi continues to lag behind other countries in
the sub-region. However, considerable efforts are being made to
comply with legal provisions in this area.
Finally, Burundi has made very laudable efforts in terms of the
proportion of seats occupied by women in the National Parliament.
This figure rose from 12.3% in 1993 to 32% in 2010.
Sour
ce: U
NST
ATS,
201
2 Af
rica
n St
atist
ical
Yea
rboo
k
Figure 3.1
Gender parity index in primary and secondary school education in Burundi
1,2
1
0,8
0,6
0,4
0,2
0Moyenne1999-2003
0,78
0,896
0,732
0,97
0,72 0,72 0,72
0,99 0,99
Moyenne2003-2008
2009 2010 2011
Gender Parity Index in primary education Gender Parity Index in secondary education
Burundi Milennium Development Goals – summary of report 2012 11
ReDuCe MoRtalitY aMonG CHilDRen unDeR 5
Chapter 4
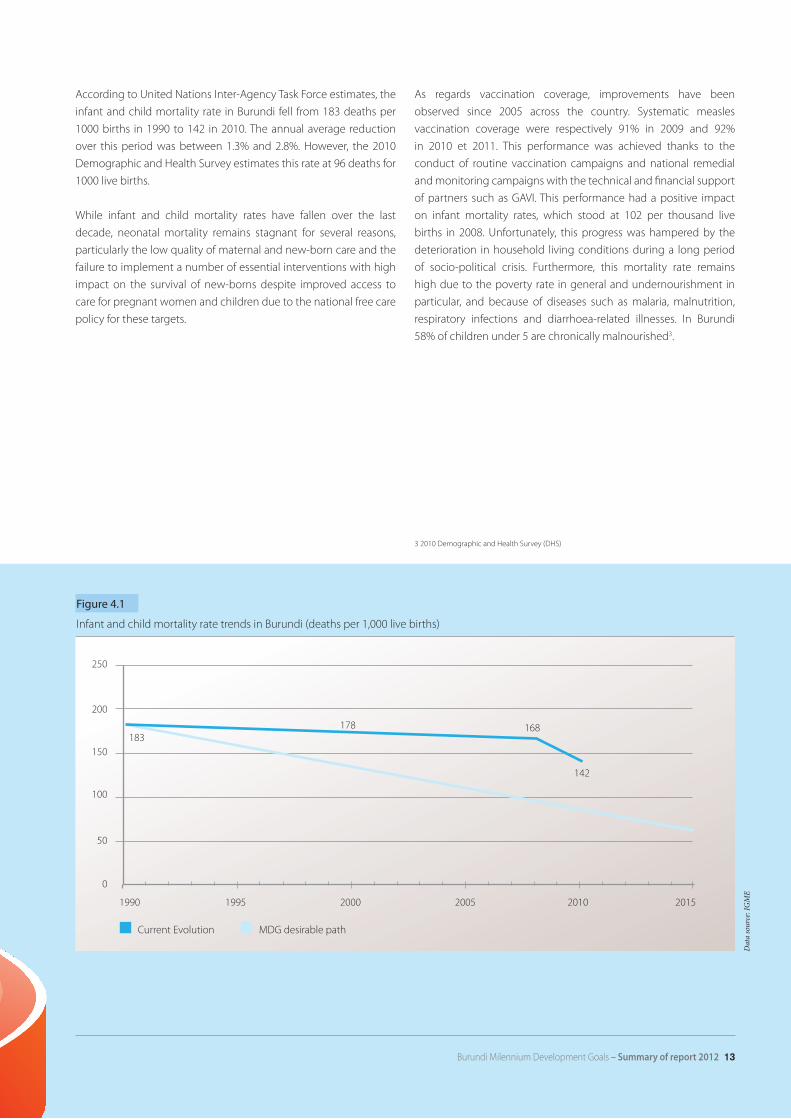
According to United Nations Inter-Agency Task Force estimates, the
infant and child mortality rate in Burundi fell from 183 deaths per
1000 births in 1990 to 142 in 2010. The annual average reduction
over this period was between 1.3% and 2.8%. However, the 2010
Demographic and Health Survey estimates this rate at 96 deaths for
1000 live births.
While infant and child mortality rates have fallen over the last
decade, neonatal mortality remains stagnant for several reasons,
particularly the low quality of maternal and new-born care and the
failure to implement a number of essential interventions with high
impact on the survival of new-borns despite improved access to
care for pregnant women and children due to the national free care
policy for these targets.
As regards vaccination coverage, improvements have been
observed since 2005 across the country. Systematic measles
vaccination coverage were respectively 91% in 2009 and 92%
in 2010 et 2011. This performance was achieved thanks to the
conduct of routine vaccination campaigns and national remedial
and monitoring campaigns with the technical and financial support
of partners such as GAVI. This performance had a positive impact
on infant mortality rates, which stood at 102 per thousand live
births in 2008. Unfortunately, this progress was hampered by the
deterioration in household living conditions during a long period
of socio-political crisis. Furthermore, this mortality rate remains
high due to the poverty rate in general and undernourishment in
particular, and because of diseases such as malaria, malnutrition,
respiratory infections and diarrhoea-related illnesses. In Burundi
58% of children under 5 are chronically malnourished3.
Dat
a so
urce
: IG
ME
Figure 4.1
Infant and child mortality rate trends in Burundi (deaths per 1,000 live births)
3 2010 Demographic and Health Survey (DHS)
1990 1995 2000 2005 2010 2015
250
200
150
100
50
142
183168178
0
MDG desirable pathCurrent Evolution
Burundi Milennium Development Goals – summary of report 2012 13
iMpRove MateRnal HealtHChapter 5
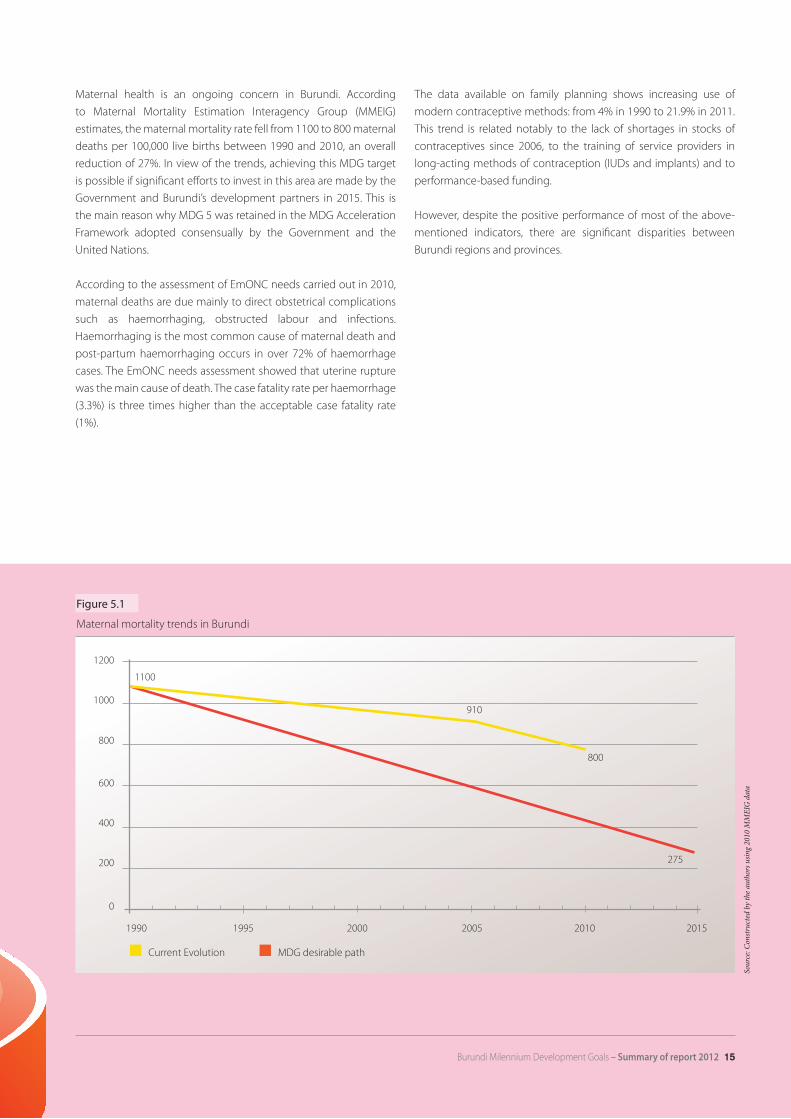
Maternal health is an ongoing concern in Burundi. According
to Maternal Mortality Estimation Interagency Group (MMEIG)
estimates, the maternal mortality rate fell from 1100 to 800 maternal
deaths per 100,000 live births between 1990 and 2010, an overall
reduction of 27%. In view of the trends, achieving this MDG target
is possible if significant efforts to invest in this area are made by the
Government and Burundi’s development partners in 2015. This is
the main reason why MDG 5 was retained in the MDG Acceleration
Framework adopted consensually by the Government and the
United Nations.
According to the assessment of EmONC needs carried out in 2010,
maternal deaths are due mainly to direct obstetrical complications
such as haemorrhaging, obstructed labour and infections.
Haemorrhaging is the most common cause of maternal death and
post-partum haemorrhaging occurs in over 72% of haemorrhage
cases. The EmONC needs assessment showed that uterine rupture
was the main cause of death. The case fatality rate per haemorrhage
(3.3%) is three times higher than the acceptable case fatality rate
(1%).
The data available on family planning shows increasing use of
modern contraceptive methods: from 4% in 1990 to 21.9% in 2011.
This trend is related notably to the lack of shortages in stocks of
contraceptives since 2006, to the training of service providers in
long-acting methods of contraception (IUDs and implants) and to
performance-based funding.
However, despite the positive performance of most of the above-
mentioned indicators, there are significant disparities between
Burundi regions and provinces.
Figure 5.1
Maternal mortality trends in Burundi
1990 1995 2000 2005 2010 2015
1200
1000
800
600
400
200
0
1100
910
800
275
Current Evolution MDG desirable path
Sour
ce: C
onstr
ucte
d by
the a
utho
rs u
sing
2010
MM
EIG
dat
a
Burundi Milennium Development Goals – summary of report 2012 15
CoMBat Hiv/aiDs, MalaRia anD otHeR Diseases
Chapter 6
Rapport sur les Objectifs du Millénaire pour le Développement au Burundi – édition 2012 17
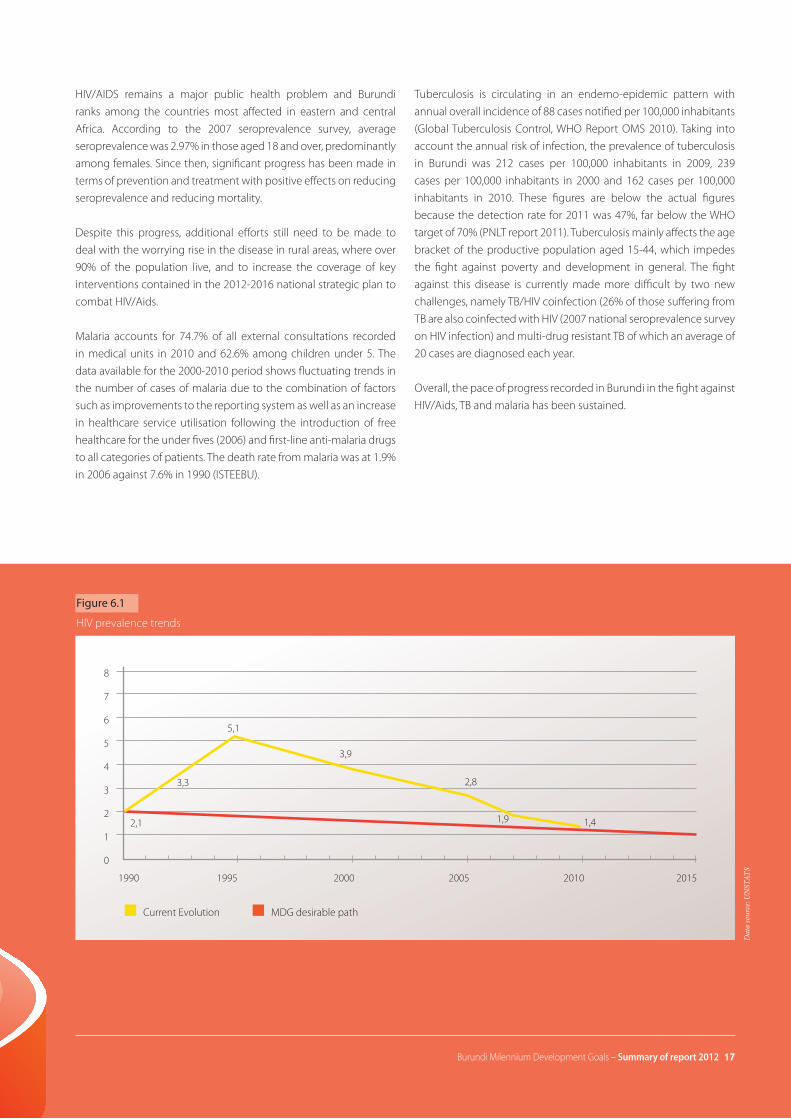
HIV/AIDS remains a major public health problem and Burundi
ranks among the countries most affected in eastern and central
Africa. According to the 2007 seroprevalence survey, average
seroprevalence was 2.97% in those aged 18 and over, predominantly
among females. Since then, significant progress has been made in
terms of prevention and treatment with positive effects on reducing
seroprevalence and reducing mortality.
Despite this progress, additional efforts still need to be made to
deal with the worrying rise in the disease in rural areas, where over
90% of the population live, and to increase the coverage of key
interventions contained in the 2012-2016 national strategic plan to
combat HIV/Aids.
Malaria accounts for 74.7% of all external consultations recorded
in medical units in 2010 and 62.6% among children under 5. The
data available for the 2000-2010 period shows fluctuating trends in
the number of cases of malaria due to the combination of factors
such as improvements to the reporting system as well as an increase
in healthcare service utilisation following the introduction of free
healthcare for the under fives (2006) and first-line anti-malaria drugs
to all categories of patients. The death rate from malaria was at 1.9%
in 2006 against 7.6% in 1990 (ISTEEBU).
Tuberculosis is circulating in an endemo-epidemic pattern with
annual overall incidence of 88 cases notified per 100,000 inhabitants
(Global Tuberculosis Control, WHO Report OMS 2010). Taking into
account the annual risk of infection, the prevalence of tuberculosis
in Burundi was 212 cases per 100,000 inhabitants in 2009, 239
cases per 100,000 inhabitants in 2000 and 162 cases per 100,000
inhabitants in 2010. These figures are below the actual figures
because the detection rate for 2011 was 47%, far below the WHO
target of 70% (PNLT report 2011). Tuberculosis mainly affects the age
bracket of the productive population aged 15-44, which impedes
the fight against poverty and development in general. The fight
against this disease is currently made more difficult by two new
challenges, namely TB/HIV coinfection (26% of those suffering from
TB are also coinfected with HIV (2007 national seroprevalence survey
on HIV infection) and multi-drug resistant TB of which an average of
20 cases are diagnosed each year.
Overall, the pace of progress recorded in Burundi in the fight against
HIV/Aids, TB and malaria has been sustained.
Dat
a so
urce
: UN
STAT
S
Figure 6.1
HIV prevalence trends
1990 1995 2000 2005 2010 2015
8
7
6
5
4
3
2
1
0
2,1
3,3
5,1
3,9
2,8
1,41,9
Current Evolution MDG desirable path
Burundi Milennium Development Goals – summary of report 2012 17

ensuRe enviRonMental sustainaBilitY Chapter 7
The decisive role of the environment in achieving the other MDGs
requires that Burundi incorporate sustainable environmental
regulations in its policies and programmes. Therefore, the public
authorities must devote a significant proportion of the national
budget on environmental preservation instead of continually
expecting external funding. In addition, it is important that national
and sub-regional environmental preservation programmes also
include measures to promote the creation of green jobs for young
people.
Reducing poverty and achieving sustainable development must go
hand in hand with a healthy planet. The Millennium Development
Goals recognise that environmental preservation is an integral
part of global prosperity and social well-being. Failure to preserve
biodiversity for example, would compromise socio-economic
development efforts. The anarchic exploitation of natural resources
such as forests, soil, water and fish (often by a minority of the most
powerful) has caused much devastating damage to nature over the
last few decades, affecting the most vulnerable populations.
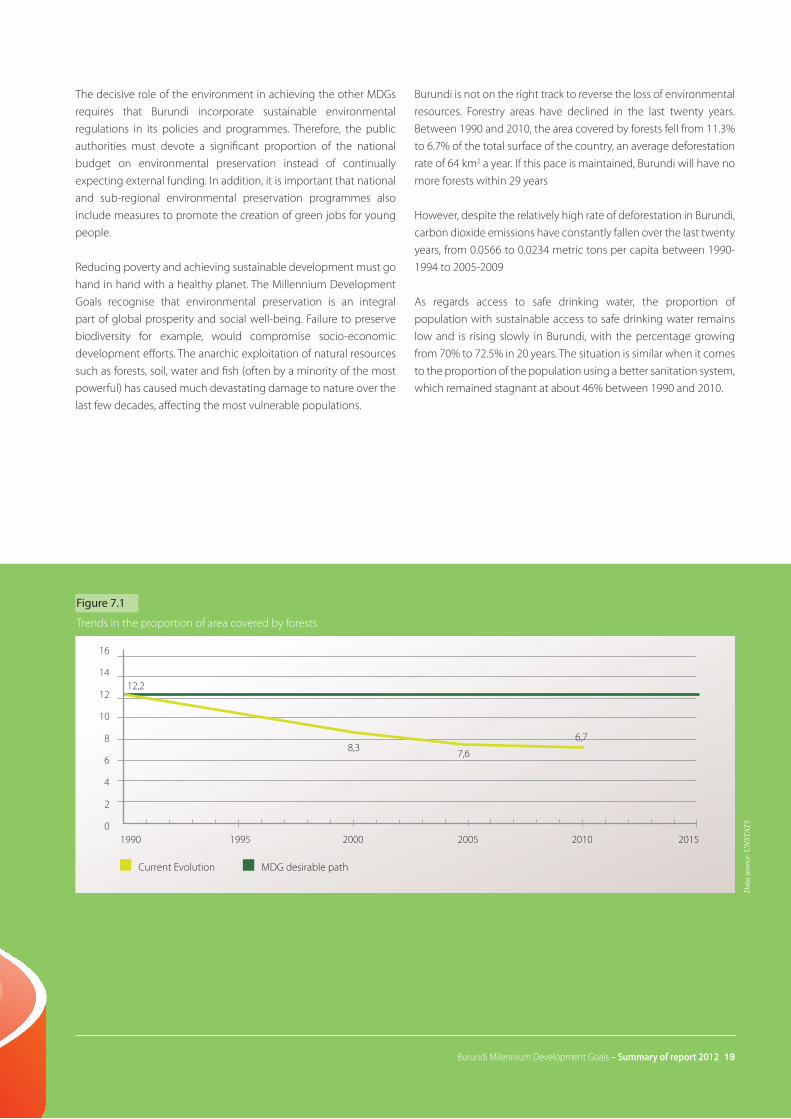
Burundi is not on the right track to reverse the loss of environmental
resources. Forestry areas have declined in the last twenty years.
Between 1990 and 2010, the area covered by forests fell from 11.3%
to 6.7% of the total surface of the country, an average deforestation
rate of 64 km2 a year. If this pace is maintained, Burundi will have no
more forests within 29 years
However, despite the relatively high rate of deforestation in Burundi,
carbon dioxide emissions have constantly fallen over the last twenty
years, from 0.0566 to 0.0234 metric tons per capita between 1990-
1994 to 2005-2009
As regards access to safe drinking water, the proportion of
population with sustainable access to safe drinking water remains
low and is rising slowly in Burundi, with the percentage growing
from 70% to 72.5% in 20 years. The situation is similar when it comes
to the proportion of the population using a better sanitation system,
which remained stagnant at about 46% between 1990 and 2010.
Dat
a so
urce
: UN
STAT
S
Figure 7.1
Trends in the proportion of area covered by forests
1990 1995 2000 2005 2010 2015
16
14
12
10
8
6
4
2
0
12,2
8,3 7,6
6,7
Current Evolution MDG desirable path
Burundi Milennium Development Goals – summary of report 2012 19
Develop a GloBal paRtneRsHip FoR DevelopMent
Chapter 8
The mobilisation of internal funds, essentially through fiscal
efforts and national borrowing, is far from sufficient in view of the
development funding needs of Africa in general and Burundi in
particular. A number of reasons have been put forward to explain
this situation. These include the low tax burden, low savings
and mobilisation arrangements. This is why the MDGs advocate
strengthening the global development partnership based on
an open international commercial and financial system and on
prioritising the specific needs of the least advanced countries
and island developing states. The point is to increase aid and
improve its effectiveness through efficient use and targeting of the
most vulnerable; taking measures to ensure the long-term debt
sustainability and facilitating access to global markets for products.
The partnership envisaged also proposes international cooperation
in favour of poorer countries to promote decent jobs for young
people, the availability of affordable essential drugs and access to
new technologies, particularly information and communication
technologies.
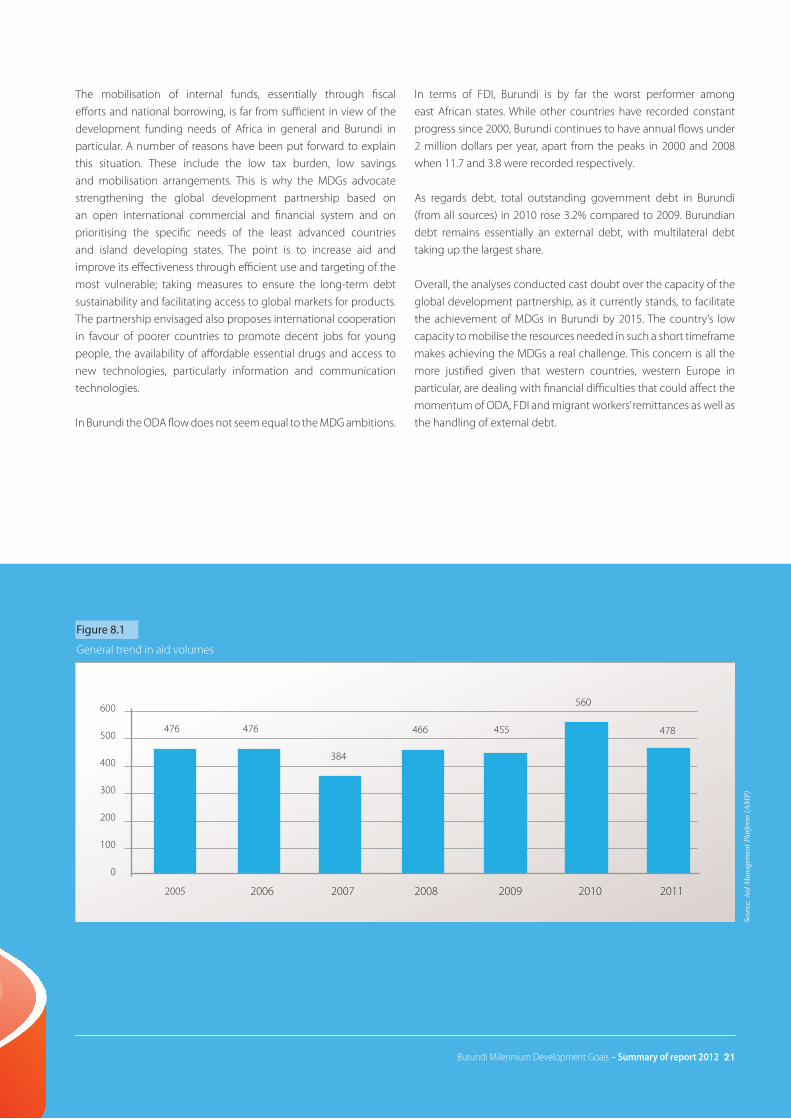
In Burundi the ODA flow does not seem equal to the MDG ambitions.
In terms of FDI, Burundi is by far the worst performer among
east African states. While other countries have recorded constant
progress since 2000, Burundi continues to have annual flows under
2 million dollars per year, apart from the peaks in 2000 and 2008
when 11.7 and 3.8 were recorded respectively.
As regards debt, total outstanding government debt in Burundi
(from all sources) in 2010 rose 3.2% compared to 2009. Burundian
debt remains essentially an external debt, with multilateral debt
taking up the largest share.
Overall, the analyses conducted cast doubt over the capacity of the
global development partnership, as it currently stands, to facilitate
the achievement of MDGs in Burundi by 2015. The country’s low
capacity to mobilise the resources needed in such a short timeframe
makes achieving the MDGs a real challenge. This concern is all the
more justified given that western countries, western Europe in
particular, are dealing with financial difficulties that could affect the
momentum of ODA, FDI and migrant workers’ remittances as well as
the handling of external debt.
Sour
ce: A
id M
anag
emen
t Pla
tform
(AM
P)
Figure 8.1
General trend in aid volumes
600
500
400
300
200
100
0
2005 2006 2007 2008 2009 2010 2011
476 476
384
466 455
560
478
Burundi Milennium Development Goals – summary of report 2012 21
United Nations system in BurundiBNUB CompoundChaussée d’UviraP.O. Box 1490, Bujumbura, BurundiWebsites : www.bi.one.un.orgwww.bi.undp.org
Ministry of Finance and Economic Development PlanningAvenue de l’Indépendance no.1P.O. Box 224, Bujumbura, Burundi
Tous Unis dans l’Action
BURUNDI