Embed Size (px)
Citation preview
Burnaby Board of EducationBudget PresentationApril 28, 2015
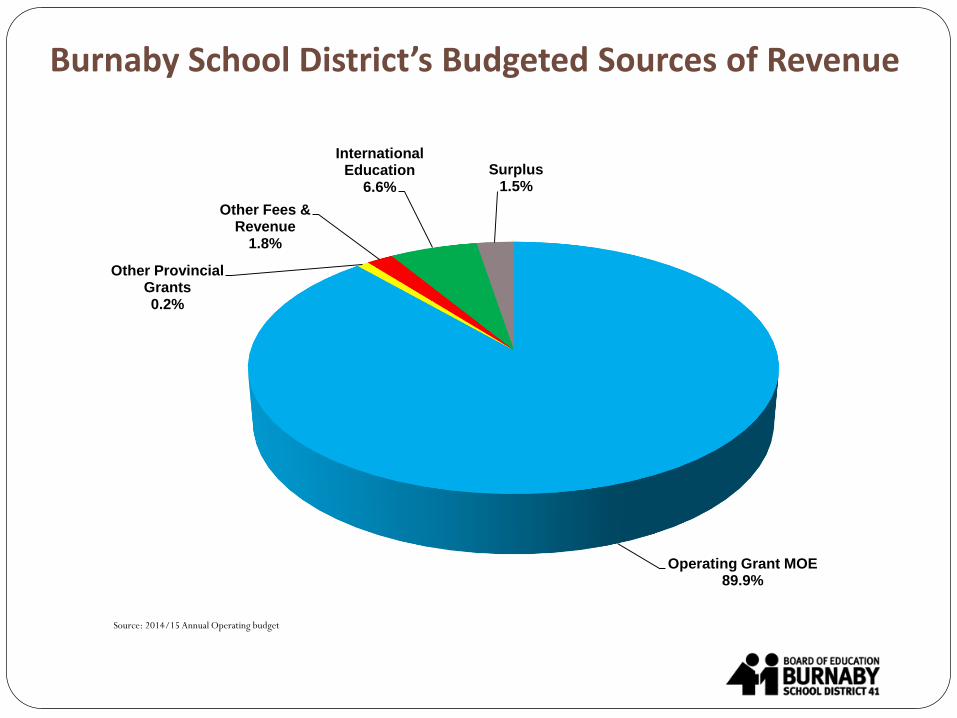
Burnaby School District’s Budgeted Sources of Revenue
Source: 2014/15 Annual Operating budget
Operating Grant MOE89.9%
Other Provincial Grants0.2%
Other Fees & Revenue
1.8%
International Education
6.6%
Surplus1.5%
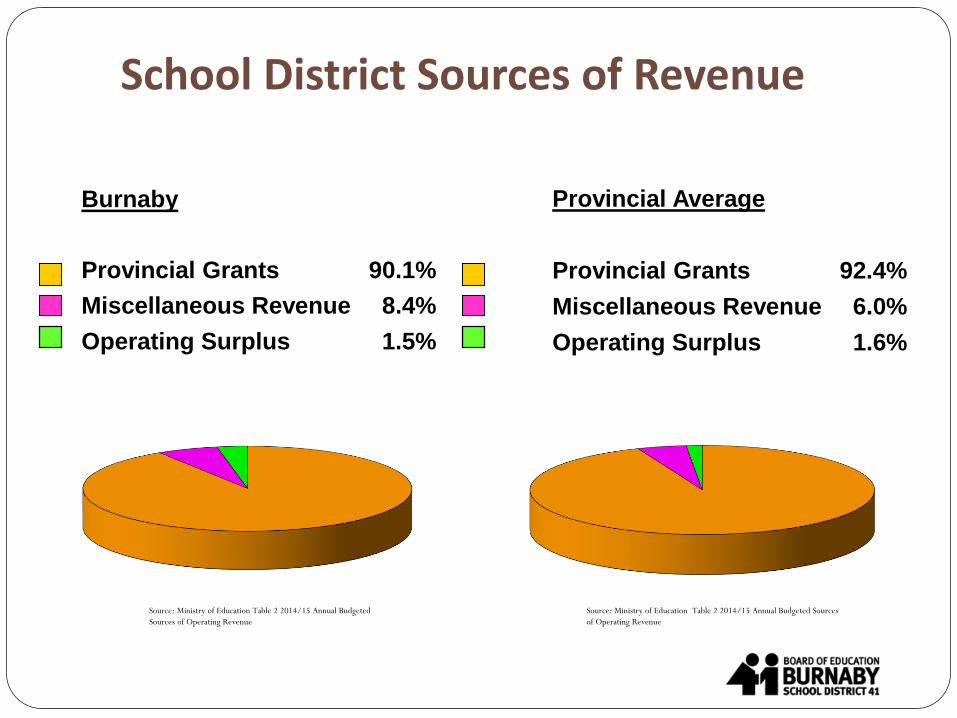
Burnaby
Provincial Grants 90.1%
Miscellaneous Revenue 8.4%
Operating Surplus 1.5%
School District Sources of Revenue
Provincial Average
Provincial Grants 92.4%
Miscellaneous Revenue 6.0%
Operating Surplus 1.6%
Source: Ministry of Education Table 2 2014/15 Annual Budgeted Sources
of Operating Revenue
Source: Ministry of Education Table 2 2014/15 Annual Budgeted
Sources of Operating Revenue
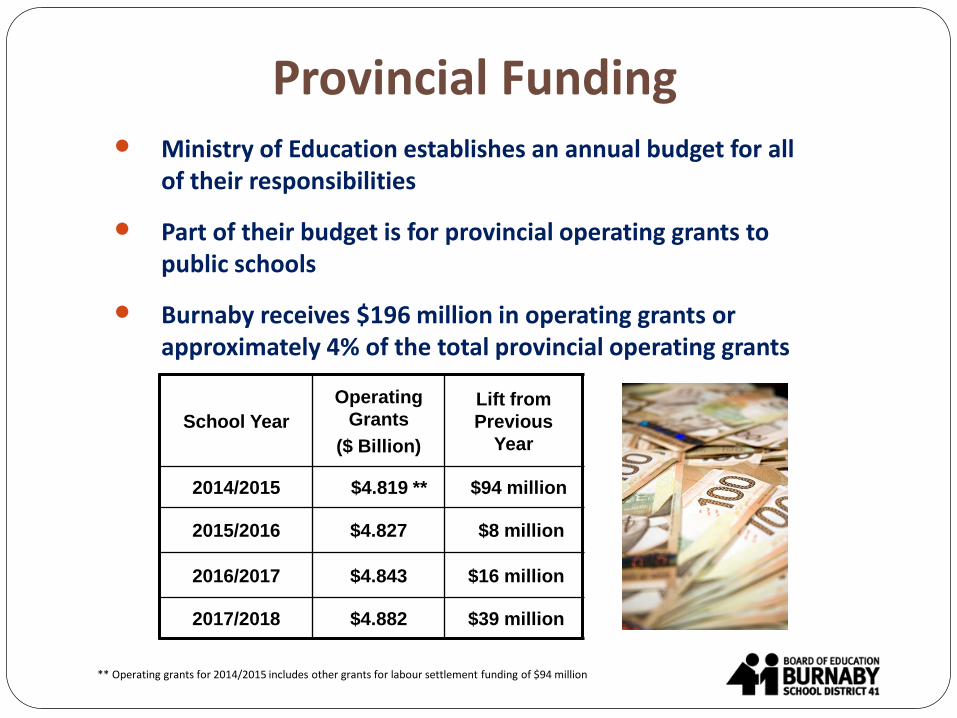
Ministry of Education establishes an annual budget for all of their responsibilities
Part of their budget is for provincial operating grants to public schools
Burnaby receives $196 million in operating grants or approximately 4% of the total provincial operating grants
School Year
Operating
Grants
($ Billion)
Lift from
Previous
Year
2014/2015 $4.819 ** $94 million
2015/2016 $4.827 $8 million
2016/2017 $4.843 $16 million
2017/2018 $4.882 $39 million
Provincial Funding
** Operating grants for 2014/2015 includes other grants for labour settlement funding of $94 million
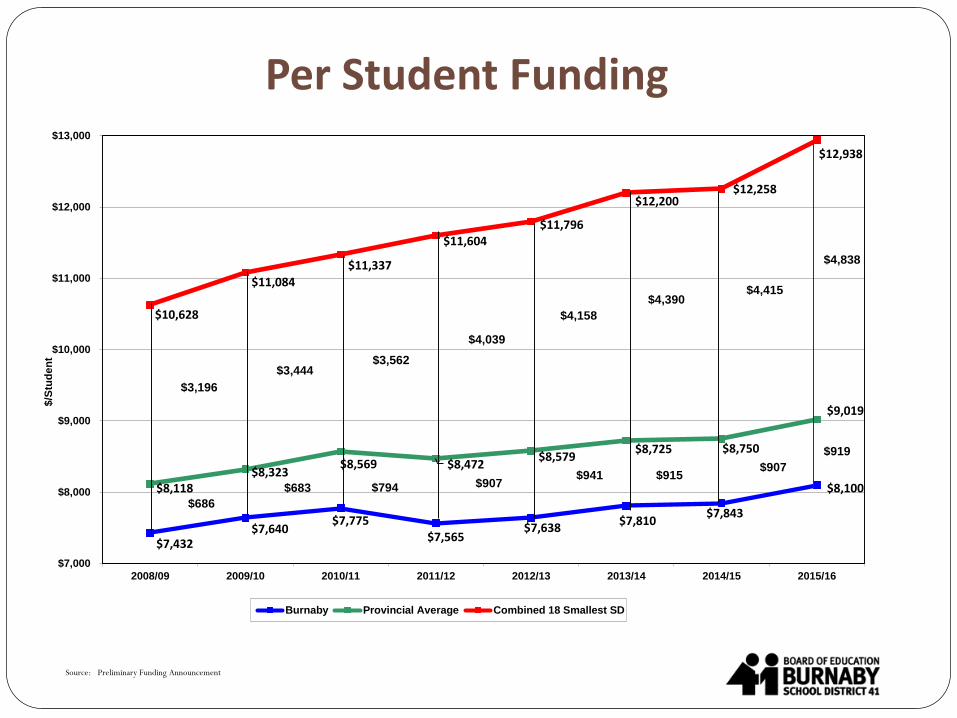
Per Student Funding
$7,432$7,640
$7,775$7,565
$7,638$7,810
$7,843
$8,100$8,118 $8,323
$8,569 $8,472$8,579
$8,725 $8,750
$9,019
$10,628
$11,084
$11,337
$11,604$11,796
$12,200$12,258
$12,938
$7,000
$8,000
$9,000
$10,000
$11,000
$12,000
$13,000
2008/09 2009/10 2010/11 2011/12 2012/13 2013/14 2014/15 2015/16
$/S
tud
en
t
Burnaby Provincial Average Combined 18 Smallest SD
$686
$683 $794
$3,196
$3,444$3,562
$907
$4,039
$4,158
$941
$4,390
$915
$4,415
$907
$4,838
$919
Source: Preliminary Funding Announcement
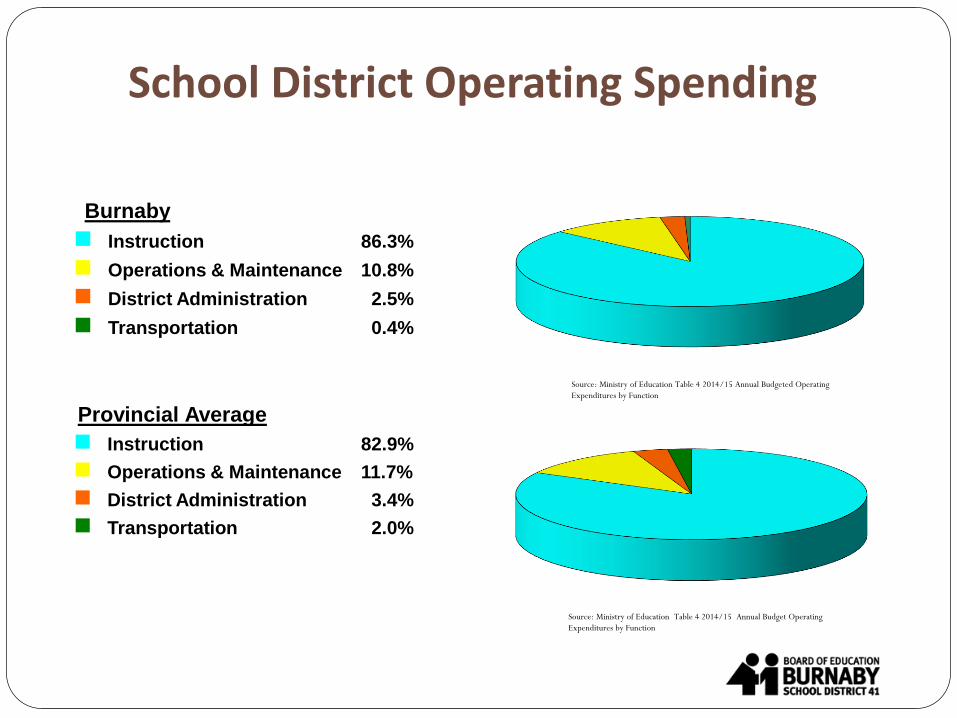
Burnaby
Instruction 86.3%
Operations & Maintenance 10.8%
District Administration 2.5%
Transportation 0.4%
School District Operating Spending
Provincial Average
Instruction 82.9%
Operations & Maintenance 11.7%
District Administration 3.4%
Transportation 2.0%
Source: Ministry of Education Table 4 2014/15 Annual Budgeted Operating
Expenditures by Function
Source: Ministry of Education Table 4 2014/15 Annual Budget Operating
Expenditures by Function
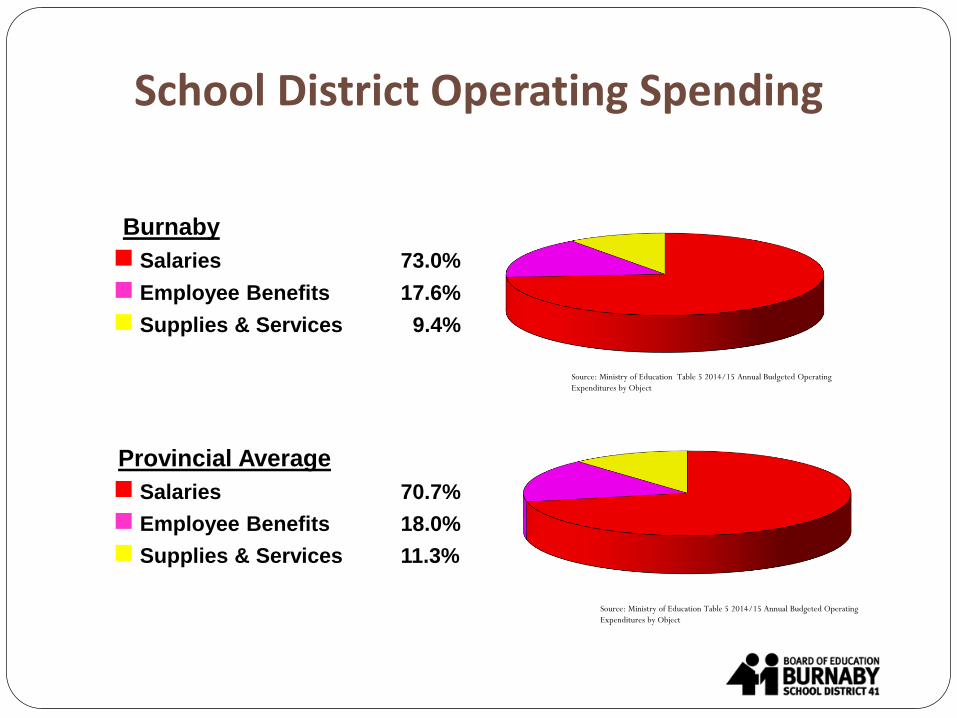
Burnaby
Salaries 73.0%
Employee Benefits 17.6%
Supplies & Services 9.4%
School District Operating Spending
Provincial Average
Salaries 70.7%
Employee Benefits 18.0%
Supplies & Services 11.3%
Source: Ministry of Education Table 5 2014/15 Annual Budgeted Operating
Expenditures by Object
Source: Ministry of Education Table 5 2014/15 Annual Budgeted Operating
Expenditures by Object
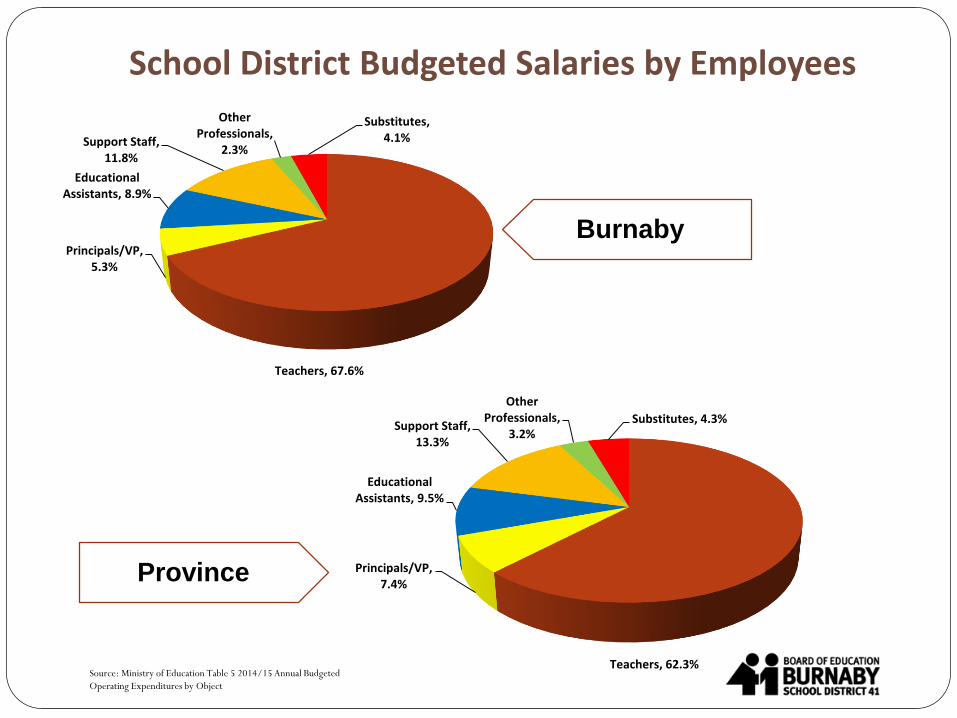
School District Budgeted Salaries by Employees
Burnaby
Province
Source: Ministry of Education Table 5 2014/15 Annual Budgeted
Operating Expenditures by Object
Teachers, 67.6%
Principals/VP, 5.3%
Educational Assistants, 8.9%
Support Staff, 11.8%
Other Professionals,
2.3%
Substitutes, 4.1%
Teachers, 62.3%
Principals/VP, 7.4%
Educational Assistants, 9.5%
Support Staff, 13.3%
Other Professionals,
3.2%Substitutes, 4.3%
Burnaby Board of Education
2015/2016 Operating Budget and Projected Three Year Operating Budget
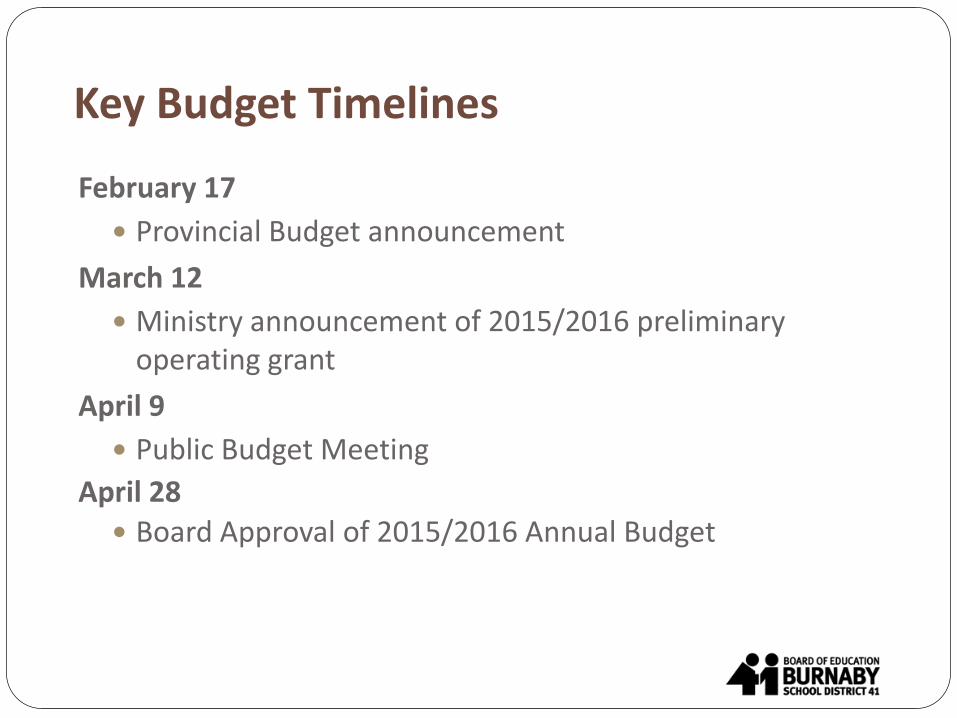
Key Budget Timelines
February 17
Provincial Budget announcement
March 12
Ministry announcement of 2015/2016 preliminary operating grant
April 9
Public Budget Meeting
April 28
Board Approval of 2015/2016 Annual Budget
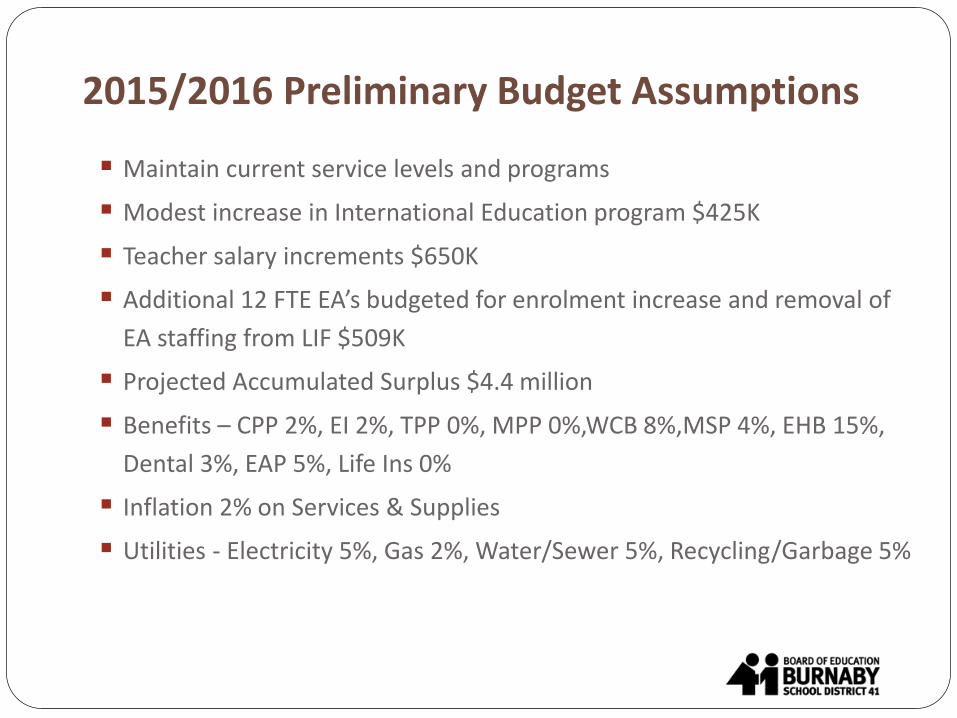
2015/2016 Preliminary Budget Assumptions
Maintain current service levels and programs
Modest increase in International Education program $425K
Teacher salary increments $650K
Additional 12 FTE EA’s budgeted for enrolment increase and removal of
EA staffing from LIF $509K
Projected Accumulated Surplus $4.4 million
Benefits – CPP 2%, EI 2%, TPP 0%, MPP 0%,WCB 8%,MSP 4%, EHB 15%,
Dental 3%, EAP 5%, Life Ins 0%
Inflation 2% on Services & Supplies
Utilities - Electricity 5%, Gas 2%, Water/Sewer 5%, Recycling/Garbage 5%
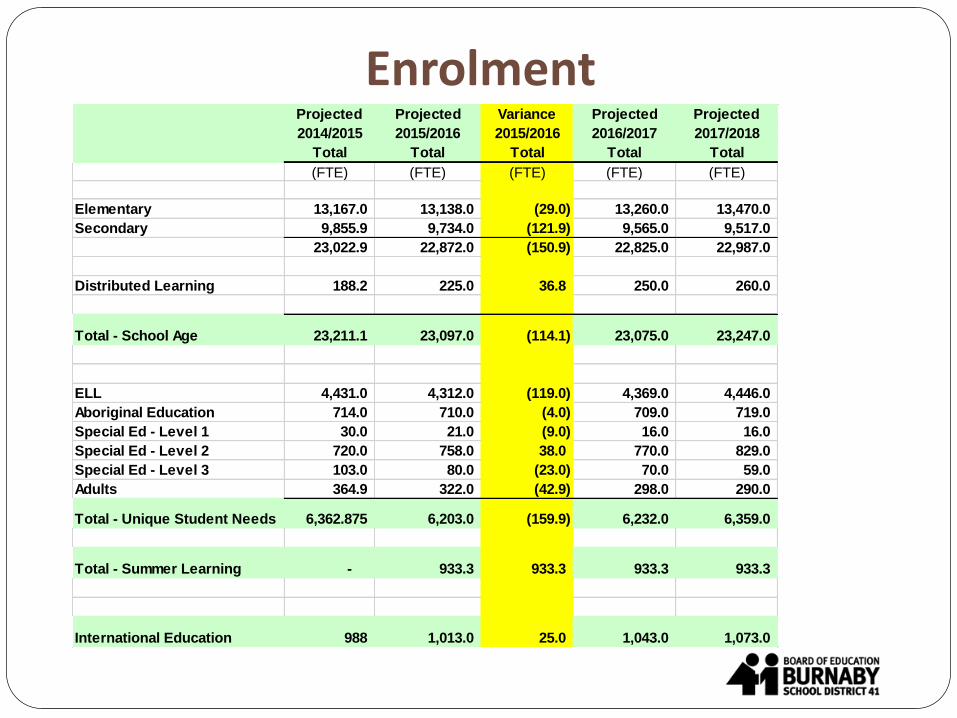
EnrolmentProjected Projected Variance Projected Projected
2014/2015 2015/2016 2015/2016 2016/2017 2017/2018
Total Total Total Total Total
(FTE) (FTE) (FTE) (FTE) (FTE)
Elementary 13,167.0 13,138.0 (29.0) 13,260.0 13,470.0
Secondary 9,855.9 9,734.0 (121.9) 9,565.0 9,517.0
23,022.9 22,872.0 (150.9) 22,825.0 22,987.0
Distributed Learning 188.2 225.0 36.8 250.0 260.0
Total - School Age 23,211.1 23,097.0 (114.1) 23,075.0 23,247.0
ELL 4,431.0 4,312.0 (119.0) 4,369.0 4,446.0
Aboriginal Education 714.0 710.0 (4.0) 709.0 719.0
Special Ed - Level 1 30.0 21.0 (9.0) 16.0 16.0
Special Ed - Level 2 720.0 758.0 38.0 770.0 829.0
Special Ed - Level 3 103.0 80.0 (23.0) 70.0 59.0
Adults 364.9 322.0 (42.9) 298.0 290.0
Total - Unique Student Needs 6,362.875 6,203.0 (159.9) 6,232.0 6,359.0
Total - Summer Learning - 933.3 933.3 933.3 933.3
International Education 988 1,013.0 25.0 1,043.0 1,073.0
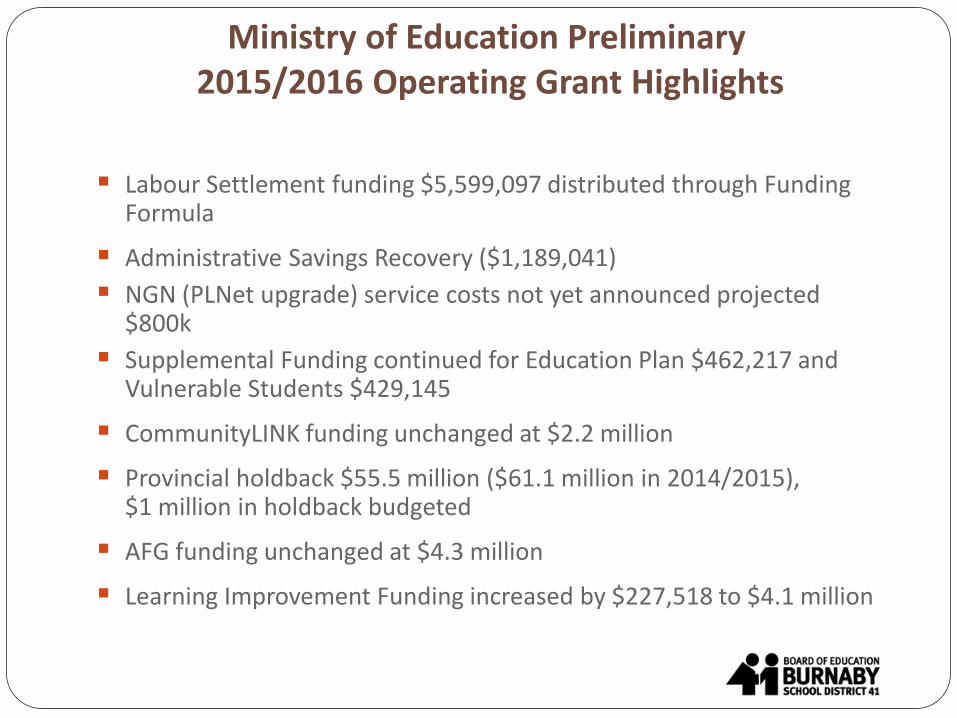
Ministry of Education Preliminary2015/2016 Operating Grant Highlights
Labour Settlement funding $5,599,097 distributed through Funding Formula
Administrative Savings Recovery ($1,189,041)
NGN (PLNet upgrade) service costs not yet announced projected $800k
Supplemental Funding continued for Education Plan $462,217 and Vulnerable Students $429,145
CommunityLINK funding unchanged at $2.2 million
Provincial holdback $55.5 million ($61.1 million in 2014/2015), $1 million in holdback budgeted
AFG funding unchanged at $4.3 million
Learning Improvement Funding increased by $227,518 to $4.1 million
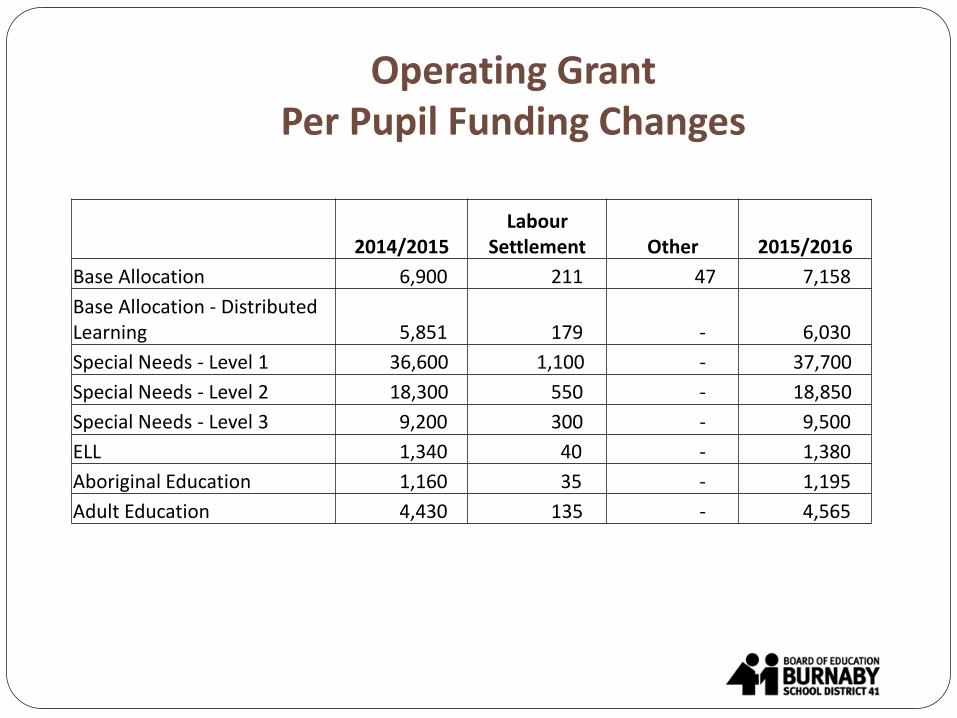
Operating GrantPer Pupil Funding Changes
2014/2015Labour
Settlement Other 2015/2016
Base Allocation 6,900 211 47 7,158
Base Allocation - Distributed Learning 5,851 179 - 6,030
Special Needs - Level 1 36,600 1,100 - 37,700
Special Needs - Level 2 18,300 550 - 18,850
Special Needs - Level 3 9,200 300 - 9,500
ELL 1,340 40 - 1,380
Aboriginal Education 1,160 35 - 1,195
Adult Education 4,430 135 - 4,565
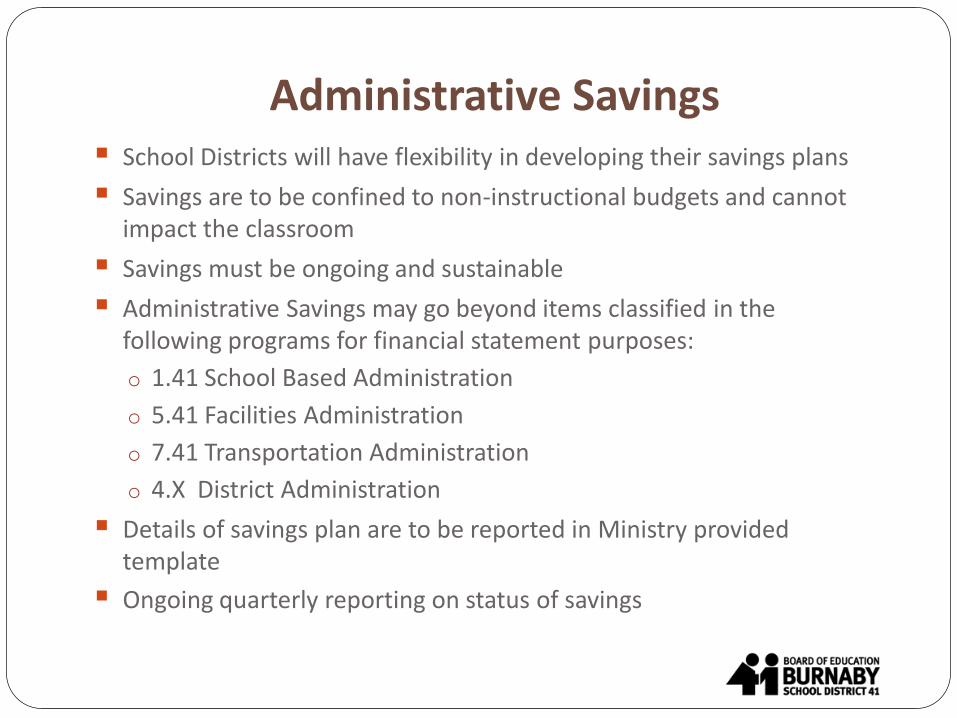
Administrative Savings School Districts will have flexibility in developing their savings plans
Savings are to be confined to non-instructional budgets and cannot impact the classroom
Savings must be ongoing and sustainable
Administrative Savings may go beyond items classified in the following programs for financial statement purposes:
o 1.41 School Based Administration
o 5.41 Facilities Administration
o 7.41 Transportation Administration
o 4.X District Administration
Details of savings plan are to be reported in Ministry provided template
Ongoing quarterly reporting on status of savings
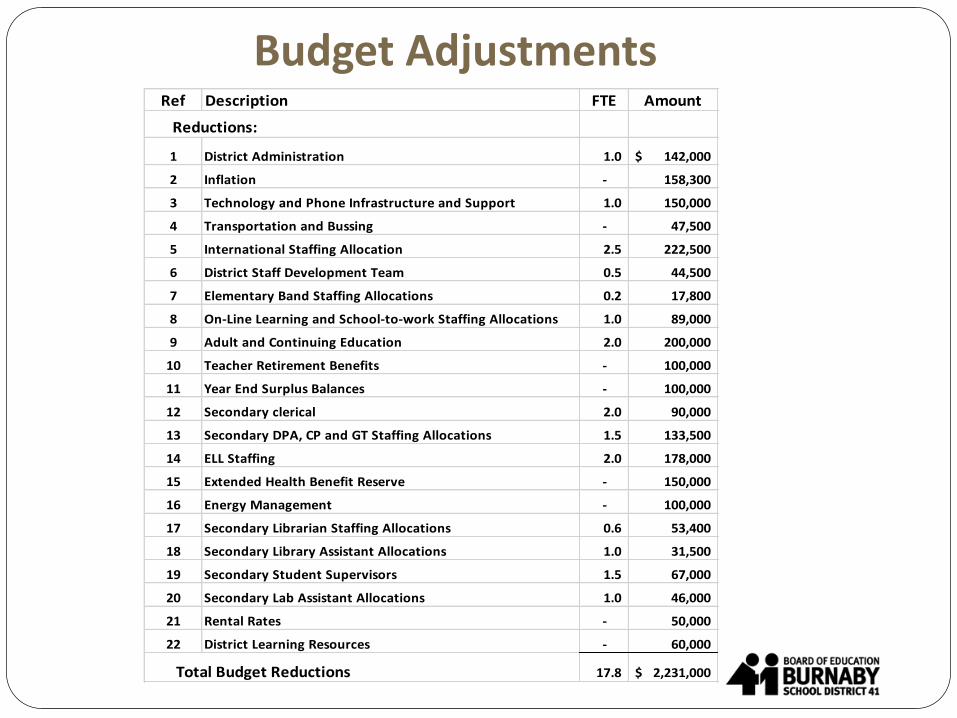
Budget AdjustmentsRef Description FTE Amount
Reductions:
1 District Administration 1.0 142,000$
2 Inflation - 158,300
3 Technology and Phone Infrastructure and Support 1.0 150,000
4 Transportation and Bussing - 47,500
5 International Staffing Allocation 2.5 222,500
6 District Staff Development Team 0.5 44,500
7 Elementary Band Staffing Allocations 0.2 17,800
8 On-Line Learning and School-to-work Staffing Allocations 1.0 89,000
9 Adult and Continuing Education 2.0 200,000
10 Teacher Retirement Benefits - 100,000
11 Year End Surplus Balances - 100,000
12 Secondary clerical 2.0 90,000
13 Secondary DPA, CP and GT Staffing Allocations 1.5 133,500
14 ELL Staffing 2.0 178,000
15 Extended Health Benefit Reserve - 150,000
16 Energy Management - 100,000
17 Secondary Librarian Staffing Allocations 0.6 53,400
18 Secondary Library Assistant Allocations 1.0 31,500
19 Secondary Student Supervisors 1.5 67,000
20 Secondary Lab Assistant Allocations 1.0 46,000
21 Rental Rates - 50,000
22 District Learning Resources - 60,000
Total Budget Reductions 17.8 2,231,000$
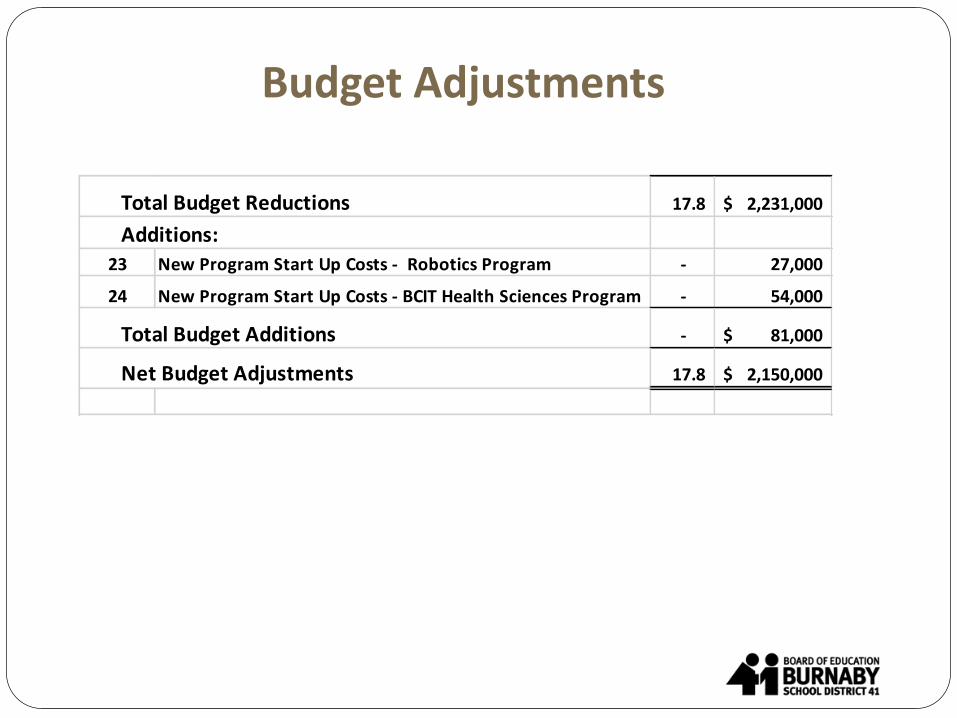
Budget Adjustments
Total Budget Reductions 17.8 2,231,000$
Additions:
23 New Program Start Up Costs - Robotics Program - 27,000
24 New Program Start Up Costs - BCIT Health Sciences Program - 54,000
Total Budget Additions - 81,000$
Net Budget Adjustments 17.8 2,150,000$
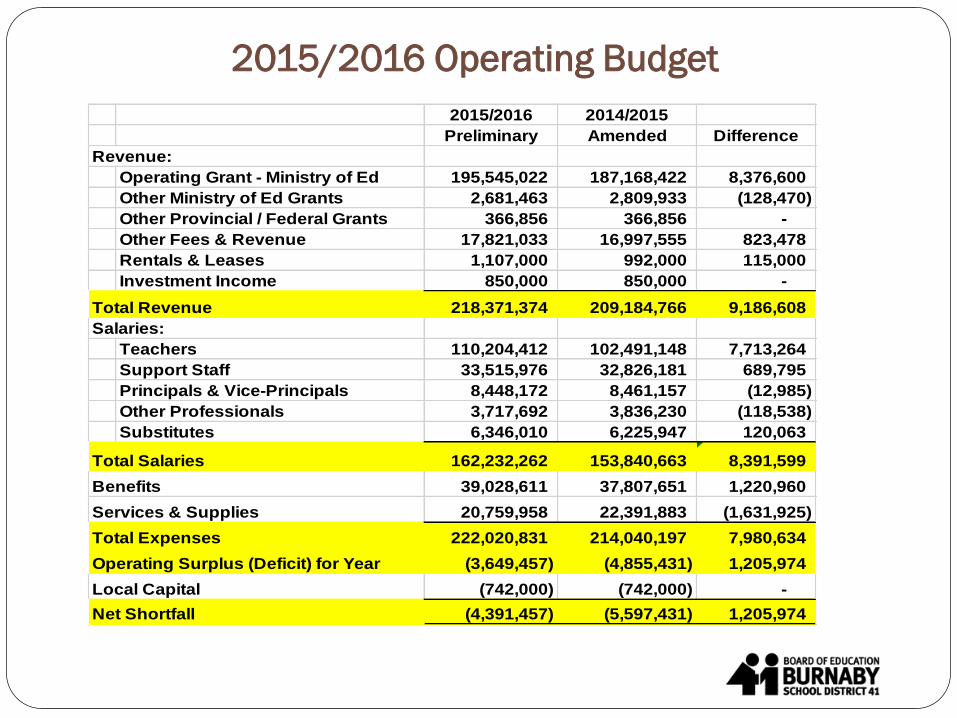
2015/2016 Operating Budget
2015/2016 2014/2015
Preliminary Amended Difference
Revenue:
Operating Grant - Ministry of Ed 195,545,022 187,168,422 8,376,600
Other Ministry of Ed Grants 2,681,463 2,809,933 (128,470)
Other Provincial / Federal Grants 366,856 366,856 -
Other Fees & Revenue 17,821,033 16,997,555 823,478
Rentals & Leases 1,107,000 992,000 115,000
Investment Income 850,000 850,000 -
Total Revenue 218,371,374 209,184,766 9,186,608
Salaries:
Teachers 110,204,412 102,491,148 7,713,264
Support Staff 33,515,976 32,826,181 689,795
Principals & Vice-Principals 8,448,172 8,461,157 (12,985)
Other Professionals 3,717,692 3,836,230 (118,538)
Substitutes 6,346,010 6,225,947 120,063
Total Salaries 162,232,262 153,840,663 8,391,599
Benefits 39,028,611 37,807,651 1,220,960
Services & Supplies 20,759,958 22,391,883 (1,631,925)
Total Expenses 222,020,831 214,040,197 7,980,634
Operating Surplus (Deficit) for Year (3,649,457) (4,855,431) 1,205,974
Local Capital (742,000) (742,000) -
Net Shortfall (4,391,457) (5,597,431) 1,205,974
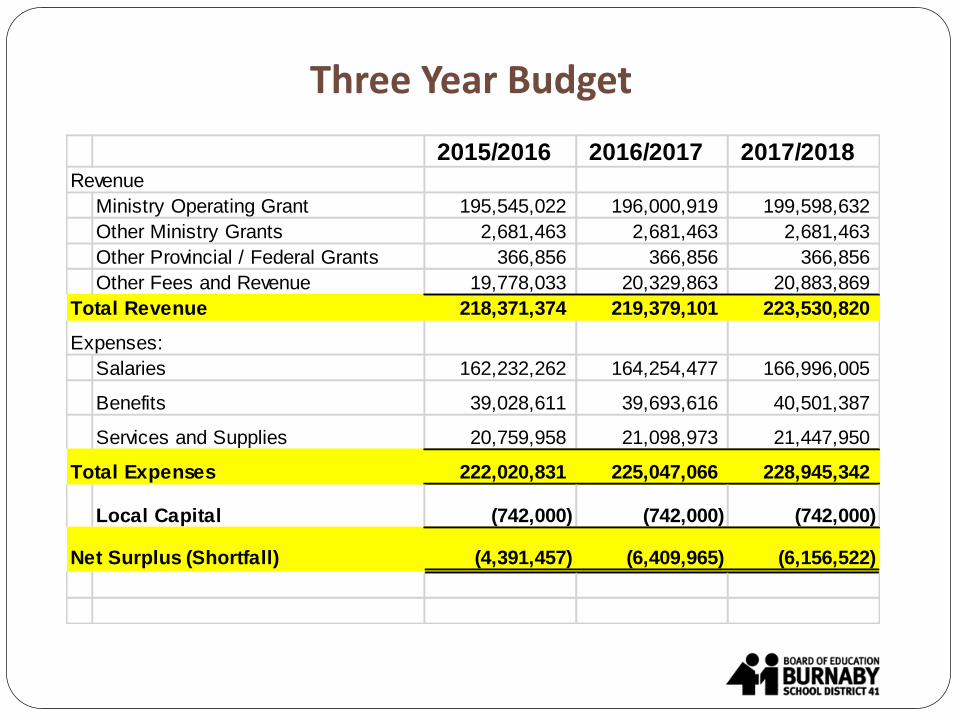
Three Year Budget
2015/2016 2016/2017 2017/2018Revenue
Ministry Operating Grant 195,545,022 196,000,919 199,598,632
Other Ministry Grants 2,681,463 2,681,463 2,681,463
Other Provincial / Federal Grants 366,856 366,856 366,856
Other Fees and Revenue 19,778,033 20,329,863 20,883,869
Total Revenue 218,371,374 219,379,101 223,530,820
Expenses:
Salaries 162,232,262 164,254,477 166,996,005
Benefits 39,028,611 39,693,616 40,501,387
Services and Supplies 20,759,958 21,098,973 21,447,950
Total Expenses 222,020,831 225,047,066 228,945,342
Local Capital (742,000) (742,000) (742,000)
Net Surplus (Shortfall) (4,391,457) (6,409,965) (6,156,522)
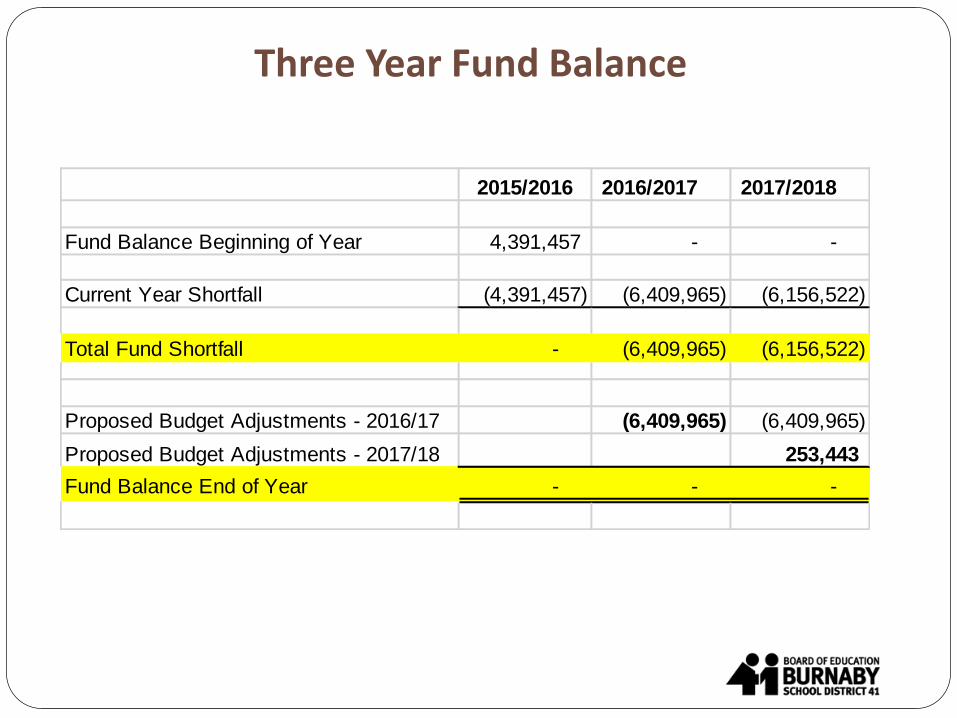
Three Year Fund Balance
2015/2016 2016/2017 2017/2018
Fund Balance Beginning of Year 4,391,457 - -
Current Year Shortfall (4,391,457) (6,409,965) (6,156,522)
Total Fund Shortfall - (6,409,965) (6,156,522)
Proposed Budget Adjustments - 2016/17 (6,409,965) (6,409,965)
Proposed Budget Adjustments - 2017/18 253,443
Fund Balance End of Year - - -
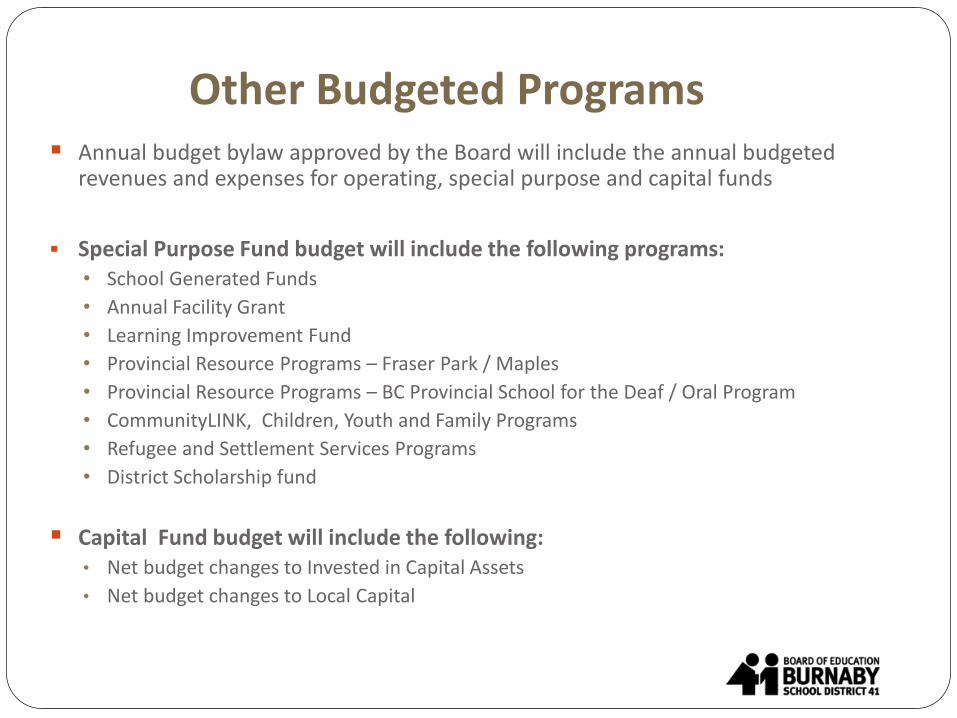
Other Budgeted Programs Annual budget bylaw approved by the Board will include the annual budgeted
revenues and expenses for operating, special purpose and capital funds
Special Purpose Fund budget will include the following programs:• School Generated Funds
• Annual Facility Grant
• Learning Improvement Fund
• Provincial Resource Programs – Fraser Park / Maples
• Provincial Resource Programs – BC Provincial School for the Deaf / Oral Program
• CommunityLINK, Children, Youth and Family Programs
• Refugee and Settlement Services Programs
• District Scholarship fund
Capital Fund budget will include the following:• Net budget changes to Invested in Capital Assets
• Net budget changes to Local Capital
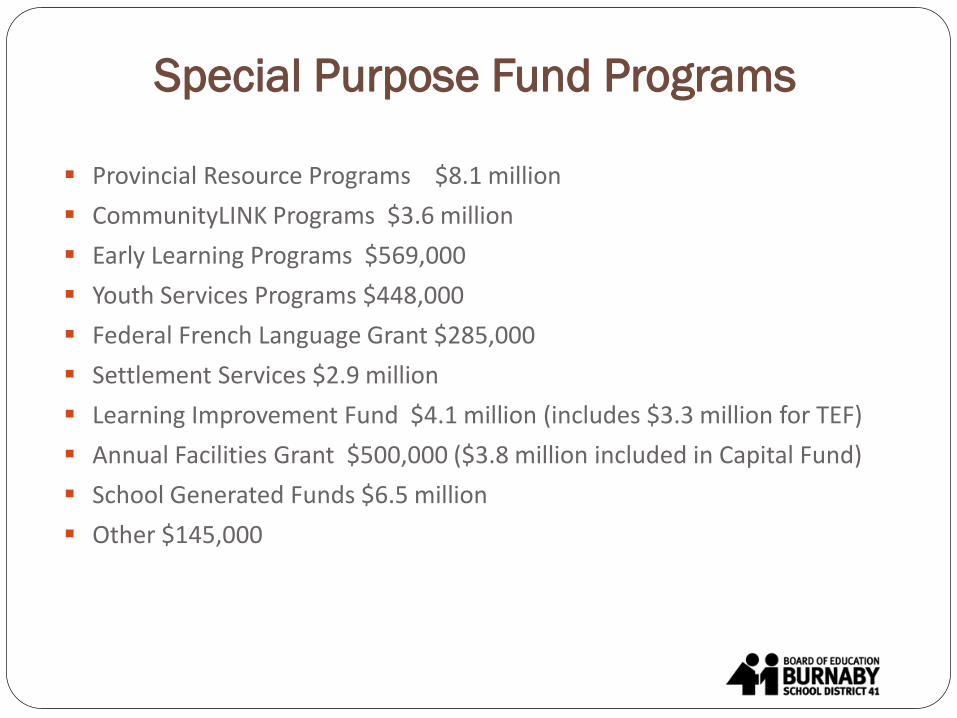
Special Purpose Fund Programs
Provincial Resource Programs $8.1 million
CommunityLINK Programs $3.6 million
Early Learning Programs $569,000
Youth Services Programs $448,000
Federal French Language Grant $285,000
Settlement Services $2.9 million
Learning Improvement Fund $4.1 million (includes $3.3 million for TEF)
Annual Facilities Grant $500,000 ($3.8 million included in Capital Fund)
School Generated Funds $6.5 million
Other $145,000
Thank You