Embed Size (px)
Citation preview
1
Burlington County Institute of Technology
Curriculum Document
Course Title: Honors Algebra I Curriculum Area: Mathematics
Credits: 5 Credits per course Board Approved: August 2017
Prepared by: Karen Cheney and Rachel Greeby

2
COURSE DESCRIPTION: Honors Algebra I is designed for the student who has already learned some of the major concepts and processes of algebra but seeks a deeper and broader understanding of the discipline. This course integrates the advanced elements of algebra with technology, problem solving, application and mathematical modeling. As well, Honors Algebra I is designed to further develop the student’s reasoning skills, with an emphasis on logic that is central to student achievement in upper level mathematics courses. Unit 1: Relationships Between Quantities and Reasoning with Equations Unit 2: Linear Relationships Unit 3: Exponential and Quadratic Functions Unit 4: Descriptive Statistics and Probability Unit 5: Advanced Functions and Equations

3
Course Title: Algebra I Honors
Unit Title: Relationships Between Quantities and Reasoning with Equations
Unit Number: 1
Curriculum Writers: Karen Cheney and Rachel Greeby
Desired Outcomes
Established Goals: NJSLS Major:
● Reason quantitatively and use units to solve problems (N.Q.1, N.Q.2, N.Q.3). ● Interpret the structure of expressions (A.SSE.1, A.SSE.2). ● Create equations that describe numbers or relationships (A.CED.1, A.CED.2, A.CED.4). ● Understand solving equations as a process of reasoning and explain the reasoning (A.REI.1). ● Solve equations and inequalities in one variables (A.REI.3). ● Represent and solve equations and inequalities graphically (A.REI.10). ● Understand the concept of a function and use function notation (F.IF.1, F.IF.2). ● Interpret functions that arise in applications in terms of the context (F.IF.4).
Additional:
● Use properties of rational and irrational numbers (N.RN.3).
Enduring Understandings:
● Real-world phenomena can be represented
efficiently in algebra by using symbols and
operations. These symbols may represent
unknown quantities which may or may not
vary.
● Equations and inequalities can be
transformed into equivalent forms so that
solutions can be found.
Essential Questions:
● How can mathematical ideas be
represented?
● Why is it helpful to represent the
same mathematical idea in
different ways?
4
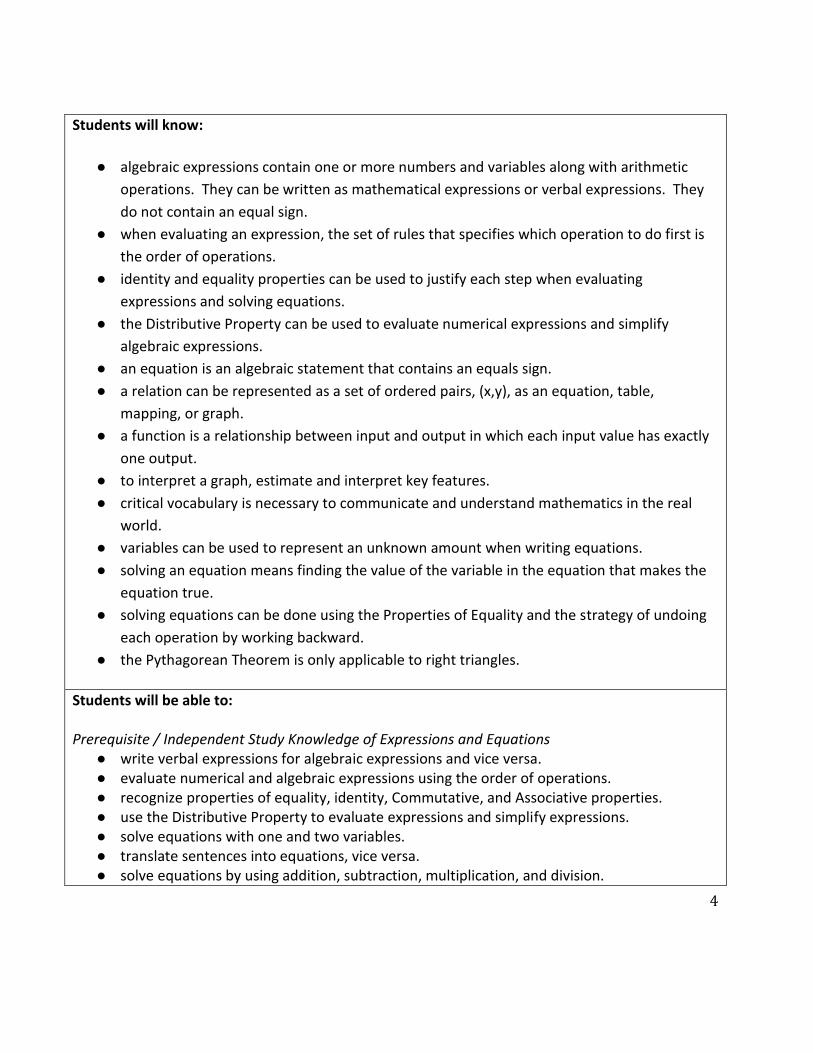
Students will know:
● algebraic expressions contain one or more numbers and variables along with arithmetic
operations. They can be written as mathematical expressions or verbal expressions. They
do not contain an equal sign.
● when evaluating an expression, the set of rules that specifies which operation to do first is
the order of operations.
● identity and equality properties can be used to justify each step when evaluating
expressions and solving equations.
● the Distributive Property can be used to evaluate numerical expressions and simplify
algebraic expressions.
● an equation is an algebraic statement that contains an equals sign.
● a relation can be represented as a set of ordered pairs, (x,y), as an equation, table,
mapping, or graph.
● a function is a relationship between input and output in which each input value has exactly
one output.
● to interpret a graph, estimate and interpret key features.
● critical vocabulary is necessary to communicate and understand mathematics in the real
world.
● variables can be used to represent an unknown amount when writing equations.
● solving an equation means finding the value of the variable in the equation that makes the
equation true.
● solving equations can be done using the Properties of Equality and the strategy of undoing
each operation by working backward.
● the Pythagorean Theorem is only applicable to right triangles.
Students will be able to: Prerequisite / Independent Study Knowledge of Expressions and Equations
● write verbal expressions for algebraic expressions and vice versa. ● evaluate numerical and algebraic expressions using the order of operations. ● recognize properties of equality, identity, Commutative, and Associative properties. ● use the Distributive Property to evaluate expressions and simplify expressions. ● solve equations with one and two variables. ● translate sentences into equations, vice versa. ● solve equations by using addition, subtraction, multiplication, and division.

5
● solve equations involving more than one operation and involving consecutive integers. ● solve equations with the variable on each side and involving grouping symbols. ● evaluate absolute value expressions and equations. ● compare ratios and solve proportions. ● find the percent of change and solve problems involving percent of change.
Expressions, Equations, and Functions / Linear Functions ● represent relations and interpret graphs of relations. ● determine whether a relation is a function and find function values. ● interpret intercepts, symmetry, positive, negative, increasing, decreasing, extrema, and end
behavior of graphs of functions. ● solve equations for given variables and use formulas to solve real-world problems. ● solve problems involving weighted averages. ● Find the inverse of a relation and of a linear function.
● solve problems by using the Pythagorean Theorem. ● determine whether a triangle is a right triangle.
Assessment Evidence
Performance Tasks:
● Ascent: 50 Seconds to MECO - Research - Plan - Perform - Present
Other Evidence:
● Tests ● Quizzes ● Linkit ● IXL Independent Study Smart
Scores ● DOLs ● Warm-ups ● Activities: Sales Tax and Discount,
Gradesheet Calculations
Learning Plan
Unit Pacing: 7.5 days including review and assessments Instructional Strategies:
● Use a variety of instructional strategies such as: ● PARCC Released Items ● Inquiry-based Learning ● Problem-based Learning

6
● Project-based Learning ● Blended Learning ● Whiteboard Work ● Cooperative Learning ● Technology-based activities ● Do-Now Problems/Exit Problems ● Peer Editing ● Explicit Timing ● Guided Lecture
Textbook: Carter, John, et al, Algebra 1, Glencoe, McGraw-Hill, 2010 and 2012

7
Course Title: Algebra I Honors
Unit Title: Linear Relationships
Unit Number: 2
Curriculum Writers: Karen Cheney and Rachel Greeby
Desired Outcomes
Established Goals: NJSLS Major:
● Represent and solve equations and inequalities graphically (A.REI.10, A.REI.11, A.REI.12). ● Create equations that describe numbers or relationships (A.CED.1, A.CED.2, A.CED.3). ● Understand the concept of a function and use function notation (F.IF.2, F.IF.3). ● Interpret functions that arise in applications in terms of the context (F.IF.4, F.IF.6). ● Solve equations and inequalities in one variable (A.REI.3). ● Interpret linear models (S.ID.7, S.ID. 8).
Supporting:
● Analyze functions using different representations (F.IF.7a, F.IF.9). ● Reason quantitatively and use units to solve problems (N.Q.1). ● Construct and compare linear, quadratic, and exponential models and solve problems
(F.LE.1a, F.LE.1b, F.LE.2). ● Summarize, represent, and interpret data on two categorical and quantitative variables
(S.ID.6). ● Build a function that models a relationship between two quantities (F.BF.1, F.BF.2).
Additional:
● Solve systems of equations (A.REI.5, A.REI.6). ● Build new functions from existing functions (F.BF.4a).
Enduring Understandings:
● The symbolic language of algebra is used to
communicate, analyze, and generalize
patterns.
● Algebraic relationships can be represented
graphically, numerically, symbolically, or
verbally.
Essential Questions:
● Why is math used to model real-
world situations?
● How are symbols useful in
mathematics? What mathematical
symbols do you know?
● How can average rate of change be
8
● Mathematical models can be used to
describe physical relationships.
● In mathematical relationships, the value for
one quantity depends on the value of
another quantity.
● Ratios can show a relationship between
changing quantities.
determined graphically, numerically,
symbolically, or verbally?
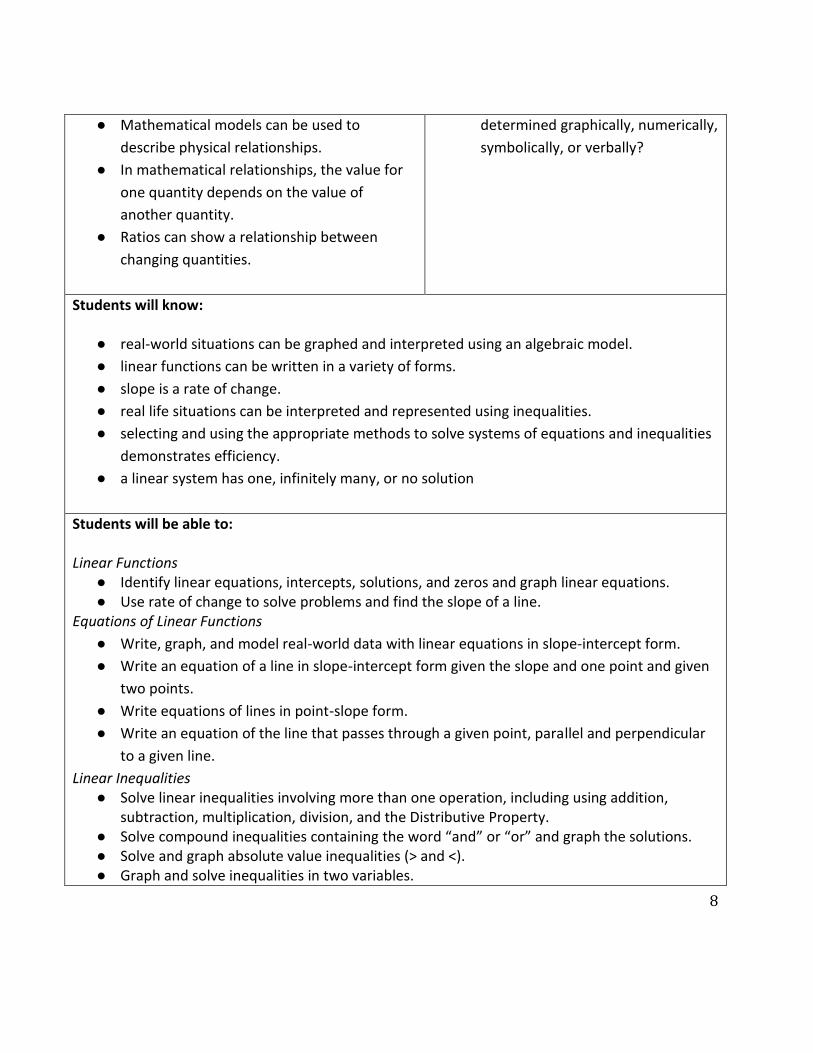
Students will know:
● real-world situations can be graphed and interpreted using an algebraic model.
● linear functions can be written in a variety of forms.
● slope is a rate of change.
● real life situations can be interpreted and represented using inequalities.
● selecting and using the appropriate methods to solve systems of equations and inequalities
demonstrates efficiency.
● a linear system has one, infinitely many, or no solution
Students will be able to: Linear Functions
● Identify linear equations, intercepts, solutions, and zeros and graph linear equations. ● Use rate of change to solve problems and find the slope of a line.
Equations of Linear Functions
● Write, graph, and model real-world data with linear equations in slope-intercept form.
● Write an equation of a line in slope-intercept form given the slope and one point and given
two points.
● Write equations of lines in point-slope form.
● Write an equation of the line that passes through a given point, parallel and perpendicular
to a given line.
Linear Inequalities ● Solve linear inequalities involving more than one operation, including using addition,
subtraction, multiplication, division, and the Distributive Property. ● Solve compound inequalities containing the word “and” or “or” and graph the solutions. ● Solve and graph absolute value inequalities (> and <). ● Graph and solve inequalities in two variables.

9
Systems of Linear Equations and Functions ● Solve systems of linear equations by graphing, substitution, and eliminations (addition,
subtraction, multiplications). ● Solve systems of linear inequalities by graphing. ● Solve real world problems using systems of equations. ● Determine the best method for solving systems of equations.
Assessment Evidence
Performance Tasks:
● Project (Suggestion: Bungee Jump Project) - Research - Plan - Perform - Present
● Possible Job Earnings: - Part A: Marcella wants a job as a
sales representative. She receives two job offers from companies that sell office machines to businesses. Office Essentials offers Marcella a salary of $2,500 per month, plus a commission of $125 for every office machine she sells. Everything Office offers her a salary of $2,000 per month, plus a commission of $150 for every office machine she sells. Let M represent the total monthly earnings, in dollars, and let n represent the number of office machines sold in a month. For each company, write an equation that represents the relationship between M and n.
- Part B: Marcella wants to earn a total of at least $4,000 per month. For each company, find the least number of office machines she would need to sell each month in order to meet this
Other Evidence:
● Tests ● Quizzes ● DOLs ● Warm-ups
10
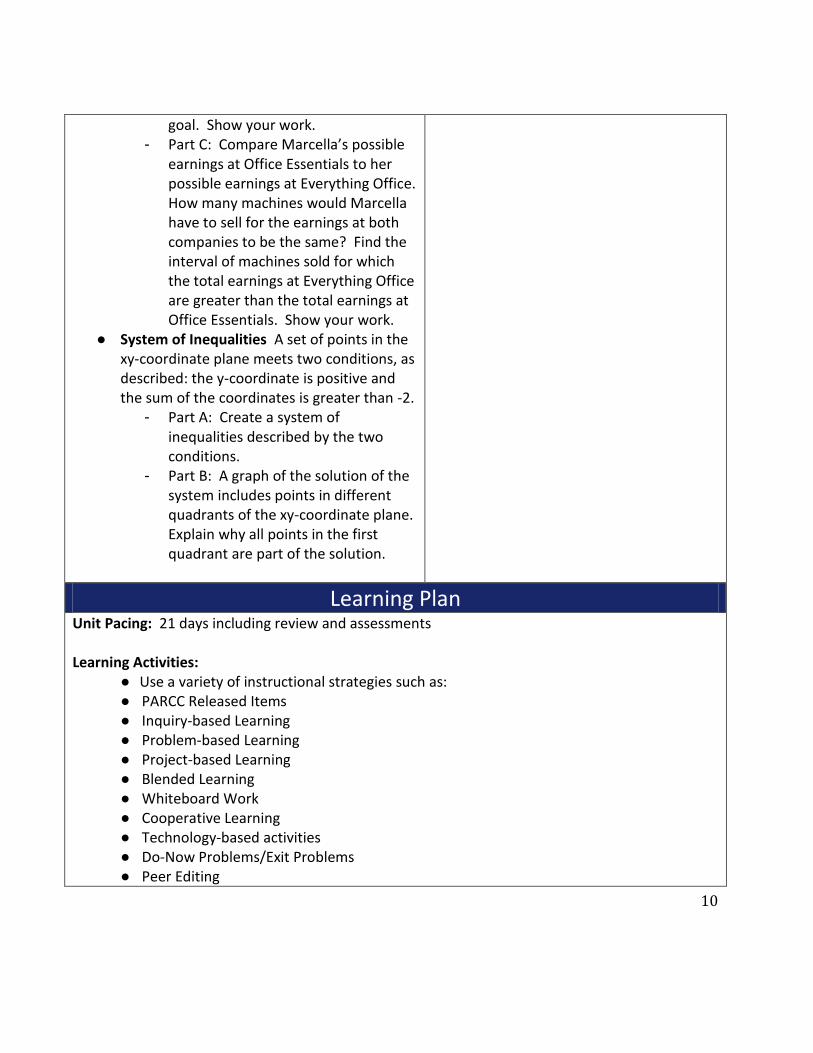
goal. Show your work. - Part C: Compare Marcella’s possible
earnings at Office Essentials to her possible earnings at Everything Office. How many machines would Marcella have to sell for the earnings at both companies to be the same? Find the interval of machines sold for which the total earnings at Everything Office are greater than the total earnings at Office Essentials. Show your work.
● System of Inequalities A set of points in the xy-coordinate plane meets two conditions, as described: the y-coordinate is positive and the sum of the coordinates is greater than -2.
- Part A: Create a system of inequalities described by the two conditions.
- Part B: A graph of the solution of the system includes points in different quadrants of the xy-coordinate plane. Explain why all points in the first quadrant are part of the solution.
Learning Plan
Unit Pacing: 21 days including review and assessments Learning Activities:
● Use a variety of instructional strategies such as: ● PARCC Released Items ● Inquiry-based Learning ● Problem-based Learning ● Project-based Learning ● Blended Learning ● Whiteboard Work ● Cooperative Learning ● Technology-based activities ● Do-Now Problems/Exit Problems ● Peer Editing

11
● Explicit Timing ● Guided Lecture
Textbook: Carter, John, et al, Algebra 1, Glencoe, McGraw-Hill, 2010 and 2012
12
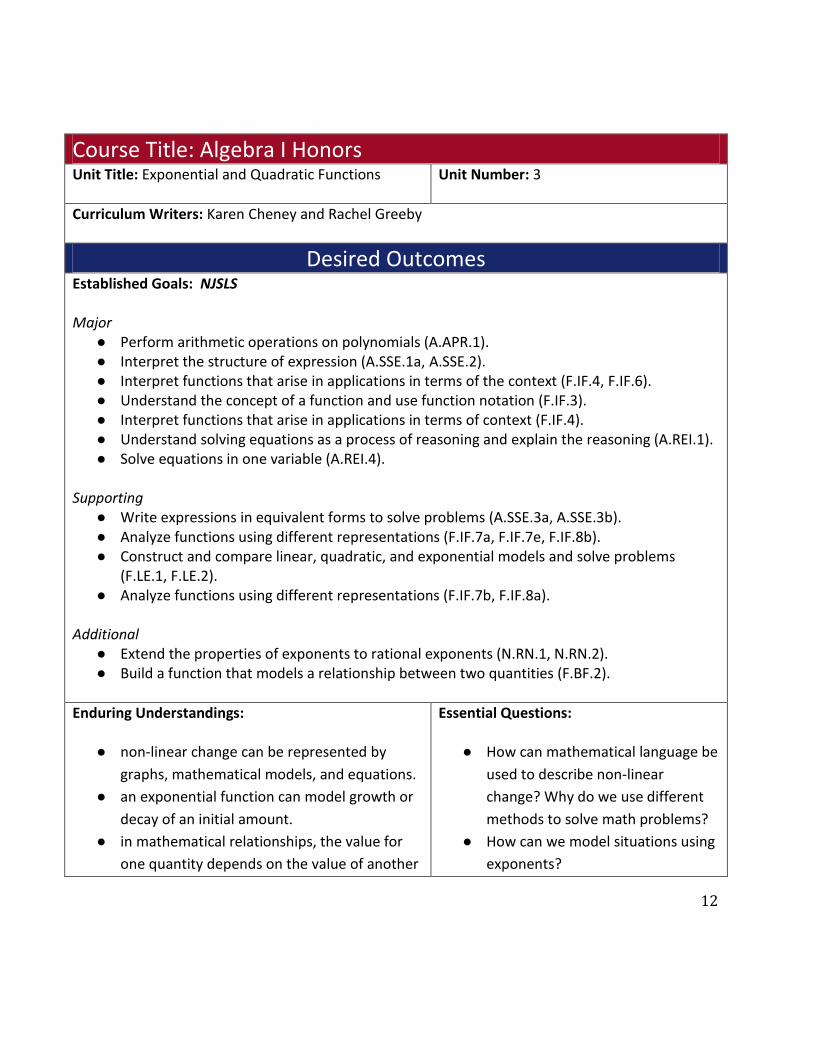
Course Title: Algebra I Honors
Unit Title: Exponential and Quadratic Functions
Unit Number: 3
Curriculum Writers: Karen Cheney and Rachel Greeby
Desired Outcomes
Established Goals: NJSLS Major
● Perform arithmetic operations on polynomials (A.APR.1). ● Interpret the structure of expression (A.SSE.1a, A.SSE.2). ● Interpret functions that arise in applications in terms of the context (F.IF.4, F.IF.6). ● Understand the concept of a function and use function notation (F.IF.3). ● Interpret functions that arise in applications in terms of context (F.IF.4). ● Understand solving equations as a process of reasoning and explain the reasoning (A.REI.1). ● Solve equations in one variable (A.REI.4).
Supporting
● Write expressions in equivalent forms to solve problems (A.SSE.3a, A.SSE.3b). ● Analyze functions using different representations (F.IF.7a, F.IF.7e, F.IF.8b). ● Construct and compare linear, quadratic, and exponential models and solve problems
(F.LE.1, F.LE.2). ● Analyze functions using different representations (F.IF.7b, F.IF.8a).
Additional
● Extend the properties of exponents to rational exponents (N.RN.1, N.RN.2). ● Build a function that models a relationship between two quantities (F.BF.2).
Enduring Understandings:
● non-linear change can be represented by
graphs, mathematical models, and equations.
● an exponential function can model growth or
decay of an initial amount.
● in mathematical relationships, the value for
one quantity depends on the value of another
Essential Questions:
● How can mathematical language be
used to describe non-linear
change? Why do we use different
methods to solve math problems?
● How can we model situations using
exponents?

13
quantity.
● a relationship exists between the laws of
exponents and scientific notation.
● When could a nonlinear function be
used to model a real-world
situation?
● Why are graphs useful?
● How are the rules of exponents
used when multiplying and dividing
expressions that are written in
scientific notation?
Students will know:
● an exponential function can model growth or decay in real life when describing situations
such as population growth, compound interest, and car depreciation.
● the graph of an exponential function of the form y=abx will never equal zero and will have
exactly one y -intercept.
● in the exponential function y=abx , a represents the initial amount and b represents the
growth/decay factor.
● compound interest can be found using the formula A=P(1+r/n)nt , where A represents the
balance, P represents the principal (initial deposit), r represents the annual interest rate
(expressed as a decimal), n represents the number of times interest is compounded yearly,
and t represents the time in years.
● quadratic functions can be graphed using ordered pairs, graphed using the roots and vertex,
written and graphed from different forms using algebraic and calculator techniques,
transformed and reflected both graphically and algebraically, related to real-world
situations by graphing and interpreting algebraic models, used to analyze data, used to
determine whether it represents a function and the type of function.
● solving a quadratic function will produce the roots of the parabola.
● the ratio (-b/2a) is the x-coordinate at the vertex.
Students will be able to: Exponents and Exponential Functions
● simplify and perform operations on expressions involving exponents (product of powers,
power of power, power of product, quotient of powers, power of a quotient, zero exponent
property, negative exponent property).
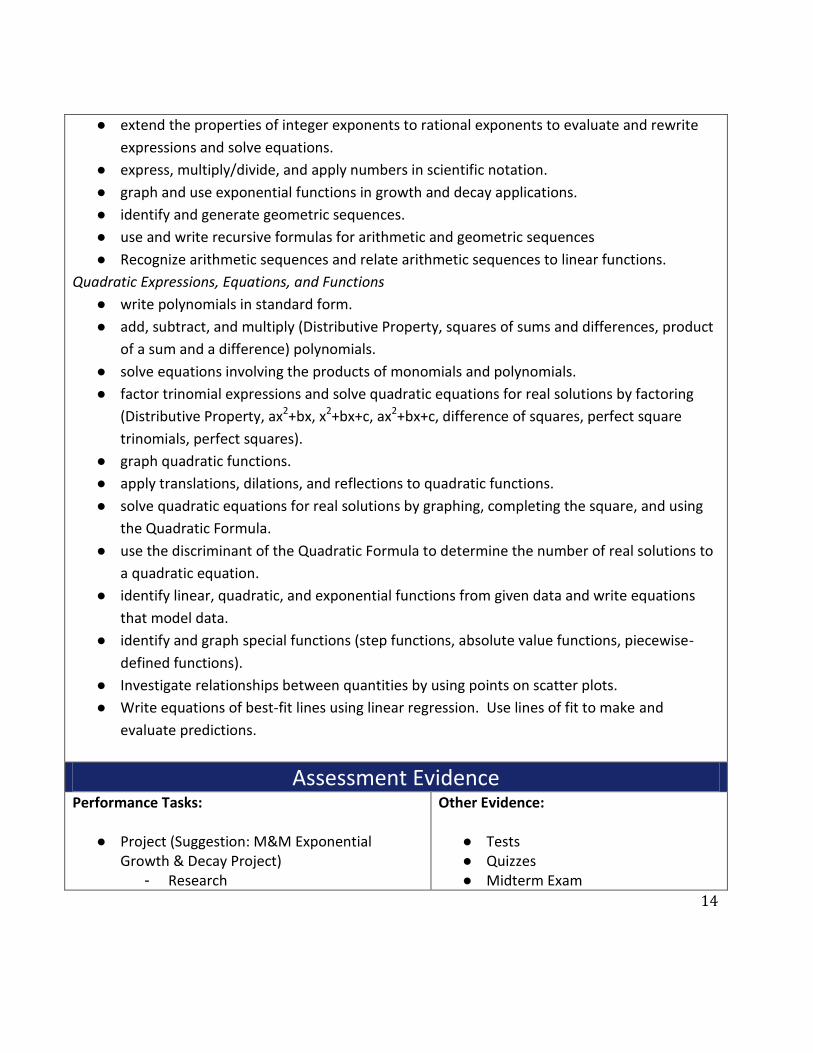
14
● extend the properties of integer exponents to rational exponents to evaluate and rewrite
expressions and solve equations.
● express, multiply/divide, and apply numbers in scientific notation.
● graph and use exponential functions in growth and decay applications.
● identify and generate geometric sequences.
● use and write recursive formulas for arithmetic and geometric sequences
● Recognize arithmetic sequences and relate arithmetic sequences to linear functions.
Quadratic Expressions, Equations, and Functions
● write polynomials in standard form.
● add, subtract, and multiply (Distributive Property, squares of sums and differences, product
of a sum and a difference) polynomials.
● solve equations involving the products of monomials and polynomials.
● factor trinomial expressions and solve quadratic equations for real solutions by factoring
(Distributive Property, ax2+bx, x2+bx+c, ax2+bx+c, difference of squares, perfect square
trinomials, perfect squares).
● graph quadratic functions.
● apply translations, dilations, and reflections to quadratic functions.
● solve quadratic equations for real solutions by graphing, completing the square, and using
the Quadratic Formula.
● use the discriminant of the Quadratic Formula to determine the number of real solutions to
a quadratic equation.
● identify linear, quadratic, and exponential functions from given data and write equations
that model data.
● identify and graph special functions (step functions, absolute value functions, piecewise-
defined functions).
● Investigate relationships between quantities by using points on scatter plots.
● Write equations of best-fit lines using linear regression. Use lines of fit to make and
evaluate predictions.
Assessment Evidence
Performance Tasks:
● Project (Suggestion: M&M Exponential Growth & Decay Project)
- Research
Other Evidence:
● Tests ● Quizzes ● Midterm Exam

15
- Plan - Perform - Present
● Projectiles Melissa launches a rocket from a 3 meter tall platform. The high, h, of the rocket, in meters, can be modeled by the graph below. Melissa knows that h(1)=23 meters and h(a)=34.25 meters. What is a reasonable estimate of the average rate of change of the height of the rocket, in meters per second, between a and b seconds? Explain your reasoning.
● Complete the Square Explain the steps to
solve the equation x2+12x-28=0 by completing the square, and give the solution(s). Explain what value(s) of c make the equation x2+12x+c=0 have only one solution. Justify your answer.
● Linkit ● DOLs ● Warm-ups
Learning Plan
Unit Pacing: 31 days including review and assessments

16
Learning Activities: ● Use a variety of instructional strategies such as: ● PARCC Released Items ● Inquiry-based Learning ● Problem-based Learning ● Project-based Learning ● Blended Learning ● Whiteboard Work ● Cooperative Learning ● Technology-based activities ● Do-Now Problems/Exit Problems ● Peer Editing ● Explicit Timing ● Guided Lecture
Textbook: Carter, John, et al, Algebra 1, Glencoe, McGraw-Hill, 2010 and 2012

17
Course Title: Algebra I Honors
Unit Title: Descriptive Statistics and Probability
Unit Number: 4
Curriculum Writers: Karen Cheney and Rachel Greeby
Desired Outcomes
Established Goals: NJSLS Supporting
● Summarize, represent, and interpret data on two categorical and quantitative variables (S.ID.5).
Additional ● Summarize, represent, and interpret data on a single count or measurement variable
(S.ID.2, S.ID.3). College and Career Readiness (+)
● Use probability to evaluate outcomes of decisions (S.MD.6).
● Use probability to evaluate outcomes of decisions (S.MD.5). ● Use the rules of probability to compute probabilities of compound events (S.CP.6, S.CP.7,
S.CP.8, S.CP.9).
Enduring Understandings:
● data can be represented in different forms
and the best representation of the data will
depend on the type of data
● the way real-world data is collected may yield
misleading results.
Essential Questions:
● How are statistics and probability
used in the real world?
● How can you make good decisions?
What factors can affect good
decision making?
● How does the way data is analyzed
or communicated influence the
way it is interpreted?
● How can different measures be
used to interpret and compare sets
of data?
Students will know:
18
● how to construct a histogram and a box-and-whiskers plot using graphing calculator
technology.
● how to use different measures to interpret and compare sets of data.
● how to analyze the composition and results of a statistical survey.
Students will be able to:
● classify and analyze samples and studies. ● identify sample statistics and population parameters. ● analyze data using statistics. ● describe and use the shape of a distribution to select appropriate statistics. ● determine the effect that transformations of data have on measures of central tendency
and variation. ● compare data using measures of central tendency and variation. ● calculate experimental probabilities. ● design simulations and summarize data from simulations ● design surveys and evaluate results. ● use permutations and combinations. ● find probabilities of compound events (independent and dependent, mutually exclusive
events). ● find the expected value of a probability distribution.
Assessment Evidence
Performance Tasks:
● Evaluating the Newspaper Find an article published in the newspaper that cites statistics from a study. Evaluate the design of the study and the source of the data. What might be a problem that could occur when conducting this survey? What biases could occur from their choice of a sample group? Evaluate how the data are analyzed and displayed. Is there a problem with the conclusion of the article? List five things to consider whenever you are evaluating published data in the media.
Other Evidence:
● Tests ● Quizzes ● DOLs ● Warmups

19
Learning Plan
Unit Pacing: 10 days including review and assessments Learning Activities:
● Use a variety of instructional strategies such as: ● PARCC Released Items ● Inquiry-based Learning ● Problem-based Learning ● Project-based Learning ● Blended Learning ● Whiteboard Work ● Cooperative Learning ● Technology-based activities ● Do-Now Problems/Exit Problems ● Peer Editing ● Explicit Timing ● Guided Lecture
Textbook: Carter, John, et al, Algebra 1, Glencoe, McGraw-Hill, 2010 and 2012
20
Course Title: Algebra I Honors
Unit Title: Advanced Functions and Equations
Unit Number: 5
Curriculum Writers: Karen Cheney and Rachel Greeby
Desired Outcomes
Established Goals: NJSLS Major
● Interpret functions that arise in applications in terms of context (F.IF.4). ● Solve equations and inequalities in one variable (A.REI.4a). ● Create equations that describe numbers or relationships (A.CED.2).
Supporting ● Analyze functions using different representations (F.IF.7b).
Additional ● Extend the properties of exponents to rational exponents (N.RN.2).
Enduring Understandings:
● radical expressions can be simplified.
● radical equations can be solved by
manipulation.
● a simplified version of an expression may be
more useful.
Essential Questions:
● How can you choose a model to
represent a real-world situation?
● How can simplifying mathematical
expressions be useful?
Students will know:
● the graph of starts at the origin and passes through the point (1, a). ● when the radicand contains no perfect square factors other than 1, it is said to be in
simplest form. ● adding and subtracting expressions with radicals uses the process of combining like terms.
For terms to be combined, their radicands must be the same. ● multiplying two radical expressions with two terms is similar to multiplying binomials. The
radicands do not have to be like radicands when multiplying. ● to solve radical equations, the radical must first be isolated on one side of the equation. ● trigonometry is the study of relationships among the angles and sides of a right triangle. ● a rational function is a function of the form y=p/q, where the numerator, p, and

21
denominator, q, are both polynomials. ● any value that makes the value of q equal to 0 is called an excluded value of the rational
function and must be excluded from the domain of the function. ● if both sides of a rational equation are single fractions, cross products or multiplying each
side of the equation by the LCD can be used to solve the resulting equation.
Students will be able to: Radical Functions
● graph and transform (dilations, reflections, translations) radical functions. ● simplify (Product Property, Quotient Property), add, subtract, and multiply radical
expressions with indeces of 2. ● solve radical equations (including those with extraneous solutions).
Geometry ● find trigonometric ratios of angles. ● use trigonometry to solve right triangles.
Rational Functions and Equations ● identify and use inverse variations. ● graph inverse variations. ● identify excluded values of rational functions. ● identify and use asymptotes to graph rational functions. ● solve rational equations. ● use rational equations to solve problems.
Assessment Evidence
Performance Tasks:
● Determine whether the following statement is true or false. Provide an example or counterexample to support your answer.
when x>0 and y>0 ● Provide a counterexample that is a specific
case to show that the statement is false: Any two right triangles with the same hypotenuse have the same area.
Other Evidence:
● Tests ● Quizzes ● Final Exam ● DOLs ● Warm-ups

22
Learning Plan
Unit Pacing: 11 days including review and assessments Learning Activities:
● Use a variety of instructional strategies such as: ● PARCC Released Items ● Inquiry-based Learning ● Problem-based Learning ● Project-based Learning ● Blended Learning ● Whiteboard Work ● Cooperative Learning ● Technology-based activities ● Do-Now Problems/Exit Problems ● Peer Editing ● Explicit Timing ● Guided Lecture
Textbook: Carter, John, et al, Algebra 1, Glencoe, McGraw-Hill, 2010 and 2012