Embed Size (px)
Citation preview
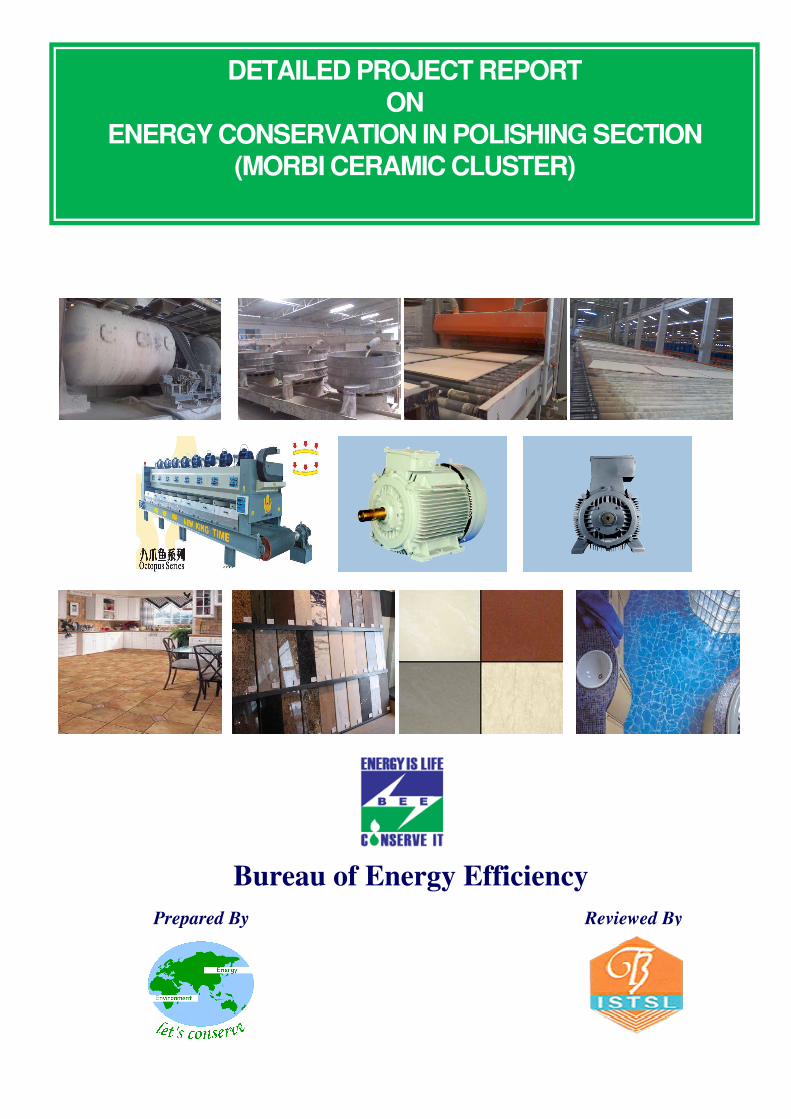
DETAILED PROJECT REPORT
ON
ENERGY CONSERVATION IN POLISHING SECTION
(MORBI CERAMIC CLUSTER)
Bureau of Energy Efficiency
Prepared By
Reviewed By
ENERGY CONSERVATION IN
POLISHING SECTION
MORBI CERAMIC CLUSTER

BEE, 2010
Detailed Project Report on Energy Conservation in Polishing Section
Ceramic SME Cluster, Morbi, Gujarat (India)
New Delhi: Bureau of Energy Efficiency;
Detail Project Report No.: MRV/CRM/EPS/06
For more information
Bureau of Energy Efficiency (BEE) Telephone +91-11-26179699
(Ministry of Power, Government of India) Fax +91-11-26178352
4th Floor, Sewa Bhawan Websites: www.bee-india.nic.in
R. K. Puram, New Delhi – 110066 Email: [email protected] / [email protected]

Acknowledgement
We sincerely appreciate the efforts of industry, energy auditors, equipment manufacturers,
technology providers, consultants and other experts in the area of energy conservation for
joining hands with Bureau of Energy Efficiency (BEE), Ministry of Power, and Government of
India for preparing the Detailed Project Report (DPR) under BEE SME Program in SMEs
clusters. We appreciate the support of suppliers/vendors for providing the adoptable energy
efficient equipments/technical details to the SMEs.
We have received very encouraging feedback for the BEE SME Program in various SME
Clusters. Therefore, it was decided to bring out the DPR for the benefits of SMEs. We
sincerely thank the officials of BEE, Executing Agencies and ISTSL for all the support and
cooperation extended for preparation of the DPR. We gracefully acknowledge the diligent
efforts and commitments of all those who have contributed in preparation of the DPR.

Contents
List of Annexure vii
List of Tables vii
List of Figures viii
List of Abbreviation viii
Executive summary ix
About BEE’S SME program xi
1 INTRODUCTION........................................................................................................... 1
1.1 Brief Introduction about cluster ..................................................................................... 1
1.2 Energy performance in existing system ........................................................................ 6
1.2.1 Fuel consumption .......................................................................................................... 6
1.2.2 Average annual production ........................................................................................... 6
1.2.3 Specific energy consumption ........................................................................................ 7
1.3 Existing technology/equipment ..................................................................................... 8
1.3.1 Description of existing technology ................................................................................. 8
1.3.2 Role in process ............................................................................................................. 8
1.4 Baseline establishment for existing technology ............................................................. 8
1.4.1 Design and operating parameters ................................................................................. 8
1.4.2 Specific electricity consumption ..................................................................................... 8
1.5 Barriers in adoption of proposed equipment ................................................................. 9
1.5.1 Technological barrier ..................................................................................................... 9
1.5.2 Financial barrier ............................................................................................................ 9
1.5.3 Skilled manpower .......................................................................................................... 9
1.5.4 Other barrier (If any) .................................................................................................... 10
2. PROPOSED EQUIPMENT FOR ENERGY EFFICENCY IMPROVEMENT ................. 11
2.1 Description of proposed equipment ............................................................................ 11
2.1.1 Detailed of proposed equipment .................................................................................. 11
2.1.2 Equipment/technology specification ............................................................................ 11
2.1.3 Integration with existing equipment ............................................................................. 11
2.1.4 Superiority over existing system .................................................................................. 11
2.1.5 Source of equipment ................................................................................................... 11
2.1.6 Availability of technology/equipment ........................................................................... 12
2.1.7 Service providers ........................................................................................................ 12
2.1.8 Terms and conditions in sales of equipment................................................................ 12
2.1.9 Process down time ...................................................................................................... 12
2.2 Life cycle assessment and risks analysis .................................................................... 12
2.3 Suitable unit for Implementation of proposed technology ............................................ 12
3. ECONOMIC BENEFITS FROM PROPOSED TECHNOLOGY .................................... 13
3.1 Technical benefit ........................................................................................................ 13
3.1.1 Fuel saving.................................................................................................................. 13
3.1.2 Electricity saving ......................................................................................................... 13
3.1.3 Improvement in product quality ................................................................................... 13
3.1.4 Increase in production ................................................................................................. 13
3.1.5 Reduction in raw material ............................................................................................ 13
3.1.6 Reduction in other losses ............................................................................................ 13
3.2 Monetary benefits ....................................................................................................... 13
3.3 Social benefits ............................................................................................................ 14
3.3.1 Improvement in working environment .......................................................................... 14
3.3.2 Improvement in workers skill ....................................................................................... 14
3.4 Environmental benefits ............................................................................................... 14
3.4.1 Reduction in effluent generation .................................................................................. 14
3.4.2 Reduction in GHG emission ........................................................................................ 14
3.4.3 Reduction in other emissions like SOX ........................................................................ 14
4 INSTALLATION OF PROPOSED EQUIPMENT ......................................................... 15

4.1 Cost of project ............................................................................................................ 15
4.1.1 Equipment cost ........................................................................................................... 15
4.1.2 Erection, commissioning and other misc. cost ............................................................. 15
4.2 Arrangements of funds ............................................................................................... 15
4.2.1 Entrepreneur’s contribution ......................................................................................... 15
4.2.2 Loan amount. .............................................................................................................. 15
4.2.3 Subsidy by Government .............................................................................................. 15
4.2.4 Terms & conditions of loan .......................................................................................... 16
4.3 Financial indicators ..................................................................................................... 16
4.3.1 Cash flow analysis ...................................................................................................... 16
4.3.2 Simple payback period ................................................................................................ 16
4.3.3 Net Present Value (NPV) ............................................................................................ 16
4.3.4 Internal rate of return (IRR) ......................................................................................... 16
4.3.5 Return on investment (ROI) ........................................................................................ 17
4.4 Sensitivity analysis...................................................................................................... 17
4.5 Procurement and implementation schedule ................................................................ 18
vii
List of Annexure
Annexure -1: Energy audit data used for baseline establishment ......................................... 19
Annexure -2: Process flow diagram after project implementation ......................................... 20
Annexure -3: Detailed technology assessment report .......................................................... 21
Annexure -4 Drawings for proposed electrical & civil works ................................................ 23
Annexure -5: Detailed financial analysis ............................................................................... 24
Annexure:-6 Procurement and implementation schedule .................................................... 28
Annexure -7: Details of technology service providers ........................................................... 29
Annexure–8: Quotations or Techno-commercial bids for new technology/equipment ........... 30
List of Table
Table 1.1 Details of annual energy consumption ....................................................................... 1
Table 1.2 Details of types of product manufactured ................................................................... 2
Table 1.3 Production wise unit breakups ................................................................................... 2
Table 1.4 Average fuel and electricity consumption ................................................................... 6
Table 1.5 Average annual production ........................................................................................ 6
Table 1.6 Specific energy consumption ..................................................................................... 7
Table 1.7 Equipment wise specific energy consumption ............................................................ 7
Table 1.8 Electricity consumption in polishing machine .............................................................. 8
Table 1.9 Specific electricity consumption in polishing machine ................................................. 8
Table 3.1 Energy and monetary benefit ................................................................................... 13
Table 4.1 Details of proposed technology project cost ............................................................. 15
Table 4.2 Financial indicators of proposed technology/equipment ........................................... 17
Table 4.3 Sensitivity analysis at different scenarios ................................................................. 17

viii
List of Figures
Figure 1.1Process flow diagram ................................................................................................ 5
List of Abbreviation
BEE Bureau of Energy Efficiency
EE Energy Efficient
SME Small and Medium Enterprises
DPR Detailed Project Report
GHG Green House Gases
CDM Clean Development Mechanism
DSCR Debt Service Coverage Ratio
NPV Net Present Value
IRR Internal Rate of Return
ROI Return on Investment
SCM Standard Cubic Meter
MWh Mega Watt hour
SIDBI Small Industrial Development Bank of India
ix
EXECUTIVE SUMMARY
SEE-Tech Solution Pvt. Ltd. is executing BEE-SME program in Morbi Ceramic Cluster,
supported by Bureau of Energy Efficiency (BEE) with an overall objective of improving the
energy efficiency in cluster units.
Morbi cluster is one of the largest ceramic clusters in India; accordingly this cluster was
chosen for energy efficiency improvements by implementing energy efficient
measures/technologies, so as to facilitate maximum replication in other ceramic clusters in
India. The main energy forms used in the cluster units are grid electricity, Natural gas,
charcoal, lignite and small quantity of diesel oil.
Polishing section is the major electricity consuming section in vitrified tiles industry. About 40 -
50% of total electricity consumption is consumed by the polishing section only. Polishing
process is required only in the manufacturing of vitrified tiles only. The motors installed at the
polishing machines are having a rated efficiency of about 70%. Also it was observed that the
loading of polishing machine is found less than 50%. Replacement of the existing motors of
polishing machine by energy efficient motors gives significant amount of electricity savings.
This DPR highlights the energy, environment, economic and social benefits of use of energy
efficient motors in polishing machine which is used in vitrified tiles industry.
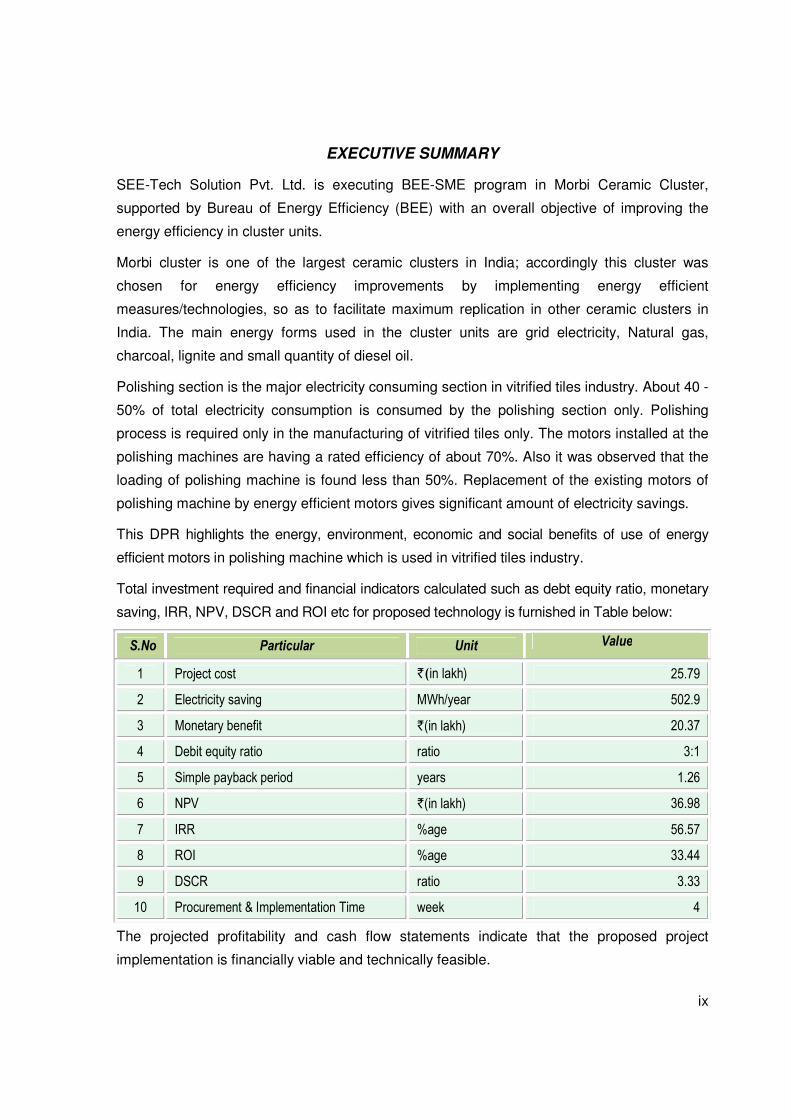
Total investment required and financial indicators calculated such as debt equity ratio, monetary
saving, IRR, NPV, DSCR and ROI etc for proposed technology is furnished in Table below:
S.No Particular Unit Value
1 Project cost `(in lakh) 25.79
2 Electricity saving MWh/year 502.9
3 Monetary benefit `(in lakh) 20.37
4 Debit equity ratio ratio 3:1
5 Simple payback period years 1.26
6 NPV `(in lakh) 36.98
7 IRR %age 56.57
8 ROI %age 33.44
9 DSCR ratio 3.33
10 Procurement & Implementation Time week 4
The projected profitability and cash flow statements indicate that the proposed project
implementation is financially viable and technically feasible.

x
ABOUT BEE’S SME PROGRAM
Bureau of Energy Efficiency (BEE) is implementing a BEE-SME Programme to improve the
energy performance in 25 selected SMEs clusters. Morbi Ceramic Cluster is one of them. The
BEE’s SME Programme intends to enhance the energy efficiency awareness by
funding/subsidizing need based studies in SME clusters and giving energy conservation
recommendations. For addressing the specific problems of these SMEs and enhancing
energy efficiency in the clusters, BEE will be focusing on energy efficiency, energy
conservation and technology up-gradation through studies and pilot projects in these SMEs
clusters.
Major activities in the BEE -SME program are furnished below:
Energy use and technology audit
The energy use technology studies would provide information on technology status, best
operating practices, gaps in skills and knowledge on energy conservation opportunities,
energy saving potential and new energy efficient technologies, etc for each of the sub sector
in SMEs.
Capacity building of stake holders in cluster on energy efficiency
In most of the cases SME entrepreneurs are dependent on the locally available technologies,
service providers for various reasons. To address this issue BEE has also undertaken
capacity building of local service providers and entrepreneurs/ Managers of SMEs on energy
efficiency improvement in their units as well as clusters. The local service providers will be
trained in order to be able to provide the local services in setting up of energy efficiency
projects in the clusters
Implementation of energy efficiency measures
To implement the technology up-gradation project in the clusters, BEE has proposed to
prepare the technology based detailed project reports (DPRs) for a minimum of five
technologies in three capacities for each technology.
Facilitation of innovative financing mechanisms for implementation of energy
efficiency projects
The objective of this activity is to facilitate the uptake of energy efficiency measures through
innovative financing mechanisms without creating market distortion
Energy Conservation In Polishing Section
1
1 INTRODUCTION
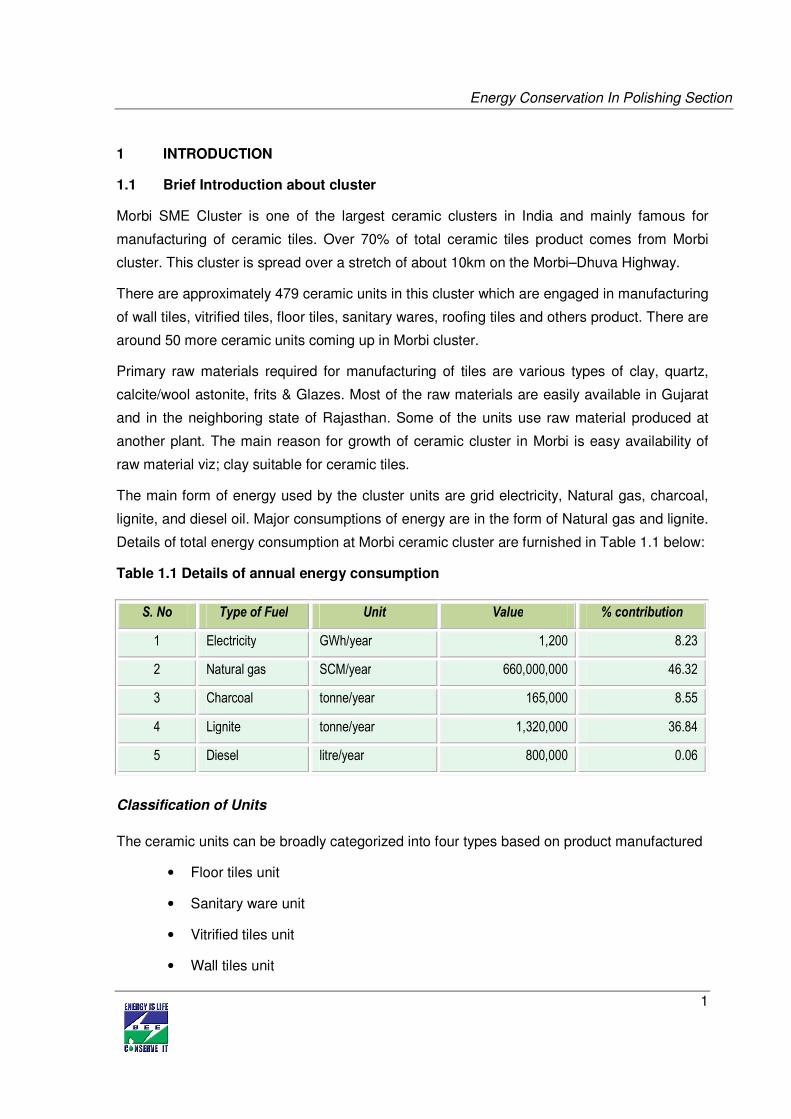
1.1 Brief Introduction about cluster
Morbi SME Cluster is one of the largest ceramic clusters in India and mainly famous for
manufacturing of ceramic tiles. Over 70% of total ceramic tiles product comes from Morbi
cluster. This cluster is spread over a stretch of about 10km on the Morbi–Dhuva Highway.
There are approximately 479 ceramic units in this cluster which are engaged in manufacturing
of wall tiles, vitrified tiles, floor tiles, sanitary wares, roofing tiles and others product. There are
around 50 more ceramic units coming up in Morbi cluster.
Primary raw materials required for manufacturing of tiles are various types of clay, quartz,
calcite/wool astonite, frits & Glazes. Most of the raw materials are easily available in Gujarat
and in the neighboring state of Rajasthan. Some of the units use raw material produced at
another plant. The main reason for growth of ceramic cluster in Morbi is easy availability of
raw material viz; clay suitable for ceramic tiles.
The main form of energy used by the cluster units are grid electricity, Natural gas, charcoal,
lignite, and diesel oil. Major consumptions of energy are in the form of Natural gas and lignite.
Details of total energy consumption at Morbi ceramic cluster are furnished in Table 1.1 below:
Table 1.1 Details of annual energy consumption
Classification of Units
The ceramic units can be broadly categorized into four types based on product manufactured
• Floor tiles unit
• Sanitary ware unit
• Vitrified tiles unit
• Wall tiles unit
S. No Type of Fuel Unit Value % contribution
1 Electricity GWh/year 1,200 8.23
2 Natural gas SCM/year 660,000,000 46.32
3 Charcoal tonne/year 165,000 8.55
4 Lignite tonne/year 1,320,000 36.84
5 Diesel litre/year 800,000 0.06
Energy Conservation In Polishing Section
2
Further the ceramic cluster is classified into three type based on capacity of unit viz small scale,
medium scale and large scale unit.
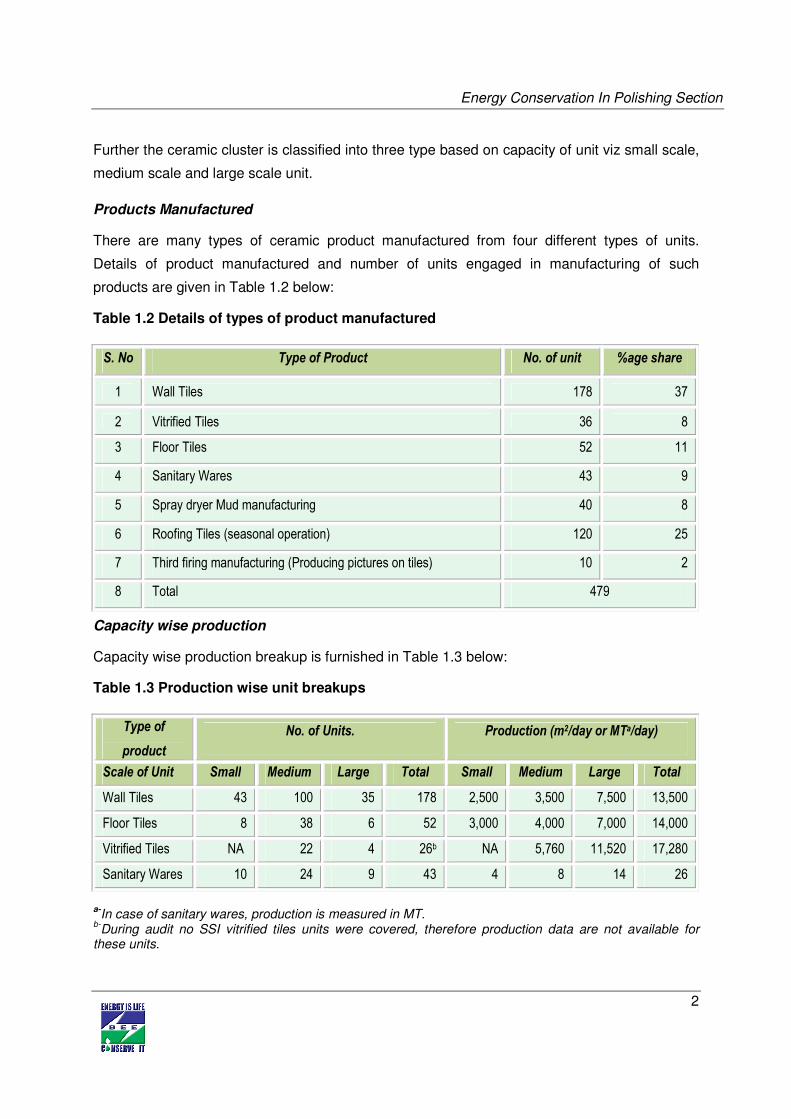
Products Manufactured
There are many types of ceramic product manufactured from four different types of units.
Details of product manufactured and number of units engaged in manufacturing of such
products are given in Table 1.2 below:
Table 1.2 Details of types of product manufactured
Capacity wise production
Capacity wise production breakup is furnished in Table 1.3 below:
Table 1.3 Production wise unit breakups
a-In case of sanitary wares, production is measured in MT.
b-During audit no SSI vitrified tiles units were covered, therefore production data are not available for
these units.
S. No Type of Product No. of unit %age share
1 Wall Tiles 178 37
2 Vitrified Tiles 36 8
3 Floor Tiles 52 11
4 Sanitary Wares 43 9
5 Spray dryer Mud manufacturing 40 8
6 Roofing Tiles (seasonal operation) 120 25
7 Third firing manufacturing (Producing pictures on tiles) 10 2
8 Total 479
Type of
product
No. of Units. Production (m2/day or MTa/day)
Scale of Unit Small Medium Large Total Small Medium Large Total
Wall Tiles 43 100 35 178 2,500 3,500 7,500 13,500
Floor Tiles 8 38 6 52 3,000 4,000 7,000 14,000
Vitrified Tiles NA 22 4 26b NA 5,760 11,520 17,280
Sanitary Wares 10 24 9 43 4 8 14 26

Energy Conservation In Polishing Section
3
Energy usages pattern
Average monthly electricity consumption in ceramic unit ranges from 1 lakh to 2 lakh kWh
depending on the size of the unit. In thermal energy, solid fuel such as lignite, charcoal,
Indonesian coal, briquette, etc are used in spray dryer and Natural gas is used in kiln in all
almost all units. Solid fuel consumption in spray dryer ranges from 80 to 160 kg/MT and.
Natural gas consumption in kiln varies from 1.01 to 1.4 SCM/m2 of tiles produced.
General production process for ceramic cluster
The units of Morbi ceramic cluster are involved in the manufacturing of 4 different types of
products such as floor tiles, wall tiles, vitrified tiles and sanitary wares. Production process for
manufacture of wall, floor and vitrified tiles is nearly the same except some differences in
process parameters while the manufacturing process of sanitary wares inter alia involves
manual moulding whereas in case of tiles, press is used to form the biscuits. General production
processes for manufacturing of ceramic products is are following:
Wet Grinding
The raw material such as clay, feldspar, quartz, calcite etc. are mixed with water in a proper
proportion and grind in a ball mill to make homogeneous mixture. Ball Mill is a batch type of
process. After completion of one batch of ball mill, slurry is sent to the underground tanks
containing the agitator motor in each tank to maintain the uniformity of mixture. Mainly blungers
are used for mixing and grinding in case of wall and floor tiles, while ball mills are used for
grinding in case of vitrified tiles.
Spray Drying
After preparation of slurry of required density it is stored in the underground tanks in which it is
agitated to maintain uniformity of slurry. The slurry is then pumped through a hydraulic pump
into the spray dryer where it is sprayed through nozzles. The material is dried in spray dryer to
remove the moisture added during the grinding process in a ball mill. The moisture in the raw
material is brought down to about 5–6 % from 35-40%. The product from spray dryer is stored in
silos. Hot flue gases at a temperature of about 550 – 600 oC is used as the heating source
which is generated by combustion of lignite, Indonesian coal, saw dust, briquette, Natural gas
etc.
Pressing/Moulding
The product from spray dryer is then sent to the press section which is pneumatically operated
Energy Conservation In Polishing Section
4
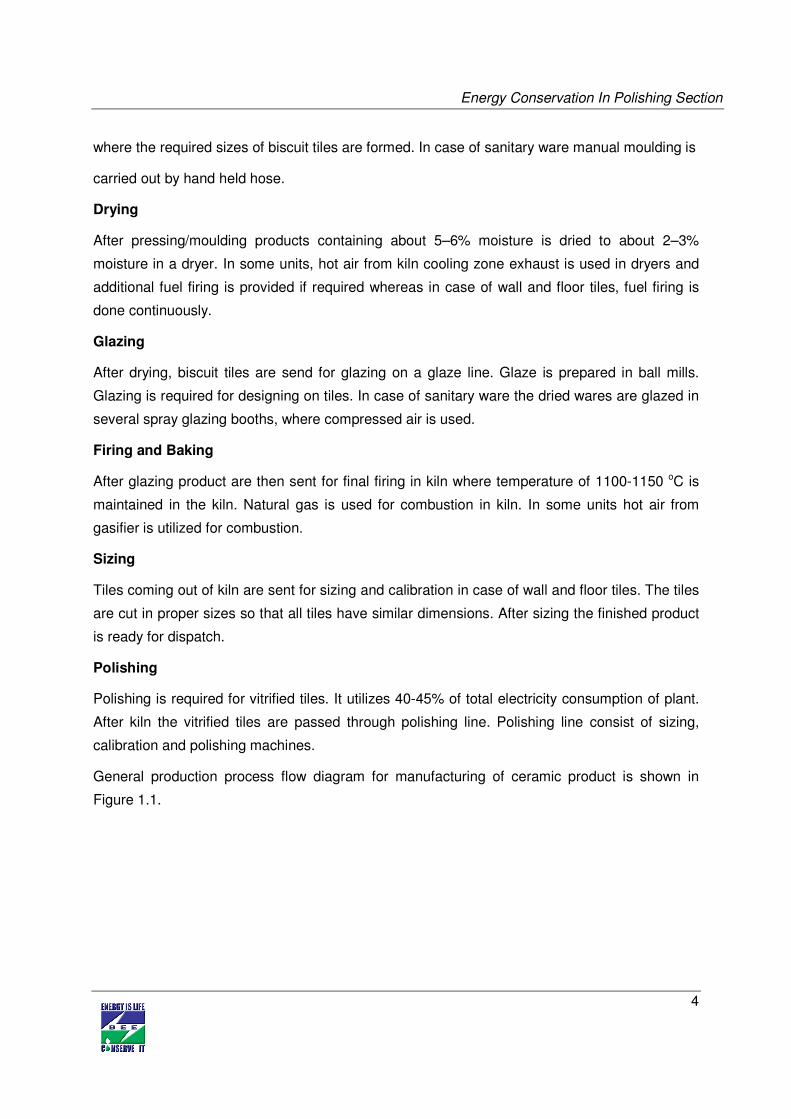
where the required sizes of biscuit tiles are formed. In case of sanitary ware manual moulding is
carried out by hand held hose.
Drying
After pressing/moulding products containing about 5–6% moisture is dried to about 2–3%
moisture in a dryer. In some units, hot air from kiln cooling zone exhaust is used in dryers and
additional fuel firing is provided if required whereas in case of wall and floor tiles, fuel firing is
done continuously.
Glazing
After drying, biscuit tiles are send for glazing on a glaze line. Glaze is prepared in ball mills.
Glazing is required for designing on tiles. In case of sanitary ware the dried wares are glazed in
several spray glazing booths, where compressed air is used.
Firing and Baking
After glazing product are then sent for final firing in kiln where temperature of 1100-1150 oC is
maintained in the kiln. Natural gas is used for combustion in kiln. In some units hot air from
gasifier is utilized for combustion.
Sizing
Tiles coming out of kiln are sent for sizing and calibration in case of wall and floor tiles. The tiles
are cut in proper sizes so that all tiles have similar dimensions. After sizing the finished product
is ready for dispatch.
Polishing
Polishing is required for vitrified tiles. It utilizes 40-45% of total electricity consumption of plant.
After kiln the vitrified tiles are passed through polishing line. Polishing line consist of sizing,
calibration and polishing machines.
General production process flow diagram for manufacturing of ceramic product is shown in
Figure 1.1.

Energy Conservation In Polishing Section
5
Water
Figure 1.1Process flow diagram
NG (Optional)
Water in Glaze room and
compressed air in glaze line
Fuel such as NG,
Coal, Briquette etc
Dryer Electricity
Polishing/Sizing
Electricity
Finished Product
Glaze Line &
Glaze Room
Kiln Electricity
Electricity
Ball Mill / Blunger
Electricity Fuel such as Lignite,
NG etc
Compressed Air
Raw Material
Agitation Tanks
Spray Dryer
Electricity
Electricity
Press/Moulding Electricity

Energy Conservation In Polishing Section
6
1.2 Energy performance in existing system
1.2.1 Fuel consumption
Average fuel and electricity consumption in a typical ceramic unit is given in Table 1.4 below:
Table 1.4 Average fuel and electricity consumption
1.2.2 Average annual production
Annual production in terms of m2/year is taken in case of tiles and in terms of MT/year in case of
sanitary wares is given in the following Table 1.5 below:
Table 1.5 Average annual production
Energy Electricity
(MWh per year)
Natural gas
(SCM per year)
Solid Fuel [lignite]
(Tonne per year)
Scale of Unit
Small Medium Large Small Medium Large Small Medium Large
Wall Tiles 900 1500 2400 750,000 1,050,000 2,250,000 2,400 2,880 3,600
Floor Tiles
900 1500 2400 900,000 1,200,000 2,100,000 3,600 4,200 4,800
Vitrified Tiles
NA 6000 12000 NA 2,700,000 6,000,000 NA 6,000 9,000
Sanitary Wares
2400 450 900 120,000 240,000 420,000 NA NA NA
S. No. Type of Industry
Production (m2/year) or MT/year
Small scale Medium scale Large scale
1 Vitrified Tiles 750,000 1,050,000 2,250,000
2 Wall Tiles 900,000 1,200,000 2,100,000
3 Floor Tiles NA 1,728,000 3,456,000
4 Sanitary Wares 1200 2400 4200

Energy Conservation In Polishing Section
7
1.2.3 Specific energy consumption
Specific energy consumption both electrical and thermal energy per m2 or MT of production for
different type of ceramic products are furnished in Table 1.6below:
Table 1.6 Specific energy consumption
Equipment wise specific energy consumption
The specific energy consumption of the equipments used in the ceramic industry is given in
Table 1.7 below wherever possible.
Table 1.7 Equipment wise specific energy consumption
C In sanitary ware production is measured in term of pieces only.
S. No. Type of Industry kWh/m2 or
kWh/piecec
SCM/m2 or
SCM/ piecec
1 Vitrified Tiles 3.71 - 5.01 1.51 - 3.11
2 Wall Tiles 0.61 - 2.47 0.68 - 1.65
3 Floor Tiles 1.51 - 1.92 1.28 - 1.8
4 Sanitary Wares 0.78 - 1.73 1.10 - 1.49
S.No Equipment Electrical energy Thermal energy
Unit Vale Unit value
1 Ball Mill/Blunger kWh/MT 4 -12 -
2 Agitation process kWh/m3/hr 0.2 - 0.8 -
3 Spray Dryer - - kg/MT 80 - 160
4 Press kWh/m2 0.22- 0.4 -
5 Dryer kWh/m2 0.011 SCM/m2 0 - 0.63
6 Glaze line + Glaze ball mill kWh/MT 2 - 9 -
7 Kiln kWh/m2 0.36 - 1.26 SCM/m2 1.01 -1.4
8 Polishing line/sizing kWh/m2 1.74 - 2.35 -

Energy Conservation In Polishing Section
8
1.3 Existing technology/equipment
1.3.1 Description of existing technology
Polishing process is required only in the manufacturing process of vitrified tiles only and it is the
major electricity consuming section in vitrified tiles industry. About 40 - 50 % of total electricity is
consumed by the polishing section. Polishing machine operates only for about 18 to 20 days in
a month depending on the production. Polishing machines assembled with all the components
is directly purchased by the ceramic unit owners from the vendors. The motors installed at the
polishing machines are having a rated efficiency of about 85%. Also it was observed that the
loading the polishing machine is found less than 50%. Replacement of the existing motors of
polishing machine by energy efficient motors gives significant amount of electricity savings.
1.3.2 Role in process
In polishing section, final finishing of the vitrified tiles has been carried out. Polishing line
consist of sizing, calibration and polishing machines.
1.4 Baseline establishment for existing technology
1.4.1 Design and operating parameters
Electricity consumption of the polishing section is given in Table 1.8 below:
Table 1.8 Electricity consumption in polishing machine
1.4.2 Specific electricity consumption
Specific electrical energy consumption in polishing section is given in Table 1.9 below:
Table 1.9 Specific electricity consumption in polishing machine
S. No. Energy Type Unit Value
Min Max
1 Electricity kWh/year 2108808 6580310
S. No. Section Unit Value
Min Max
1 Polishing section kWh/m2 1.37 2.28
Energy Conservation In Polishing Section
9
Specific electricity consumption of the sub sections of the polishing section is given in
Annexure- 1.
1.5 Barriers in adoption of proposed equipment
1.5.1 Technological barrier
In Morbi cluster, overall technical understanding on ceramic manufacturing is good and rapidly
increasing. Important equipments like kiln, polishing machine etc are bought from Italy (Sacmi)
and China (Modena), which are leading suppliers of these equipments world wide. Many of the
unit owners are frequently visiting international ceramic fairs and ceramic process equipment
suppliers, thus keeping them informed. It has been observed that at cluster level there is
committed interested for leadership and following up is quick. In general, there is readiness to
adopt provided delivery, outcome and results are demonstrated.
However the first change is still a challenge, upon success, later on duplication and adaptation
is extremely prevalent in the cluster. The technologies need to be demonstrated within the
cluster. While carrying out the audits and presenting the Energy audit reports to the units, in the
discussion with the plant owners & other personnel, many of them agreed with many of the
identified energy saving measures and technologies but they demanded demonstration of the
energy saving technologies in any plant and thereafter they have readiness to follow.
1.5.2 Financial barrier
Availing finance is not the major issue. Among the SMEs, the larger units, if convinced are
capable of either financing it themselves or get the finance from their banks. The smaller units
will require competitive loan and other support to raise the loan. However as most of them have
been able to expand their setup and grow, there is readiness to spend for energy efficiency
technologies which have good returns. Energy Efficiency Financing Schemes such as SIDBI’s, if
focused on the cluster, will play a catalytic role in implementation of identified energy
conservation projects & technologies.
1.5.3 Skilled manpower
In Morbi ceramic cluster, the availability of skilled manpower is one of the problems due to more
number of units. One local technical persons available at Morbi takes care of about 5-10
ceramic units. Maintenance or repair work of major equipments of ceramic units like kiln,
polishing machine etc, are generally taken care by the equipment suppliers itself as they station
one of their experienced technical representative at Morbi for the maintenance work.

Energy Conservation In Polishing Section
10
Specialized and focused training of the local service providers on better operation and
maintenance of the equipments, importance of the energy and its use and energy conservation
measures will improve awareness among the unit owners and workforce. Original equipment
suppliers should also participate in these programs.
1.5.4 Other barrier (If any)
Many of the new technology provider’s (especially some foreign technology leaders) have not
shown keen interest in implementation of their new innovative technologies. This appears to be
because of fear of duplication.
.

Energy Conservation In Polishing Section
11
2. PROPOSED EQUIPMENT FOR ENERGY EFFICENCY IMPROVEMENT
2.1 Description of proposed equipment
2.1.1 Detailed of proposed equipment
It was observed that the loading of the machines of polishing section is less than 50 %.
Efficiency of standard efficiency motors decreases significantly with the decrease in loading of
the induction motors. It is observed that the motors installed on the polishing machines have
rated efficiency of about 85% only. Therefore, there is more scope of saving in electricity
consumption by replacement of the existing motors of the polishing machines by the energy
efficient motors. New units can install energy efficient motors from beginning because payback
period for incremental cost is usually small.
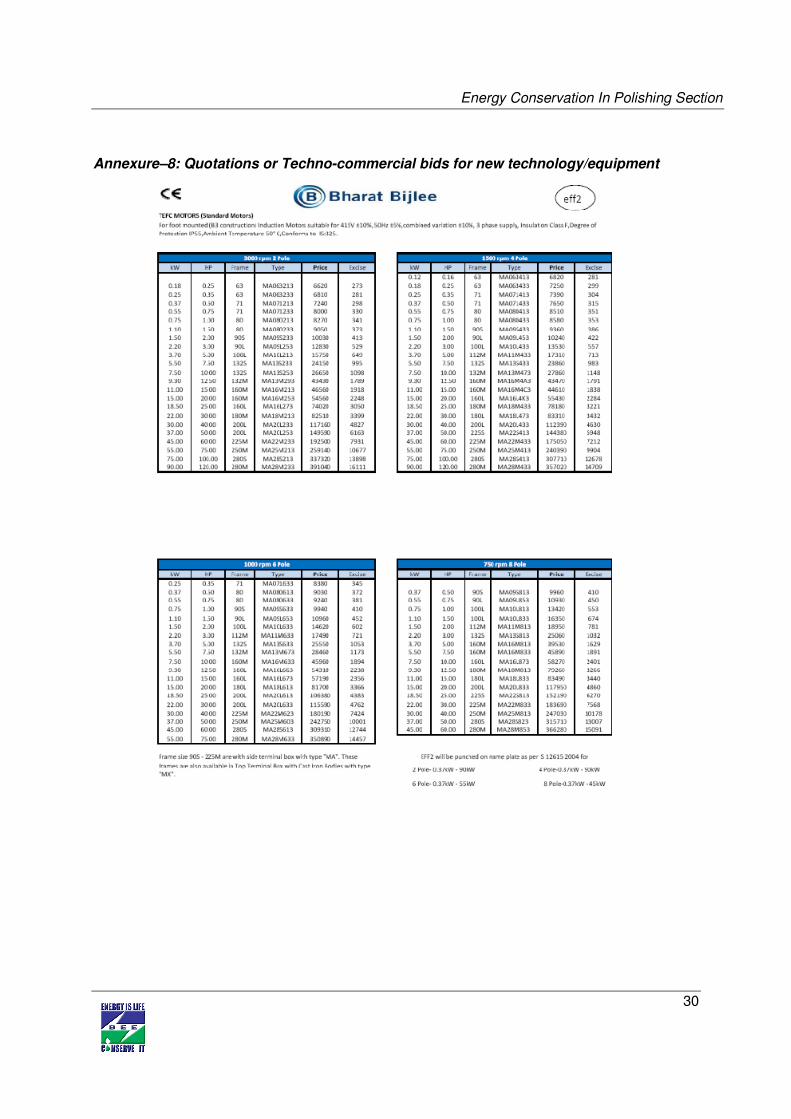
2.1.2 Equipment/technology specification
Technical specifications of the motors is given in the quotations attach in Annexure 8. The
motors are readymade available in the market. Only have to choose the correct one i.e.
suitable size.
2.1.3 Integration with existing equipment
The cluster has not yet tasted energy efficient (EE) motors therefore it is important to begin with
EE motors. Polishing motors in vitrified tile plants consume 40% to 45% of total electricity.
Therefore saving potential from this technology is very high. Here some of the Industrialists
have indicated that they may not be able to implement this technology in their existing plants as
the investment has been already made but they will definitely consider implementation of EE
motors in new plants. There are about 50 new plants coming up at Morbi.
2.1.4 Superiority over existing system
This project results in saving in electricity consumption in the polishing section which is the
major consumer of electricity in vitrified tiles manufacturing industry. It helps to save the
electricity consumption which is consuming more due to inefficiency of the existing motors.
2.1.5 Source of equipment
Energy efficient motors are already in use in most of the industries in India and got results in
electricity saving by replacement of the conventional motors by the energy efficient motors.

Energy Conservation In Polishing Section
12
2.1.6 Availability of technology/equipment
Suppliers of energy efficient motors are easily available at Gujarat. Even most of the suppliers
also start approaching by taking initiative from their side with industrialist to create the
awareness about the energy efficiency.
2.1.7 Service providers
Details of technology service providers are shown in Annexure 7.
2.1.8 Terms and conditions in sales of equipment
Warranty period of one year will be provided after the sale of the motor.
2.1.9 Process down time
Polishing machine in ceramic industry operates for about 18 to 20 days in a month. Proposed
project only requires the replacement of the existing motors by the new energy efficient motors
and this can be done easily during the non operation period of the polishing machine.
2.2 Life cycle assessment and risks analysis
Life of the equipment is about 10 to 15 years. Risk involves in the installation of proposed
project are as follows:
• Lack of initiative of the unit owner
• Fear of affecting the quality of product because of replacement.
• Availability of skilled manpower in industry
2.3 Suitable unit for Implementation of proposed technology
Suitable unit for implementation of this technology are vitrified unit having the production
capacity of about 5929 m2 per day and having total electricity consumption is about 54,58,560
kWh per year.

Energy Conservation In Polishing Section
13
3. ECONOMIC BENEFITS FROM PROPOSED TECHNOLOGY
3.1 Technical benefit
3.1.1 Fuel saving
Implementation of this project does not resulting in reduction in fuel consumption in ceramic
industry.
3.1.2 Electricity saving
In most of the ceramic unit motors installed on the polishing machines having rated efficiency is
of about 70%. During electrical measurements, it has been observed that the load on most of
the machines of polishing section is less than 50%. Since efficiency of motor decreases with
decrease in load of the motor. Therefore, there is huge potential of electricity saving by just
replacing existing conventional motors of the polishing machines by new energy efficient
motors. Implementation of this project reduces the electricity consumption of polishing section
by about 5,02,908 kWh per year of total electricity consumption in polishing section.
3.1.3 Improvement in product quality
Product quality achieved would be same as in the present quality. It does not have any impact
on the improvement in the quality of the product.
3.1.4 Increase in production
Implementation of this project will not lead to any increase in production.
3.1.5 Reduction in raw material
Raw material consumption is same even after the implementation of proposed technology.
3.1.6 Reduction in other losses
There is no other reduction losses
3.2 Monetary benefits
Implementation of proposed project saves about 5,02,908 kWh electricity per year hence, total
monetary benefit is ` 20.36 per year. Detail of monetary saving is furnished in table 3.1 below:
Table 3.1 Energy and monetary benefit
S.No Parameter Unit Value
1 Present electricity consumption in a unit MWh/year 2108.08
Energy Conservation In Polishing Section
14
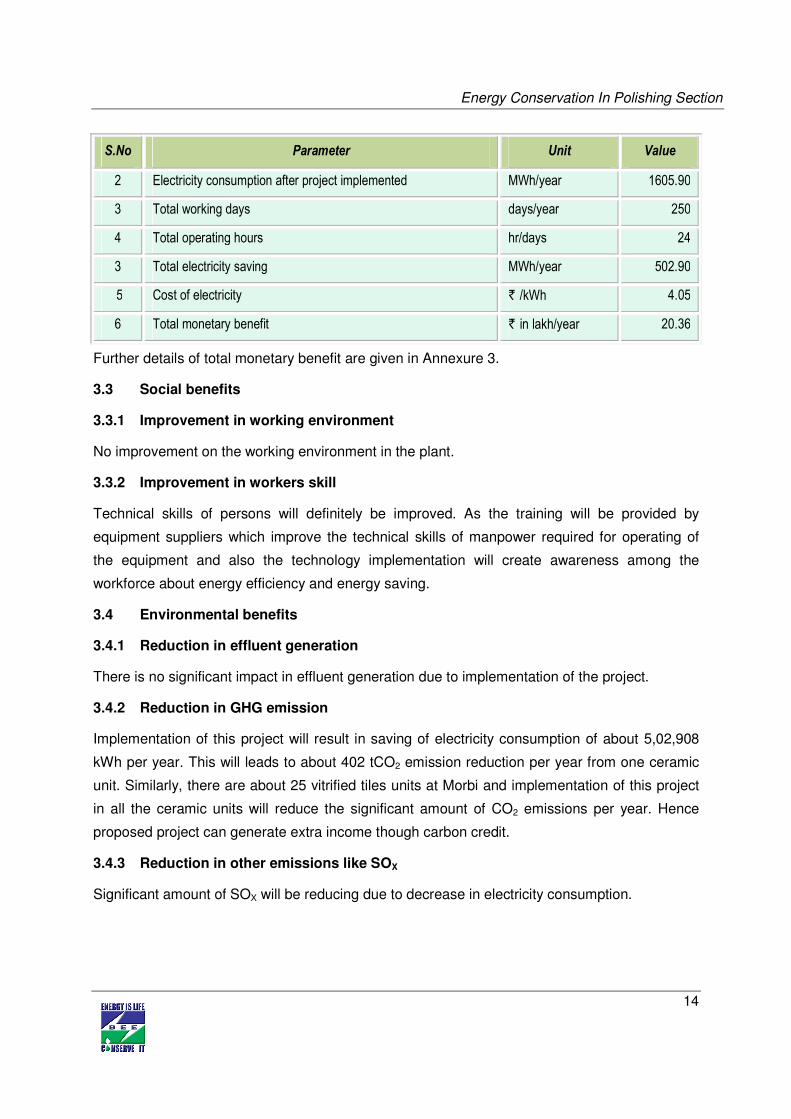
S.No Parameter Unit Value
2 Electricity consumption after project implemented MWh/year 1605.90
3 Total working days days/year 250
4 Total operating hours hr/days 24
3 Total electricity saving MWh/year 502.90
5 Cost of electricity ` /kWh 4.05
6 Total monetary benefit ` in lakh/year 20.36
Further details of total monetary benefit are given in Annexure 3.
3.3 Social benefits
3.3.1 Improvement in working environment
No improvement on the working environment in the plant.
3.3.2 Improvement in workers skill
Technical skills of persons will definitely be improved. As the training will be provided by
equipment suppliers which improve the technical skills of manpower required for operating of
the equipment and also the technology implementation will create awareness among the
workforce about energy efficiency and energy saving.
3.4 Environmental benefits
3.4.1 Reduction in effluent generation
There is no significant impact in effluent generation due to implementation of the project.
3.4.2 Reduction in GHG emission
Implementation of this project will result in saving of electricity consumption of about 5,02,908
kWh per year. This will leads to about 402 tCO2 emission reduction per year from one ceramic
unit. Similarly, there are about 25 vitrified tiles units at Morbi and implementation of this project
in all the ceramic units will reduce the significant amount of CO2 emissions per year. Hence
proposed project can generate extra income though carbon credit.
3.4.3 Reduction in other emissions like SOX
Significant amount of SOX will be reducing due to decrease in electricity consumption.

Energy Conservation In Polishing Section
15
4 INSTALLATION OF PROPOSED EQUIPMENT
4.1 Cost of project
4.1.1 Equipment cost
Total cost of new energy efficient motors will be about ` 20.21 lakh.
4.1.2 Erection, commissioning and other misc. cost
Other cost includes cost of commissioning, implementation during implementation and man
power cost. Details of total project cost requires for implementation of proposed technology are
furnished in Table 4.1 below:
Table 4.1 Details of proposed technology project cost
S.No Particular Unit Value
1 Cost of motors ` (in lakh) 20.21
2 Erection & Commissioning cost ` (in lakh) 1.01
3 Interest during implementation ` (in lakh) 0.53
4 Taxes( VAT) ` (in lakh) 1.01
4 Other misc. cost ` (in lakh) 3.03
5 Total cost ` (in lakh) 25.79
4.2 Arrangements of funds
4.2.1 Entrepreneur’s contribution
The total cost of the proposed technology is estimated at ` 25.79 lakh. The entrepreneur’s
contribution is 25% of total project cost, which is ` 6.45 lakh.
4.2.2 Loan amount.
The term loan is 75% of the total project cost, which is ` 19.34 lakh.
4.2.3 Subsidy by Government
As the overall energy efficiency in the project is more than 15% it qualifies for subsidy of 25 % of
the project cost as per the NMCP scheme of Ministry of MSME, GoI. 25 % of the project cost in

Energy Conservation In Polishing Section
16
this case works out to ` 6.45 lakh. As the subsidy is normally available after implementation of
the project the same has not been taken in the project cost and means of finance. On receipt of
subsidy from Ministry of MSME, GoI through the nodal agency the amount of subsidy is
generally set off [reduced] from the loan outstanding by the lender bank. Availability of this
subsidy will make the project economically more attractive.
4.2.4 Terms & conditions of loan
The interest rate is considered at 10% which is SIDBI’s rate of interest for energy efficient
projects. The loan tenure is 5 years excluding initial moratorium period is 6 months from the
date of first disbursement of loan.
4.3 Financial indicators
4.3.1 Cash flow analysis
Profitability and cash flow statements have been worked out for a period of 6 years. The
financials have been worked out on the basis of certain reasonable assumptions, which are
outlined below.
The project is expected to achieve monetary savings of ` 20.37 lakh per year.
• The Operation and Maintenance cost is estimated at 5% of cost of total project with 3%
increase in every year as escalations.
• Interest on term loan is estimated at 10%.
• Depreciation is provided as per the rates provided in the companies act.
Considering the above mentioned assumptions, net cash accruals starting with ` 15.83 lakh in
the first year operation and gradually increases to ` 59.19 lakh at the end of sixth year.
4.3.2 Simple payback period
The total project cost of the proposed technology is ` 25.79 lakh and monetary savings is
`20.37 lakh hence the simple payback period works out to be 1.26 years.
4.3.3 Net Present Value (NPV)
The Net present value of the investment at 10% works out to be ` 36.98 lakh.
4.3.4 Internal rate of return (IRR)
The after tax internal rate of return of the project works out to be 56.57%. Thus the project is
financially viable.

Energy Conservation In Polishing Section
17
4.3.5 Return on investment (ROI)
The average return on investment of the project activity works out at 33.44%.
Details of financial indicator are shown in Table 4.2 below:
Table 4.2 Financial indicators of proposed technology/equipment
S.No Particulars Unit Value
1 Simple Pay Back period Month 15
2 IRR %age 56.57
3 NPV lakh 36.98
4 ROI %age 33.44
5 DSCR Ratio 3.33
4.4 Sensitivity analysis
A sensitivity analysis has been carried out to ascertain how the project financials would behave
in different situations like when there is an increase in fuel savings or decrease in fuel savings.
For the purpose of sensitive analysis, two following scenarios has been considered
• Optimistic scenario (Increase in fuel savings by 5%)
• Pessimistic scenario (Decrease in fuel savings by 5%)
In each scenario, other inputs are assumed as a constant. The financial indicators in each of the
above situation are indicated along with standard indicators.
Details of sensitivity analysis at different scenarios are shown in Table 4.3 below:
Table 4.3 Sensitivity analysis at different scenarios
Particulars DSCR IRR ROI NPV
Normal 3.33 56.57% 33.44% 36.98
5% increase in fuel savings 3.50 60.38% 33.66% 40.23
5% decrease in fuel savings 3.16 52.75% 33.19% 33.74

Energy Conservation In Polishing Section
18
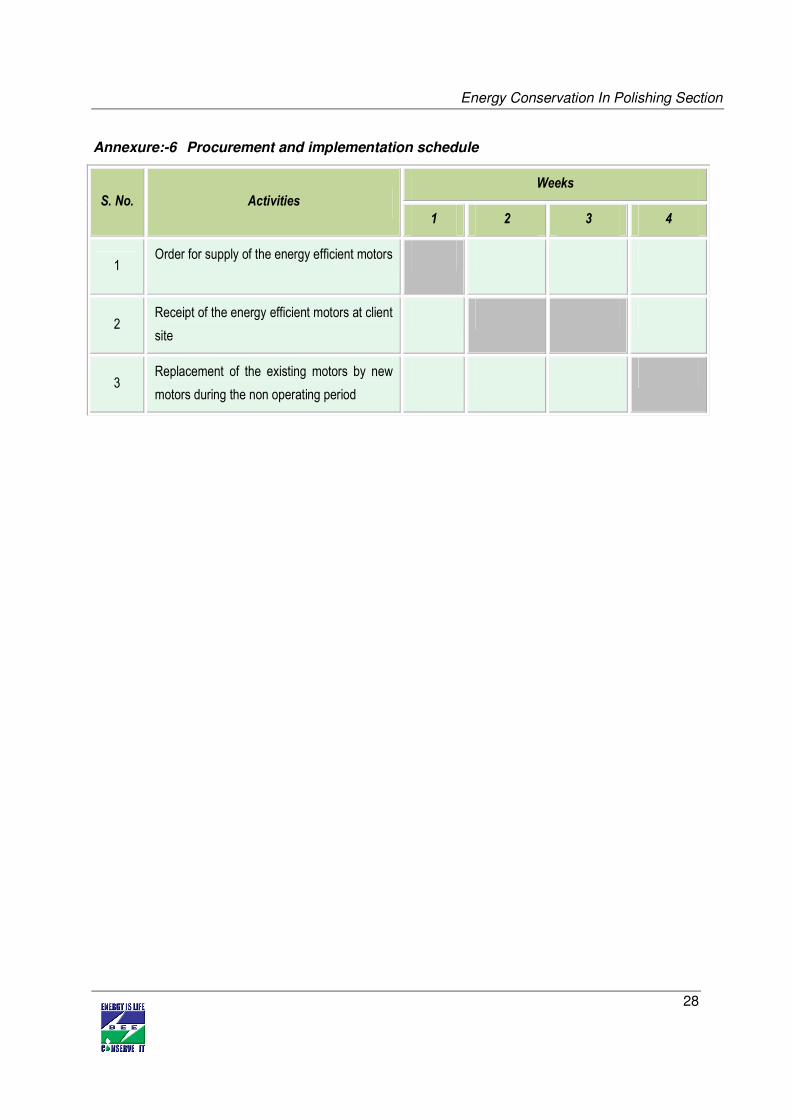
4.5 Procurement and implementation schedule
Total procurement period for implementation of this technology requires 4 weeks and their
details are shown in Annexure 6.

Energy Conservation In Polishing Section
19
Annexure
Annexure -1: Energy audit data used for baseline establishment
Specific electricity consumption of sub section of polishing section is given below.
S. No. Section
Specific Electricity Consumption (kWh/year)
Min Max
1 Sizing 117997 674611
2 Rough Grinding 182218 628462
3 Calibration 349056 1136554
4 Polishing 1158120 4644432

Energy Conservation In Polishing Section
20
Raw Material
BallMill Blunger
Agitation Tanks
Spray Dryer
Press
Dryer
Glaze Line & Glaze Room
Kiln
Polishing/Sizing
Finished Product
Electricity
Electricity
Electricity
Electricity
Electricity
Electricity
Electricity
Electricity
Water
Fuel such as
Lignite, NG etc
Compressed Air
NG (Optional)
Water in Glaze room andcompressed air in glaze
line
Fuel such as NG, Coal,Briquette etc
Proposed
Project
Annexure -2: Process flow diagram after project implementation
Energy Conservation In Polishing Section
21
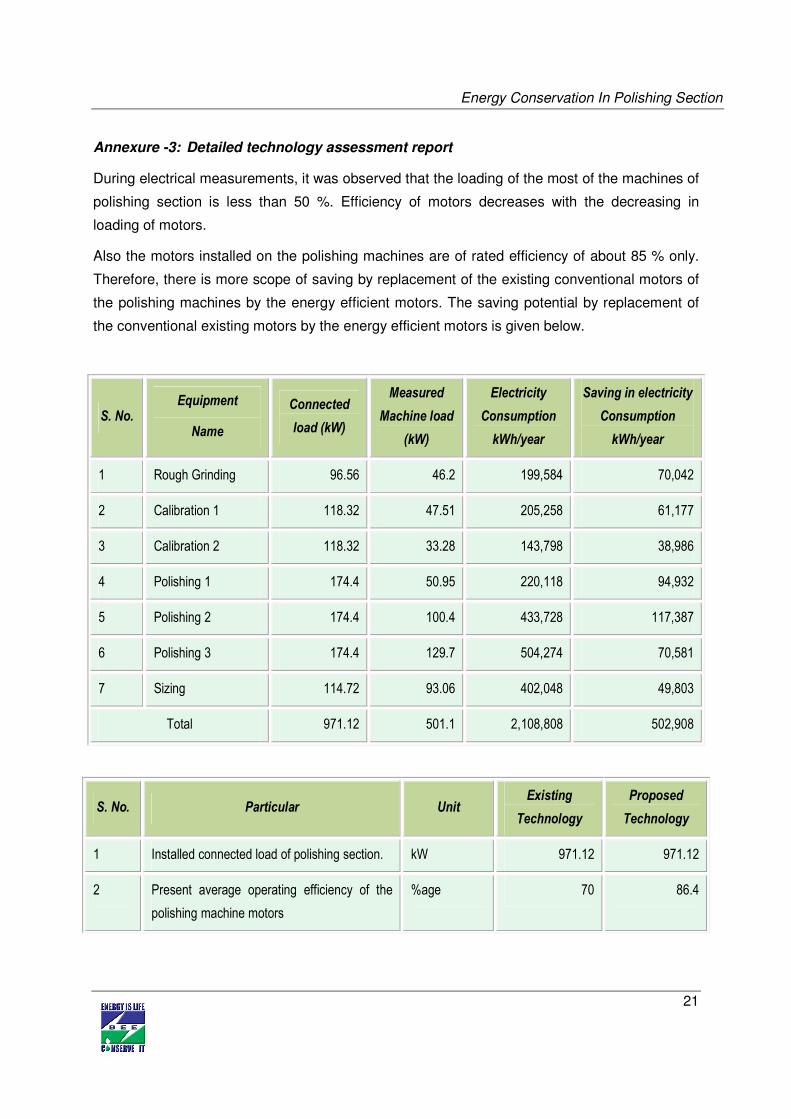
Annexure -3: Detailed technology assessment report
During electrical measurements, it was observed that the loading of the most of the machines of
polishing section is less than 50 %. Efficiency of motors decreases with the decreasing in
loading of motors.
Also the motors installed on the polishing machines are of rated efficiency of about 85 % only.
Therefore, there is more scope of saving by replacement of the existing conventional motors of
the polishing machines by the energy efficient motors. The saving potential by replacement of
the conventional existing motors by the energy efficient motors is given below.
S. No. Equipment
Name
Connected
load (kW)
Measured
Machine load
(kW)
Electricity
Consumption
kWh/year
Saving in electricity
Consumption
kWh/year
1 Rough Grinding 96.56 46.2 199,584 70,042
2 Calibration 1 118.32 47.51 205,258 61,177
3 Calibration 2 118.32 33.28 143,798 38,986
4 Polishing 1 174.4 50.95 220,118 94,932
5 Polishing 2 174.4 100.4 433,728 117,387
6 Polishing 3 174.4 129.7 504,274 70,581
7 Sizing 114.72 93.06 402,048 49,803
Total 971.12 501.1 2,108,808 502,908
S. No. Particular Unit Existing
Technology
Proposed
Technology
1 Installed connected load of polishing section. kW 971.12 971.12
2 Present average operating efficiency of the
polishing machine motors
%age 70 86.4

Energy Conservation In Polishing Section
22
S. No. Particular Unit Existing
Technology
Proposed
Technology
3 Electricity Consumption in polishing section kWh/year 21,08,808 16,05,900
4 Working days in a year days 250 250
5 Cost of electricity ` / kWh 4.05 4.05
6 Energy cost of polishing section ` in lakh /year 85.4 65.04
7 Electricity Saving in polishing section kWh/year - 5,02,908
8 Monetary Saving in polishing section ` in lakh /year 20.36

Energy Conservation In Polishing Section
23
Annexure -4 Drawings for proposed electrical & civil works
Not applicable.
This project requires the replacement of the existing motors by the new energy efficient motors.

Energy Conservation In Polishing Section
24
Annexure -5: Detailed financial analysis
Assumption
Name of the Technology
Rated Capacity
Details Unit Value Basis
Installed Capacity MW Feasibility Study
No of working days Days Feasibility Study
No of Shifts per day Shifts Feasibility Study
Capacity Utilization Factor %age Feasibility Study
Proposed Investment
Plant & Machinery ` (in lakh) 20.21 Feasibility Study
Erection & Commissioning ` (in lakh) 1.01 Feasibility Study
Investment without IDC ` (in lakh) 21.22 Feasibility Study
Interest During Implementation ` (in lakh) 0.53 Feasibility Study
Taxes(VAT) ` (in lakh) 1.01 Feasibility Study
Other charges(Contingency) ` (in lakh) 3.03 Feasibility Study
Total Investment ` (in lakh) 25.79 Feasibility Study
Financing pattern
Own Funds (Equity) ` (in lakh) 6.45 Feasibility Study
Loan Funds (Term Loan) ` (in lakh) 19.34 Feasibility Study
Loan Tenure years 5 Assumed
Moratorium Period Months 6 Assumed
Repayment Period Months 66 Assumed
Interest Rate %age 10.00 SIDBI Lending rate
Estimation of Costs
O & M Costs % on Plant & Equip 5.00 Feasibility Study
Annual Escalation %age 3.00 Feasibility Study
Estimation of Revenue
Electricity saving kWh/year 502900
Cost of electricity ` / kWh 4.05
Cost of Natural gas ` / SCM 15
St. line Depn. %age 5.28 Indian Companies Act
IT Depreciation %age 80.00 Income Tax Rules
Income Tax %age 33.99 Income Tax

Energy Conservation In Polishing Section
25
Estimation of Interest on Term Loan (`̀̀̀ in lakh)
Years Opening Balance Repayment Closing Balance Interest
1 19.34 1.50 17.84 1.74 2 17.84 3.36 14.48 1.63
3 14.48 3.84 10.64 1.27
4 10.64 4.08 6.56 0.88
5 6.56 4.20 2.36 0.47
6 2.36 2.36 0.00 0.07
7 19.34
WDV Depreciation
Particulars / years 1 2 3 4 5
Plant and Machinery
Cost 21.75 4.35 0.87 0.17 0.03
Depreciation 17.40 3.48 0.70 0.14 0.03
WDV 4.35 0.87 0.17 0.03 0.01
Projected Profitability
Particulars / Years 1 2 3 4 5 6
Revenue through Savings
Fuel savings 20.37 20.37 20.37 20.37 20.37 20.37
Total Revenue (A) 20.37 20.37 20.37 20.37 20.37 20.37
Expenses
O & M Expenses 1.29 1.33 1.37 1.41 1.45 98.44
Total Expenses (B) 1.29 1.33 1.37 1.41 1.45 98.44
PBDIT (A)-(B) 19.08 19.04 19.00 18.96 18.92 429.01
Interest 1.74 1.63 1.27 0.88 0.47 45.37
PBDT 17.33 17.41 17.73 18.08 18.45 383.64
Depreciation 1.36 1.36 1.36 1.36 1.36 81.45
PBT 15.97 16.05 16.36 16.72 17.09 302.19
Income tax 0.00 4.73 5.79 6.10 6.26 130.23
Profit after tax (PAT) 15.97 11.31 10.58 10.62 10.83 171.95
Computation of Tax `̀̀̀ (in lakh)
Particulars / Years 1 2 3 4 5 6
Profit before tax 15.97 16.05 16.36 16.72 17.09 17.44
Add: Book depreciation 1.36 1.36 1.36 1.36 1.36 1.36
Less: WDV depreciation 17.40 3.48 0.70 0.14 0.03 -
Taxable profit (0.07) 13.93 17.03 17.94 18.42 18.81
Income Tax - 4.73 5.79 6.10 6.26 6.39

Energy Conservation In Polishing Section
26
Projected Balance Sheet `̀̀̀ (in lakh)
Particulars / Years 1 2 3 4 5 6
Liabilities
Share Capital (D) 6.45 6.45 6.45 6.45 6.45 6.45
Reserves & Surplus (E) 15.97 27.28 37.86 48.48 59.30 70.36
Term Loans (F) 17.84 14.48 10.64 6.56 2.36 0.00
Total Liabilities D)+(E)+(F) 40.26 48.22 54.95 61.49 68.12 76.81
Assets
Gross Fixed Assets 25.79 25.79 25.79 25.79 25.79 25.79
Less: Accm. Depreciation 1.36 2.72 4.09 5.45 6.81 8.17
Net Fixed Assets 24.43 23.07 21.71 20.35 18.98 17.62
Cash & Bank Balance 15.83 25.15 33.24 41.15 49.13 59.19
Total Assets 40.26 48.22 54.95 61.49 68.12 76.81
Net Worth 22.42 33.73 44.31 54.93 65.75 76.80
Dept equity ratio 0.80 0.43 0.24 0.12 0.04 0.00
Projected Cash Flow: `̀̀̀ (in lakh)
Particulars / Years 0 1 2 3 4 5 6
Sources
Share Capital 6.45 - - - - - -
Term Loan 19.34
Profit After tax 15.97 11.31 10.58 10.62 10.83 11.05
Depreciation 1.36 1.36 1.36 1.36 1.36 1.36
Total Sources 25.79 17.33 12.67 11.94 11.98 12.19 12.41
Application
Capital Expenditure 25.79
Repayment of Loan - 1.50 3.36 3.84 4.08 4.20 2.36
Total Application 25.79 1.50 3.36 3.84 4.08 4.20 2.36
Net Surplus - 15.83 9.31 8.10 7.90 7.99 10.05
Add: Opening Balance - - 15.83 25.15 33.24 41.15 49.13
Closing Balance - 15.83 25.15 33.24 41.15 49.13 59.19
Calculation of Internal Rate of Return `̀̀̀ (in lakh)
Particulars / months 0 1 2 3 4 5 6
Profit after Tax 15.97 11.31 10.58 10.62 10.83 11.05
Depreciation 1.36 1.36 1.36 1.36 1.36 1.36
Interest on Term Loan 1.74 1.63 1.27 0.88 0.47 0.07
Salvage/Realizable value - - - - - - -
Cash outflow (25.79) - - - - - -
Net Cash flow (25.79) 19.08 14.31 13.21 12.86 12.65 12.48
IRR 56.57%
NPV 36.98

Energy Conservation In Polishing Section
27
Break Even Point `̀̀̀ (in lakh)
Particulars / Years 1 2 3 4 5 6
Variable Expenses
Oper. & Maintenance Exp (75%) 0.97 1.00 1.03 1.06 1.09 1.12 Sub Total (G) 0.97 1.00 1.03 1.06 1.09 1.12
Fixed Expenses
Oper. & Maintenance Exp (25%) 0.32 0.33 0.34 0.35 0.36 0.37
Interest on Term Loan 1.74 1.63 1.27 0.88 0.47 0.07
Depreciation (H) 1.36 1.36 1.36 1.36 1.36 1.36
Sub Total (I) 3.43 3.33 2.98 2.59 2.19 1.80
Sales (J) 20.37 20.37 20.37 20.37 20.37 20.37
Contribution (K) 19.40 19.37 19.34 19.31 19.28 19.25
Break Even Point (L= G/I) 17.67% 17.17% 15.39% 13.43% 11.36% 9.36%
Cash Break Even {(I)-(H)} 10.65% 10.14% 8.35% 6.37% 4.30% 2.29%
Break Even Sales (J)*(L) 3.60 3.50 3.14 2.73 2.31 190.74%
Return on Investment ` ` ` ` (in lakh)
Particulars / Years 1 2 3 4 5 6 Total
Net Profit Before Taxes 15.97 16.05 16.36 16.72 17.09 17.44 99.63
Net Worth 22.42 33.73 44.31 54.93 65.75 76.80 297.94
33.44%
Debt Service Coverage Ratio `̀̀̀ (in lakh)
Particulars / Years 1 2 3 4 5 6 Total
Cash Inflow
Profit after Tax 15.97 11.31 10.58 10.62 10.83 11.05 70.36
Depreciation 1.36 1.36 1.36 1.36 1.36 1.36 8.17
Interest on Term Loan 1.74 1.63 1.27 0.88 0.47 0.07 6.06
Total (M) 19.08 14.31 13.21 12.86 12.65 12.48 84.59
Debt
Interest on Term Loan 1.74 1.63 1.27 0.88 0.47 0.07 6.06
Repayment of Term Loan 1.50 3.36 3.84 4.08 4.20 2.36 19.34
Total (N) 3.24 4.99 5.11 4.96 4.67 2.43 25.40
Average DSCR (M/N) 3.33
Energy Conservation In Polishing Section
28
Annexure:-6 Procurement and implementation schedule
S. No. Activities
Weeks
1 2 3 4
1 Order for supply of the energy efficient motors
2 Receipt of the energy efficient motors at client
site
3 Replacement of the existing motors by new
motors during the non operating period

Energy Conservation In Polishing Section
29
Annexure -7: Details of technology service providers
S.No. Name of Service Provider and address Contact Person mobile no. and email ID
1.
ABB Ltd
ABB Limited, RN Kalkaji
Mr. Dinesh Mistry
09724334560
2.
LUBI Group of industries
Near Kalyan Mills, Naroda Road,
Ahmedabad - 380 025
INDIA.
Mr. Ruturaj Rajaji
09825040538
3.
National Electrical Industry
2 nd floor , vimla complex, Old Sharda Mandir Rlwy
Crossing, Ahmedabad-380006, Gujrat ,India
Mr.Anuj Patel
9898084805
[email protected], [email protected]
4.
BHARAT BIJLEE LTD.
Arth, 8-Rashmi Society,
Behind A. K. Patel House,
Mithakhali, Cross Road,
Ahmedabad - 380 009
Mr. Varma
(sr. manager)
09869271084
5.
Siemens Ltd
Arth, 8-Rashmi Society,
Behind A. K. Patel House,
Mithakhali, Cross Road,
Ahmedabad - 380 009
Mr. Arvind Mehta
9825506565
6.
Crompton Greaves Limited.
CG House, 6th Floor, Dr. annie Besant Road, Worli,
Mumbai - 400 030,
Mr. Suyog Deshpande
9545591550
Energy Conservation In Polishing Section
30
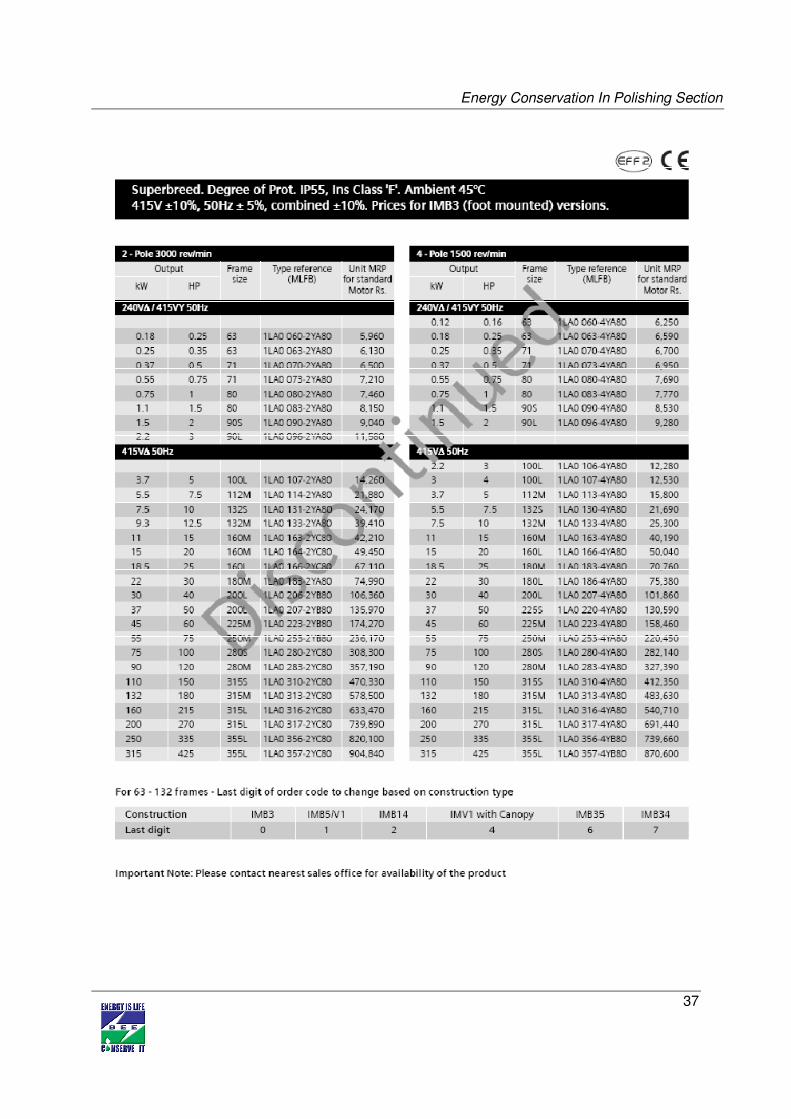
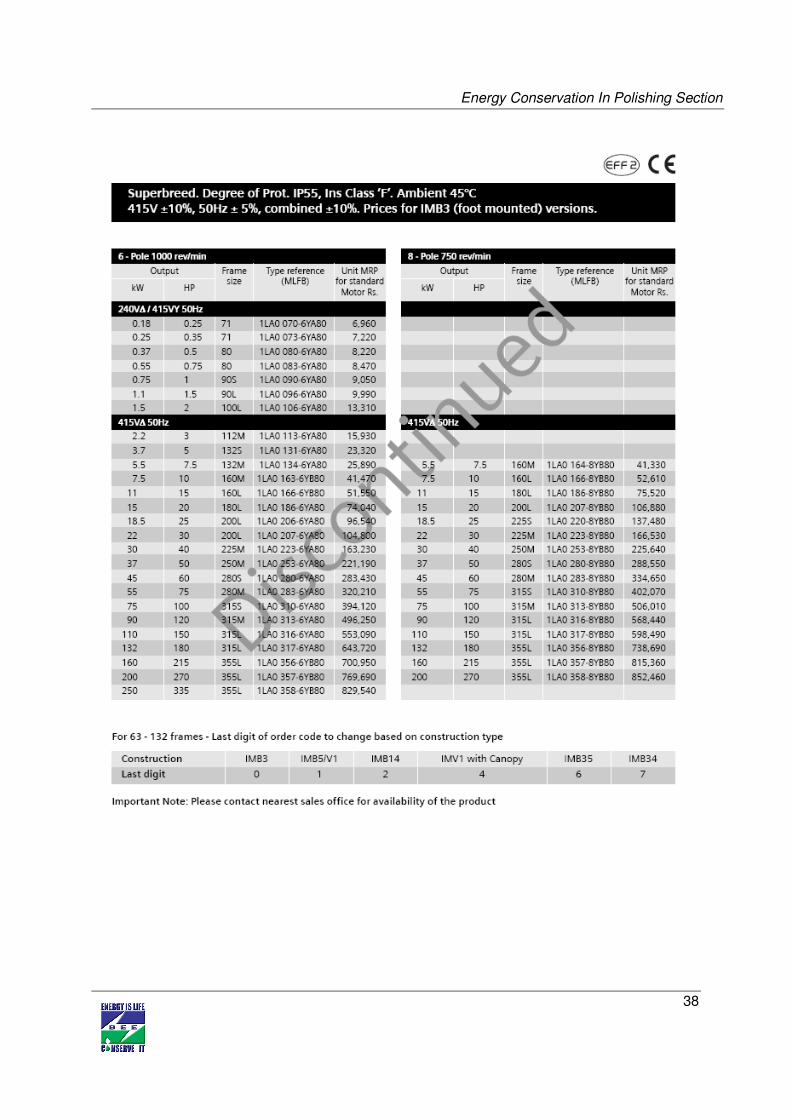
Annexure–8: Quotations or Techno-commercial bids for new technology/equipment
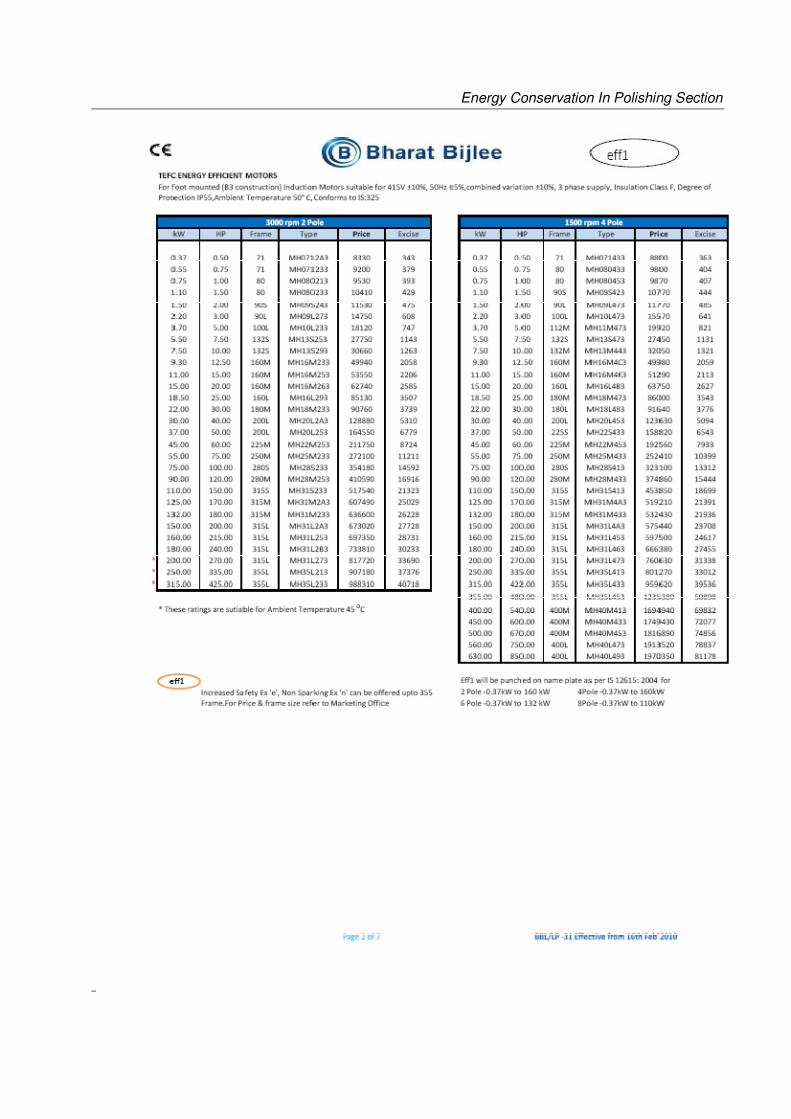
Energy Conservation In Polishing Section
31
Energy Conservation In Polishing Section
32

Energy Conservation In Polishing Section
33
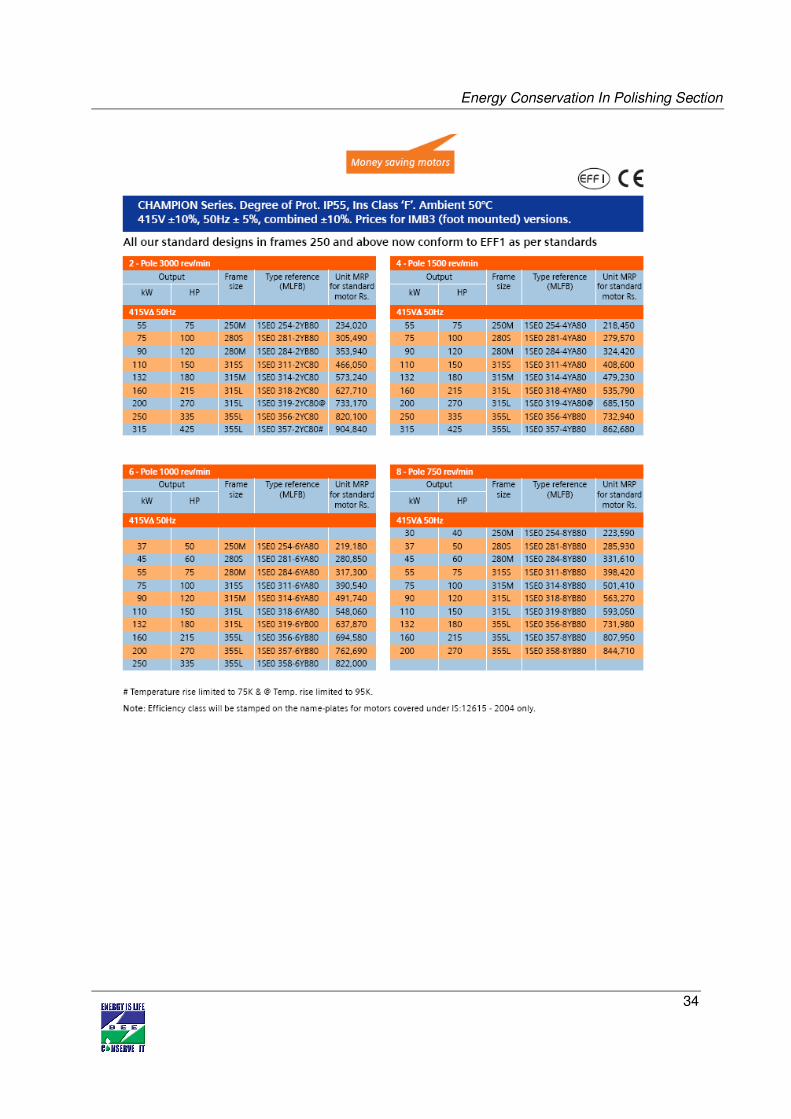
Energy Conservation In Polishing Section
34

Energy Conservation In Polishing Section
35
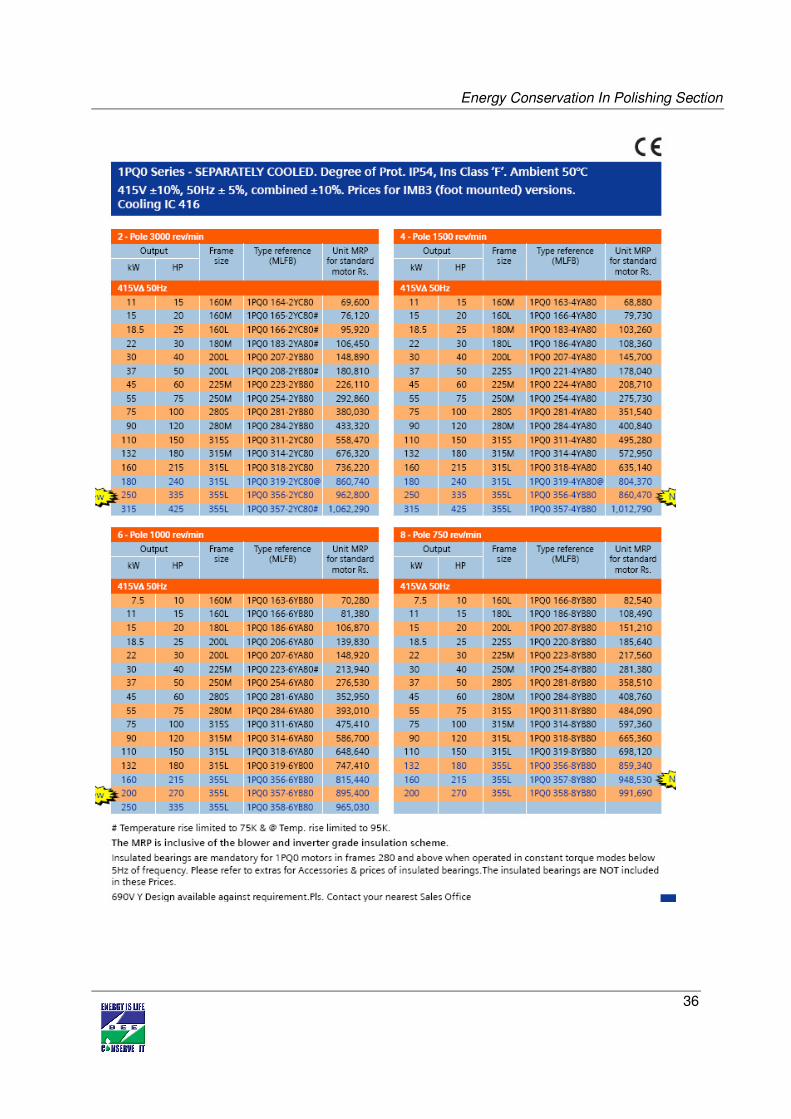
Energy Conservation In Polishing Section
36
Energy Conservation In Polishing Section
37
Energy Conservation In Polishing Section
38

Bureau of Energy Efficiency (BEE) (Ministry of Power, Government of India) 4th Floor, Sewa Bhawan, R. K. Puram, New Delhi – 110066 Ph.: +91 – 11 – 26179699 (5 Lines), Fax: +91 – 11 – 26178352
Websites: www.bee-india.nic.in, www.energymanagertraining.com
SEE-Tech Solutions Pvt. Ltd 11/5, MIDC, Infotech Park, Near VRCE Telephone Exchange, South Ambazari Road, Nagpur – 440022 Website: www.letsconserve.org
India SME Technology Services Ltd DFC Building, Plot No.37-38, D-Block, Pankha Road, Institutional Area, Janakpuri, New Delhi-110058 Tel: +91-11-28525534, Fax: +91-11-28525535 Website: www.techsmall.com