Embed Size (px)
Citation preview
Tinker, 2015EIA Energy ConferenceJune, 2015
EIA Energy ConferenceJune, 2015
Shale Gas Plays Inevitable Updates
Bureau of Economic GeologyUniversity of Texas at Austin

Tinker, 2015Acknowledgements and DisclosuresAcknowledgements and Disclosures Alfred P. Sloan Foundation IHS and DrillingInfo EIA BHP, ExxonMobil, Southwestern Energy, Devon, Range Resources,
Cimarex, Carrizo for discussions---------------------------------------- Potential conflicts of interest have been fully disclosed: see BEG
website Publications and Press:
Several peer-reviewed journal articles – see BEG website Oil and Gas Journal Articles – Barnett and Fayetteville Mainstream Media including NPR, WSJ and many others
Tinker, 2015
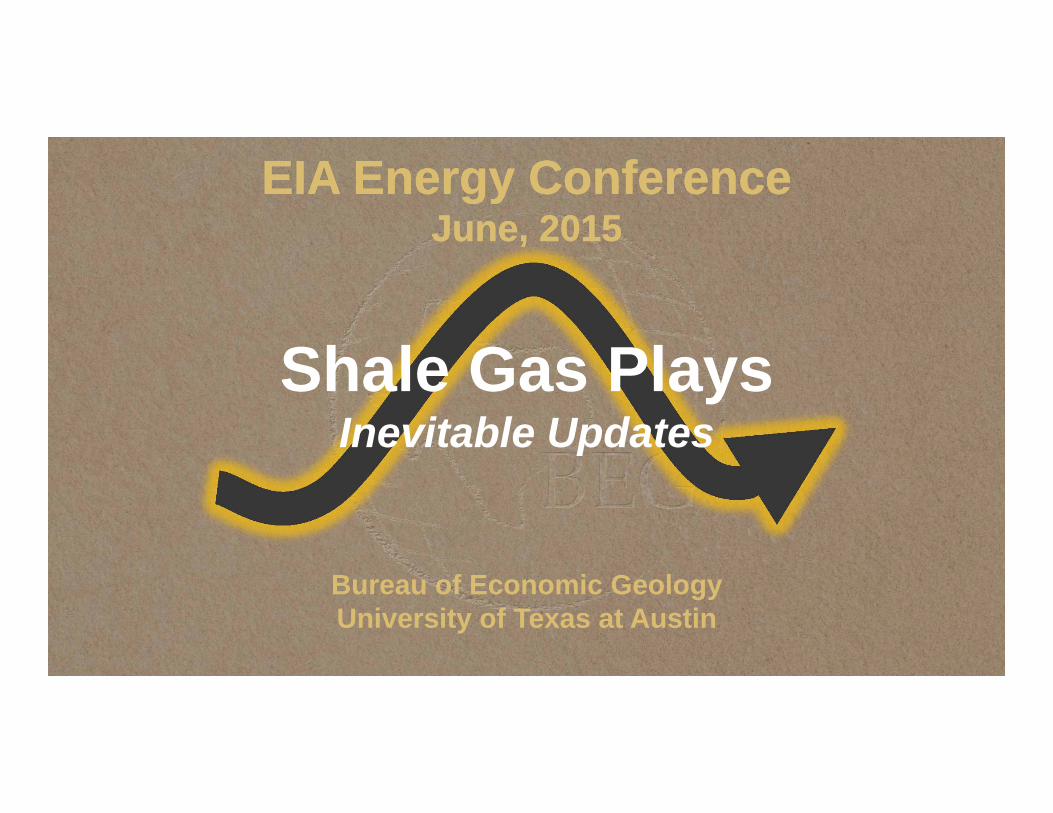
Interdisciplinary approachWell Economics
Results by tier: Breakeven prices and profitability index as a function of completion
Production OutlookResults by tier : Pace of drilling with respect to economic, technical, policy assumptions
Geologic AnalysisResults: geologic
characteristics per mi2, incl. OGIP map
Decline AnalysisResults: Well declines, incl. expected recovery
(EURs)
Productivity Analysis
Results: Productivity functions and
expected productivity“tier”map, inventory of
future wells.

Tinker, 2015
State-of-art BEG outlooks have done well so far But some of the observe changes in producer
behavior are not covered by the models We get access to more data We keep learning from every new play => Need to enhance our approaches
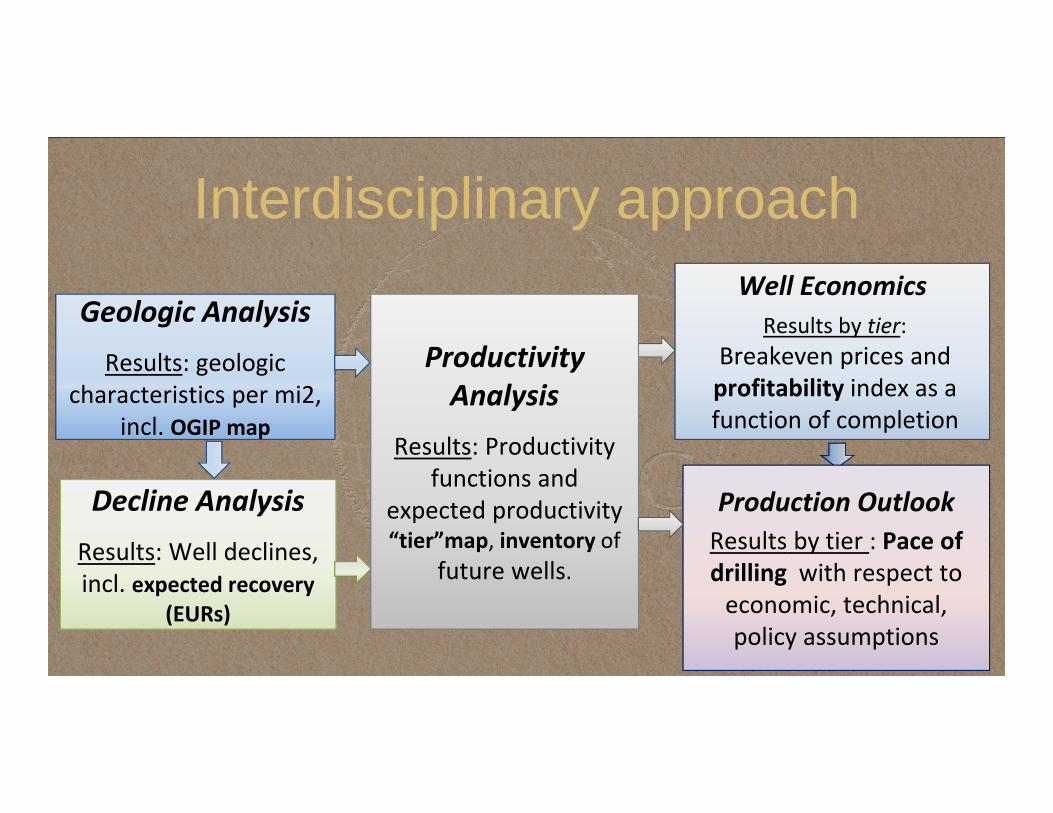
Tinker, 2015Barnett Shale: Price sensitivity
0
0.5
1
1.5
2
2.5
2005 2010 2015 2020 2025 2030 2035 2040 2045
Tcf/
year
$6 HH EIA AEO14$4 HH $3 HH
Total: 44-47 Tcf

Tinker, 2015
How to treat Resource compositionthat affects economics
Barnett ShaleOGIPfree (productivity limit ) Productivity
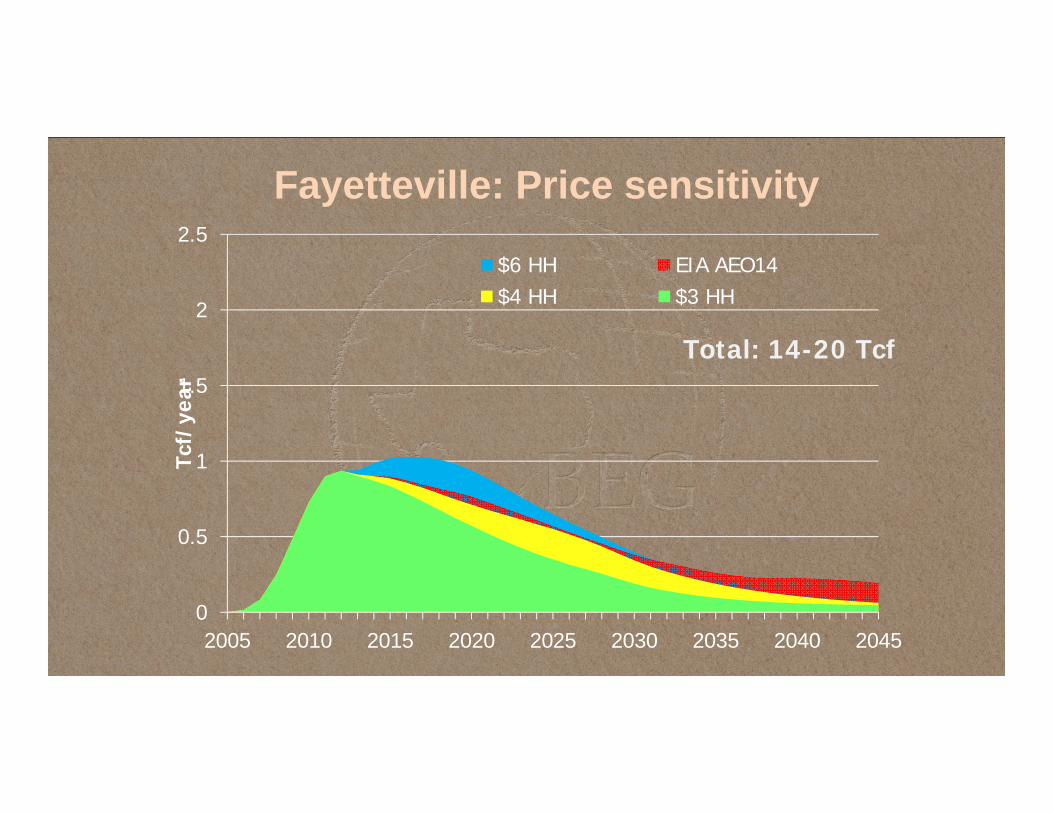
Tinker, 2015Fayetteville: Price sensitivity
0
0.5
1
1.5
2
2.5
2005 2010 2015 2020 2025 2030 2035 2040 2045
Tcf/
year
$6 HH EIA AEO14$4 HH $3 HH
Total: 14-20 Tcf
Tinker, 2015
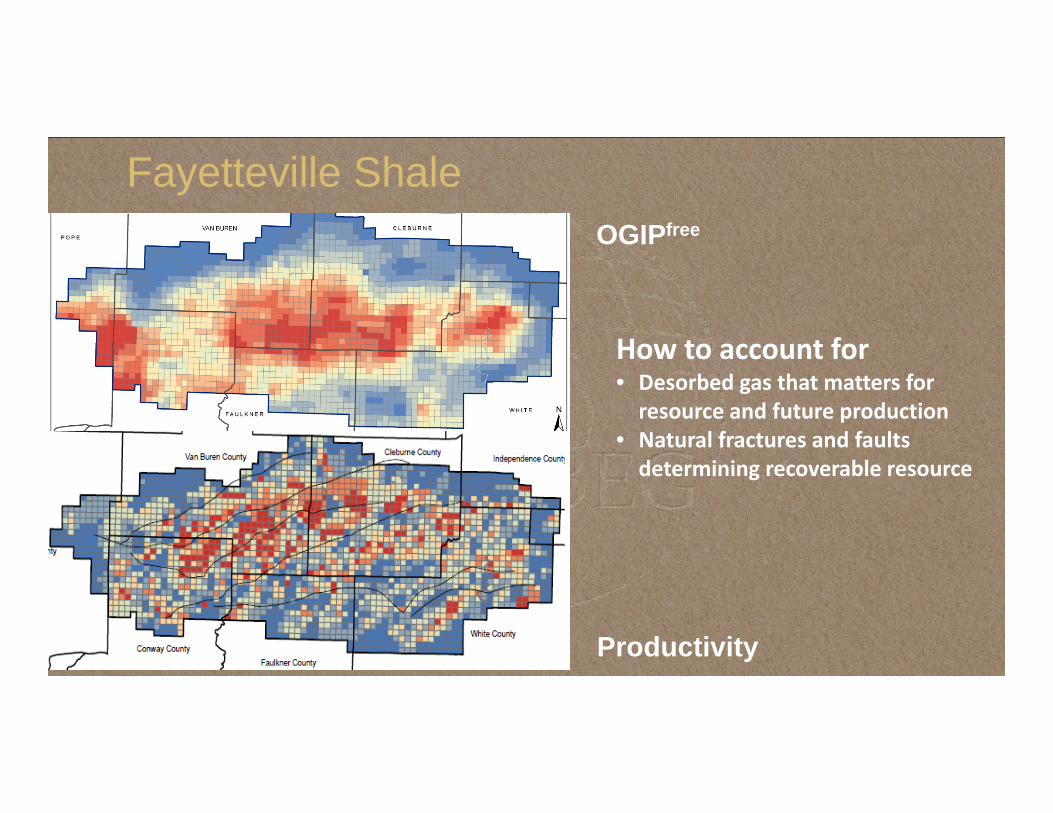
How to account for• Desorbed gas that matters for resource and future production
• Natural fractures and faults determining recoverable resource
Fayetteville ShaleOGIPfree
Productivity

Tinker, 2015Haynesville Shale: Most expensive
0
0.5
1
1.5
2
2.5
2005 2010 2015 2020 2025 2030 2035 2040 2045
Tcf/
year
$6 HH EIA AEO14$4 HH $3 HH
Total: 36-57 Tcf

Tinker, 2015
How to capture• Pressure gradient (extreme values lead to dynamic permeability)
• Clay effect• Potential contributions from adjacent formations
Haynesville ShaleOGIPfree Productivity
Tinker, 2015
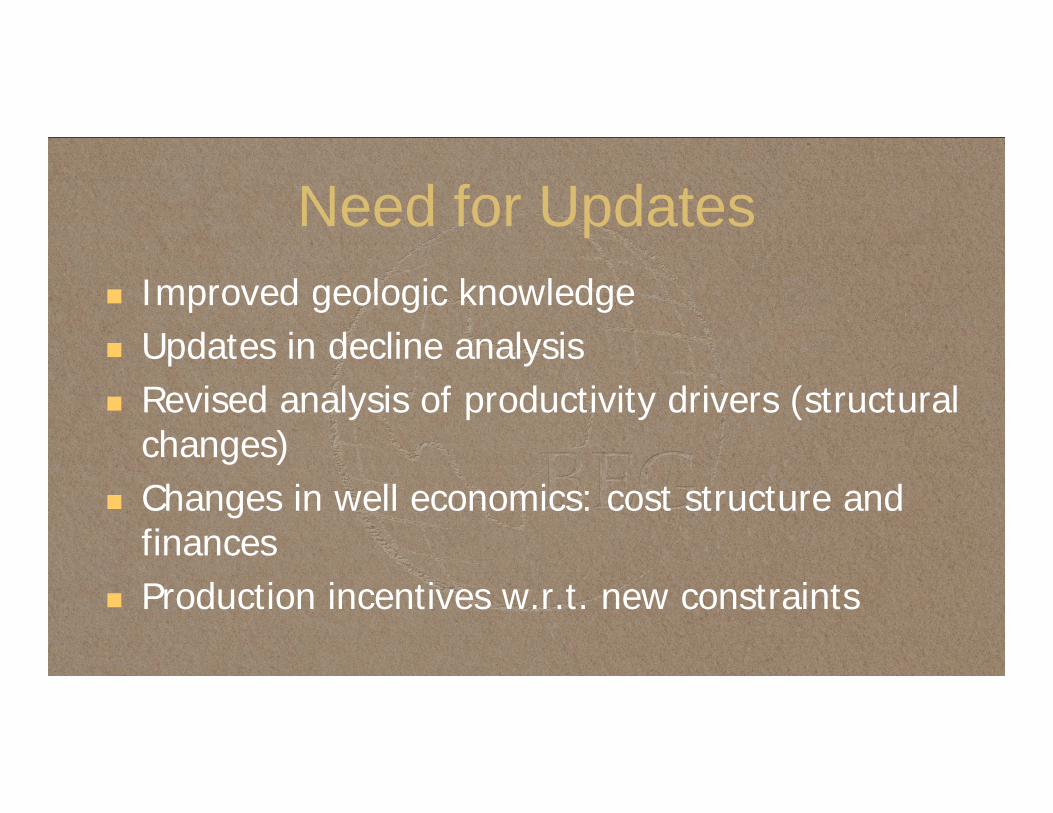
Need for Updates Improved geologic knowledge Updates in decline analysis Revised analysis of productivity drivers (structural
changes) Changes in well economics: cost structure and
finances Production incentives w.r.t. new constraints

Tinker, 2015
GEOLOGIC UPDATES:
1. Improved granularity (on characterization)2. Better understanding (of data and features)3. Knowledge expansion (reinterpretation of existing and usage of new data)
GEOLOGIC UPDATES:
1. Improved granularity (on characterization)2. Better understanding (of data and features)3. Knowledge expansion (reinterpretation of existing and usage of new data)

Tinker, 2015
~46,000 square miles
Minimum depth 2000’
Minimum thickness 30’
Outcrop +5 miles Maximum thermal
maturity 3.5% Ro
Marcellus Play
Boundary
Marcellus Play
Boundary

Tinker, 2015
Summary Heterogeneity across plays makes us learn more
about shale geology New data and technological advances lead to
continuous updates Expansion of drilling activity changes
uncertainties Changes in economic environment translate into
improved granularity
Tinker, 2015
WELL PRODUCTIVITY, RECOVERY, TECHNOLOGY, AND STRATEGY:
1. Improved granularity (on characterization)2. Better understanding (of data and features)3. Knowledge expansion (reinterpretation of existing and usage of new data)
WELL PRODUCTIVITY, RECOVERY, TECHNOLOGY, AND STRATEGY:
1. Improved granularity (on characterization)2. Better understanding (of data and features)3. Knowledge expansion (reinterpretation of existing and usage of new data)

Tinker, 2015
Decline Analysis
-- -- -- Estimated decline function • Production decline is a function of geological rock properties;
• Expected production, however, is a function of completion design, geologic and company parameters.
=> Standard well approach, or well normalization, cannot be used
=> Technology and economics determine the productivity along with geology

Tinker, 2015
OGIP vs. EUR Correlation
0
5
10
15
20
25
30
25 35 45 55 65 75 85 95 105 115 125 135
Leng
th n
orm
aliz
ed E
UR
(B
cf)
OGIP Bins, Bcf/mi2
Need to understand production variability and reduce uncertainty
Tinker, 2015
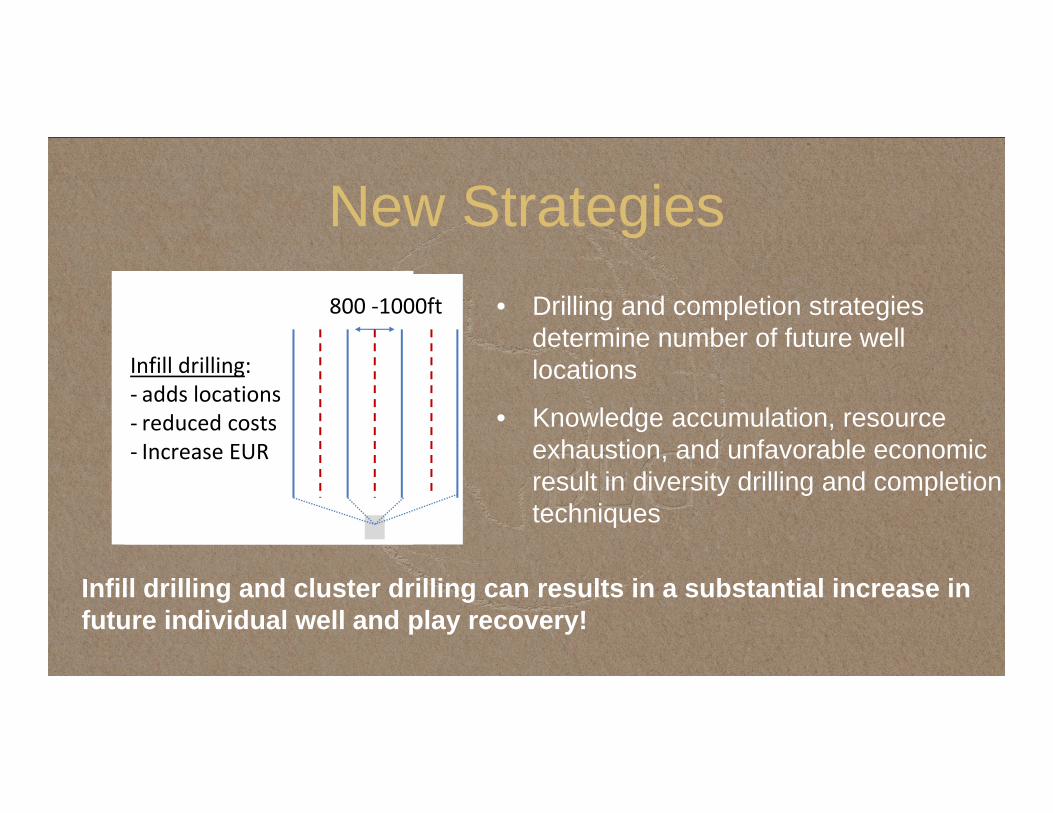
New Strategies• Drilling and completion strategies
determine number of future well locations
• Knowledge accumulation, resource exhaustion, and unfavorable economic result in diversity drilling and completion techniques
Infill drilling and cluster drilling can results in a substantial increase in future individual well and play recovery!
1000ft
Cluster drilling:‐ tighter spacing‐ less water‐ lower costs‐more wells/pad
Infill drilling:‐ adds locations‐ reduced costs‐ Increase EUR
800 ‐1000ft

Tinker, 2015
Completions and Experience matter
‐4
‐2
0
2
4
6
8
1 3 5 7 9 11 13 15 17 19 21 23 25 27 29 31 33 35 37 39 41 43 45 47 49
average well EUR for a
given
region
(Bcf)
Prefered completion Standardized well
Economic region

Tinker, 2015
WELL ECONOMICS AND PLAY OUTLOOK:
1. Models expand to account for new trends and practices2. Outlooks improve when tested parameters are well defined and mutually consistent

Tinker, 2015
Inventory w.r.t. Producers’ Decisions
Number of locations & productivity depend on completions (HF water, spacing)
Completion choice depends on the market environment and technology

Tinker, 2015
Conclusion Changes in any aspect of play description leads to a
review of all the parts of the analysis
The outlooks results keep changing with: Price (NG/NGL/WTI) ,
Basis differential/Infrastructure,
Costs & Technology improvement;
Regulatory framework.
But resource in place may not by fully known yet.