Embed Size (px)
Citation preview

Burden of Tobacco
chapter 3
the burden oF tobaCCo addiCtion
What does this Chapter tell us?
• Tobaccouseaffectsandcausesdiseaseinmanybodysystems.
AnnuallywithinPeel:
• Thereareover3,000hospitalizationsfordiseasesattributabletosmoking
• Atotalof689deathsareattributabletosmoking
• Peelresidentslosealmost5,000yearsoflifeduetosmoking-attributablediseaseasaresultofprematuredeath
?
!
X
19
20
Burden of Tobacco
Tobacco use causes significant morbidity, disability and death directly (to those individuals who use tobacco), and indirectly (to those who do not smoke) through environmental tobacco smoke (ETS).
This section of the report will describe and quantify the number of hospitalizations, deaths and potential years of life lost for diseases attributable to smoking in Peel.
As described in Chapter 2 – The Use of Cigarettes and Other Forms of Tobacco, the data sources that have information about tobacco use in Peel (e.g., Canadian Community Health Survey, Peel Student Health Survey) only include questions about the use of cigarettes, cigars, pipes, snuff and chewing tobacco. Since cigarettes are the main form of tobacco used, the remainder of this report will focus only on the use of cigarettes.
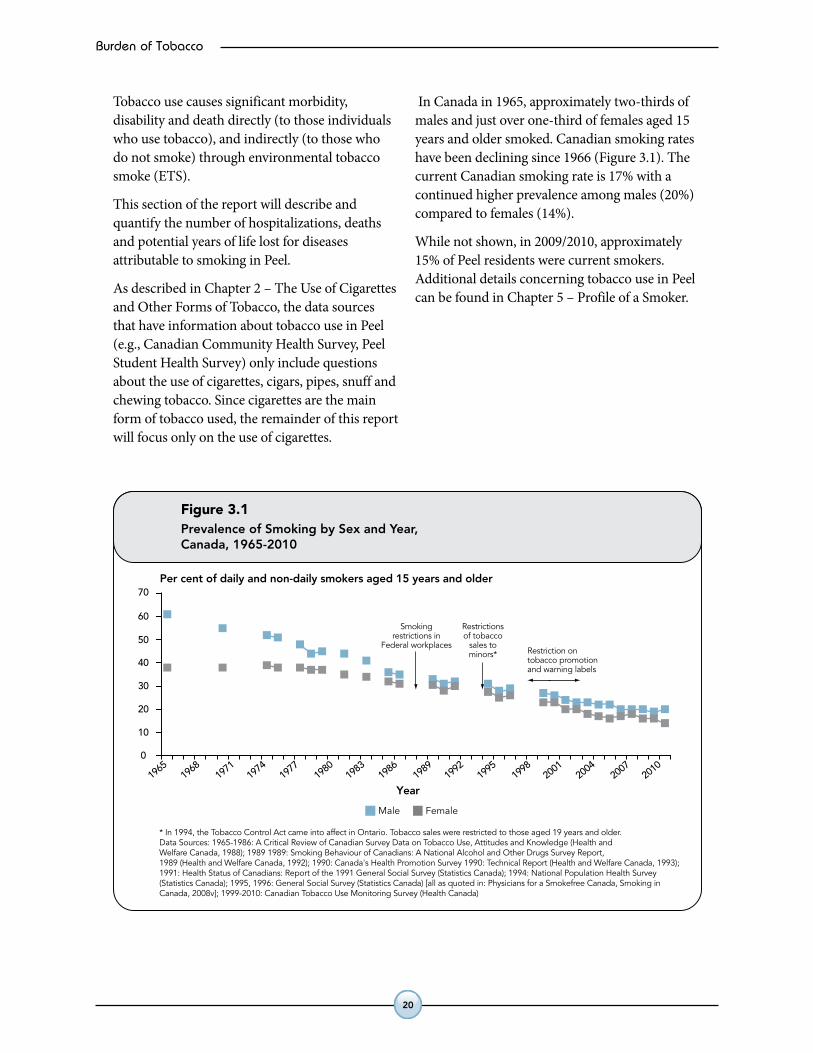
In Canada in 1965, approximately two-thirds of males and just over one-third of females aged 15 years and older smoked. Canadian smoking rates have been declining since 1966 (Figure 3.1). The current Canadian smoking rate is 17% with a continued higher prevalence among males (20%) compared to females (14%).
While not shown, in 2009/2010, approximately 15% of Peel residents were current smokers. Additional details concerning tobacco use in Peel can be found in Chapter 5 – Profile of a Smoker.
Figure 3.1Prevalence of Smoking by Sex and Year,Canada, 1965-2010
Year19
65
* In 1994, the Tobacco Control Act came into affect in Ontario. Tobacco sales were restricted to those aged 19 years and older. Data Sources: 1965-1986: A Critical Review of Canadian Survey Data on Tobacco Use, Attitudes and Knowledge (Health andWelfare Canada, 1988); 1989 1989: Smoking Behaviour of Canadians: A National Alcohol and Other Drugs Survey Report,1989 (Health and Welfare Canada, 1992); 1990: Canada's Health Promotion Survey 1990: Technical Report (Health and Welfare Canada, 1993);1991: Health Status of Canadians: Report of the 1991 General Social Survey (Statistics Canada); 1994: National Population Health Survey(Statistics Canada); 1995, 1996: General Social Survey (Statistics Canada) [all as quoted in: Physicians for a Smokefree Canada, Smoking inCanada, 2008v]; 1999-2010: Canadian Tobacco Use Monitoring Survey (Health Canada)
1968
1971
1974
1977
1980
1983
1986
1989
1992
1995
1998
2001
2004
2007
2010
Per cent of daily and non-daily smokers aged 15 years and older
0
40
30
20
10
50
60
70
Smokingrestrictions in
Federal workplacesRestriction ontobacco promotionand warning labels
Restrictionsof tobacco
sales tominors*
Male Female
Burden of Tobacco
21
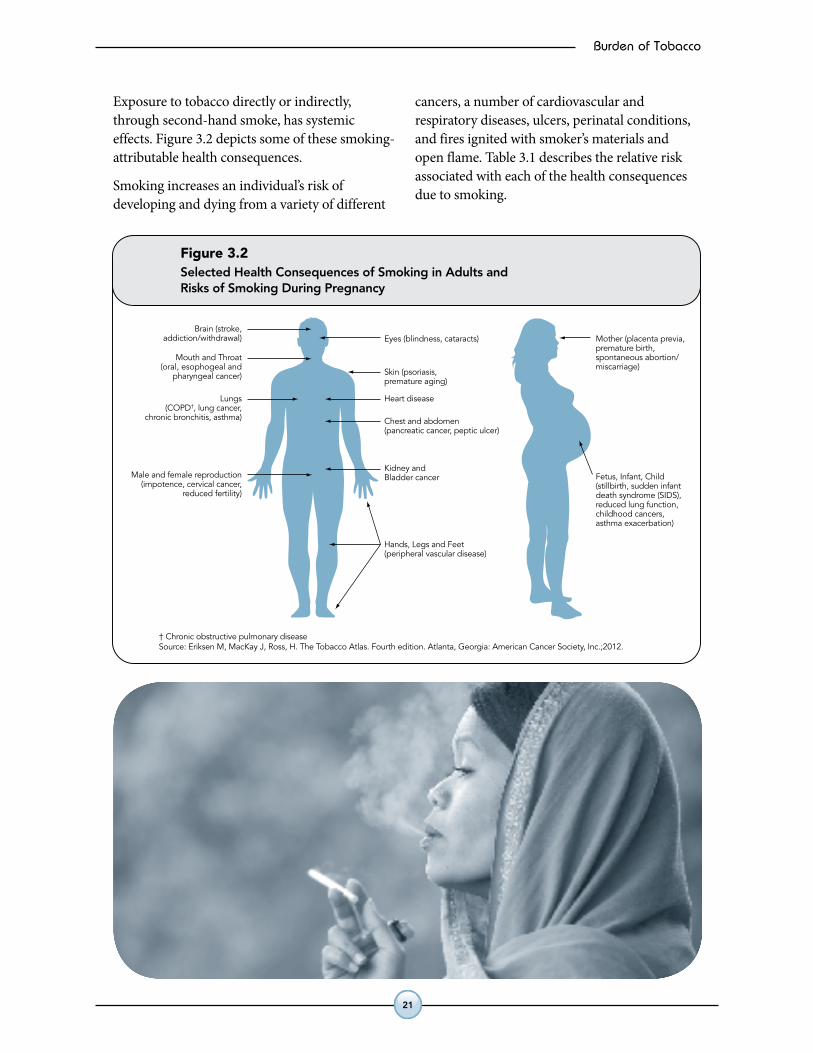
Exposure to tobacco directly or indirectly, through second-hand smoke, has systemic effects. Figure 3.2 depicts some of these smoking-attributable health consequences.
Smoking increases an individual’s risk of developing and dying from a variety of different
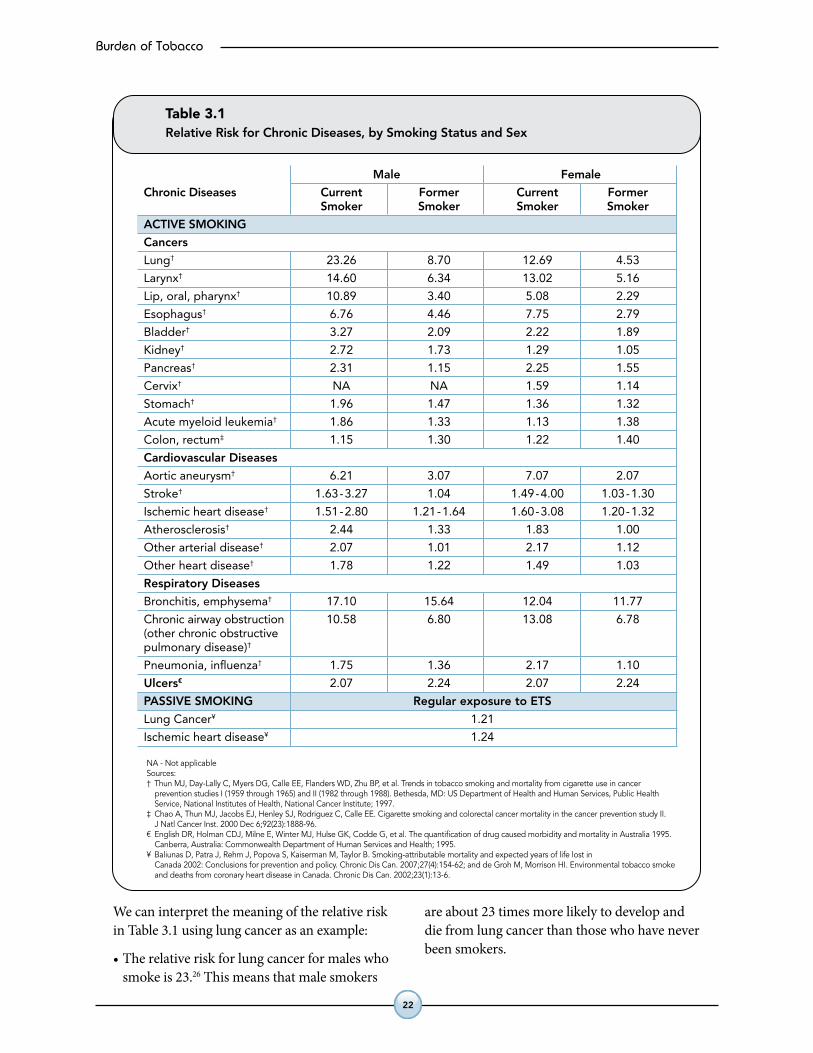
cancers, a number of cardiovascular and respiratory diseases, ulcers, perinatal conditions, and fires ignited with smoker’s materials and open flame. Table 3.1 describes the relative risk associated with each of the health consequences due to smoking.
† Chronic obstructive pulmonary diseaseSource: Eriksen M, MacKay J, Ross, H. The Tobacco Atlas. Fourth edition. Atlanta, Georgia: American Cancer Society, Inc.;2012.
Brain (stroke,addiction/withdrawal)
Mouth and Throat(oral, esophogeal and
pharyngeal cancer)
Lungs(COPD†, lung cancer,
chronic bronchitis, asthma)
Male and female reproduction(impotence, cervical cancer,
reduced fertility)
Kidney andBladder cancer
Chest and abdomen(pancreatic cancer, peptic ulcer)
Heart disease
Skin (psoriasis,premature aging)
Eyes (blindness, cataracts) Mother (placenta previa,premature birth,spontaneous abortion/miscarriage)
Fetus, Infant, Child(stillbirth, sudden infantdeath syndrome (SIDS),reduced lung function,childhood cancers,asthma exacerbation)
Hands, Legs and Feet (peripheral vascular disease)
Figure 3.2Selected Health Consequences of Smoking in Adults andRisks of Smoking During Pregnancy
22
Burden of Tobacco
We can interpret the meaning of the relative risk in Table 3.1 using lung cancer as an example:
•Therelativeriskforlungcancerformaleswhosmoke is 23.26 This means that male smokers
are about 23 times more likely to develop and die from lung cancer than those who have never been smokers.
Table 3.1Relative Risk for Chronic Diseases, by Smoking Status and Sex
NA - Not applicableSources: † Thun MJ, Day-Lally C, Myers DG, Calle EE, Flanders WD, Zhu BP, et al. Trends in tobacco smoking and mortality from cigarette use in cancer
prevention studies I (1959 through 1965) and II (1982 through 1988). Bethesda, MD: US Department of Health and Human Services, Public HealthService, National Institutes of Health, National Cancer Institute; 1997.
‡ Chao A, Thun MJ, Jacobs EJ, Henley SJ, Rodriguez C, Calle EE. Cigarette smoking and colorectal cancer mortality in the cancer prevention study II.J Natl Cancer Inst. 2000 Dec 6;92(23):1888-96.
€ English DR, Holman CDJ, Milne E, Winter MJ, Hulse GK, Codde G, et al. The quantification of drug caused morbidity and mortality in Australia 1995.Canberra, Australia: Commonwealth Department of Human Services and Health; 1995.
¥ Baliunas D, Patra J, Rehm J, Popova S, Kaiserman M, Taylor B. Smoking-attributable mortality and expected years of life lost inCanada 2002: Conclusions for prevention and policy. Chronic Dis Can. 2007;27(4):154-62; and de Groh M, Morrison HI. Environmental tobacco smokeand deaths from coronary heart disease in Canada. Chronic Dis Can. 2002;23(1):13-6.
Male Female
Chronic Diseases Current Former Current Former Smoker Smoker Smoker Smoker
ACTIVE SMOKING
Cancers
Lung† 23.26 8.70 12.69 4.53
Larynx† 14.60 6.34 13.02 5.16
Lip, oral, pharynx† 10.89 3.40 5.08 2.29
Esophagus† 6.76 4.46 7.75 2.79
Bladder† 3.27 2.09 2.22 1.89
Kidney† 2.72 1.73 1.29 1.05
Pancreas† 2.31 1.15 2.25 1.55
Cervix† NA NA 1.59 1.14
Stomach† 1.96 1.47 1.36 1.32
Acute myeloid leukemia† 1.86 1.33 1.13 1.38
Colon, rectum‡ 1.15 1.30 1.22 1.40
Cardiovascular Diseases
Aortic aneurysm† 6.21 3.07 7.07 2.07
Stroke† 1.63-3.27 1.04 1.49-4.00 1.03-1.30
Ischemic heart disease† 1.51-2.80 1.21-1.64 1.60-3.08 1.20-1.32
Atherosclerosis† 2.44 1.33 1.83 1.00
Other arterial disease† 2.07 1.01 2.17 1.12
Other heart disease† 1.78 1.22 1.49 1.03
Respiratory Diseases
Bronchitis, emphysema† 17.10 15.64 12.04 11.77
Chronic airway obstruction 10.58 6.80 13.08 6.78(other chronic obstructivepulmonary disease)†
Pneumonia, influenza† 1.75 1.36 2.17 1.10
Ulcers€ 2.07 2.24 2.07 2.24
PASSIVE SMOKING Regular exposure to ETS
Lung Cancer¥ 1.21
Ischemic heart disease¥ 1.24
Burden of Tobacco
23
By combining the relative risk for a specific disease due to a specific risk factor with the prevalence of the risk factor – in this case, smoking in a population, and applying this product to hospitalizations, deaths or potential years of life lost for smoking-related diseases; the number and proportion of disease-specific hospitalizations, deaths or potential years of life lost that are caused by smoking can be calculated. This is called the smoking-attributable fraction (SAF).
While the numbers of hospitalizations, deaths or potential years of life lost will be presented in the following tables, these numbers should be interpreted as an estimate of the contribution of smoking to these conditions. For each of the tables in this section, the average annual number of hospitalizations, deaths, or potential years of life lost, are based on several years of data. The years used to calculate the average annual number also vary depending on the data source. The information about what years were included in the calculation can be found in the footnotes underneath each table.
Additional details about the methods used to calculate the hospitalizations, mortality and potential years of life lost that are attributable to smoking can be found in Chapter 13 – Data Methods.
Relative Risk (RR)isdefinedastheproportionaldifferenceindiseaseratesbetweenexposedandnon-exposedpersons.Therelative risktellsushowmuchmorelikelypeoplewithaspecificexposure(e.g.,smoking)areofdevelopingadisease(e.g.,lungcancer)comparedtopeoplewithouttheexposure(e.g.,non-smokers).
• IfRR=1,theriskinexposedpersonsequalstheriskinnon-exposedpersons.
• IfRR>1,theriskinexposedpersonsisgreaterthantheriskinnon-exposedpersons.
• IfRR<1,theriskinexposedpersonsislessthantheriskinnon-exposedpersons.
TheSmoking-Attributable Fraction (SAF) describestheproportionofallcasesofdiseaseordeaththatareattributedtosmoking.Itisawayofconsideringtheinfluenceofsmokingonapopulation’sburdenofdisease.
Thesmoking-attributableriskgivesanestimateoftheamountofdiseasethatcouldbepreventedifsmokingwereeliminatedorreducedinthepopulation.Forexample,ifthepopulation-attributablefractionforlungcancerandsmokingwas84%,thismeansthat84%ofcasesoflungcancersarecausedbysmoking,andallwouldbeeliminatedifnoonesmoked.
UseoftheSAFisdependentontheexistenceofgoodevidenceabouttherelationshipbetweensmokingandspecificdiseaseoutcomes.
?
!
X
?
!
X
24
Burden of Tobacco
smoking-attributable hospitalizations
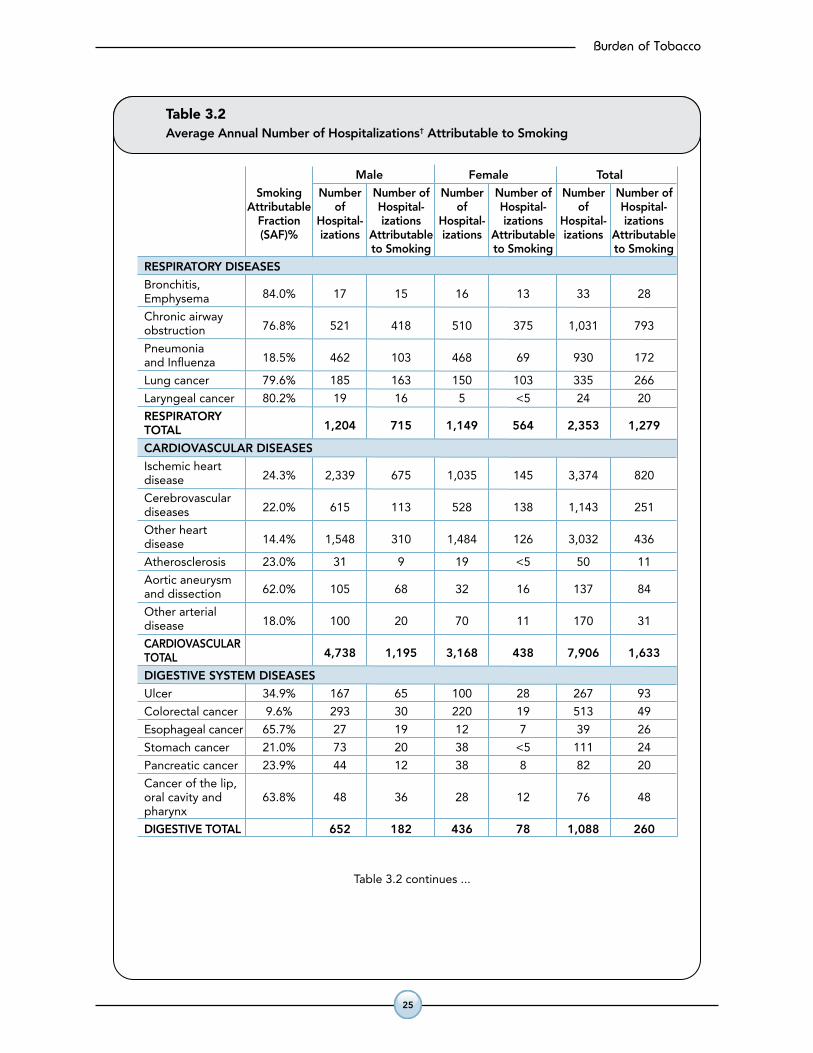
Tables 3.2 and 3.3 show the number of hospitalizations in Peel that are attributable to smoking and exposure to second-hand smoke on an annual basis.
In reviewing these tables the reader should be aware of one important caveat:
•Itispossiblethatonepersoncouldhavehadseveral admissions for the same smoking-related disease. Since the data in Tables 3.2 and 3.3 have not been adjusted to account for this, the data must be interpreted to reflect admissions and not people.
Ahospitalizationisdefinedasadischargefromhospitalduetodeath,dischargehome,ortransfertoanotherfacility.
?
!
X
Burden of Tobacco
25
Table 3.2Average Annual Number of Hospitalizations† Attributable to Smoking
Male Female Total
Smoking Number Number of Number Number of Number Number of Attributable of Hospital- of Hospital- of Hospital- Fraction Hospital- izations Hospital- izations Hospital- izations (SAF)% izations Attributable izations Attributable izations Attributable to Smoking to Smoking to Smoking
RESPIRATORY DISEASES
Bronchitis, 84.0% 17 15 16 13 33 28Emphysema
Chronic airway 76.8% 521 418 510 375 1,031 793obstruction
Pneumonia 18.5% 462 103 468 69 930 172and Influenza
Lung cancer 79.6% 185 163 150 103 335 266
Laryngeal cancer 80.2% 19 16 5 <5 24 20
RESPIRATORY 1,204 715 1,149 564 2,353 1,279TOTAL
CARDIOVASCULAR DISEASES
Ischemic heart 24.3% 2,339 675 1,035 145 3,374 820disease
Cerebrovascular 22.0% 615 113 528 138 1,143 251diseases
Other heart 14.4% 1,548 310 1,484 126 3,032 436disease
Atherosclerosis 23.0% 31 9 19 <5 50 11
Aortic aneurysm 62.0% 105 68 32 16 137 84and dissection
Other arterial 18.0% 100 20 70 11 170 31disease
CARDIOVASCULAR 4,738 1,195 3,168 438 7,906 1,633TOTAL
DIGESTIVE SYSTEM DISEASES
Ulcer 34.9% 167 65 100 28 267 93
Colorectal cancer 9.6% 293 30 220 19 513 49
Esophageal cancer 65.7% 27 19 12 7 39 26
Stomach cancer 21.0% 73 20 38 <5 111 24
Pancreatic cancer 23.9% 44 12 38 8 82 20
Cancer of the lip,oral cavity and 63.8% 48 36 28 12 76 48pharynx
DIGESTIVE TOTAL 652 182 436 78 1,088 260
Table 3.2 continues ...
Table 3.2 continued
† Reflects cardiovascular, respiratory and ulcer hospitalizations for those aged 35 years and older.Cancer hospitalizations reflect those aged 30 years and older. Note: Number of hospitalizations reflects an annual average for the years 2005-2009. Sources: Hospital In-Patient Discharge Data 2005-2009, IntelliHEALTH Ontario, Ministry of Health and Long Term Care.Smoking Prevalence: Canadian Community Health Survey 2003, 2005, 2007/2008 combined, Statistics Canada, Share File, Ontario Ministry ofHealth and Long-Term Care.Relative Risk for smoking and diseases attributable to smoking (excluding colorectal cancer and ulcer): Thun MJ, Day-Lally C, Myers DG, Calle EE,Flanders WD, Zhu BP, et al. Trends in tobacco smoking and mortality from cigarette use in cancer prevention studies I (1959 through 1965) and II(1982 through 1988). Bethesda, MD: US Department of Health and Human Services, Public Health Service, National Institutes of Health,National Cancer Institute; 1997. Relative Risk for smoking and colorectal cancer from: Chao A, Thun MJ, Jacobs EJ, Henley SJ, Rodriguez C, Calle EE. Cigarette smoking andcolorectal cancer mortality in the cancer prevention study II. J Natl Cancer Inst. 2000 Dec 6;92(23):1888-96. Relative Risk for smoking and ulcer: English DR, Holman CDJ, Milne E, Winter MJ, Hulse GK, Codde G, et al. The quantification of drug causedmorbidity and mortality in Australia 1995. Canberra, Australia: Commonwealth Department of Human Services and Health; 1995.
Male Female Total
Smoking Number Number of Number Number of Number Number of Attributable of Hospital- of Hospital- of Hospital- Fraction Hospital- izations Hospital- izations Hospital- izations (SAF)% izations Attributable izations Attributable izations Attributable to Smoking to Smoking to Smoking
OTHER DISEASES
Cervical cancer 9.0% – – 31 <5 31 <5
Kidney, 25.3% 79 30 50 <5 129 32Renal cancer
Bladder cancer 41.4% 183 85 54 13 237 98
Acute myeloid 13.7% 18 <5 25 <5 43 6leukemia
OTHER TOTAL 296 119 160 20 440 139
OVERALL TOTAL 6,890 2,211 4,913 1,100 11,787 3,311
26
Burden of Tobacco
Table 3.2Average Annual Number of Hospitalizations† Attributable to Smoking
Male Female Total
Smoking Number Number of Number Number of Number Number of Attributable of Hospital- of Hospital- of Hospital- Fraction Hospital- izations Hospital- izations Hospital- izations (SAF)% izations Attributable izations Attributable izations Attributable to Smoking to Smoking to Smoking
RESPIRATORY DISEASES
Bronchitis, 84.0% 17 15 16 13 33 28Emphysema
Chronic airway 76.8% 521 418 510 375 1,031 793obstruction
Pneumonia 18.5% 462 103 468 69 930 172and Influenza
Lung cancer 79.6% 185 163 150 103 335 266
Laryngeal cancer 80.2% 19 16 5 <5 24 20
RESPIRATORY 1,204 715 1,149 564 2,353 1,279TOTAL
CARDIOVASCULAR DISEASES
Ischemic heart 24.3% 2,339 675 1,035 145 3,374 820disease
Cerebrovascular 22.0% 615 113 528 138 1,143 251diseases
Other heart 14.4% 1,548 310 1,484 126 3,032 436disease
Atherosclerosis 23.0% 31 9 19 <5 50 11
Aortic aneurysm 62.0% 105 68 32 16 137 84and dissection
Other arterial 18.0% 100 20 70 11 170 31disease
CARDIOVASCULAR 4,738 1,195 3,168 438 7,906 1,633TOTAL
DIGESTIVE SYSTEM DISEASES
Ulcer 34.9% 167 65 100 28 267 93
Colorectal cancer 9.6% 293 30 220 19 513 49
Esophageal cancer 65.7% 27 19 12 7 39 26
Stomach cancer 21.0% 73 20 38 <5 111 24
Pancreatic cancer 23.9% 44 12 38 8 82 20
Cancer of the lip,oral cavity and 63.8% 48 36 28 12 76 48pharynx
DIGESTIVE TOTAL 652 182 436 78 1,088 260
Table 3.2 continues ...
Table 3.2 continued
† Reflects cardiovascular, respiratory and ulcer hospitalizations for those aged 35 years and older.Cancer hospitalizations reflect those aged 30 years and older. Note: Number of hospitalizations reflects an annual average for the years 2005-2009. Sources: Hospital In-Patient Discharge Data 2005-2009, IntelliHEALTH Ontario, Ministry of Health and Long Term Care.Smoking Prevalence: Canadian Community Health Survey 2003, 2005, 2007/2008 combined, Statistics Canada, Share File, Ontario Ministry ofHealth and Long-Term Care.Relative Risk for smoking and diseases attributable to smoking (excluding colorectal cancer and ulcer): Thun MJ, Day-Lally C, Myers DG, Calle EE,Flanders WD, Zhu BP, et al. Trends in tobacco smoking and mortality from cigarette use in cancer prevention studies I (1959 through 1965) and II(1982 through 1988). Bethesda, MD: US Department of Health and Human Services, Public Health Service, National Institutes of Health,National Cancer Institute; 1997. Relative Risk for smoking and colorectal cancer from: Chao A, Thun MJ, Jacobs EJ, Henley SJ, Rodriguez C, Calle EE. Cigarette smoking andcolorectal cancer mortality in the cancer prevention study II. J Natl Cancer Inst. 2000 Dec 6;92(23):1888-96. Relative Risk for smoking and ulcer: English DR, Holman CDJ, Milne E, Winter MJ, Hulse GK, Codde G, et al. The quantification of drug causedmorbidity and mortality in Australia 1995. Canberra, Australia: Commonwealth Department of Human Services and Health; 1995.
Male Female Total
Smoking Number Number of Number Number of Number Number of Attributable of Hospital- of Hospital- of Hospital- Fraction Hospital- izations Hospital- izations Hospital- izations (SAF)% izations Attributable izations Attributable izations Attributable to Smoking to Smoking to Smoking
OTHER DISEASES
Cervical cancer 9.0% – – 31 <5 31 <5
Kidney, 25.3% 79 30 50 <5 129 32Renal cancer
Bladder cancer 41.4% 183 85 54 13 237 98
Acute myeloid 13.7% 18 <5 25 <5 43 6leukemia
OTHER TOTAL 296 119 160 20 440 139
OVERALL TOTAL 6,890 2,211 4,913 1,100 11,787 3,311
Burden of Tobacco
27
What does this mean?
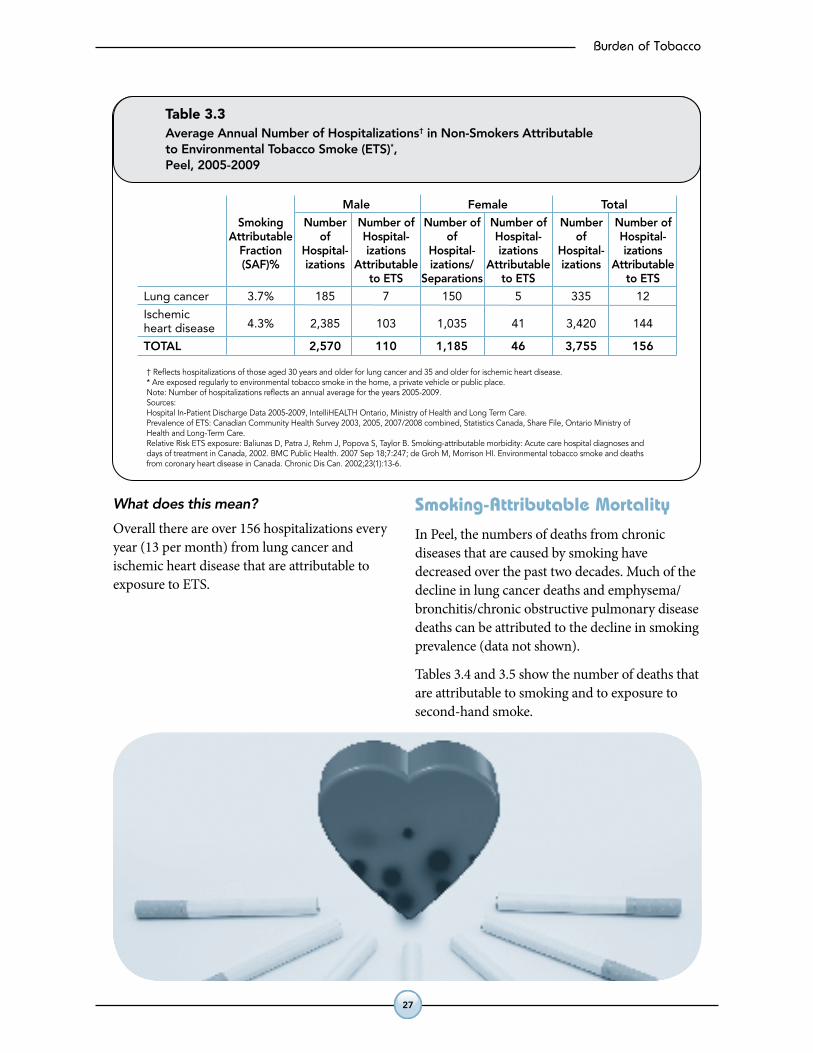
Overall there are over 156 hospitalizations every year (13 per month) from lung cancer and ischemic heart disease that are attributable to exposure to ETS.
smoking-attributable Mortality
In Peel, the numbers of deaths from chronic diseases that are caused by smoking have decreased over the past two decades. Much of the decline in lung cancer deaths and emphysema/bronchitis/chronic obstructive pulmonary disease deaths can be attributed to the decline in smoking prevalence (data not shown).
Tables 3.4 and 3.5 show the number of deaths that are attributable to smoking and to exposure to second-hand smoke.
Table 3.3Average Annual Number of Hospitalizations† in Non-Smokers Attributableto Environmental Tobacco Smoke (ETS)*,Peel, 2005-2009
† Reflects hospitalizations of those aged 30 years and older for lung cancer and 35 and older for ischemic heart disease.* Are exposed regularly to environmental tobacco smoke in the home, a private vehicle or public place.Note: Number of hospitalizations reflects an annual average for the years 2005-2009.Sources:Hospital In-Patient Discharge Data 2005-2009, IntelliHEALTH Ontario, Ministry of Health and Long Term Care.Prevalence of ETS: Canadian Community Health Survey 2003, 2005, 2007/2008 combined, Statistics Canada, Share File, Ontario Ministry ofHealth and Long-Term Care.Relative Risk ETS exposure: Baliunas D, Patra J, Rehm J, Popova S, Taylor B. Smoking-attributable morbidity: Acute care hospital diagnoses anddays of treatment in Canada, 2002. BMC Public Health. 2007 Sep 18;7:247; de Groh M, Morrison HI. Environmental tobacco smoke and deathsfrom coronary heart disease in Canada. Chronic Dis Can. 2002;23(1):13-6.
Male Female Total
Smoking Number Number of Number of Number of Number Number of Attributable of Hospital- of Hospital- of Hospital- Fraction Hospital- izations Hospital- izations Hospital- izations (SAF)% izations Attributable izations/ Attributable izations Attributable to ETS Separations to ETS to ETS
Lung cancer 3.7% 185 7 150 5 335 12
Ischemic 4.3% 2,385 103 1,035 41 3,420 144heart disease
TOTAL 2,570 110 1,185 46 3,755 156
28
Burden of Tobacco
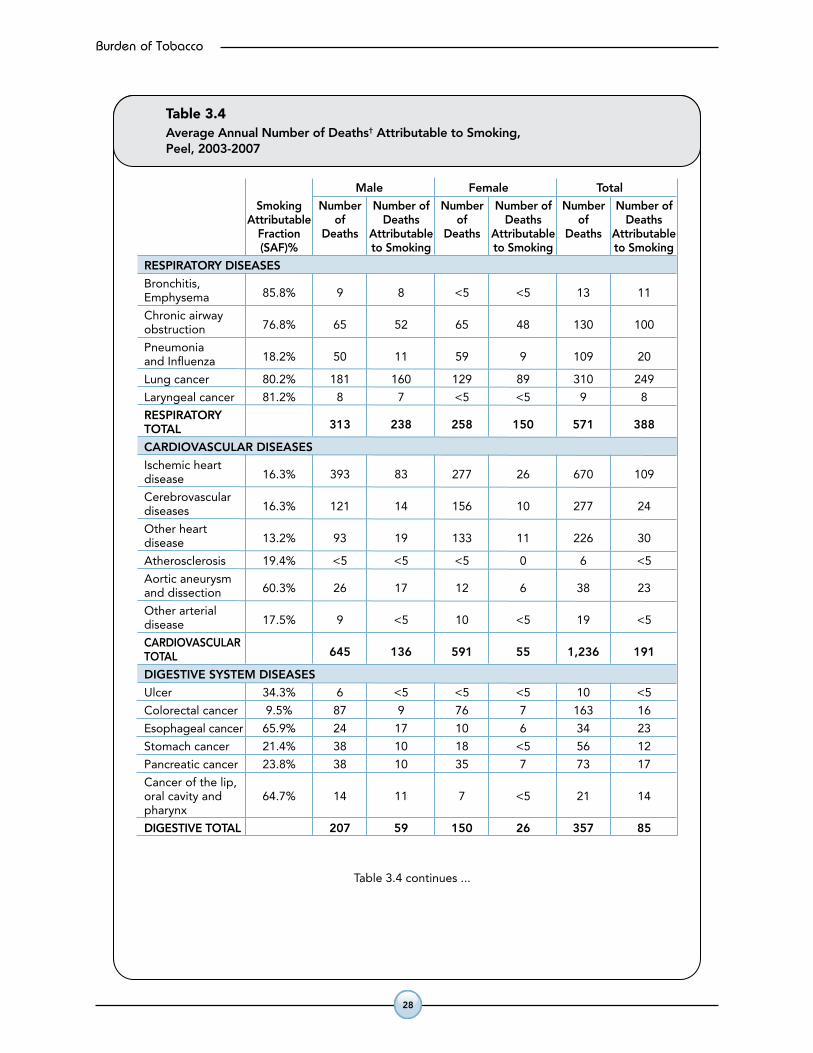
Table 3.4Average Annual Number of Deaths† Attributable to Smoking, Peel, 2003-2007
Male Female Total
Smoking Number Number of Number Number of Number Number of Attributable of Deaths of Deaths of Deaths Fraction Deaths Attributable Deaths Attributable Deaths Attributable (SAF)% to Smoking to Smoking to Smoking
RESPIRATORY DISEASES
Bronchitis, 85.8% 9 8 <5 <5 13 11Emphysema
Chronic airway 76.8% 65 52 65 48 130 100obstruction
Pneumonia 18.2% 50 11 59 9 109 20and Influenza
Lung cancer 80.2% 181 160 129 89 310 249
Laryngeal cancer 81.2% 8 7 <5 <5 9 8
RESPIRATORY 313 238 258 150 571 388TOTAL
CARDIOVASCULAR DISEASES
Ischemic heart 16.3% 393 83 277 26 670 109disease
Cerebrovascular 16.3% 121 14 156 10 277 24diseases
Other heart 13.2% 93 19 133 11 226 30disease
Atherosclerosis 19.4% <5 <5 <5 0 6 <5
Aortic aneurysm 60.3% 26 17 12 6 38 23and dissection
Other arterial 17.5% 9 <5 10 <5 19 <5disease
CARDIOVASCULAR 645 136 591 55 1,236 191TOTAL
DIGESTIVE SYSTEM DISEASES
Ulcer 34.3% 6 <5 <5 <5 10 <5
Colorectal cancer 9.5% 87 9 76 7 163 16
Esophageal cancer 65.9% 24 17 10 6 34 23
Stomach cancer 21.4% 38 10 18 <5 56 12
Pancreatic cancer 23.8% 38 10 35 7 73 17
Cancer of the lip,oral cavity and 64.7% 14 11 7 <5 21 14pharynx
DIGESTIVE TOTAL 207 59 150 26 357 85
Table 3.4 continues ...
Table 3.4 continued
† Reflects cardiovascular, respiratory and ulcer hospitalizations for those aged 35 years and older.Cancer hospitalizations reflect those aged 30 years and older. Note: Number of hospitalizations reflects an annual average for the years 2005-2009. Sources: Hospital In-Patient Discharge Data 2005-2009, IntelliHEALTH Ontario, Ministry of Health and Long Term Care.Smoking Prevalence: Canadian Community Health Survey 2003, 2005, 2007/2008 combined, Statistics Canada, Share File, Ontario Ministry ofHealth and Long-Term Care.Relative Risk for smoking and diseases attributable to smoking (excluding colorectal cancer and ulcer): Thun MJ, Day-Lally C, Myers DG, Calle EE,Flanders WD, Zhu BP, et al. Trends in tobacco smoking and mortality from cigarette use in cancer prevention studies I (1959 through 1965) and II(1982 through 1988). Bethesda, MD: US Department of Health and Human Services, Public Health Service, National Institutes of Health,National Cancer Institute; 1997. Relative Risk for smoking and colorectal cancer from: Chao A, Thun MJ, Jacobs EJ, Henley SJ, Rodriguez C, Calle EE. Cigarette smoking andcolorectal cancer mortality in the cancer prevention study II. J Natl Cancer Inst. 2000 Dec 6;92(23):1888-96. Relative Risk for smoking and ulcer: English DR, Holman CDJ, Milne E, Winter MJ, Hulse GK, Codde G, et al. The quantification of drug causedmorbidity and mortality in Australia 1995. Canberra, Australia: Commonwealth Department of Human Services and Health; 1995.
Male Female Total
Smoking Number Number of Number Number of Number Number of Attributable of Deaths of Deaths of Deaths Fraction Deaths Attributable Deaths Attributable Deaths Attributable (SAF)% to Smoking to Smoking to Smoking
OTHER DISEASES
Cervical cancer 9.4% – – 12 <5 12 <5
Kidney, 25.5% 21 8 13 <5 34 9Renal cancer
Bladder cancer 39.7% 21 10 9 <5 30 12
Acute myeloid 16.5% 11 <5 9 <5 20 <5leukemia
OTHER TOTAL 53 20 43 5 96 25
OVERALL TOTAL 1,218 453 1,042 236 2,260 689
Burden of Tobacco
29
Table 3.4Average Annual Number of Deaths† Attributable to Smoking, Peel, 2003-2007
Male Female Total
Smoking Number Number of Number Number of Number Number of Attributable of Deaths of Deaths of Deaths Fraction Deaths Attributable Deaths Attributable Deaths Attributable (SAF)% to Smoking to Smoking to Smoking
RESPIRATORY DISEASES
Bronchitis, 85.8% 9 8 <5 <5 13 11Emphysema
Chronic airway 76.8% 65 52 65 48 130 100obstruction
Pneumonia 18.2% 50 11 59 9 109 20and Influenza
Lung cancer 80.2% 181 160 129 89 310 249
Laryngeal cancer 81.2% 8 7 <5 <5 9 8
RESPIRATORY 313 238 258 150 571 388TOTAL
CARDIOVASCULAR DISEASES
Ischemic heart 16.3% 393 83 277 26 670 109disease
Cerebrovascular 16.3% 121 14 156 10 277 24diseases
Other heart 13.2% 93 19 133 11 226 30disease
Atherosclerosis 19.4% <5 <5 <5 0 6 <5
Aortic aneurysm 60.3% 26 17 12 6 38 23and dissection
Other arterial 17.5% 9 <5 10 <5 19 <5disease
CARDIOVASCULAR 645 136 591 55 1,236 191TOTAL
DIGESTIVE SYSTEM DISEASES
Ulcer 34.3% 6 <5 <5 <5 10 <5
Colorectal cancer 9.5% 87 9 76 7 163 16
Esophageal cancer 65.9% 24 17 10 6 34 23
Stomach cancer 21.4% 38 10 18 <5 56 12
Pancreatic cancer 23.8% 38 10 35 7 73 17
Cancer of the lip,oral cavity and 64.7% 14 11 7 <5 21 14pharynx
DIGESTIVE TOTAL 207 59 150 26 357 85
Table 3.4 continues ...
Table 3.4 continued
† Reflects cardiovascular, respiratory and ulcer hospitalizations for those aged 35 years and older.Cancer hospitalizations reflect those aged 30 years and older. Note: Number of hospitalizations reflects an annual average for the years 2005-2009. Sources: Hospital In-Patient Discharge Data 2005-2009, IntelliHEALTH Ontario, Ministry of Health and Long Term Care.Smoking Prevalence: Canadian Community Health Survey 2003, 2005, 2007/2008 combined, Statistics Canada, Share File, Ontario Ministry ofHealth and Long-Term Care.Relative Risk for smoking and diseases attributable to smoking (excluding colorectal cancer and ulcer): Thun MJ, Day-Lally C, Myers DG, Calle EE,Flanders WD, Zhu BP, et al. Trends in tobacco smoking and mortality from cigarette use in cancer prevention studies I (1959 through 1965) and II(1982 through 1988). Bethesda, MD: US Department of Health and Human Services, Public Health Service, National Institutes of Health,National Cancer Institute; 1997. Relative Risk for smoking and colorectal cancer from: Chao A, Thun MJ, Jacobs EJ, Henley SJ, Rodriguez C, Calle EE. Cigarette smoking andcolorectal cancer mortality in the cancer prevention study II. J Natl Cancer Inst. 2000 Dec 6;92(23):1888-96. Relative Risk for smoking and ulcer: English DR, Holman CDJ, Milne E, Winter MJ, Hulse GK, Codde G, et al. The quantification of drug causedmorbidity and mortality in Australia 1995. Canberra, Australia: Commonwealth Department of Human Services and Health; 1995.
Male Female Total
Smoking Number Number of Number Number of Number Number of Attributable of Deaths of Deaths of Deaths Fraction Deaths Attributable Deaths Attributable Deaths Attributable (SAF)% to Smoking to Smoking to Smoking
OTHER DISEASES
Cervical cancer 9.4% – – 12 <5 12 <5
Kidney, 25.5% 21 8 13 <5 34 9Renal cancer
Bladder cancer 39.7% 21 10 9 <5 30 12
Acute myeloid 16.5% 11 <5 9 <5 20 <5leukemia
OTHER TOTAL 53 20 43 5 96 25
OVERALL TOTAL 1,218 453 1,042 236 2,260 689
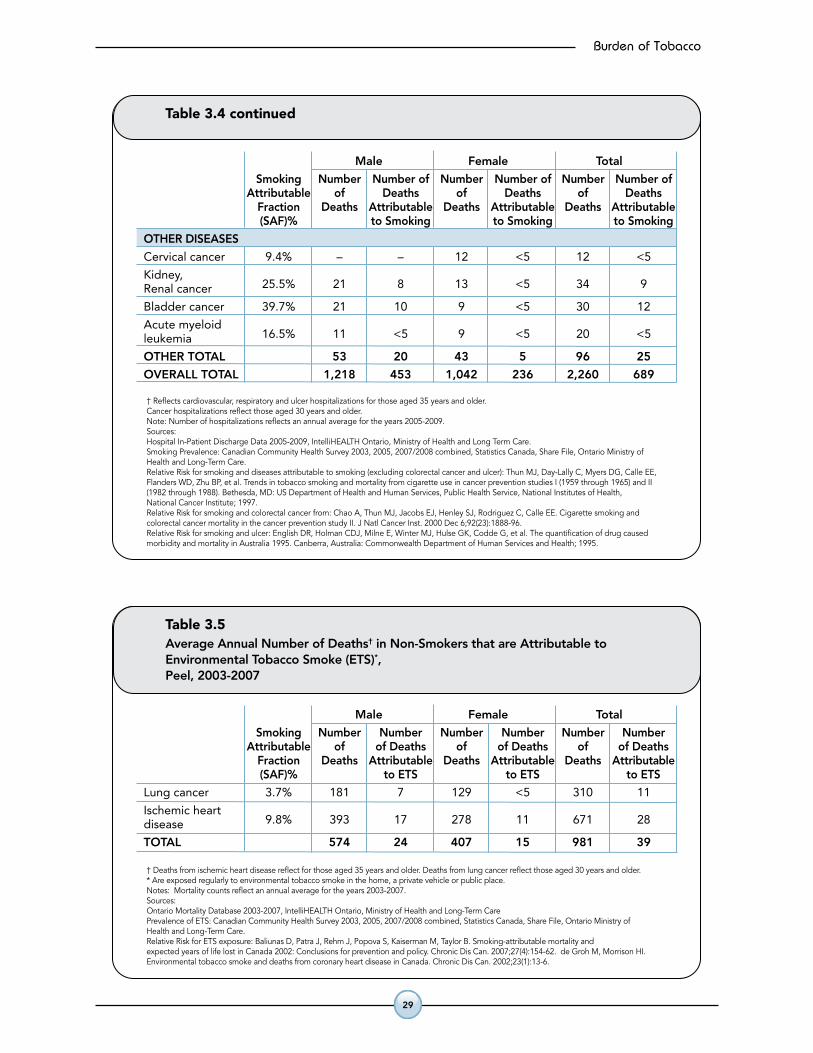
Table 3.5Average Annual Number of Deaths† in Non-Smokers that are Attributable toEnvironmental Tobacco Smoke (ETS)*,Peel, 2003-2007
† Deaths from ischemic heart disease reflect for those aged 35 years and older. Deaths from lung cancer reflect those aged 30 years and older.* Are exposed regularly to environmental tobacco smoke in the home, a private vehicle or public place.Notes: Mortality counts reflect an annual average for the years 2003-2007.Sources: Ontario Mortality Database 2003-2007, IntelliHEALTH Ontario, Ministry of Health and Long-Term CarePrevalence of ETS: Canadian Community Health Survey 2003, 2005, 2007/2008 combined, Statistics Canada, Share File, Ontario Ministry ofHealth and Long-Term Care.Relative Risk for ETS exposure: Baliunas D, Patra J, Rehm J, Popova S, Kaiserman M, Taylor B. Smoking-attributable mortality andexpected years of life lost in Canada 2002: Conclusions for prevention and policy. Chronic Dis Can. 2007;27(4):154-62. de Groh M, Morrison HI.Environmental tobacco smoke and deaths from coronary heart disease in Canada. Chronic Dis Can. 2002;23(1):13-6.
Male Female Total
Smoking Number Number Number Number Number Number Attributable of of Deaths of of Deaths of of Deaths Fraction Deaths Attributable Deaths Attributable Deaths Attributable (SAF)% to ETS to ETS to ETS
Lung cancer 3.7% 181 7 129 <5 310 11
Ischemic heart 9.8% 393 17 278 11 671 28disease
TOTAL 574 24 407 15 981 39
30
Burden of Tobacco
What does this mean?
Eliminating smoking would reduce the number of smoking-attributable deaths by 689 annually (two every day) in Peel. Lung cancer and ischemic heart disease comprise half of all smoking-related deaths. If you extrapolate from Canadian estimates of smoking-attributable death, the mortality estimate for Peel is much higher (around 1,400 deaths). However, this may be due to differences in Peel’s population structure (e.g., higher proportion of healthy immigrants, a lower smoking rate).
In Peel, exposure to environmental tobacco smoke results in approximately 40 deaths annually due to lung cancer and ischemic heart disease among non-smokers each year (approximately three deaths per month).
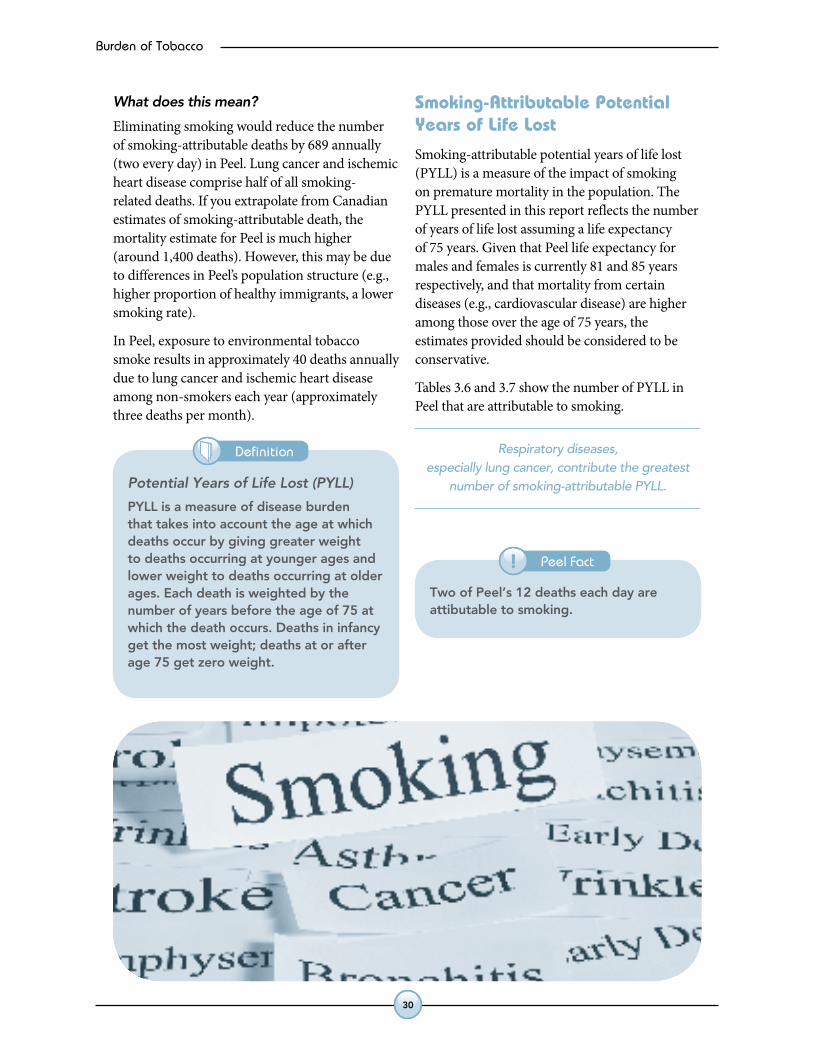
smoking-attributable Potential years of life lost
Smoking-attributable potential years of life lost (PYLL) is a measure of the impact of smoking on premature mortality in the population. The PYLL presented in this report reflects the number of years of life lost assuming a life expectancy of 75 years. Given that Peel life expectancy for males and females is currently 81 and 85 years respectively, and that mortality from certain diseases (e.g., cardiovascular disease) are higher among those over the age of 75 years, the estimates provided should be considered to be conservative.
Tables 3.6 and 3.7 show the number of PYLL in Peel that are attributable to smoking.
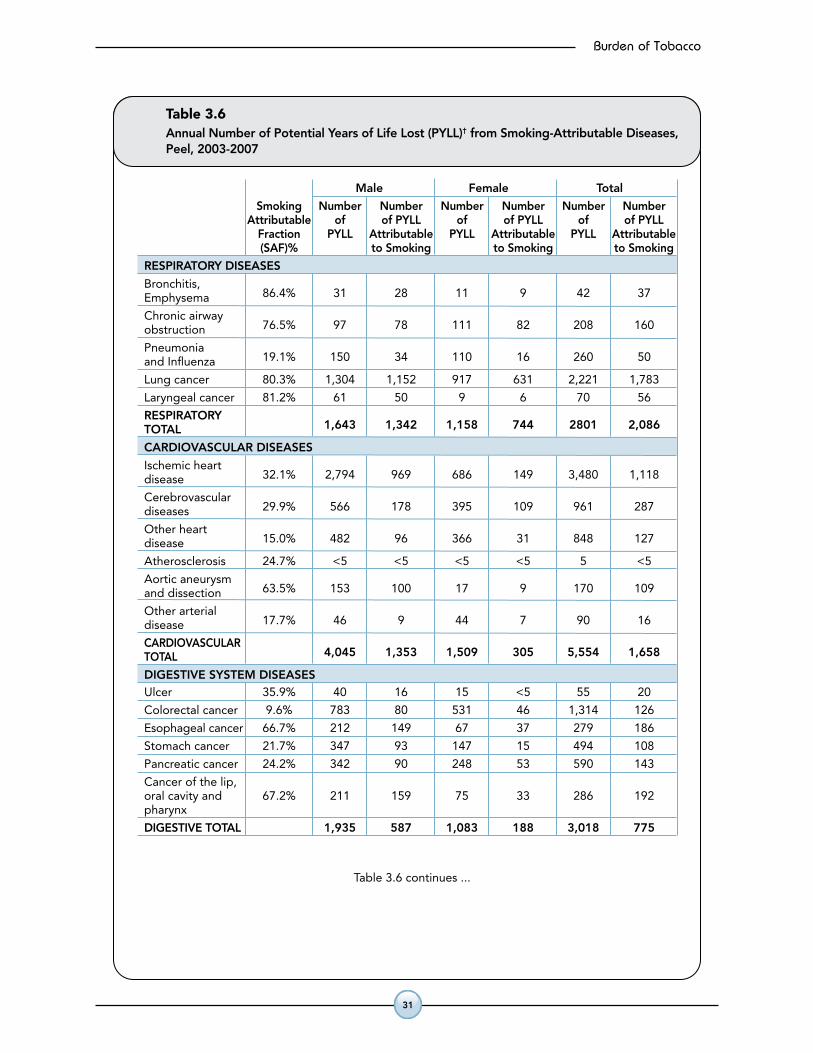
Respiratory diseases, especially lung cancer, contribute the greatest
number of smoking-attributable PYLL.Potential Years of Life Lost (PYLL)
PYLLisameasureofdiseaseburdenthattakesintoaccounttheageatwhichdeathsoccurbygivinggreaterweighttodeathsoccurringatyoungeragesandlowerweighttodeathsoccurringatolderages.Eachdeathisweightedbythenumberofyearsbeforetheageof75atwhichthedeathoccurs.Deathsininfancygetthemostweight;deathsatorafterage75getzeroweight.
TwoofPeel’s12deathseachdayareattibutabletosmoking.
?
!
X
?
!
X
Burden of Tobacco
31
Table 3.6Annual Number of Potential Years of Life Lost (PYLL)† from Smoking-Attributable Diseases,Peel, 2003-2007
Male Female Total
Smoking Number Number Number Number Number Number Attributable of of PYLL of of PYLL of of PYLL Fraction PYLL Attributable PYLL Attributable PYLL Attributable (SAF)% to Smoking to Smoking to Smoking
RESPIRATORY DISEASES
Bronchitis, 86.4% 31 28 11 9 42 37Emphysema
Chronic airway 76.5% 97 78 111 82 208 160obstruction
Pneumonia 19.1% 150 34 110 16 260 50and Influenza
Lung cancer 80.3% 1,304 1,152 917 631 2,221 1,783
Laryngeal cancer 81.2% 61 50 9 6 70 56
RESPIRATORY 1,643 1,342 1,158 744 2801 2,086TOTAL
CARDIOVASCULAR DISEASES
Ischemic heart 32.1% 2,794 969 686 149 3,480 1,118disease
Cerebrovascular 29.9% 566 178 395 109 961 287diseases
Other heart 15.0% 482 96 366 31 848 127disease
Atherosclerosis 24.7% <5 <5 <5 <5 5 <5
Aortic aneurysm 63.5% 153 100 17 9 170 109and dissection
Other arterial 17.7% 46 9 44 7 90 16disease
CARDIOVASCULAR 4,045 1,353 1,509 305 5,554 1,658TOTAL
DIGESTIVE SYSTEM DISEASESUlcer 35.9% 40 16 15 <5 55 20
Colorectal cancer 9.6% 783 80 531 46 1,314 126
Esophageal cancer 66.7% 212 149 67 37 279 186
Stomach cancer 21.7% 347 93 147 15 494 108
Pancreatic cancer 24.2% 342 90 248 53 590 143
Cancer of the lip,oral cavity and 67.2% 211 159 75 33 286 192pharynx
DIGESTIVE TOTAL 1,935 587 1,083 188 3,018 775
Table 3.6 continues ...
Table 3.6 continued
† Potential years of life lost reflect those aged 30 years and older for deaths due to cancer, and 35 years and older for deaths due to allother respiratory disease, cardiovascular disease and ulcer.Note: Potential years of life lost reflect an annual average from 2003-2007.Sources:Ontario Mortality Database 2003-2007, IntelliHEALTH Ontario, Ministry of Health and Long-Term CareSmoking Prevalence: Canadian Community Health Survey 2003, 2005, 2007/2008 combined, Statistics Canada, Share File, Ontario Ministry ofHealth and Long-Term Care.Relative Risk for smoking and diseases attributable to smoking (excluding colorectal cancer and ulcer): Thun MJ, Day-Lally C, Myers DG, Calle EE,Flanders WD, Zhu BP, et al. Trends in tobacco smoking and mortality from cigarette use in cancer prevention studies I (1959 through 1965) and II(1982 through 1988). Bethesda, MD: US Department of Health and Human Services, Public Health Service, National Institutes of Health,National Cancer Institute; 1997. Relative Risk for smoking and colorectal cancer: Chao A, Thun MJ, Jacobs EJ, Henley SJ, Rodriguez C, Calle EE. Cigarette smoking andcolorectal cancer mortality in the cancer prevention study II. J Natl Cancer Inst. 2000 Dec 6;92(23):1888-96. Relative Risk for smoking and ulcer: English DR, Holman CDJ, Milne E, Winter MJ, Hulse GK, Codde G, et al. The quantification of drug causedmorbidity and mortality in Australia 1995. Canberra, Australia: Commonwealth Department of Human Services and Health; 1995.
Male Female Total
Smoking Number Number Number Number Number Number Attributable of of PYLL of of PYLL of of PYLL Fraction PYLL Attributable PYLL Attributable PYLL Attributable (SAF)% to Smoking to Smoking to Smoking
OTHER DISEASES
Cervical cancer 9.4% – – 210 20 210 20
Kidney, Renal 29.6% 218 83 76 <5 294 86cancer
Bladder cancer 41.0% 93 43 30 8 123 51
Acute myeloid 17.1% 112 26 77 6 189 32leukemia
OTHER TOTAL 423 152 393 37 816 189
OVERALL TOTAL 8,046 3,434 4,143 1,274 12,189 4,708
32
Burden of Tobacco
Table 3.6Annual Number of Potential Years of Life Lost (PYLL)† from Smoking-Attributable Diseases,Peel, 2003-2007
Male Female Total
Smoking Number Number Number Number Number Number Attributable of of PYLL of of PYLL of of PYLL Fraction PYLL Attributable PYLL Attributable PYLL Attributable (SAF)% to Smoking to Smoking to Smoking
RESPIRATORY DISEASES
Bronchitis, 86.4% 31 28 11 9 42 37Emphysema
Chronic airway 76.5% 97 78 111 82 208 160obstruction
Pneumonia 19.1% 150 34 110 16 260 50and Influenza
Lung cancer 80.3% 1,304 1,152 917 631 2,221 1,783
Laryngeal cancer 81.2% 61 50 9 6 70 56
RESPIRATORY 1,643 1,342 1,158 744 2801 2,086TOTAL
CARDIOVASCULAR DISEASES
Ischemic heart 32.1% 2,794 969 686 149 3,480 1,118disease
Cerebrovascular 29.9% 566 178 395 109 961 287diseases
Other heart 15.0% 482 96 366 31 848 127disease
Atherosclerosis 24.7% <5 <5 <5 <5 5 <5
Aortic aneurysm 63.5% 153 100 17 9 170 109and dissection
Other arterial 17.7% 46 9 44 7 90 16disease
CARDIOVASCULAR 4,045 1,353 1,509 305 5,554 1,658TOTAL
DIGESTIVE SYSTEM DISEASESUlcer 35.9% 40 16 15 <5 55 20
Colorectal cancer 9.6% 783 80 531 46 1,314 126
Esophageal cancer 66.7% 212 149 67 37 279 186
Stomach cancer 21.7% 347 93 147 15 494 108
Pancreatic cancer 24.2% 342 90 248 53 590 143
Cancer of the lip,oral cavity and 67.2% 211 159 75 33 286 192pharynx
DIGESTIVE TOTAL 1,935 587 1,083 188 3,018 775
Table 3.6 continues ...
Table 3.6 continued
† Potential years of life lost reflect those aged 30 years and older for deaths due to cancer, and 35 years and older for deaths due to allother respiratory disease, cardiovascular disease and ulcer.Note: Potential years of life lost reflect an annual average from 2003-2007.Sources:Ontario Mortality Database 2003-2007, IntelliHEALTH Ontario, Ministry of Health and Long-Term CareSmoking Prevalence: Canadian Community Health Survey 2003, 2005, 2007/2008 combined, Statistics Canada, Share File, Ontario Ministry ofHealth and Long-Term Care.Relative Risk for smoking and diseases attributable to smoking (excluding colorectal cancer and ulcer): Thun MJ, Day-Lally C, Myers DG, Calle EE,Flanders WD, Zhu BP, et al. Trends in tobacco smoking and mortality from cigarette use in cancer prevention studies I (1959 through 1965) and II(1982 through 1988). Bethesda, MD: US Department of Health and Human Services, Public Health Service, National Institutes of Health,National Cancer Institute; 1997. Relative Risk for smoking and colorectal cancer: Chao A, Thun MJ, Jacobs EJ, Henley SJ, Rodriguez C, Calle EE. Cigarette smoking andcolorectal cancer mortality in the cancer prevention study II. J Natl Cancer Inst. 2000 Dec 6;92(23):1888-96. Relative Risk for smoking and ulcer: English DR, Holman CDJ, Milne E, Winter MJ, Hulse GK, Codde G, et al. The quantification of drug causedmorbidity and mortality in Australia 1995. Canberra, Australia: Commonwealth Department of Human Services and Health; 1995.
Male Female Total
Smoking Number Number Number Number Number Number Attributable of of PYLL of of PYLL of of PYLL Fraction PYLL Attributable PYLL Attributable PYLL Attributable (SAF)% to Smoking to Smoking to Smoking
OTHER DISEASES
Cervical cancer 9.4% – – 210 20 210 20
Kidney, Renal 29.6% 218 83 76 <5 294 86cancer
Bladder cancer 41.0% 93 43 30 8 123 51
Acute myeloid 17.1% 112 26 77 6 189 32leukemia
OTHER TOTAL 423 152 393 37 816 189
OVERALL TOTAL 8,046 3,434 4,143 1,274 12,189 4,708
Burden of Tobacco
33
What does this mean?
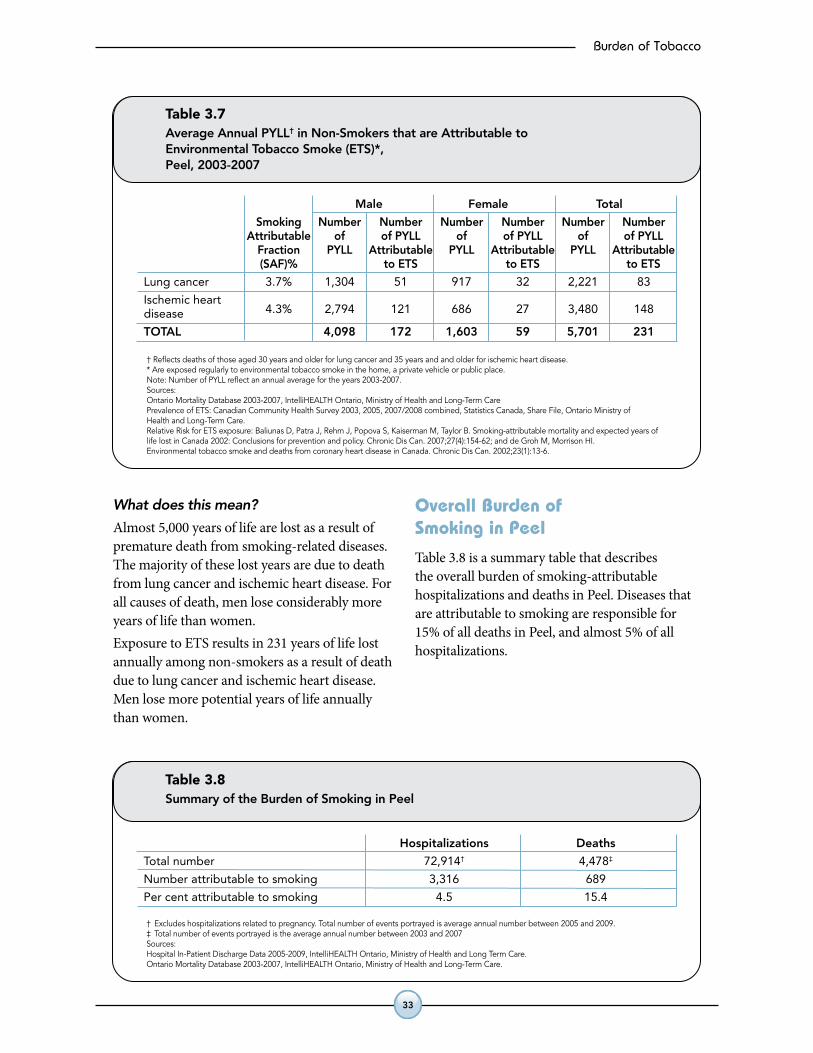
Almost 5,000 years of life are lost as a result of premature death from smoking-related diseases. The majority of these lost years are due to death from lung cancer and ischemic heart disease. For all causes of death, men lose considerably more years of life than women. Exposure to ETS results in 231 years of life lost annually among non-smokers as a result of death due to lung cancer and ischemic heart disease. Men lose more potential years of life annually than women.
overall burden of smoking in Peel
Table 3.8 is a summary table that describes the overall burden of smoking-attributable hospitalizations and deaths in Peel. Diseases that are attributable to smoking are responsible for 15% of all deaths in Peel, and almost 5% of all hospitalizations.
Table 3.7Average Annual PYLL† in Non-Smokers that are Attributable toEnvironmental Tobacco Smoke (ETS)*,Peel, 2003-2007
† Reflects deaths of those aged 30 years and older for lung cancer and 35 years and and older for ischemic heart disease.* Are exposed regularly to environmental tobacco smoke in the home, a private vehicle or public place.Note: Number of PYLL reflect an annual average for the years 2003-2007.Sources: Ontario Mortality Database 2003-2007, IntelliHEALTH Ontario, Ministry of Health and Long-Term CarePrevalence of ETS: Canadian Community Health Survey 2003, 2005, 2007/2008 combined, Statistics Canada, Share File, Ontario Ministry ofHealth and Long-Term Care.Relative Risk for ETS exposure: Baliunas D, Patra J, Rehm J, Popova S, Kaiserman M, Taylor B. Smoking-attributable mortality and expected years oflife lost in Canada 2002: Conclusions for prevention and policy. Chronic Dis Can. 2007;27(4):154-62; and de Groh M, Morrison HI.Environmental tobacco smoke and deaths from coronary heart disease in Canada. Chronic Dis Can. 2002;23(1):13-6.
Male Female Total
Smoking Number Number Number Number Number Number Attributable of of PYLL of of PYLL of of PYLL Fraction PYLL Attributable PYLL Attributable PYLL Attributable (SAF)% to ETS to ETS to ETS
Lung cancer 3.7% 1,304 51 917 32 2,221 83
Ischemic heart 4.3% 2,794 121 686 27 3,480 148disease
TOTAL 4,098 172 1,603 59 5,701 231
Table 3.8Summary of the Burden of Smoking in Peel
† Excludes hospitalizations related to pregnancy. Total number of events portrayed is average annual number between 2005 and 2009.‡ Total number of events portrayed is the average annual number between 2003 and 2007Sources: Hospital In-Patient Discharge Data 2005-2009, IntelliHEALTH Ontario, Ministry of Health and Long Term Care.Ontario Mortality Database 2003-2007, IntelliHEALTH Ontario, Ministry of Health and Long-Term Care.
Hospitalizations Deaths
Total number 72,914† 4,478‡
Number attributable to smoking 3,316 689
Per cent attributable to smoking 4.5 15.4
34
Burden of Tobacco
summary
This chapter described the disease burden caused by tobacco by quantifying the number of hospitalizations, deaths, and PYLL that are attributable to smoking.
In Peel:
•Thereareover3,000annualhospitalizationstoPeel residents attributable to smoking-related diseases. This is the equivalent of about nine hospitalizations per day.
•Eliminatingsmokingwouldreducethenumberof deaths attributable to smoking by 689 (almost two every day). Lung cancer and ischemic heart disease comprise half of all smoking-related deaths.
•Almost5,000yearsoflifearelostasaresultofdying from smoking-related diseases.
•Overall,thereare156hospitalizationseveryyear for lung cancer or ischemic heart disease that are attributable to someone else’s smoke (approximately 13 per month).
•ExposuretoETSresultsinapproximately40 deaths annually due to lung cancer and ischemic heart disease among non-smokers each year (approximately three deaths per month).
•ExposuretoETScontributesto231yearsoflifelost annually among non-smokers as a result of premature death due to lung cancer and ischemic heart disease.


![130225 - Apresentação 4Q12 - eng - SD [Somente leitura]static.telefonica.aatb.com.br/...Presentation_4Q12.pdf · 4Q11 3Q12 4Q12 Prepaid Postpaid 3.4% 16.7% YoY 6.4% 71.6 76.8 76.1-0.9%](https://img.pdfslide.us/doc/110x75/6023a9e9197e197ea758d359/130225-apresentao-4q12-eng-sd-somente-leitura-4q11-3q12-4q12-prepaid.jpg)