Embed Size (px)
Citation preview

GLOBALBURDENOFDIALYSISINITIATION
(ANDCONTINUATION)
VivekJhaGeorgeInsAtuteforGlobalHealthIndia

Disclosure of Interests
Employment
• George Institute for Global Health
Grants
• Baxter Healthcare, GSK
Consultancy
• NephroPlus, Baxter Healthcare
KDIGO Controversies Conference on Dialysis Initiation, Modality Choice & Prescription January 25-28, 2018 | Madrid, Spain

This is how it started
KDIGO Controversies Conference on Dialysis Initiation, Modality Choice & Prescription January 25-28, 2018 | Madrid, Spain

CARI Guidelines
Availability of resources should not be a reason to
deny a patient access onto dialysis.
Decisions to recommend or not to recommend dialysis should not be influenced by either availability
of resources or potential litigation.
KDIGO Controversies Conference on Dialysis Initiation, Modality Choice & Prescription January 25-28, 2018 | Madrid, Spain

2017 Annual Data Report Volume 2 ESRD, Chapter 11
IncidencerateoftreatedESRD(pmp),2015
Datasource:Specialanalyses,USRDSESRDDatabase.Datapresentedonlyforcountriesfromwhichrelevantinforma>onwasavailable.Allratesareunadjusted.^UnitedKingdom:England,Wales,NorthernIreland(Scotlanddatareportedseparately).DataforItalyincludefiveregions.DataforIndonesiarepresenttheWestJavaregion.DataforFranceexcludeMar>nique.DataforCanadaexcludesQuebec.Japanincludesdialysispa>entsonly.DataforLatviarepresents80%ofthecountry’spopula>on.Abbrevia>ons:ESRD,end-stagerenaldisease;sp.,speaking.NOTE:Datacollec>onmethodsvaryacrosscountries,sugges>ngcau>oninmakingdirectcomparisons.

2017 Annual Data Report Volume 2 ESRD, Chapter 11
PrevalenceoftreatedESRDpermillionpopulaAon,bycountry,2015
Datasource:Specialanalyses,USRDSESRDDatabase.Datapresentedonlyforcountriesfromwhichrelevantinforma>onwasavailable.^UnitedKingdom:England,Wales,NorthernIreland(Scotlanddatareportedseparately).Theprevalenceisunadjustedandreflectsprevalenceattheendof2015.Switzerlandincludesdialysispa>entsonly.DataforIndonesiarepresenttheWestJavaregion.DataforFranceexcludeMar>nique.DataforItalyincludesfiveregions.DataforCanadaexcludesQuebec.DataforLatviarepresents80%ofcountry’spopula>on.Abbrevia>ons:ESRD,end-stagerenaldisease;sp.,speaking.NOTE:Datacollec>onmethodsvaryacrosscountries,sugges>ngcau>oninmakingdirectcomparisons.

2017 Annual Data Report Volume 2 ESRD, Chapter 11
TrendsintheincidencerateoftreatedESRD(pmp),2002-2015
(a)TencountrieshavingthehighestpercentageriseinESRDincidenceratein2002/03versusthatin2014/15,plustheU.S.
Datasource:Specialanalyses,USRDSESRDDatabase.Allratesareunadjusted.DatafortheCzechRepublicaremissingfrom2012indicatedbythedashedline.DataforU.S.areshownforcomparisonpurposes.Abbrevia>on:ESRD,end-stagerenaldisease.NOTE:Datacollec>onmethodsvaryacrosscountries,sugges>ngcau>oninmakingdirectcomparisons.
2017 Annual Data Report Volume 2 ESRD, Chapter 11
TrendsintheincidencerateoftreatedESRD(pmp),2002-2015
Datasource:Specialanalyses,USRDSESRDDatabase.Allratesareunadjusted.Onlysixcountrieshadadecreaseinincidencefrom2002/03-2014/15.Abbrevia>on:ESRD,end-stagerenaldisease.NOTE:Datacollec>onmethodsvaryacrosscountries,sugges>ngcau>oninmakingdirectcomparisons.
(b)SixcountrieshavingthelargestpercentagedeclineinESRDincidencerate:2002/03versusthatin2014/15

2017 Annual Data Report Volume 2 ESRD, Chapter 11
PercentagechangeinthestandardizedincidencerateofESRDintheU.S.populaAon,1980-2015
DataSource:ReferenceTableA.2(2)andspecialanalyses,USRDSESRDDatabase.Standardizedforage,sex,andrace.Thestandardpopula>onwastheU.S.popula>onin2011.Abbrevia>on:ESRD,end-stagerenaldisease.
(b)One-yearpercentagechangeinstandardizedincidencerate

2017 Annual Data Report Volume 2 ESRD, Chapter 11
IncidencerateoftreatedESRD(pmp),bysexandcountry,2015
Datasource:Specialanalyses,USRDSESRDDatabase.Datapresentedonlyforcountriesfromwhichrelevantinforma>onwasavailable.^UnitedKingdom:England,Wales,NorthernIreland(Scotlanddatareportedseparately).DataforFranceexcludeMar>nique.DataforIndonesiarepresenttheWestJavaregion.DataforItalyrepresentfiveregions.DataforCanadaexcludesQuebec.Japanincludesdialysispa>entsonly.DataforLatviarepresents80%ofcountry’spopula>on.Abbrevia>ons:ESRD,end-stagerenaldisease;sp.,speaking.NOTE:Datacollec>onmethodsvaryacrosscountries,sugges>ngcau>oninmakingdirectcomparisons.
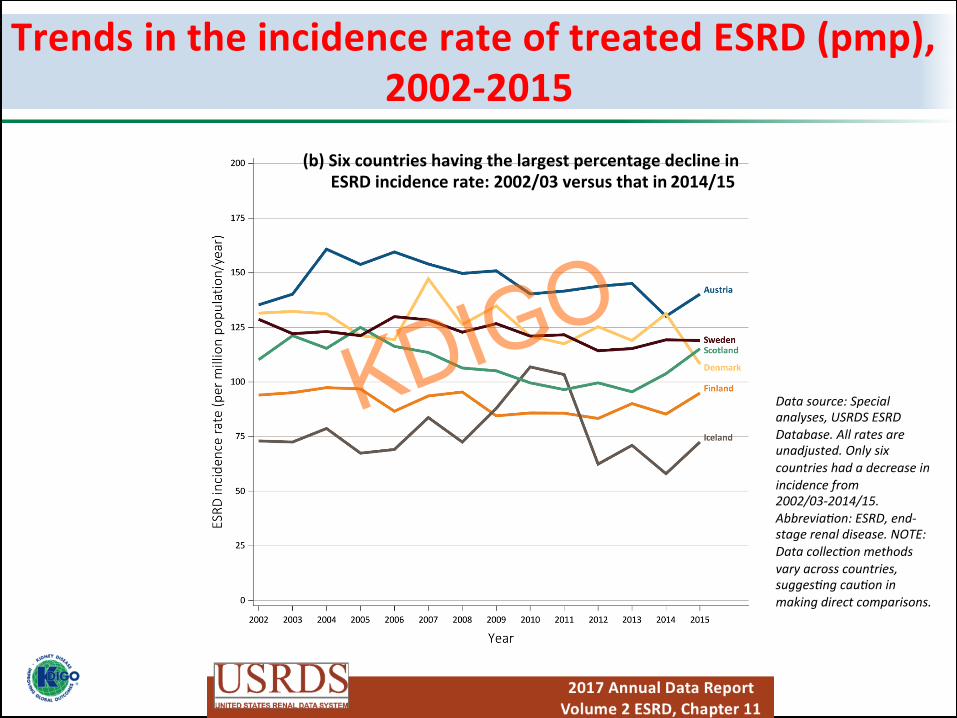
Worldwide Dialysis Population
90%

<50.0
100.0-499.9 500.0-999.9 1000.0-1999.9 ≥2000.0
Prevalence of patients received RRT (pmp)
50.0-99.9
No available data
123 countries for which the prevalence data could be obtained
KDIGO Controversies Conference on Dialysis Initiation, Modality Choice & Prescription January 25-28, 2018 | Madrid, Spain

Prevalence of hypertension or diabetes and prevalence of patients on dialysis in 123 countries.
Prevalence of dialysis (pmp)=exp(-9.540+ 0.150*prevalence of diabetes [%, p=0.21])*106
5 10 15 20
Prevalence of diabetes (%)
0.1
1
10
100
1,000
10,000
Pre
vale
nce
of d
ialy
sis
(pm
p)
Prevalence of dialysis (pmp)=exp(-9.576+ 0.039*prevalence of hypertension [%, p=0.42])*106
25 30 35 40 45 50 55
Prevalence of hypertension (%)
0.1
1
10
100
1,000
10,000
Pre
vale
nce
of d
ialy
sis
(pm
p)
Hypertension:BP ≥ 140/90 mmHg and/or use of antihypertensive agents
Diabetes:Fasting glucose level ≥ 7.0 mmol/L and/or use of glucose-lowering agents
Prevalence of hypertension Prevalence of diabetes
KDIGO Controversies Conference on Dialysis Initiation, Modality Choice & Prescription January 25-28, 2018 | Madrid, Spain

Prevalence of dialysis (pmp)=exp(-22.374+ 0.193*Life expectancy [years, p<0.001])*106
0.1
1
10
100
1,000
10,000
Pre
vale
nce
of d
ialy
sis
(pm
p)
50 60 70 80 90 Life expectancy at birth (years)
*Median age and life expectancy at birth were strongly correlated each other (r=0.78, p<0.001). The model including life expectancy at birth was more fitted than the model including median age of population.
Life expectancy at birth or GNI per capita and prevalence of patients on dialysis in 123 countries
Gross national income per capita (US$)
Prevalence of dialysis (pmp)=exp(-15.248+ 0.797*Log (GNI) [US$, p<0.001])*106
300 1,000 3,000 10,000 30,000 100,000 0.1
1
10
100
1,000
10,000
Pre
vale
nce
of d
ialy
sis
(pm
p)
Life expectancy at birth GNI per capita
KDIGO Controversies Conference on Dialysis Initiation, Modality Choice & Prescription January 25-28, 2018 | Madrid, Spain

Gonzalez-Bedat et al, Clin Nephrol 2015
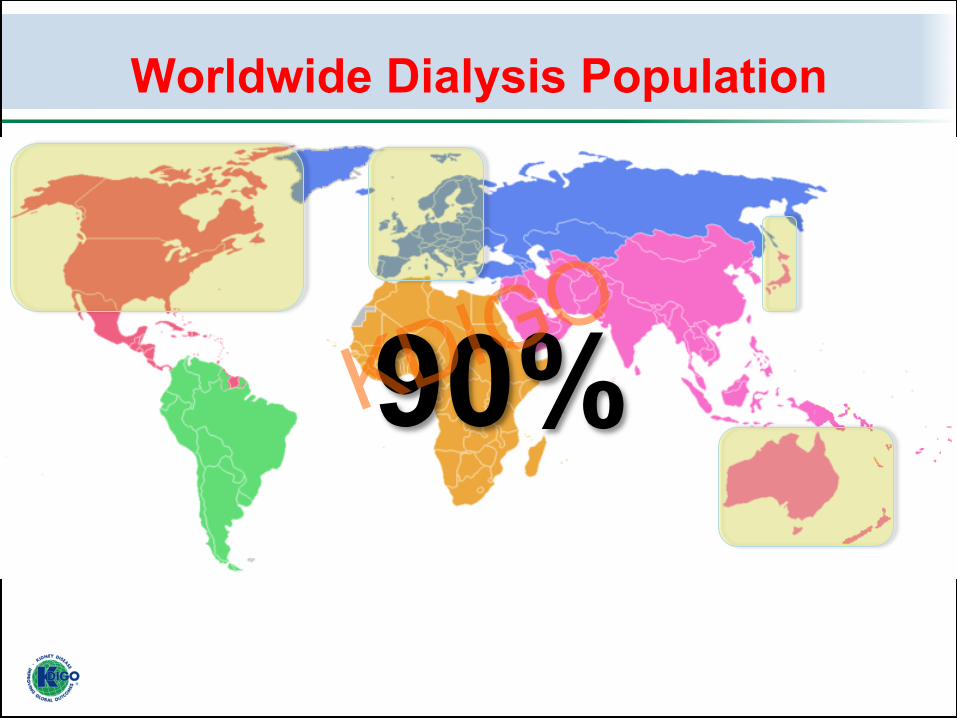
Association between age and prevalence of patients on dialysis in 20 high-income countries with available age-
specific data
Age (years)
Data from mainly European and Oceania countries (from 16 countriesa) )
Data from USA, Japan, Taiwan and Singapore
Prevalence of RRT (pmp)= exp(-8.80+0.04*Age [years, p<0.001])*106
Prevalence of RRT (pmp)= exp(-8.49+0.05*Age [years, p<0.001])*106
0
2,000
4,000
6,000
8,000
10,000
12,000
0 10 20 30 40 50 60 70 80
Pre
vale
nce
of R
RT
(pm
p)
a) Data from Australia, New Zealand, Austria, Belgium, Denmark, Finland, France, Greece, Iceland, Norway, Spain, Sweden, the Netherlands, United Kingdom, Canada and Saudi Arabia

<50.0
100.0-499.9 500.0-999.9 1000.0-1999.9 ≥2000.0
Prevalence of patients received RRT (pmp)
50.0-99.9
Estimated value
Global number of patients on dialysis in 2010 = 2.62 million
(Number of Dialysis: 2.05 million [78%]) *99% of these numbers were based on the actual data from 123 countries.
Global number of patients who received dialysis in 2010
Lityanange et al Lancet 2013

Prevalence of patients who received RRT and their numbers according to regions
Population (x billion)
Num
ber o
f RR
T ( x
mill
ion)
0
0.5
1.0
1.5
0.08
0.97
0.53
0.37
0.64
0.03
(1.03) (4.17) (0.74) (0.60) (0.35) (0.04)
Africa Asia Europe Latin America
North America Oceania
Regions
Population (x billion)
0
500
1,000
1,500
2,000
Pre
vale
nce
of R
RT
(pm
p)
80 232
719 626
1,840
695
(1.03) (4.17) (0.74) (0.60) (0.35) (0.04)
Africa Asia Europe Latin America
North America Oceania
Regions KDIGO Controversies Conference on Dialysis Initiation, Modality Choice & Prescription
January 25-28, 2018 | Madrid, Spain Lityanange et al Lancet 2013

Prevalence of patients who received RRT and their numbers according to World Bank income groups
World Low Lower- middle
High
0
500
1,000
1,500
2,000
Pre
vale
nce
of R
RT
(pm
p)
379
1,473
318
69 20
Upper- middle
(6.92) (0.79) (2.50) (2.52) (1.11) Population (x billion)
Income groups
World
Num
ber o
f RR
T ( x
mill
ion)
0
0.5
1.0
1.5
2.0
2.5
3.0 2.62
High 1.63 (62.1%)
Upper- middle
0.80 (30.7%)
Low 0.02
(0.6%) Lower- middle
0.17 (6.6%)
Income groups
Income groups GNI per Capita (US$) Low: ≤$1,005 Lower-middle: $1,006-$3,975 Upper-middle: $3,976-$12,275 High: ≥$12,276 Lityanange et al Lancet 2013

Difference between numbers of people on and those who need RRT
World
Prevalence of people received RRT
Prevalence of people possibly requiring RRT estimated by the model based on the data from high income countries of mainly European and Oceania countries
Population (x million) (6,915)
Num
ber o
f pat
ient
s ( x
mill
ion)
2.62
4.90
-47%
0
1.0
2.0
3.0
4.0
5.0
6.0
(1,031)
Africa (4,165)
Asia (740)
Europe (596) Latin
America
(346) North
America
(36)
Oceania
0.08
0.51
-84% 0.97
2.88
-66%
0.53 0.76
-30%
0.37 0.40
-7% 0.64
0.32
+97%
0.030.03
-16%
Regions Liyanage et al Lancet 2015

Difference between numbers of RRT and ESKD worldwide and by income levels
World Low income Lower-middle Upper-middle High income
Prevalence of RRT Prevalence of ESKD estimated by the conservatively-estimated model Prevalence of ESKD estimated by the high-estimated model
Population (x million) (6,915) (793) (2,496) (2,520) (1,105)
Income levels
Num
ber o
f pat
ient
s ( x
mill
ion)
-73%
0
2.0
4.0
6.0
8.0
10.0
2.62
4.90
9.70
-47%
0.02 0.41 0.76
-96%
-98%
0.17
1.49
2.83 -88%
-94%
0.80
1.90
3.78
-58%
-79%
1.63 1.11
2.33 +47%
-30%
12.0


Africa (0.08→0.24)
Asia (0.97→2.16)
Europe (0.53→0.83)
Latin America (0.37→0.90)
North America (0.64→1.26)
Oceania (0.03→0.05)
World
Num
ber o
f RR
T (x
mill
ion)
0
1.0
2.0
3.0
4.0
5.0
6.0
7.0
8.0
Year 2010 2015 2020 2025 2030
Year 2010 2015 2020 2025 2030
0.0
1.0
2.0
3.0
Num
ber o
f RR
T (x
mill
ion)
Region
Trend in the estimated number of dialysis patients
2.62 3.13
3.78
4.53
5.44
Lityanange et al Lancet 2013

Prosperity and access to dialysis
Jha et al Lancet 2013
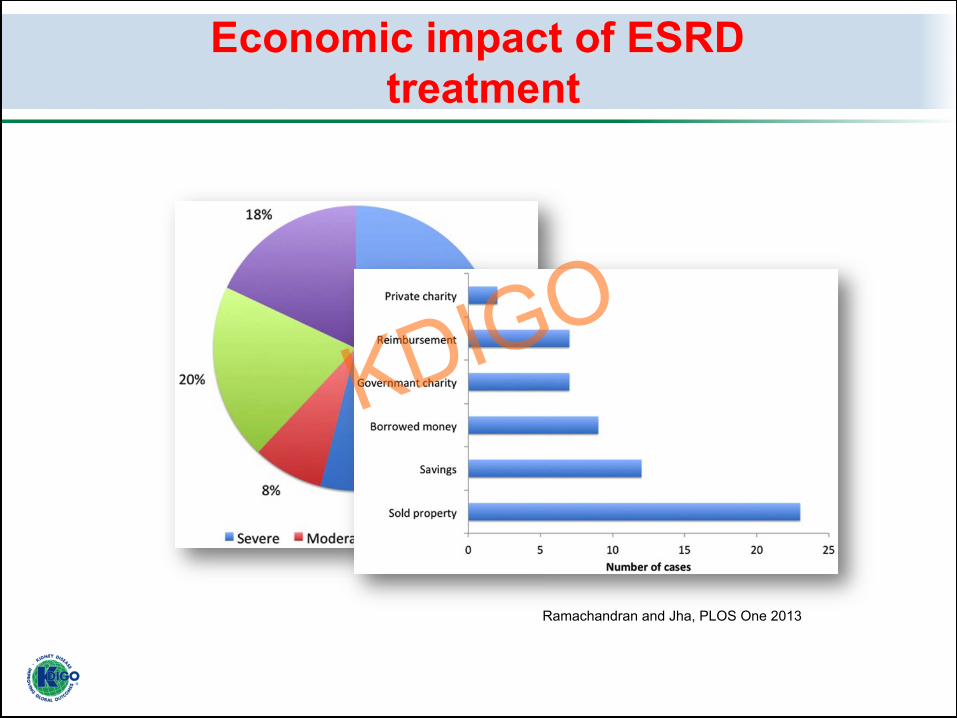
Economic impact of ESRD treatment
Ramachandran and Jha, PLOS One 2013

2018 2023
1400 -1500 pmp
1900 -2000 pmp
1073 pmp
2013
Courtesy: Kriang Tungsanga
What happens when financial barrier is removed?

What happens when the financial barrier is removed?
30
41 47
70
30
54
89
120
0
20
40
60
80
100
120
140
2008-09 2009-10 2010-11 2011-12
Num
ber p
er m
illio
n of
the
popu
latio
n
Annual incidence No. dialysed in the year
Shaikh M, et al (submitted)

Survival on HD (2008-12, n=13,118)
Shaikh M, et al (submitted)

Survival on HD (2008-12, n=13,118)
Shaikh M, et al (submitted)
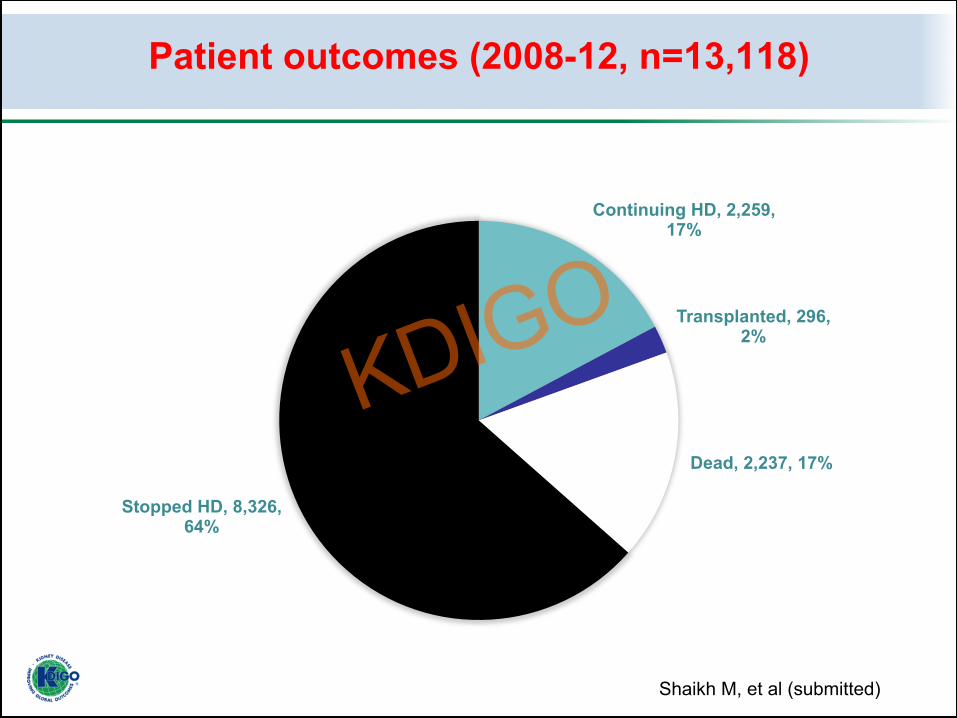
Patient outcomes (2008-12, n=13,118)
Continuing HD, 2,259, 17%
Transplanted, 296, 2%
Dead, 2,237, 17%
Stopped HD, 8,326, 64%
Shaikh M, et al (submitted)


Blagg CR, Hemodial Int 2012
Rationing practices
KDIGO Controversies Conference on Dialysis Initiation, Modality Choice & Prescription January 25-28, 2018 | Madrid, Spain

9 November 1989
DialysisaccessisrelatedtopoliAcalsituaAon

Change in incidence of RRT in central and eastern Europe (2001, 2004)
0 20 40 60 80
100 120 140 160 180
Rutkowski, Ethn Dis 2009

Factors that impact dialysis initiation
• GDP per capita • Percentage of GDP spent on health care • Dialysis reimbursement rate • Private for-profit share of dialysis
provision • Fragmentation of healthcare services • Renal unit distribution • Workforce availability
KDIGO Controversies Conference on Dialysis Initiation, Modality Choice & Prescription January 25-28, 2018 | Madrid, Spain

Factors that affect numbers on dialysis
• Expanding insurance coverage • Presence of CKD care plan • Rationing policies • Choice of dialysis modality (HD v PD) • Incremental dialysis • Advance care planning
KDIGO Controversies Conference on Dialysis Initiation, Modality Choice & Prescription January 25-28, 2018 | Madrid, Spain

Global Dialysis burden
All ESRD
Recognized
Access RRT
Stay on RRT

Data/registries Financing
Workforce Governance and policy
Gaps in dialysis initiation
KDIGO Controversies Conference on Dialysis Initiation, Modality Choice & Prescription January 25-28, 2018 | Madrid, Spain
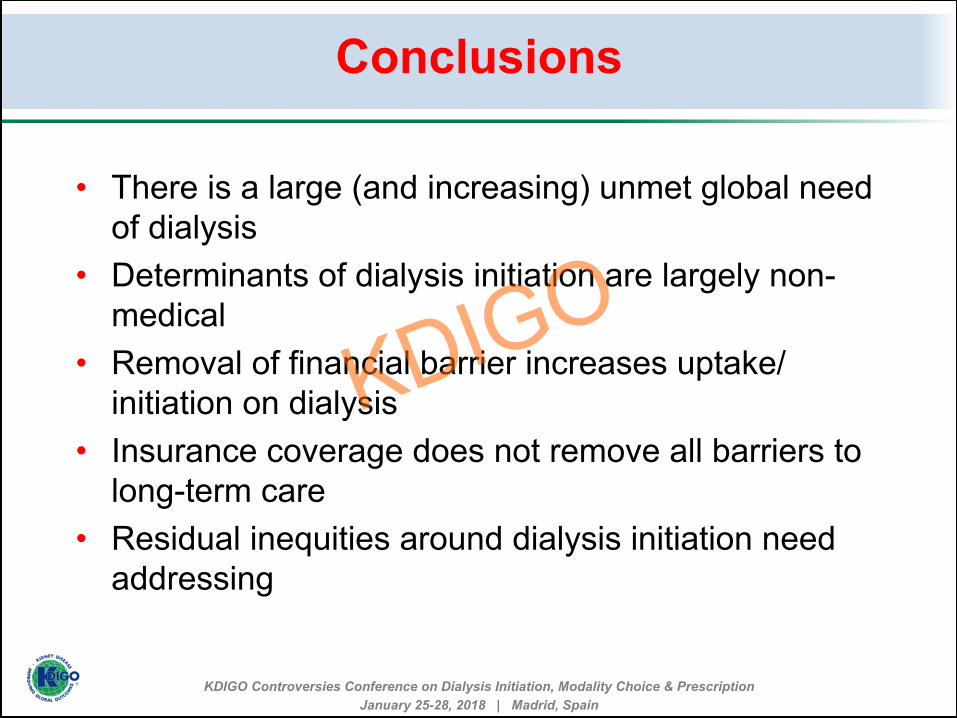
Conclusions
• There is a large (and increasing) unmet global need of dialysis
• Determinants of dialysis initiation are largely non-medical
• Removal of financial barrier increases uptake/initiation on dialysis
• Insurance coverage does not remove all barriers to long-term care
• Residual inequities around dialysis initiation need addressing
KDIGO Controversies Conference on Dialysis Initiation, Modality Choice & Prescription January 25-28, 2018 | Madrid, Spain