Embed Size (px)
Citation preview
Impact of Mergers and Acquisitions on Types of Earnings Management during Crisis: A
study on Chinese Listed Firms
Suman Lodh
Middlesex University
Middlesex University Business School
The Burroughs, Hendon, London
NW4 4BT, UK
Contact No: +44 (0) 2084115584
Email: [email protected]
Monomita Nandy1
Brunel University London,
Brunel Business School
Kingston Lane, Uxbridge,
Middlesex, UB8 3PH
Contact No: +44 (0)1895 268300
Email: [email protected]
Abstract1 Corresponding author
1
In this research study we examine the impact of domestic and cross-border merger and
accusations on types of earnings management practice followed by the managers of the
Chinese firms. Similar studies either focus on developed market or they consider the accrual
earnings management in the context of M&As. We not only extend these studies but by
considering the recent financial crisis time we contributed to the existing literature to a great
extent. Our sample consists of 1948 observations for the year 2004-2013. We find that
managers in domestic M&As substitute real earnings management for accrual-based earnings
management during the financial crisis. Moreover, real earnings management has been
exercised in cross-border M&As for both before and during crisis period. The findings of the
study will enhance the relevant literature and will guide the policy makers in evaluating the
exiting corporate governance mechanisms applied in the second largest economy in the
world.
Keywords: Accrual earnings management; Real earnings management; Mergers and
acquisition; Financial crisis; China
1. Introduction
2
Anecdotal evidence has documented that managers increase the receipt of sales or defer
expenses in order to window-dress current financial performance either by increasing or
decreasing earnings, for instance before management buyout (DeAngelo, 1986; Perry and
Williams, 1994), initial public offering (IPO) or seasoned equity offerings (SEO) (Aharony et
al., 2000; Cohen and Zarowin, 2010), and stock takeover (Erickson and Wang, 1999; Louis,
2004). This is termed as earnings management carried out by adjusting accruals or
constructing real transactions to manipulate earnings in current year. In addition to these
studies, there is another stream of research that has enriched the context of earnings
management, is in the area of mergers and acquisitions (M&A) (e.g. Erickson and Wang,
1999; Koumanakos et al. 2005; McNichols and Stubben 2008; Bens et al. 2012; Zhang,
2015). During the recent years M&As manifest one of the most important outside expansion
strategies, especially in the emerging markets such as China and India. But most of the
existing studies either focus on developed market or consider only one type of earnings
management (Erickson and Wang, 1999; Louis, 2004). So, it is worthwhile for us to
investigate the choice of earnings management in M&As in emerging economic environment
for several reasons. Firstly, previous studies focus on examining earnings management in
M&As activities that only highlight the accrual-based earning management ignoring real
earnings management (Erickson and Wang, 1999; Louis, 2004) or only focus on real earnings
management (Zhang, 2015). Even though a few studies mention both types of earnings
management (e.g. Claude et al. 2012), but they fail to systemically compare these two
distinctive methods. Secondly, prior studies discuss that managers indeed engage in earnings
management when there is a takeover (e.g. Easterwood, 1998; Louis, 2004 etc.). However, it
is hard to find studies aiming at domestic and cross-border takeovers together that may affect
earnings management. Thirdly, the changes in outside economic environment are potential
factors that not only influence earnings management (Yew et al, 2007) but also affect M&As
activities (Chen and Young, 2008). This motivates us to consider the recent financial crisis in
this study.
In this study, we investigate earnings management by Chinese acquiring firms listed
in Chinese A-stock market. The M&As have witnessed a rapid increase in China since 1990s
and but encountered a big shock around the year 2001 during the Asian economic recession
(Tang and Metalli, 2012). But how does the earnings management behavior change during
the recent financial crisis? To fill this gap in the literature we test the preference and tendency
for earnings management of Chinese listed firms involved in M&As before and after the
3
financial crisis. During the last decades, China encounter with many corporate governance
challenges, which change the existing policies and investment environment. Such changes
allow investors and scholars to expect an unprecedented healthy growth of M&As activities
in China. Moreover, during the past years, we also find rapid expansion of foreign direct
investment (FDI) and impressive outward FDI that mainly takes place due to favorable cross-
border policies by Chinese government (Grave et al, 2012). These changes motivate us to
distinguish between domestic and cross-border M&As in China and also identify the changes
in the trends of M&As before and after the financial crisis.
Recent studies demonstrate that acquiring firms have abnormal discretionary accruals
in domestic M&As especially in stock-to-stock takeovers (Erickson and Wang, 1999; Louis,
2004; Higgins, 2012), which is a measure of accrual-based earnings management. The value
of discretionary accruals is either negative or positive which is an indicator of decreasing or
increasing earnings manipulation. In a very recent study Zhang (2015) finds that Chinese
acquiring firms also carry out the real earnings management (indicated by low abnormal cash
flows from operations, discretionary expenses and relatively high abnormal production cost)
during the years 2008-2010. The literature on earnings management highlights the advantages
of doing real earnings management. For instance, through manipulating operating activities,
real earnings management is less likely to violate the accounting regulations than altering
accruals in accrual-based earnings management (Cohen and Zarowin, 2010; Zang, 2012).
When the outside regulations and securities are tightened, managers are more likely to
exercise real earnings management instead of accrual-based earnings management, because
there is a low chance of detection by the auditors (Roychowdhury, 2006). Consequently, real
earnings management is considered as more costly than accrual as it affects the long-term
performance of firms (Graham et al, 2005). Because of the varying effects of accrual and real
earnings management, it is important to discuss the types of earnings management to get a
detailed idea about the preference of managers of firms undergoing M&As. To cope up with
the financial crisis, Chinese listed companies start adhering to many restrictions including the
advanced accounting standard. So, it is possible that these restrictions force the managers of
these firms to choose real earnings management. Furthermore, we expect that acquiring
firms, which are generally owned by state in cross-border takeovers, may prefer real earnings
management because of highly stringent legal risks.
Because of the above-mentioned reasons we test the impact of two types of M&As in
China on the types of earnings management during the recent financial crisis. We use a
4
sample of 1948 firm-year observations from 2004 to 2013. First we test whether the tendency
of types of M&As differs between domestic and cross-border M&As before and after the
financial crisis. Then we explore whether the different types of M&As can explain accrual-
based and/or real earnings management of the acquiring firms. Following Dechow et al.
(1995), we measure accrual-based earnings management by discretionary accruals in two
different models. To capture the extent of real earnings management, we follow
Roychowdhury (2006) and construct abnormal cash flows from operation, abnormal
discretionary expenses and abnormal production cost respectively as indictors. We also create
comprehensive proxies of earnings management. We model all measures of earnings
management as a function of types of M&As before and after financial crisis. In addition,
consistent with existing literature, we control for other proxies of target companies (see e.g.
Cohen et al, 2008; Bok, 2009; Chaney et al, 2001; Zang, 2012; Geert et al, 2015).
The findings of this study contribute to the ongoing research related to earnings
management in two ways. First, it complements a growing body of literature on earnings
management and M&As. Prior studies provide evidence that managers exercise earnings
management when they involve in import duty (Jone, 1991), IPO and SEO (Aharony et al,
2000; Cohen and Zarowin, 2010) and stock-financed domestic takeovers (Erickson and
Wang, 1999; Louis, 2004). By investigating Chinese listed companies and both real and
accrual-based earnings management, we extend the previous studies (Erickson and Wang,
1999; Shleifer and Vishny, 2003; Louis, 2004) that prove corporate managers have strong
incentives to alter earnings prior to M&As. It also has important implication for studies
aiming at the emerging markets. Moreover, we focus domestic and cross-border M&As and
find their different impact on earnings management. We fill the gap in the research by
documenting types of M&As as a powerful factor of earnings management. In addition, our
study adds to the extant literature of accrual-based and real earnings management (Cohen and
Zarowin, 2010; Zang, 2012; Geert et al, 2015). If firms endured new legislations (e.g.,
Sarbanes-Oxley Act), they shift from one type of earnings management to another (Cohen et
al, 2008). Alternatively, the firms trade-off between real earnings manipulation and accrual
adjustment due to their relative costliness (Zang, 2012) or for their specific firm
characteristics such as, political connections (Geert et al., 2015). Current evidence from
earnings management in M&As normally focuses on accrual-based earnings management and
ignores the potentially hazardous influences of real earnings management. Our results extend
the literature by indicating that firms’ trade-off between real versus accrual-based earnings
5
management in connection with different types of M&As. Our study also contributes to
growing literature on the recent financial crisis. We examine the tendency of M&As in China
during the global financial crisis. It enriches the literature as scholars have claimed that
Chinese M&As activities maintain a strong growth in the recent decade and will keep a good
performance in the future (Grave et al., 2012). Previous studies that target at developed
countries such as Singapore during Asian financial crisis in 1997 (Yew et al, 2012) and
Australia during 2006 -2009 (Mollik et al., 2013) have only considered accrual-based
earnings management. We contribute to this line of research by manifesting the choices in
types of earnings management over financial crisis period.
The rest of the paper is organized as follows. Section 2 provides an overview of prior
related literature and develops our research hypotheses to test the association of impacts of
M&As on types of earnings management. Section 3 describes sample selection, the
measurement of earnings management, empirical models and results followed by robustness
test. Section 4 draws the conclusion, discuss and limitation of our paper and indicate
suggestions for further studies.
2. Literature Review and Hypotheses Development
2.1 Theoretical Framework
Mergers and Acquisitions (M&As) refer to the process of gaining other companies’ actual
right of control. In our study, we identify three categories of M&As that are mergers,
consolidation and acquisition (Hillier, 2013) (Refer Appendix 1 for detail definition). Most
studies (Berkovitch and Narayanan, 1993; Chen and Young, 2010; Danbolt and Maciver,
2012) agree that the essence of M&As is a behavior of ownership trading and capital
operations (Refer Appendix 2). From the economics perspective, there is no wide difference
among mergers, acquisition and consolidation, so this paper does not distinguish these instead
and we use the acronym M&As.
As a number of M&As is taking place in China, it allows us to study the earnings
management behavior of managers in those companies. Following the extant literature (e.g.,
Cohen and Zarowin, 2010, Zang, 2012) we test accrual-based and real earnings management
to get an in depth knowledge about the preferences of the managers associated with M&As in
6
China. A brief description of the two types of earnings management and its comparative
advantages and disadvantages are summarized in Appendix 3.
The empirical evidence indicates the existence of earnings management for firms
involved in M&As activities. DeAngelo (1986) studies the accounting decisions of 64
companies made by managers who plan the management buyouts. By systematically reducing
the total accruals, managers understate earnings before management buyouts. Subsequently,
Perry and Williams (1994) follow DeAngelo’s work and select a sample of 175 management
buyouts from 1981 to 1988. Finally, the results indicate that in the year before the public
announcement of mergers, there exists a manipulation of discretionary accruals in the
predetermined direction. At the beginning of the takeover attempt, managers of acquiring
firms systematically engage in increasing reported earnings in the quarter’s immediately
beforehand (Easterwood, 1998). In a similar study, Erickson and Wang (1999) analyze
unexpected accounting accruals of 78 acquiring firms involved in a negotiated stock for stock
mergers. Acquiring firms have an incentive to increase its stock prices to reduce the amount
of shares that are used in exchange. The results confirm that acquiring companies attempt to
manipulate accounting earnings upward. Shleifer and Vishny (2003) point out that the
financial decision is the most crucial factor in M&As. When managers realize that altering
the value of firms can benefit M&As, there is a powerful incentive for firms to get equity
overvalued even by earnings manipulation. Louis (2004) cover 373 mergers of publicly
traded firms, headquartered in the USA, including 236 pure stock for stock payments and 137
pure cash payments. As for stock swap acquirers, there are significant positive abnormal
accruals in the quarter before buyouts announcements, which is anticipated by earnings
manipulation. However, in cash purchases, changes of discretionary accruals are not
significant as stock swap. Later on, Scott (2007) supports that merged banks manipulated
earnings in the preceding year and the year prior to the preceding year. In the Canadian stock
market, consistent with prior studies, acquirers also have incentives to manage earnings
upward in the periods preceding the deal (Claude et al, 2012). Whereas, given the Canada’s
strict legislation, managers are prevented to some degree from involving in opportunistic
earnings management in stock-financed M&As. On the Tokyo Stock Exchange market, many
Japanese mergers are transacted by stock swaps so that acquirers engage in upward earnings
management to reduce the amount of shares and avoid the dilution of their controlling
position (Higgins, 2012). As managers deduce that overestimating or underestimating the
7
market value of firms can benefit M&As, they have incentives to manipulate earnings. Many
factors, such as asymmetric information and difficulties in financing medium, can bring
variety of risks into M&As. If M&As are going to fail, companies lose the brilliant
opportunity to expand or it may damage the reputation of executives. Furthermore, it may
affect investors’ confidence in acquiring firms (Louis, 2004). All these incentives and
pressure give rise to manage earnings prior to the implementation of M&As. For these
reason, in order to reserve a portion of profit margins for the impending companies’
performance after M&As, acquiring firm have incentives to manage downward earnings in
the pre-merger years (Perry and Williams, 1994). After M&As, acquiring companies may
face inefficient operation, cultural conflicts and agency problem, to name few problems (see
Reynolds and Teerikangas, 2015). Similarly, in order to maintain the good corporate
performance in current year, managers make every effort to change the adverse situation and
may prefer to do earnings management. So they are able to deliver a growing and healthy
signal to shareholders and investors (Shleifer and Vishny, 2003). Thus, positive earnings can
avoid investors’ panic about the drastic changes in capital structure (Easterwood, 1998).
The above discussion indicates that the managers associated with firms undergoing
M&As are very often motivated to do earnings management. The literature on earnings
management shows evidence of differential impact of accrual and real earnings management
in many other contexts such as change in operational environment or happening of an event
(e.g., Cohen and Zarowin, 2010; Greet et al., 2015). The evidence shows that accrual earnings
management can only be done at the end of financial year ,which may not match with the
time of M&As. Moreover, as the accrual methods are easily detectable by auditors, managers
refer real earnings management at the cost of long-term performance of the firms (Graham et
al., 2005). In addition, the global financial crisis insists the policy makers of the growing
Chinese economy to bring in advanced restricted rules and regulations. So, we assume that
the changes in policy increase the transparency in the economy, which may also affect the
preference of the earnings management practices of the managers. Thus, we test the
preference of two types of earnings management (accrual and real) for managers of Chinese
listed companies involved in M&As during crisis.
Most of the studies have examined earnings management in developed countries such
as the United States, Japan, and Canada, while the tendency has recently shifted to the
8

emerging markets, especially towards China due to its significant development in the capital
market. The earnings management in China apparently distinguishes from that in the United
States on account of the tight political and economic relationship between listed companies
and the local government and condensed ownership within listed companies (Yang et al,
2012). The majority of previous studies focus on earnings management that arise before
specific operating events, such as IPO, Seasoned Equity Offerings (SEOs), and import relief
(Jones, 1991; Aharony et al, 2000; Cohen and Zarowin, 2010). At the same time, there are
relatively fewer studies, which have investigated the earnings management when the
company intends to do M&As (Erickson and Wang, 1999; Louis, 2004; Higgins, 2012).
Overall, academics have shown its interest in earnings management in the context of M&As.
During their research, they either treat the acquiring firm or target firm as an objective or look
at the effect of certain variables, for instance the payment of takeovers and ownership
structure (Botsari and Meeks, 2008; Claude et al, 2012). Nevertheless, most scholars detect
the accrual-based earnings management and do not pay much attention to real earnings
management. In terms of Chinese listed companies, the pertinent literature is limited that
demonstrates the existence of accrual-based earnings management in stock for stock M&As
(Chen et al, 2008). Thus, there is a gap in the literature regarding which types of earnings
management are preferred by the firms engaged in M&As in China.
The landscape of M&As has changed during the global financial crisis. Chance is
given to the emerging markets mainly to the main BRIC countries (Brazil, Russia, India and
China) as there exist new identifiable takeover targets (Grave et al, 2012). M&As are very
popular in the United States, Europe and Japan, but those world’s largest consumer markets
have witnessed a radical shift during crisis (Tang and Metalli, 2012). In response to the
financial turmoil, acquiring firms diversify their investment by aiming at growth beyond their
domestic regions. The financial tsunami not only has affected the consumer markets, but also
has caused a sluggish capital market so that it becomes much difficult for firms to finance any
new or existing projects. Under the unfavorable economic environment, an incentive to
manipulate earnings is facilitated. In the study of Asian financial crisis in 1997, Chia et al.
(2007) find that managers have engaged in decreased-earnings management in Singapore’s
service industry. The rationale behind this phenomenon is that stakeholders are fully prepared
to take losses in financial crisis as long as the company can indicate relative evidence in
progressive financial performance in the future. Consequently, managers seize this
9
opportunity to decrease their earnings properly in order to window-dress profit in the future.
However, it is hard to find any further study related to earnings management in the context of
M&As during financial crisis especially on China. We bridge this gap in the literature by
examining the impact of M&As on types of earnings management during crisis.
2.2 Hypotheses Development
In China, the first M&A activity occurred considerably late than other counterparties around
the world. Because of sluggish social-economic system and reform of state-owned
companies, the Chinese M&As activities still remain in infant stage until 1987. In 2007,
when financial tsunami sweeps around the world, albeit with some regional diversity, an
overall steep decline in global M&As is observed on average deal value and volume and it
continues until 2012 (Bloomberg, 2014). The global M&As deal volume shrinks dramatically
from 31,757 transactions in 2007 to 23,047 in 2008. In the meantime, global M&As deal
value drops more than 41% to $1.56 trillion in 2008 compared to $2.67 trillion in 2007
(Wilmerhale, 2009). However, later M&As market has recovered step by step. In 2014,
global M&As deal value has reached $3.6 trillion compared to $2.85 trillion in 2013. China’s
M&As attain the new record in 2014 as well, both in terms of deal volume (6,899) and their
deal value ($407 billion) (PwC, 2015). Chinese government begins to promote favorable
policies to M&As happening after the financial crisis. Particularly in 2009, the first loan of
M&As is approved by Beijing (Xiao, 2014). It is a historical moment in Chinese M&As
activities to demonstrate the government’s positive attitude towards Chinese M&As market
(Xiao, 2014). Meanwhile, the two major policy-related banks such as China Development
Bank and Export-Import Bank of China specially establish policies to support corporate
investments (Tang and Metwali, 2012). A stable growth is observed in the Chinese domestic
M&As as firms with favorable policies seek to enhance their corporate value by using M&A
strategy. Based on these conditions, our study predicts that the majority of domestic M&As in
China has witnessed the healthy growth during the financial crisis. Based on these arguments
we test the following hypothesis:
H1a: Domestic M&As have positive growth during the financial crisis.
There is no doubt that the financial crisis has hit the global M&As market. The year
10
2000 is an acme for the fifth M&A wave and then with the constant growth about five years
from 2003, M&As activities eventually show another peak in 2007. Conversely, international
takeovers have experienced a significant increase by 2005 whose cross-border takeovers and
outbound investment make up 30% of the whole M&As (Grave et al, 2012). In 2014, global
cross-border M&As is $1.1 trillion greater than $775.3 billion in 2013, which is over the third
of the whole global M&As (Thomson Reuters, 2014). By analyzing the impact on acquiring
and target firms from cross-border M&As in the United Kingdom, Danbolt and Maciver
(2012) find that both acquiring and target firms benefit more than compete with similar
domestic mergers and the rate of return of acquiring and target firms are 1.5% and 10.1%
respectively. By the end of 2008, when the financial tsunami affects the majority of global
economic entities, it still creates a valuable chance for Chinese listed companies to implement
cross-border M&As. Firstly, after the market begin to open up to foreign investors on China’s
accession to the World Trade Organization in 2001, National Development and Reform
Commission, Commerce Department has launched the going out strategy. Secondly,
compared to other foreign countries, China appear to be less affected in global financial crisis
and its economic growth remain bullish and there remain an appreciation of Renminbi.
Furthermore, after several years of trade surpluses, the foreign exchange reserves in China
have attained totaling $1,905.59 billion by September 2008 (Chen and Young, 2009). In
addition, many foreign companies have to dispose their duplicate assets to enhance their
liquidity, such as assets sale of Chrysler, Lehman’s bankruptcy and Fannie Mae, Freddie Mac
owned by state. As a consequence, the prices of their assets go down and decrease their
liquidity and financial flexibility. Foreign companies and relevant government departments
are exhausted with raising funds so they reduce the political obstacles and implicit cost when
they deal with relatively cash-rich cross-border M&As. The capital market witneses cash-rich
China and make strategic decisions during the financial crisis for mass expansion across
continents. According to China’s Commerce Ministry estimates, the annual growth rate from
2011 to 2015 for China’s outward Foreign Direct Investment (FDI) on average is estimated to
remain around 17%, and the accumulative volume in these five years is expected to achieve
$560 billion (Tang and Metalli, 2012). Most importantly, cross-border M&As have become a
dominant trend of international market entry for Chinese firms (Chen and Young 2010).
Another milestone to boost potential growth of cross-border M&As in China comes in
December 2006 when the Organization for Economic Co-operation and Development
(OECD) publishes favorable policies towards cross-border M&As (Grave et al, 2012). Based
on the above arguments, we test the following:
11
H1b: There exist less number of cross-border M&As before the financial crisis compared to
the post-financial crisis period.
In 2007, the outbreak of sub-prime credit crisis in the USA affects the real economy
and employment market, and it also triggers the global financial crisis (Thomas et al, 2011).
At the same time, the economy of European Union has suffered its continuous downturn due
to the European debt crisis. Under such difficult economic environment, earnings
management may still be an instrument to influence earnings or to lessen the value
destruction (Chia et al., 2007). Mollik et al. (2013) examine 149 firms in Australia from 2006
to 2009. They find that most of firms have witnessed a systematic decline in profits attributed
to the impact of macroeconomic shocks rather than their poor corporate governance.
Australian firms use more income-decreasing earnings management during the financial
crisis than before by conducting discretionary accruals (Mollik et al., 2013). A recent study
by Thomas et al. (2011) on a sample of 10,406 companies over nine Asian countries from
1995 to 2000 finds that during the Asian financial crisis in 1997 when external operating
environment has endured the changes, managers have incentives to increase the earnings
management to minimize the impact on financial performance, which similarly occurs in the
emerging market. The value of discretionary accruals shows a significant fall during the
financial crisis, whereas there is no obvious dramatic fluctuation in operating cash flows or
non-discretionary accruals. Financial crisis not only influences the development of economy,
but also provokes a series of adjustments in accounting standards. In 2008, International
Accounting Standards Board (IASB) issues the amendment, Reclassification of Financial
Assets that aims at the IAS 39 (Financial Instruments: Recognition and Measurement) and
the IFRS 7 (Financial Instruments: Disclosures). In China, A new Enterprise Accounting
Standards: Basic Standards is implemented in 2007 for all Chinese listed companies issued
by Ministry of Finance of China. Firms linked to low efficient supervision have engaged in
aggressive accrual-based earnings management than the one under the strict scrutiny (Chia et
al, 2007). However, there is a high chance that with new strict accounting standards, accrual-
based earnings management might be regulated and detected (Graham et al, 2005; Cohen et
al, 2008; Zang, 2012). So, managers might have incentive to shift their decision away from
accrual-based earnings management to real earnings management after the passage of the
accounting regulations. Thus, in the following hypothesis we test the change in the preference
of types of earnings management during crisis:
12
H2a: For domestic M&As, managers prefer to use accrual-based earnings management and
after the financial crisis they switch to real earnings management.
Over the last decades, cross-border M&As have demonstrated their potential
aggressive growth and have increased healthily since the financial crisis (Thomson Reuters,
2014). Multinational companies have always played an important role in cross-border M&As.
During the financial crisis multinational companies have an overall better performance than
their local rivals, even though the considerable heterogeneity connects to the FDI (Alfaro and
Chen, 2010). However, changes in external conditions may trigger or magnify managerial
motivation to engage in earnings management. Empirical studies imply that managers with
lager excessive free cash flow in hand go for empire building to increase the size of the firm
(Jensen and Ruback, 1983) rather than returning them to shareholders (Grave et al, 2012).
The US acquirers are more likely to engage in income-increasing accrual-based earnings
management to reduce the capital cost in stock for stock cross-border M&As during the
financial crisis, especially when they encounter high information asymmetry in the target
country (Baik et al, 2009). In China, cross-border M&As are seen as a fast track that offer an
international comparative stage for Chinese listed companies. The main advantages of cross-
border M&As are reflected in three aspects (1) to open up overseas markets including market
expansion and cross-trade barriers; (2) to shake off the unfavorable situation, such as supply
shortage and reduce costs; and (3) to enhance competition in technology (Wang, 2008).
According to Bloomberg (2014), compared to domestic M&As, most Chinese cross-border
M&As are trade in cash, and the small percentage of takeovers are in the stock-swap, which
can influence lower possibility in accruals-based earnings management (Erickson and Wang,
1999; Louis, 2004; Higgins, 2012). Another difference between domestic M&As and cross-
border M&As is that the majority of acquiring firms involved in cross-border M&As are
state-owned enterprises (Xiao, 2014). These firms face more stringent legal risks and are
under strict scrutiny when they implement M&As. So they may not prefer accrual-based
earnings management, as it is easily detectable by the accounting watch-dogs (Dechow, 2002;
Cohen and Zarowin, 2010). Because of these different characteristics of domestic and cross-
border M&As in China, we assume that there is a high chance of real earnings management
for cross-border M&As. Hence, we test following:
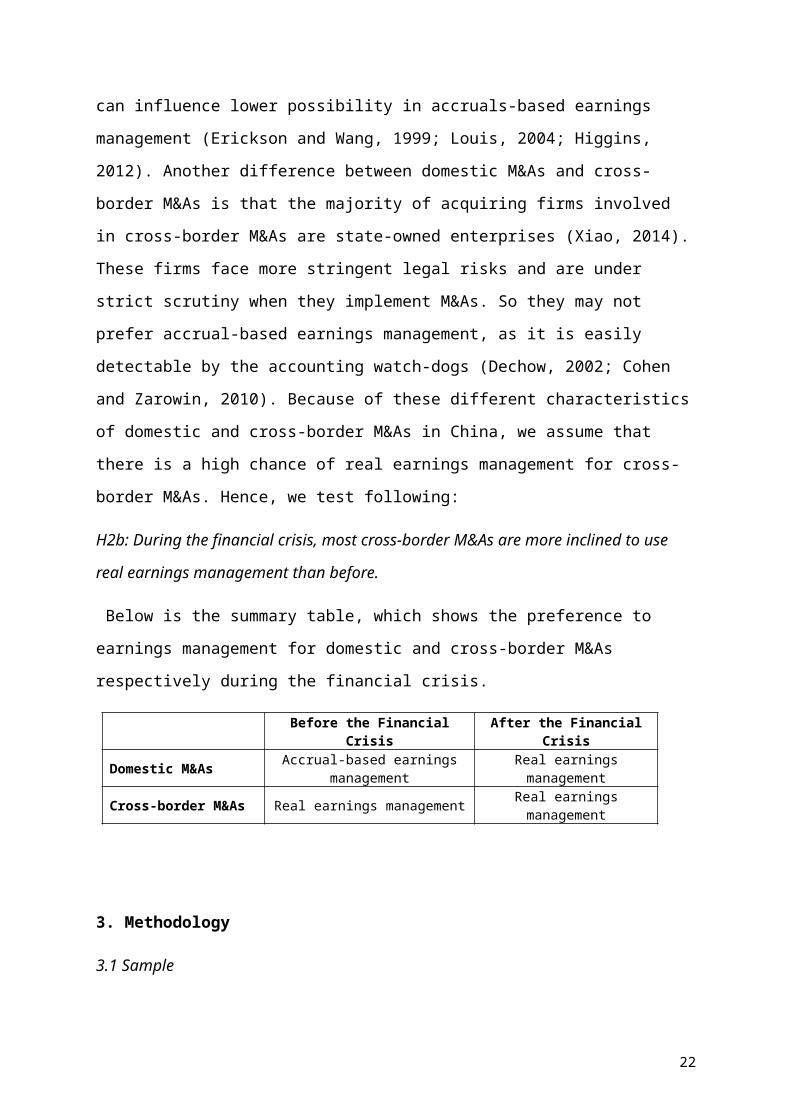
H2b: During the financial crisis, most cross-border M&As are more inclined to use real
13
earnings management than before.
Below is the summary table, which shows the preference to earnings management for
domestic and cross-border M&As respectively during the financial crisis.
Before the Financial Crisis After the Financial Crisis
Domestic M&As Accrual-based earnings management Real earnings management
Cross-border M&As Real earnings management Real earnings management
3. Methodology
3.1 Sample
In order to test our hypotheses, we collect data from China Stock Market and Accounting
Research (CSMAR) database, which is widely used by researchers (e.g. Chen et al, 2008;
Yang et al, 2012; Zhang, 2015). The additional required economic data are retrieved from the
World Economic Outlook Database (WEOD). The initial sample is consisted of all M&As
announced between 1st January 2004 and 31st December 2013 by Chinese listed companies.
Based on previous research, managers manipulate earnings to maximize their benefits before
the announcement date of M&As (Erickson and Wang, 1999). Therefore, we extend one year
before the mentioned period to fully capture the financial performance of the sample firms.
As a result, we find 5442 M&As in China during this 10 years’ time. We follow the existing
literature and apply the following criteria to finalize the sample. First, the acquirer firms must
be listed for 3 years in Shanghai or Shenzhen A-stock market before they engage in M&As,
otherwise the financial data is not entirely covered (Chen et al, 2008; Yang et al, 2012,
Zhang, 2015). Secondly, we exclude acquirers belong to financial industry whose industry
code start with “J” under the industry category release by the Chinese Securities Regulatory
Commission. The reason behind this exclusion attributes to the different financial reporting
requirement and more strict regulations, which might bias the analysis (see Botsari and
Meeks, 2007). Then, the acquirer should not be in the special treatment (ST) category. In
such a special situation, their financial performance is not representative so, we eliminate all
the firms containing ST in their names. Following Xiao (2014) and Zhang (2015), if the firms
have completed more than one M&A or takeover in current year, we choose the one with the
largest amount. Finally, it is important to require at least 10 qualified firms for each industry
to measure earnings management (Cohen et al., 2008; Zhang, 2015). We exclude some other
14
firms because of lack of required financial data in CSMAR. All the continuous variables are
winsorized at the top and bottom 1% of their distribution to avoid outliers. Finally, we obtain
an unbalanced panel data of 1948 qualified observations during the sample 10 years time.
The differences in number of companies for each year ascribes to the screening process. It is
noteworthy to mention that there is a remarkable increase in M&As after 2008 which is
mainly for the favourable policies in foreign investment and takeovers (Tang and Metawlli,
2012). The number of takeovers reaches the peak in 2013 which is 784.
3.2 Variable description
3.2.1 Earnings management measurement
Two types of earnings management measures are used in this study: accrual-based earnings
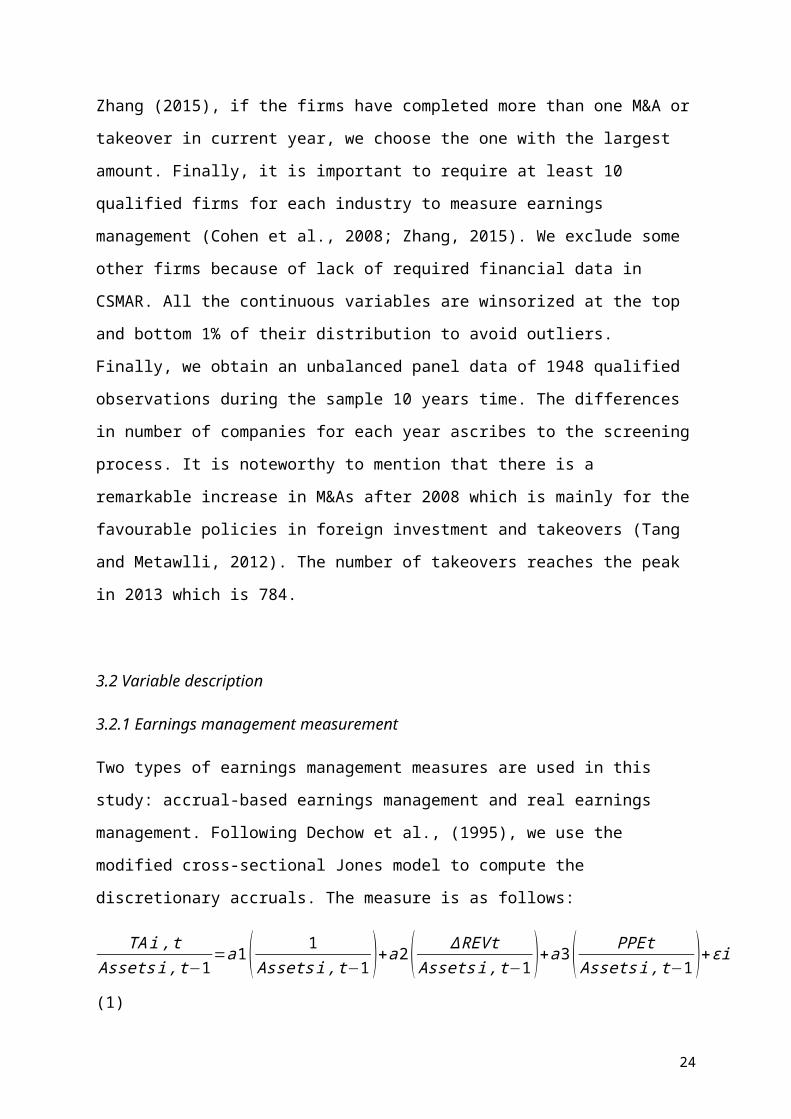
management and real earnings management. Following Dechow et al., (1995), we use the
modified cross-sectional Jones model to compute the discretionary accruals. The measure is
as follows:
TA i ,tAssets i ,t−1
=a1( 1Assets i , t−1 )+a 2( ∆ REVt
Assets i , t−1 )+a3( PPEtAssets i , t−1 )+εi (1)
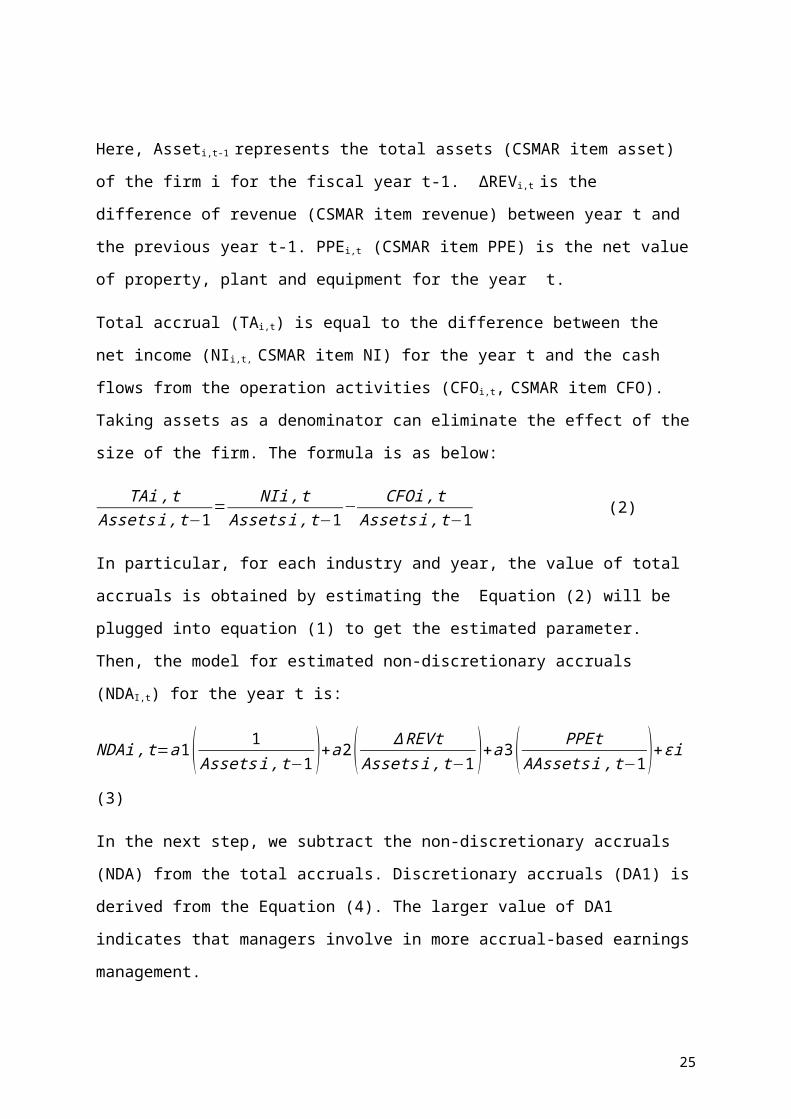
Here, Asseti,t-1 represents the total assets (CSMAR item asset) of the firm i for the fiscal year
t-1. ∆REVi,t is the difference of revenue (CSMAR item revenue) between year t and the
previous year t-1. PPEi,t (CSMAR item PPE) is the net value of property, plant and equipment
for the year t.
Total accrual (TAi,t) is equal to the difference between the net income (NIi,t, CSMAR item NI)
for the year t and the cash flows from the operation activities (CFOi,t, CSMAR item CFO).
Taking assets as a denominator can eliminate the effect of the size of the firm. The formula is
as below:
TAi , tAssets i ,t−1
= NIi , tAssetsi , t−1
− CFOi , tAssets i , t−1 (2)
In particular, for each industry and year, the value of total accruals is obtained by estimating
the Equation (2) will be plugged into equation (1) to get the estimated parameter. Then, the
model for estimated non-discretionary accruals (NDAI,t) for the year t is:
15
NDAi , t=a 1( 1Assetsi , t−1 )+a 2( ∆ REVt
Assetsi , t−1 )+a3( PPEtAAssetsi ,t−1 )+εi (3)
In the next step, we subtract the non-discretionary accruals (NDA) from the total accruals.
Discretionary accruals (DA1) is derived from the Equation (4). The larger value of DA1
indicates that managers involve in more accrual-based earnings management.
DA1i,t =TAi , t
Assets i ,t−1 −¿ NDAI,t (4)
In Equitation (1), while estimating total asset, we ignore the discretionary choice related to
revenue recognition. According to Geert et al., (2015), there is an alternative approach to
measure discretionary accrual by using the following equation in the first stage.
TA i ,tAssets i ,t−1
=a1( 1Assets i , t−1 )+a 2( ∆ REVt−∆ RECt
Assets i , t−1 )+a3( PPEtAAssets i ,t−1 )+εi
(5)
Where ∆RECi,t is the change from the previous year t-1 and the year t in the net receivables
(CSMAR item receivables). We also develop our second equation as follows:
NDAi , t=a 1( 1Assetsi , t−1 )+a 2(∆ REVt−∆ REC
Assets i , t−1 )+a 3( PPEtAAssets i ,t−1 )+εi
(6)
Then, we obtain the second measures of discretionary accrual (DA2), using the same
equitation (4) as before.
In terms of real earnings management, we construct three proxies based on the prior
literature (Roychowdhury, 2006; Graham et al, 2005; Zang, 2012). Looking at operating
level, companies engage in real earnings management to reveal the following characteristics:
abnormally low cash flows from operations (CFO), abnormally low discretionary expenses
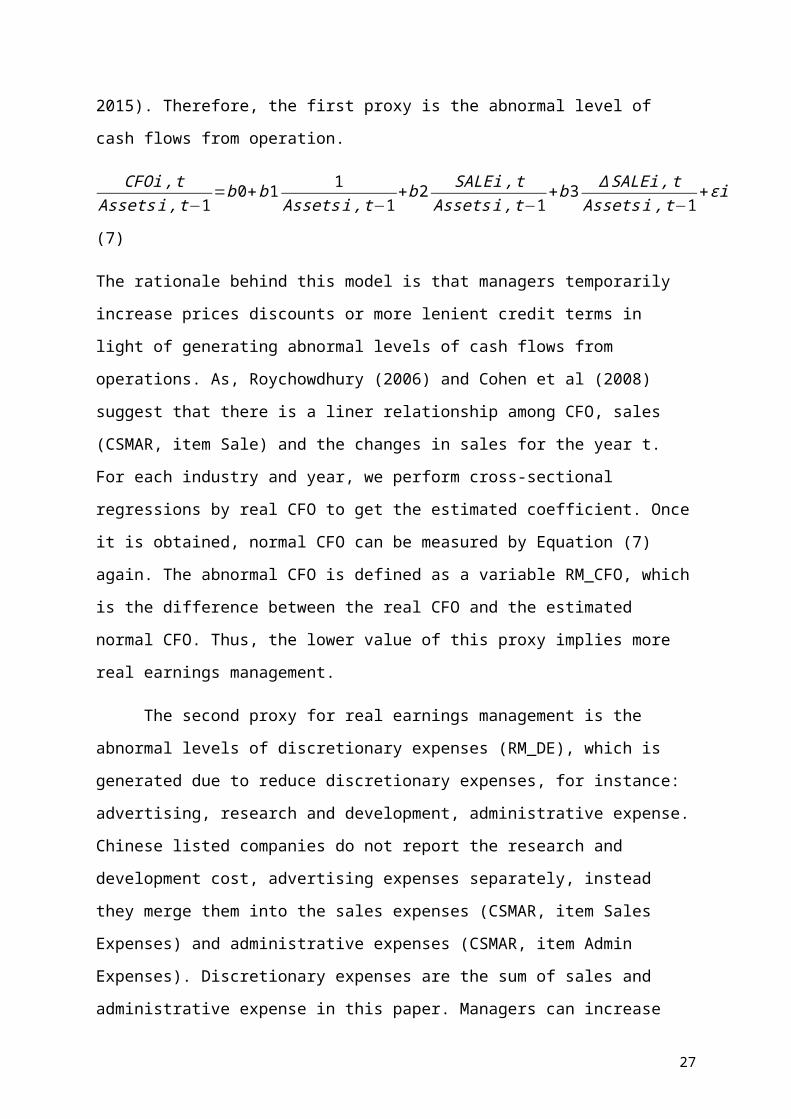
(DE) and/or abnormally high production costs (PC) (Geert et al, 2015). Therefore, the first
proxy is the abnormal level of cash flows from operation.
CFOi ,tAssets i ,t−1
=b 0+b 1 1Assetsi , t−1
+b2 SALEi , tAssets i ,t−1
+b 3 ∆ SALEi , tAssets i , t−1
+εi (7)
The rationale behind this model is that managers temporarily increase prices discounts or
more lenient credit terms in light of generating abnormal levels of cash flows from
operations. As, Roychowdhury (2006) and Cohen et al (2008) suggest that there is a liner
16
relationship among CFO, sales (CSMAR, item Sale) and the changes in sales for the year t.
For each industry and year, we perform cross-sectional regressions by real CFO to get the
estimated coefficient. Once it is obtained, normal CFO can be measured by Equation (7)
again. The abnormal CFO is defined as a variable RM_CFO, which is the difference between
the real CFO and the estimated normal CFO. Thus, the lower value of this proxy implies
more real earnings management.
The second proxy for real earnings management is the abnormal levels of
discretionary expenses (RM_DE), which is generated due to reduce discretionary expenses,
for instance: advertising, research and development, administrative expense. Chinese listed
companies do not report the research and development cost, advertising expenses separately,
instead they merge them into the sales expenses (CSMAR, item Sales Expenses) and
administrative expenses (CSMAR, item Admin Expenses). Discretionary expenses are the
sum of sales and administrative expense in this paper. Managers can increase the current cash
flows and achieve more earnings by reducing discretionary expenses so that the lower value
of this proxy means more real earnings management involved. The model to measure the
normal DE is as follows:
DEi ,tAssets i ,t−1
=b 0+b1 1Assetsi , t−1
+b2 SALEi , t−1Assets i ,t−1
+εi (8)
To capture the normal DE, we follow the similar step use in computing the normal
CFO. Then, the abnormal DE is the difference between the real DE and normal DE, which is
estimated from the Equation (8).
The last proxy for real earnings management is the abnormal level of production costs
(RM_PC), which is the summation of cost of good sales (COGS) and changes in inventory
(INV). If managers overproduce than required, they can reduce fixed cost per unit by
distributing fixed overhead costs among a large amount of products. However, at the sales
level, CFO declines because of the higher overproduction and it eventually increases the
annual production cost related to sales. Real production cost is the sum of cost of good sales
(CSMAR, item Cost of Sales) and changes in inventory (CSMAR, item Inventory).
Following are the liner functions to present the relationship between COGS and sales, ∆INV
and sales.
COGSi , tAssets i ,t−1
=b 0+b 1 1Assetsi , t−1
+b 2 SALEi , tAi ,t−1
+εi (9)
17
∆ INVi , tAssets i ,t−1
=b 0+b 1 1Assetsi , t−1
+b 2 ∆ SALEi , tAssets i ,t−1
+b 3 ∆ SALEi , t−1Assets i , t−1 +εi (10)
Combining the above two equations, the normal production cost is estimated as follows:
PRODi , t
Assets i ,t−1=b 0+b1 1
Assetsi , t−1+b 2 SALEi , t
Assets i ,t−1+b3 ∆ SALEi , t
Assets i , t−1+b 4 ∆ SALEi , t−1
Assetsi , t−1
+εi (11)
Similar to first two proxies, we run cross-sectional regressions by industry and year
and keep at least 10 firms for each industry-year. The abnormal PC is the difference between
the real PC and normal PC. The higher value of RM_PC signals more real earnings
management. In addition, we create two dummy proxies to evaluate accrual-based and real
earnings management separately. Based on those two dummy variables, types of earnings
management for different types of mergers are examined. The dummy variable
D_ACCRUAL captures the effect of accrual-based earnings management by two measures of
discretionary accruals. Following Geert et al (2015), D_ACCRUAL of a firm in year t is 1
when both measures of accrual-based earnings management, in this case DA1 and DA2 are
both above the industry-year median, and 0 otherwise. A value of 1 indicates that a firm is
more likely to use accrual-based earnings management than the lower half of the sample.
Then we create a proxy for real earnings management by the sum of RM_PC, the reversed
value of RM_CFO and RM_DE. Dummy variable D_RAEL is equal to 1 if the proxy is
above the industry-year median, and 0 otherwise. A value of 1 implies that a firm is more
likely to manipulate earnings by any real measures, which is than half of the sample (Geert et
al, 2015).
3.2.2 Other variables
To test, the types of M&A before and after the financial crisis, the dependent variable in the
first hypothesis is a dummy variable of M&As (TYPE_MA). A value of 1 indicates that the
firm is involved in the domestic takeovers, otherwise it equal to 0 if the firm takes part in the
cross-border takeovers. The independent variable is dummy crisis (D_CRISIS). A value of 0
indicates that the M&As happen before the financial crisis (2004-2007), and 1 for M&As
taking place from 2008 to 2013. 2008-2013 is indicated as financial crisis in this study.
Following the relevant existing literature (Dechow et al, 1995; Cohen et al, 2008; Geert et al,
2015), we control for several variables. At country level, we control for inflation and risk free
18
rate (Grave et al., 2012). INFILATION is a proxy for the business cycle and captures the
fluctuations in economic activities (Chaney et al, 2011). It obviously has an impact on
companies’ financial decision, which can affect the percentage changes in country’s average
consumer prices (Geert et al, 2015). Risk free rate (RF_RATE) is a signal for market
participants to invest, either in the domestic or cross-border (Alfaro and Chen, 2010)
environment. These two indicators can be considered as an explanatory factors in M&As in
that the favourable economic environment and interest rate may encourage investors and
promote the market.
In the second hypothesis, to test the types of earnings management in different M&As
before and after the financial crisis, we use the following as the dependent variables: DA,
RM_CFO, RM_DE and RM_PC, D_ACCRUAL, D_REAL (as defined above). Independent
variables are TYPE_MA and D_CRISIS (explained before). Moreover, we construct another
independent variable MA_CRISIS which is an interaction term of TYPE_MA and the
D_CRISIS. The value is 1, when firms undertake domestic takeovers after financial crisis,
and in other scenarios it is equal to 0. Associated with earnings management literature
(Cohen et al, 2008; Chen et al, 2008; Geert et al, 2015), we also include some control
variables at the firm level such as leverage (LEVERAGE), return on assets (ROA), market-
to-book (MTB) and total asset (SIZE), relative size (RE_SIZE). Leverage is the non-current
debt divided by the sum of the non-current debt and the equity, and MTB is the ratio of
market equity to book equity of the firm. In order to control the size of the firm, SIZE is
measured by the logarithm of total assets of the firm. RE_SIZE is defined as the deal amount
of M&As as percentage of total assets to eliminate the size of the takeover. ROA is a
common financial ratio to present the profitability of the firm related to opportunistic real
earnings management. At the country level, gross domestic product per capita (GDP/CAP)
and exchange rate to dollars (EX_RATE) are introduced. Gross domestic product per capita
(GDP/CAP) is an indicator of national economic growth. When the whole national economy
is developing, it is supposed to influence the individual company’s financial decision,
especially when the company deal with the significant amount of takeovers (Peng, 2006).
According to Chaney et al. (2011), GDP/CAP is the natural log of the changes in GDP per
CAP. WEOD provides two types of GDP/CAP. One is expressed in constant national
currency and the other one is expressed in current national currency. The second expression is
adopted in this paper. EX_RATE is a signal of foreign currency risk especially when cross-
border takeovers encounter information asymmetry (Xiao, 2014). According to Yang et al.
19
(2012), Chinese listed firms are less likely to manipulate accruals through cash payment.
Thus, a dummy variable named D_CASH is equal to 1 if the firm use cash payment, and 0
otherwise. In addition, at the industry level, a dummy industry (D_INDUSTRY) is generated
to control the industry differences. Based on a distinction on the initial capital letter of
industry code, the value of D_INDUSTRY is given 1 if the acquire and the target firms are in
the same industry, and 0 otherwise. Below is the summary table of all dependent,
independent and control variables.
[Insert Table 3.1 about here]
3.3 Models
In this subsection, we explain the empirical model that we use in the empirical analysis of the
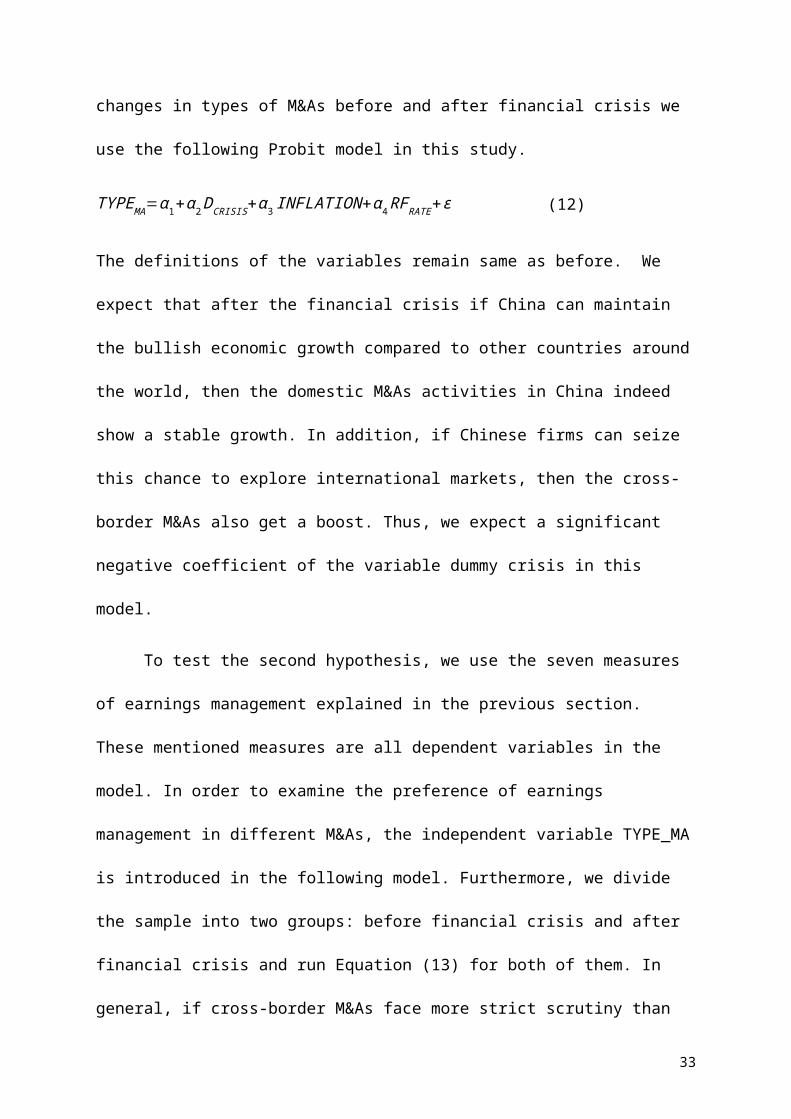
study. To investigate the changes in types of M&As before and after financial crisis we use
the following Probit model in this study.
TYPEMA=α 1+α 2 DCRISIS+α3 INFLATION+α4 RFRATE+ε (12)
The definitions of the variables remain same as before. We expect that after the financial
crisis if China can maintain the bullish economic growth compared to other countries around
the world, then the domestic M&As activities in China indeed show a stable growth. In
addition, if Chinese firms can seize this chance to explore international markets, then the
cross-border M&As also get a boost. Thus, we expect a significant negative coefficient of the
variable dummy crisis in this model.
To test the second hypothesis, we use the seven measures of earnings management
explained in the previous section. These mentioned measures are all dependent variables in
the model. In order to examine the preference of earnings management in different M&As,
the independent variable TYPE_MA is introduced in the following model. Furthermore, we
divide the sample into two groups: before financial crisis and after financial crisis and run
Equation (13) for both of them. In general, if cross-border M&As face more strict scrutiny
than domestic takeovers, we assume cross-border takeovers prefer real earnings management
20
and many domestic M&As will engage in accrual-based earnings management. We expect a
significant positive coefficient for TYPE_MA when accrual-based management is measured
by abnormal discretionary expenses. When real management is measured by abnormal
operating cash flows and discretionary expenses, the expected coefficient of TYPE_MA
should be significantly negative and it should be significantly positive when measured by
production cost. We separately check the differences of coefficients form two groups. In the
full sample test over the periods we introduce the interaction term MA_CRISIS. The 2008
world financial tsunami not only promote strict scrutiny for Chinese firms but also brings in
new regulations to protect the market for future. The mentioned changes motivate us to
expect that firms related to domestic M&As will switch to real earnings management after
2008 and firms associated with cross-border takeovers still prefer to do real earnings
management. Thus, we assume the coefficient on MA_CRISIS in Equation (14) should be
significantly negative when real earnings management is measured by abnormal operating
cash flows and abnormal discretionary expenses. When real earnings management is
measured by abnormal production costs, the coefficient of MA_CRISIS should be
significantly positive and in terms of accrual-based earnings management the coefficient
should not be significantly positive.
We start our analysis with Ordinary Least Square (OLS) regression but because of the
specific assumptions of the method we cannot capture the impact of M&As on types of
earnings management during crisis. So, we use advance econometric modelling to do the
empirical test in this study. As our sample data is a panel, we acknowledge the individual
heterogeneity by using fixed and random effects in the following way. In fixed effect model,
it assumes that the independent variables, in our case TYPE_MA is correlated to
heterogeneous term. While in random effect model, the independent variables are assumed to
be unrelated to heterogeneity item. We do Hausman test to check the validity of the models.
21
EM_Measures=α1+α2TYPE_MA+α3LEV+α4MTB+α5SIZE+α6RE_SIZE+α7ROA+α8D_CASH+α9D_INDUSTRYR+α10
(GDP/CAP)+α11 EX_RATE+ ε (13)
EM_Measures=α1+α2MA_CRISIS+α3LEV+α4MTB+α5SIZE+α6RE_SIZE+α7ROA+α8D_CASH+α9D_INDUSTRYR+α10
(GDP/CAP)+α11 EX_RATE+ ε (14)
3.4 Empirical Findings
3.4.1. Summary statistics
Panel A of Table 3.2 reports sample characteristic for 1948 Chinese acquiring firms. The
average value for accrual-based earnings management (DA1) is -0.00985 with a standard
deviation of 0.055; DA2 is -0.00989 with a standard deviation of 0.053. The medians of these
proxies are -0.0159 and -0.0152 indicating the decreasing-earnings and also a preference of
mainly accrual-based earnings management among these firms. For real earnings
management, the mean of RM_CFO, RM_DE and RM_PC are 0.0613, -0.01106 and 0.06372
respectively. The median of those proxies are 0.0595, -0.0101 and0.0460. The relatively low
value of RM_CFO and RM_DE with relatively high RM_PC imply that there is a real
earnings management in corporate activities, which is consistent with previous studies
(Zhang, 2015). The average of the dummy accrual (D_ACCRUAL) and dummy
real(D_REAL) variables are 0.9748 and 0.5910 respectively, which imply that accrual-based
earnings management is a better option than real earnings management. To find the further
summary statistics, we separate full sample to domestic group and cross-border group.
Panel B of Table 3.2 presents the descriptive statistics for domestic takeovers.
Compared to previous sample the average and standard deviation of accrual-based proxies
(DA1 and DA2) are similar for the full sample. The average for DA1 and DA2 are -0.00987
and -0.00987 with a standard deviation of 0.055 and 0.054 respectively. Even for real
earnings management, we observe a similar mean as before. As the majority of the full
22
sample consists with domestic takeovers (1859), so it can explain why there is a slight
difference between full sample and domestic group.
In panel C of Table 3.2, we report summary statistics for 88 cross-border takeovers.
DA1 is marginally higher than previous groups as the average is -0.00945 and the standard
deviation is 0.053. However DA2 is marginally lower than pervious groups as the average is -
0.01035 and standard deviation is 0.054. Proxies for real earnings management still keep in
same range. The mean of RM_CFO and RM_DE are slightly higher: 0.0670 and -0.01086. In
contrast, RM_PC get a slightly lower value of 0.05910. In a word, the difference in mean and
median among there groups is not obvious. The dominance of domestic takeovers may
potentially attribute to this issue.
[Insert Table 3.2 about here]
3.4.2 Correlation matrix of main variables
Table 3.3 describes the Pearson pairwise correlations between main variables use in the main
models. Similarly, Panel A reports the results from the full sample and Panel B and Panel C
contain information from the domestic group and the cross-border group respectively. As
expected, the correlation between two proxies of accrual-based earnings management and
RM_CFO from real earnings management are significantly negative in three groups.
Conversely, the correlation between proxies of accrual-based earnings management and
RM_DE are significantly positive in three samples. Interestingly enough, proxies of accrual-
based earnings management show positive relation with RM_PC in full sample and domestic
groups while there is a negative relation between them in cross-border takeovers. Consistent
with prior literature (Cohen et al., 2008; Zang, 2012, Geert et al., 2015), firms appear to
exercise accrual-based and real earnings management alternatively when it is related to cash
23
flows from operation and production cost. The highest negative correlation between DA and
RM_CFO, RM_PC are seen in the cross-border M&As and they are -0.5544, -0.5778, -
0.1075 and -0.1309, respectively. From the results we could say that firms have engaged in
accrual-based earnings management and also have incentives to manipulate discretionary
expenses (Cohen, 2008; Zang, 2012, Geert et al., 2015). The significant relationship among
the proxies of real earnings management intimates that firms can adopt real earnings
management by several operating methods. In addition, when constructing the comprehensive
proxies for earnings management, we observe that most firms have either 1 for
D_ACCRUAL or 1 for D_REAL that indicates that they have engaged in one of earnings
management at that point. The correlation between the dummy proxy for accrual-based
earnings management and comprehensive proxy for real earnings management supports that
in full sample these two methods are alternatively used as they are statistically significant in
the 1% level. However, we also notice that some firms have 1 or 0 for two comprehensive
proxies, which implies that two types of earnings management occurred in the same firm.
[Insert Table 3.3 about here]
3.4.3 Multivariable analyses
Our sample consists of qualified M&As between 2004 and 2013. There are 1948
observations, which is distributed in the following years as follows: 2004(151), 2005(95),
2006(137), 2007(238), 2008(245), and 2009(225), 2010 (235), 2011(208), 2012(215),
2013(199). Figure 3.1 presents the number of M&As during these ten years. There is no
doubt that domestic takeovers are the majority part and play a curial role in M&As activities.
Correspondingly, cross-border takeovers have been growing for this period and just occupy a
small percentage of whole pie. According to Figure 3.2, it demonstrates the clear tendency of
24
M&As activities from 2004 to 2013. In 2004, the total number of takeovers in our sample is
151 that is lower than other developing countries at that time (Xiao, 2014). M&As activities
have suffered the dramatically decline in 2005 due to changes in China stock and capital
markets. Until 2008, investors and corporate managers have strong confidence in Chinese
M&As markets. Within four years, the number of takeovers has incredibly risen from 95 to
245. Since affected by the global financial crisis, the trade of M&As is not as strong as before
and presents its weakness from 2008 to 2013 while the average of volume still has
maintained in a higher level compared before 2006. However, during these ten years, cross-
border M&As are always steadily developing even though it is only the small part. We
exercise multivariate analysis to further examine the relation between types of M&As and
financial crisis. Panel A of Table 3.4 states the results of Probit regression analysis. We model
D_CRISIS as a function of TYPE_MA, controlling inflation and risk free rate. The
coefficient on dummy crisis is significantly negative at the one-percent level, suggesting that
the development of domestic takeovers is stronger before financial crisis than after. When
dummy crisis, the independent variable increase 1 unit, the likelihood of domestic takeovers
will decrease 3.78% by calculating the marginal effect of regression. To the contrary, there is
a parallel movement between financial crisis and cross-border takeovers. When a dummy
crisis is more likely to indicate after financial crisis period, the likelihood of cross-border
takeovers will increase 3.78%. The outcomes from regression is consistent with the
conclusions that is directly drawn from the Figure 3.1 and Figure 3.2. Overall, both of them
support our first hypothesis that domestic takeovers reveal the bullish growth before financial
crisis and stabilize during financial crisis. As cross-border takeovers keep increasing, there
are more cross-border takeovers after 2008.
[Insert Figure 3.1 and Figure 3.2 about here]
[Insert Table 3.4 about here]
25
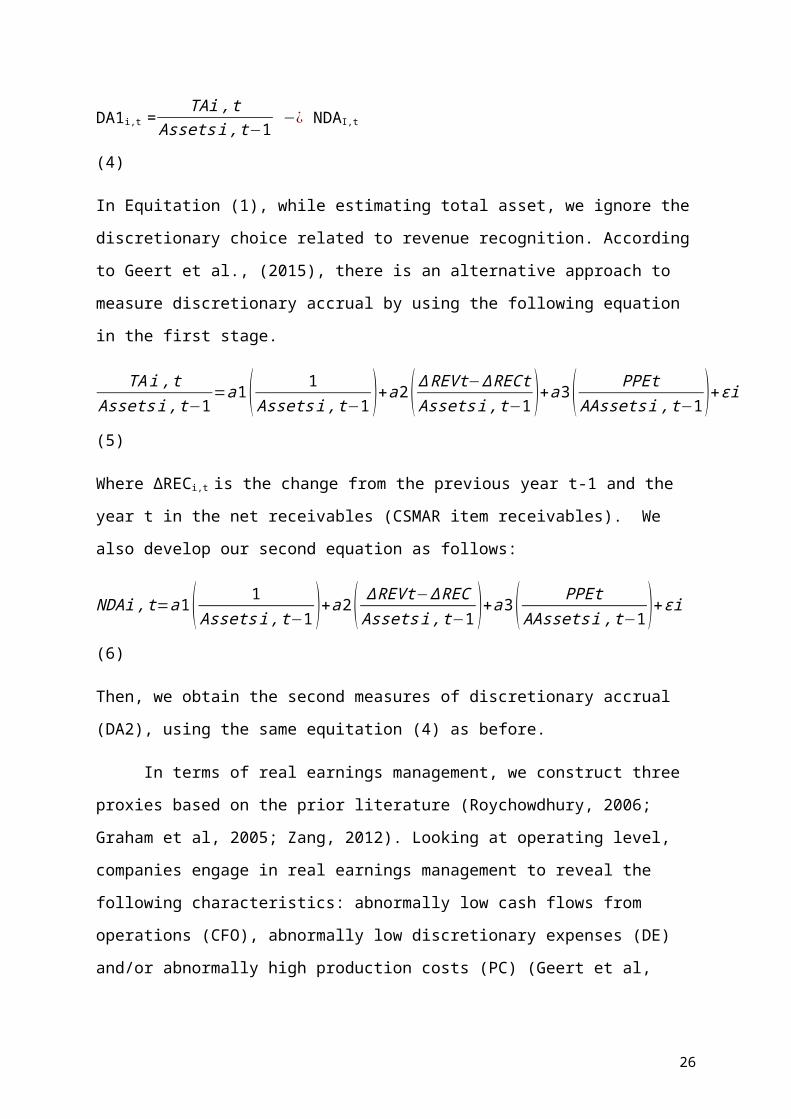
Table 3.5 reports the results of the regression analyses for the hypothesized relation
between accrual-based earnings management and types of M&As, real earnings management
and types of M&A, and proxies of earnings management and types of M&As. In order to
distinguish the changes in different time period, we separated full sample into two groups:
observations before financial crisis and observations after the financial crisis. Meanwhile we
also consider the fixed and random effect respectively.
[Insert Table 3.5 about here]
Panel A of Table 3.5 shows positive associations between accrual-based earnings
management and types of M&As as well as negative associations between real earnings
management and types of M&As when it is measured by cash flows from operation before
financial crisis. After checking all the P-values in the Hausman test, we rejected the null
hypothesis at the 1% level that independent variables have no correlation with heterogeneity
term so that we adopt the OLS regressions with fixed in regression of comprehensive proxies
of real earnings management. We accept the random effect in the rest of our regressions.
Adjusted R square for all regressions is acceptable between 1% and 13% which is
comparable with the exiting literature (Cohen et al., 2008; Ferreira et al., 2010; Zhang, 2015).
The coefficients on TYPE_MA of DA1 and DA2 (0.068 and 0.064) proves that accrual-based
earnings management has been used more frequently in domestic than cross-border takeovers
before financial crisis. Whereas, it can’t be ignored that coefficient on RM_CFO (-0.038)
critically attest that real earnings management is more conducted in cross-border than
domestic takeovers before financial crisis. Furthermore, by noticing the comprehensive
proxies of earnings management, D_ACCRUAL (0.012) and D_REAL (-0.291) we prove
26
that domestic takeovers incline toward accrual-based earnings management while real
earnings management is more prominent in cross-border takeovers before financial crisis.
Panel B of Table 3.5 focuses on the relation between earnings management measures
and types of M&As in the period of after financial crisis. Similarly, based on the high P-value
in Hausuman test above 0.05, we choose the OLS regressions with random effect when
dependent variables are detected by earnings management measures. The rest of them are
suitable for OLS regression with fixed effect. First, both coefficient on TYPE_MA of proxies
for accrual-based earnings management is not significant. Therefore, they have no power to
statistically support that accrual-based earnings management is widely used in both domestic
and cross-border takeovers after the financial crisis. Nevertheless, coefficient on TYPE_MA
of RM_DE and RM_PC represented real earnings management are significant at the 10% and
5% level respectively. On the one hand, the negative coefficient (-0.001) in regression of
RM_DE indicates that managers in cross-border takeovers have manipulated more
discretionary expense to adjust earnings than they do in domestic takeovers. On the other
hand, the positive coefficient (0.012) on TYPE_MA of RM_PC signals that there is more
abnormal production cost in domestic than cross-border takeovers. The results jointly
disclose the dominance of real earnings management to alter earnings in the context of
M&As activities after the financial crisis. Correspondingly, the results from D_ACCRUAL
doesn’t provide a hint of obvious existence of accrual-based earnings management in
takeovers after financial crisis. Whereas, the negative coefficient of D_REAL supports that
real earnings management has revealed in cross-border more than domestic takeovers.
Overall, these findings evince that managers in domestic takeovers are more inclined to
substitute the real earnings management for accrual-based earnings management after
financial crisis; while in cross-border takeovers, managers still stick with real earnings
27
management during financial crisis. It is compatible with our hypothesis.
Finally, to shed further light on which types of M&As are more likely to engage in
accrual-based or real earnings management on account of changes brought by the financial
crisis, we estimate the interaction term MA_CRISIS as a dependent variable. Panel A of
Table 3.6 reports interaction effects of earnings management with types of M&A and dummy
crisis. The interaction with both DA1 and DA2 significantly negative with random effect: -
0.0042 and -0.0046 chosen by Hausamn test. Panel A also evaluates a significant association
for the interactions between M&As activities during financial crisis and real earnings
management when it is measured by using RM_CFO and RM_PC. The magnitude of the
coefficient of D_REAL also implies statistically positive significance while D_ACCRUAL is
negative but not significant. Consistent with our expectations, these results demonstrate that
managers are less inclined to accrual-based earnings management when they deal with
domestic takeovers after financial crisis. As an alternative, when they exercise real earnings
management in cross-border takeovers, they are more likely to alter cash flows from
operation or/and increase abnormal production cost. Besides, the significance of
comprehensive proxy D_REAL supports the conclusion by showing the tendency from
accrual-based to real earnings management during the financial crisis.
[Insert Table 3.6 about here]
3.5 Robustness test
To check whether our results are robust in two groups based on changes in specific time
period, we separated the full sample from new perspective: domestic takeovers and cross-
border takeovers. Then we repeat our analyses taking a dummy crisis as our main
28
independent variables. First, in Panel A1 of Table 3.7, we examine the relationship between
proxies of earnings management and financial crisis. The negative coefficients on dummy
crisis of DA1 (-0.0250) and DA2 (-0.0252) statistically verify at the 1% level that domestic
takeovers have been involved less in accrual-based earnings after financial crisis. However,
by controlling abnormal cash flows from operation and production cost, managers have
engaged in more real earnings management in domestic takeovers after financial crisis. It is
supported by significant coefficient of RM_CFO and RM_PC. The coefficient of the dummy
crisis of D_AACRUAL is negative as we expected and is not significant enough. The relation
between dummy crisis and D_REAL is positive and powerfully indicates that choice of real
earnings management is strong with changes in financial crisis. Hence, results from this table
confirm our conclusion in the previous subsection that managers switch from accrual-based
earnings management to real earnings management during financial crises in domestic
takeovers. Secondly, Panel A2 of Table 3.7 reports the association between proxies of
earnings management and financial crisis in cross-border takeovers. In this particular group,
no surprisingly, the significant coefficient on dummy crisis is found in proxies of real
earnings management. Managers in cross-border takeovers favour the manipulation in cash
flows from operation before financial crisis through the significantly negative sign of
RM_CFO. After a financial crisis, they alter production cost to adjust earning that is inferred
from the significantly positive coefficient of RM_PC. Additionally, the coefficient of
D_REAL (0.5370) statistically strengthen our settlements. On the whole, our results are
robust with regard to the different methods of the sample classification.
[Insert Table 3.7 about here]
Consequently, our results from regressions with fixed effect can potentially be
confounded by the endogenous nature of the types of M&As, which is the independent
29
variable in equitation (13). Since it is an explanatory variable, some determinants are likely to
affect the domestic or cross-border takeover. Furthermore, it will influence the accuracy of
our regressions. It is crucial to address endogeneity issue to avoid the main assumption
regarding the properties of the error terms. Therefore, we consider the two-stage least-squares
(2SLS) by adding the instrumental variables in our regressions for additional robustness test.
Specifically, instrumental variables drive the exogenous terms of types of M&As to explain
earnings management. Selected instrument variables should have power to influence the
choice of M&As while unrelated to the current-year earnings management not matter whether
they are accrual-based or real. Following Ferreira et al. (2012), we include three instrument
variables. First, the local stock market return is included as investors can be stimulated by
local market valuation waves. Next, we control the level of openness of the economy that is
computed as the ratio of the sum of export and imports to GDP. Last, we consider for specific
aspects of economic development: the importance of the stock market measured by market
capitalization divided by GDP. All instrumental variables are valid after checking that the
covariance on instrumental variables of independent variables are not equal to zero (reported
in Panel C of Table 8). Next, in first-stage regression, three instrumental variables are used to
be dependent variable with TYPE_MA. In the second-stage regressions, we take the
estimated TYPE_MA from the first-stage as an independent variable to our baseline
regressions with previous proxies of earnings management. Panel A of Table 3.8 attests the
relation between types of M&A and financial crisis. In the group before the financial crisis,
the coefficients on TYPE_MA in seven regressions are still meaningful; moreover RM_CFO
improves its significance at the 1% level. In the group of after financial crisis, the
interpretation and significance of coefficient on TYPE_MA in all regression have been
maintained as before. This provides evidence that impact of types of M&As on types of
earnings management during financial crisis is robust to controlling self-selectivity. Similarly,
30
Panel B of Table 8 reports the connection between MA_CRISIS and all proxies of earnings
management. The relationship between MA_CRISIS and DA1 become more powerful and
other coefficients on interaction term preserve in the same range. The findings of this
additional examination indicate that previous analysis of association for interaction term and
earnings management is unbiased. In general, as none of the robustness tests vary our prior
conclusions, we are confident about our findings from qualitatively perspective.
[Insert Table 3.8 about here]
4. Conclusion
In this paper, we hypothesize the relation between types of mergers and acquisition (M&A)
and choices of earnings management during financial crisis. More specifically, we argue that
managers in domestic takeovers are more inclined to substitute real earnings management for
accrual-based earnings management than cross-border takeovers when they are affected by
the financial crisis. The 2007 financial crisis is not the only factor that has changed the
economic environment to force them to gloss over earnings; there is a need of higher secrecy
due to new accounting and economic regulations after financial crisis. In addition, firms
involved in cross-border takeovers have more incentives to use real earnings management to
mask earnings since they have face much more juristic barriers, institutional and linguistic
boundaries, challenges of culture (Reynolds and Teerikangas, 2015) etc. Our expectations are
confirmed by the results of several different regression analyses, demonstrating that types of
M&As alone with the tendency of financial crisis play a vital role in explaining variance in
choices of earnings management. In changed economic setting, firms show their particular
preference of earnings management strategies. Before financial crisis, acquiring firms in
domestic M&As have engaged in more abnormal discretionary accruals. Instead, in the same
31
period, the manipulation of cash flows from operation is more prominent in cross-border than
domestic takeovers. Moreover, after financial crisis, bidders’ abnormal accruals are not
significant as before instead of significantly lower abnormal discretionary expenses and
higher abnormal production cost. All the signs state that acquiring firms in both of domestic
and cross-borders takeovers have exercised more real earnings management than accrual-
based earnings management. Our findings are robust to alternative measures and addressed
the issue of endogeneity.
In this research, we support previous evidence of acquiring firms manipulating their earnings
in M&As activities (Erickson and Wang, 1999; Shleifer and Vishny, 2003; Louis, 2004).
Consistent with Zang (2012) and Geert et al. (2015), our findings indicate that firms change
their preference in different earnings management strategies when they encounter various
eco-political changes. Hence, diversity in earnings management cannot be fully covered by
focusing on accrual-based earnings management only. Our findings also advocate that
enhancing scrutiny and increasing constrains do not prevent earnings management, but to
some extent may reduce the choice for accrual-based earnings management and increase the
likelihood of real earnings management. Furthermore, considering the background of
financial crisis, our findings assist to scholars’ expectations (Grave et al., 2012) that M&A
activities have performed well for the last ten years and maintained an impressive level of
trade even after financial crisis. In the end, we have detected both accrual-based and real
earnings management around financial crisis. The results imply that managers in domestic
takeovers switch accrual-based to real earnings management during financial crisis. In
contrast, managers in cross-border takeovers prefer to engage in real earnings management
during financial crisis. These results also have several important implications. In managerial
level, the findings may help external capital providers or investors in evaluating the
pervasiveness of earnings management and the faithfulness, integrity of financial statements
32
of acquiring firms. In policy level, it is worthwhile for standard setters to reflect existing
governance systems and accounting regulations including the disclosure requirements to
enhance quality of financial statements particularly for the industry where earnings
management is prevalent. The policy makers should also consider other advance policies to
restrict the real earnings management as well.
This study has its own limitations. If we could avoid the data limitation then we could run our
estimates on balanced panel for the two periods which may provide better understanding of
the research question. Scholars argue that pure domestic M&As have become obsolete as
they have been impacted by the afore-identified international variables (Reynolds and
Teerikangas, 2015). We cannot capture this in our study. There is an underlying assumption in
our empirical analysis that each types of M&As are uniformly related to choices of earnings
management. Whereas, even within domestic or cross-border takeovers managers may still
have different choices of earnings management. Consequently, in practice, accrual-based and
real earnings management may be conducted together or alternatively, depending on the each
firm’s own economic situation. Additionally, we only examine the level of earnings
management and there are some aspects worth to be considered such as timeliness, value
relevance and earnings conservatism (Dechow et al., 2010). Moreover, changes in the stock
market in 2005 and reform in governance may moderate managers’ consideration of earnings
management. In future studies we will try to address the above-mentioned issues and will try
to consider corporate governance changes at international level to enrich our model.
Reference:
Aharony, J., Lee, C-W.J. and Wong,T.J. (2000) “Financial packaging of IPO firms in China”, Journal of Accounting Research, 38(1), 103-126.
33
Alfaro, L. and Chen, M. (2010). Surviving the global financial crisis: foreign direct investment and establishment performance, American Economic Journal, 4(3), 30-55.
Botsari, A. and Meeks, G. (2008) “Do acquirers manage earnings prior to a share for
share bid?”, Journal of Business Finance and Accounting, 35 (5-6), 33-670.
Baik, B., Farber, D.B and Petroni, K. (2009) “Analysts’ incentives and street earnings”, Journal of Accounting Research, 47(1), pp.45-69.
Berkovitch, E and Narayanan, M.P. (1993) “Motives for takeovers: An empirical investigation”, Journal of Financial and Quantitative Analysis, 28(3), 347-362.
Bernard, V.L. and Thomas, J.K. (1990) “Evidence that stock prices do not fully reflect the implications of current earnings for future earnings”, Journal of Accounting and Economics, 13(1990), 305-340.
Bens, D.A., Goodman, T.H. and Neamtiu, M. (2012). Does investment-related pressure lead to misreporting? An analysis of reporting following M&A transactions, The Accounting review, 87(3), 839-865
Bloomberg (2014) Global M&A market review: financial rankings. New York: Bloomberg.
Cohen, D.A., Dey, A. and Lys, T.Z. (2008) “Real and accrual-based earnings management in the pre-and post-Sarbanes-Oxley periods”, The Accounting Review, 83(3), 757-787.
Cohen, D and Zarowin, P. (2010) “Accrual-based and real earnings management activities around seasoned equity offerings”, Journal of Accounting and Economics, 50(1), 2-19.
Claude F., Walid, B.A. and Philemon R. (2012) “Ownership structure, earnings management and acquiring firm post-merger market performance: Evidence from Canada”, International Journal of Managerial Finance, 8(2), 100-119.
Chaney, P.K. and Lewis, C.M. (1995) “Earnings management and firm valuation under asymmetric information”, Journal of Corporate Finance, 1(3), 319-345.
Chen, X., Lee, C.J. and Li J. (2008) “Government assisted earnings management in China”, Journal of Accounting and Public Policy, 27(3), 262-274.
Chia, Y.M and Lapsley, I. and Lee, H.W. (2007) “Choice of auditors and earnings
34
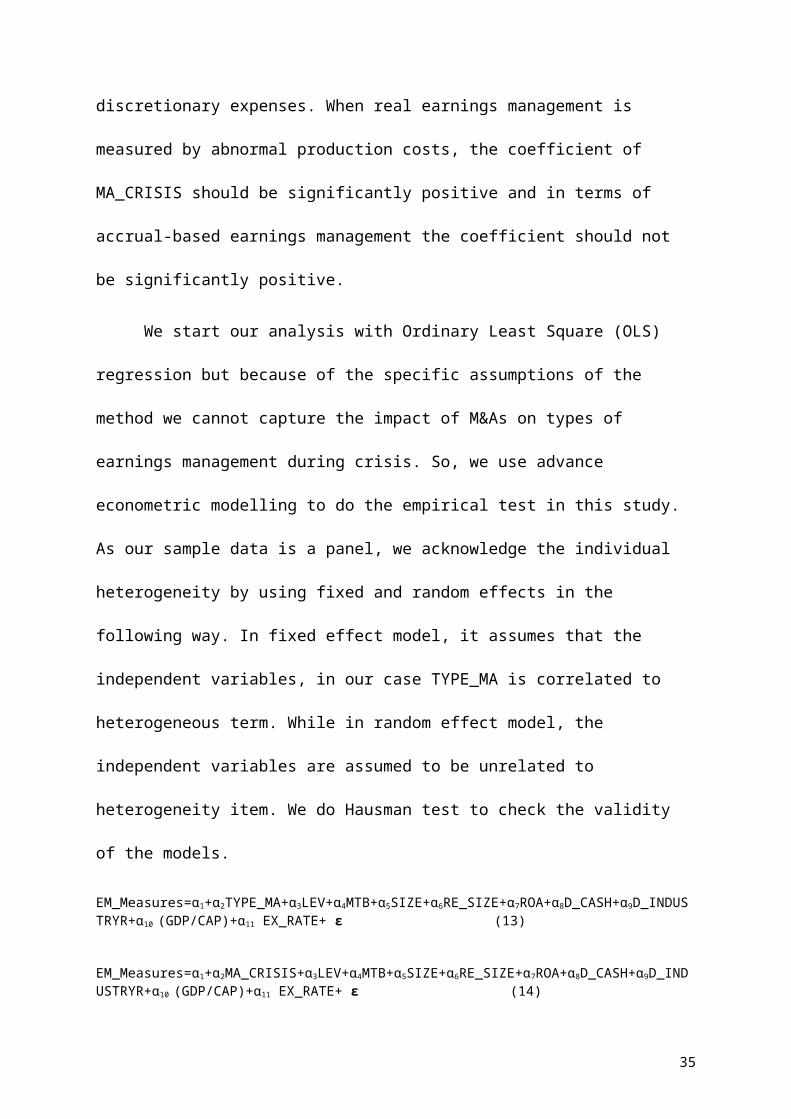
management during the Asian financial crisis”, Journal of Accounting and Economics, 24(1), 99-126.
Chen, Y.Y. and Young, M.N. (2010) “Cross-border mergers and acquisitions by Chinese listed companies: A principal-principal perspective”, Asia Pacific Journal of Management, 27(3), 523-539.
Danbolt, J. and Maciver, G. (2012) “Cross-border versus domestic acquisitions and the impact on shareholder wealth”, Journal of Business Finance & Accounting, 39(7-8), 1028-1067.
DeAngelo, L.E. (1986) “Accounting numbers as market valuation substitutes: a study of management buyouts”, The Accounting Review, 61(3), 400-420.
DeAngelo, L.E. (1988) ‘Managerial competition, information costs, and corporate governance: the use of accounting performance measures in proxy contests’, Journal of Accounting and Economics, 10(1), 3–36.
Dechow, P., Ge, W. and Schrand, C. (2010) “Understanding earnings quality: a review of the proxies, their determinants and their consequences”, Journal of Accounting and Economics, 50(2), 344-401.
Dechow, P.M. and Skinner, D.J. (2000) “Earnings management: Reconciling the views of accounting academics, practitioners, and regulators”, Accounting Horizons, 14(2), 235-250.
Dechow, P.M., Sloan, R.G. and Sweeney, A.P. (1995) “Detecting earnings management”, The Accounting Review, 70(2), 193-225.
Davidson S., Stickney, C. and Weil, R. (1987) Accounting: The Language of Business. 7th edn. Arizona: Thomas Horton and Daughter.
Easterwood, C. (1998). Takeovers and incentives for earnings management: an empirical analysis. Journal of Applied Business Research, 14, 29-48.
Erickson, M. and Wang, S. (1999) “Earnings management by acquiring firms in stock for stock mergers”, Journal of Accounting and Economics, 27(2), 149-176.
Ferreira, M.A, Massa, M. and Matos,P. (2010) “Shareholders at the gate? Institutional investors and cross-border mergers and acquisitons”, The Review of Financial Studies, 23(2), pp.601-604.
35
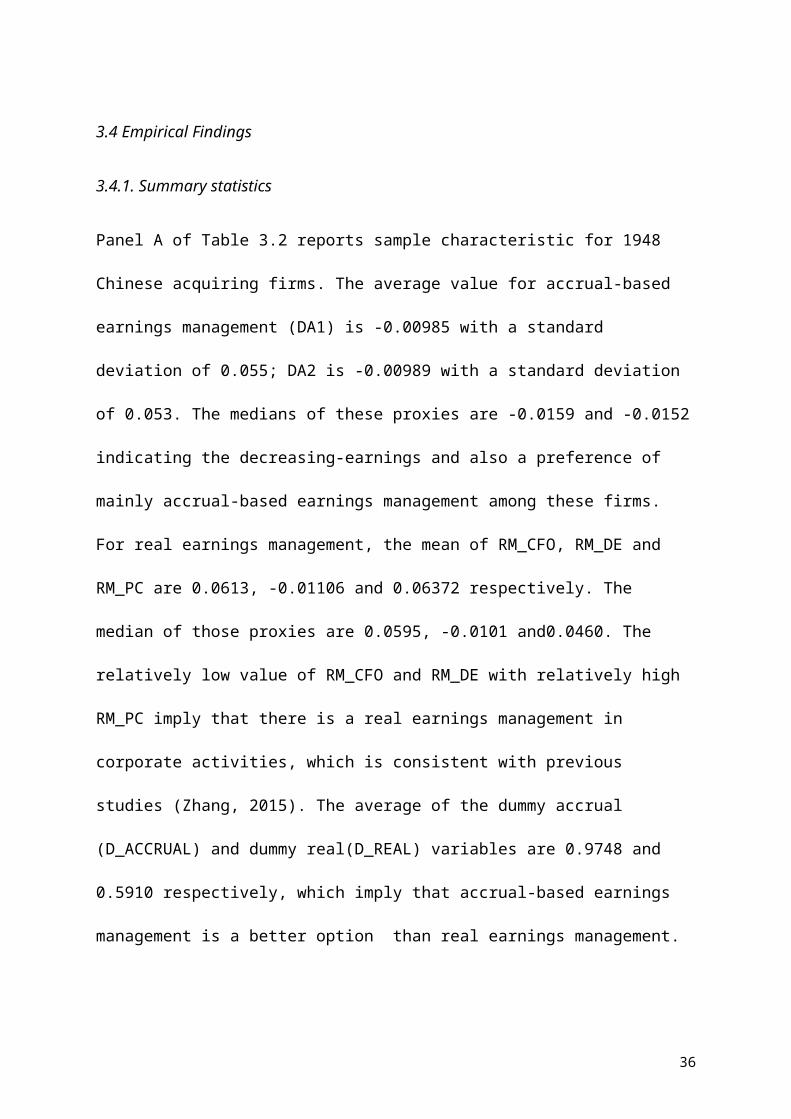
Geert B., Nandy, M., Weitzel, U. and Lodh, S. (2015) Accurual- based and real earnings management and political connections, International Journal of Accounting, 50(2), 111-141.
Graham, J., Harvey, R. and Rajgopal, S. (2005) “The economic implications of corporate financial reporting”, The Journal of Accounting and Economics, 40(1-3), 3-73.
Grave, K., Vardiabasis, D. and Yavas, B. (2012) “The global financial crisis and M&A”, International Journal of Business and Management, 7(11), 56-66.
Hiller, D. (2013) Corporate Finance. 2nd European edn. London: McGraw-Hill Higher Education.
Higgins, H.N. (2012) “Do stock-for-stock merger acquirers manage earnings? Evidence from Japan”, Journal of Accounting and Public Policy, 32(1), 44-70.
Healy, P. M. (1985) “The effect of bonus schemes on accounting decisions”, Journal of Accounting and Economics, 7(1-3), 85-107.
Healy, P.M., Wahlen, J.M. (1999) “A review of the earnings management literature and its implications for standard setting”, Accounting Horizons, 13(4), 365–383.
Jones, J.J. (1991) “Earnings management during import relief investigations”, Journal of Accounting Research, 29(2), 193-228.
Jensen, M.C and Ruback, R.S. (1983) “The market for corporate control: The scientific evidence”, Journal of Financial Economics, 11, 5-50.
Katherine, A.G. (2010) “The relation between earnings management using real activities manipulation and future performance: Evidence from meeting earnings benchmarks”, Contemporary Accounting Research, 27(3), 855-888.
Kasanen, E., Kinnunen, J. and Niskanen, J. (1996) “Dividend-based earnings management: empirical evidence from Finland”, Journal of Accounting and Economics, 22(3), 283-312.
Kin, L. (2008) “Earnings management and earnings quality”, Journal of Accounting and Economics, 45(2-3), 350-357.
Koumanakos, E., Siriopoulos, C. and Georgopoulos, A. (2005). Firm acquisitions and earnings management: evidence from Greece, Managerial Auditing Journal, 20(7), 663 – 678
36
Kothari, S.P., Mizik, N. and Roychowdhury, S. (2012) “Managing for the moment: the role of real activity versus accruals earnings management in SEO valuation”, Working paper.
Lousi, H. (2004) “Earnings management and the market performance of acquiring firms”, Journal of Financial Economics, 74(1), 121-148.
Mollik, A.T., Mir, M., Mclver.R. and Bepari, M.K. (2013) “Earnings management during the global financial crisis: Evidence from Australia”, Proceeding of International Business and Social Science and Research Conference, Cancum, Mexico, 16-17 December 2013.
Marin, D., Aldhizer III, G., Campbell, J. and Baker, T. (2002) “When earnings management becomes fraud”, Internal Auditing, July/August.
McLaney, E.J. and Atrill, P. (2014) Accounting and Finance: An Introducion. 7th edn. New York: Pearson.
Martynova, M. and Renneboog, L. (2008) “A century of corporate takeovers: what have we learned and where do we stand”, Journal of Banking and Finance, 32(10), 2148-2177.
McNichols, M.F. and Stubben, S.R. (2008) Does Earnings Management Affect Firms’ Investment Decisions?. The Accounting Review, 83(6), 1571-1603.
Musfiqur, R., Mohammad, M. and Jamil, S. (2013) “Techniques, motives and controls of earnings management”, International Journal of Information Technology and Business Management, 11(1), 22-34.
Petmezes, D. (2009) “What drives acquisitions? Market valuation and bidder performance”, Journal of Multinational Financial Management, 19(1), 54-74.
Peng, M.W. (2006) “Making M&A fly in China”, Harvard Business Review, 84(3), PP.26-27.
PwC (2015) PwC M&A 2014 review and 2015 outlook. Hong Kong: PwC.
Reynolds, N.S. and Teerikangas, S. (2015) The international experience in domestic mergers—Are purely domestic M&A a myth?, International Business Review, forthcoming.
Roychowdhury, S. (2006) “Earnings management through activities manipulation”, Journal of Accounting and Economics, 42(2006), 335–370.
37
Shleifer, A. and Vishny, R.W. (2003) “Stock market driven acquisition”, Journal of Financial Economics, 70(3), 295-311.
Scott, D.W. (1992) “Multivariate density estimation: theory, practice, and visualization”, New York Wiley, 1992, 1145-167.
Schipper, K. (1989) “Commentary on earnings management’, Accounting Horizon, 12, 91-102.
Scott, I.M. (2007) “Detecting earnings management in bank merger targets using the modified Jones model”, Journal of Accounting, Ethics and Public, 7(3), 301-307.
Thomas, B.D. and Christian, M.A. (2011) “Earnings management in the financial crisis 2007/2008”, Gallen: University of Gallen, Institute for Accounting. Working Paper.
Tang, R.Y.W., Metwalli, A.M. (2012) “M&A in greater China: An update”, Corporate Accounting & Finance, 23(2), 27-40.
Thomson Reuters (2014) Mergers & acquisitions review: financial advisors. New York: Thomson Reuters.
Wang, J.Z. (2008) “The comparison study on Chinese and foreign enterprises cross-border merger and acquisition”, Hubei: Yangtze University, School of Management. Working Paper.
Watts, R.L. and Zimmerman, J.L. (1990). Positive accounting theory: a ten year perspective, The Accounting Review, 65(1), 131-156.
Wilmerhale (2009). 2009 M&A report. Washington DC: Wilmerhale.
Xiao, J. (2014) “Financial risks of Chinese enterprises’ cross-border mergers and acquisitions”, Canadian Research & Development Center of Sciences and Cultures, 8(3), 27-30.
Yang, J.J., Chi, J. and Yong, M. (2012) “A review of earnings management in China and its implications”, Asian Pacific Economic Literature, 26(1), 84-92.
Yew, M.C., Lapsley, I. and Lee, H.W. (2007) “Choice of auditors and earnings management during the Asian financial crisis”, Managerial Auditing Journal, 22(2), 177-196.
38
Zang, A. (2012) “Evidence on the tradeoff between real activities manipulation and accrual-based earnings management”, The Accounting Review, 87(2), 675-703.
Zhang, Z.Q. (2015) “Under-performance of listed companies? Real earnings management and M&A: Chinese empirical evidence”, Journal of Industrial Engineering and Management, 8(2), 322-334.
39
Appendix 1
Definition of Merger, Consolidation and Acquisition
Merger is a transaction where one company is assimilated by one or several companies with
co-equal basis. As a result, the legal existence of target company will disappear; this can be
expressed as A+B=A (Berkovitch and Narayanan, 1993). Similarly, consolidation is an action
in which two different companies or more by merging create an entirely new company. There
is no obvious distinction between the acquiring and the target company due to both parties
terminate their original legal existence, expressed as A+B=C (Hillier, 2013). Consolidation is
usually used as an alternative to merger. In a narrow sense, Hillier (2013) points out a slight
difference between these two concepts. The starting point of consolidation is kind and
friendly in general and also involve parties who are volunteer to reach agreements.
Acquisition is a strategy where acquiring firms buy assets or shares of the target company in
order to gain control. Usually, acquiring firms can have absolute controlling power when it
holds more than 50% shares of the target company. After acquisition, the target company still
maintains its legal existence (Hillier, 2013).
Appendix 2
Waves of M&As around the world and its development in China
M&A is an approach used for business expansion and reasonable utilization of economic
resources. Furthermore, it is an effective method to optimize the allocation in the capital
market. By M&As, the core competitiveness of firms could be enhanced as well as the value
of the firms. Even though there are different views about motives in M&As, an agreement
among scholars is that the ultimate prospective of conducting M&As is creating positive
value to the firm and seeking improved financial performance. In the real world, the ideal
40
prospect is not always consistent with managers’ expectation. Jensen and Ruback (1983) look
at changes in the abnormal return of firms’ stock price before and after takeovers. During
their investigation, target firms will gain significant benefit from the successful M&As and
acquiring firms do not lose. Whereas the rate of return will suffer decline from the failed
M&As and the average decline is 3% of the target firm and 5% of the acquiring firm.
Interestingly, Petmezas (2009) indicate that the positive reaction from market participants to
M&As announcement just exists in the short-term. The optimistic beliefs in synergy of the
combined firm will be substituted for the rational judgment based on the performance of the
merged firm over the next one to three years. It might lead to negative post-returns in the
long-term. In a word, M&As may not generate expected profit to the combined firm or, even
worse, could hurt the shareholders’ value. But based on main motives like: synergy, agency
problem and hubris (Berkovitch and Narayanan, 1993), we agree that managers still have a
strong incentive to take part in M&As.
Appendix 3
Types of earnings management
According to previous studies (Cohen and Zarowin, 2010; Dechow et al., 2010), companies
manipulate earnings by multiple earnings management strategies. Corresponding to accrual
and real parts in financial statements, earnings management can be classified into two types:
accrual-based earnings management and real earnings management (Kothari et al., 2012).
When managers aim to obscure true economic performance by choosing accounting policies
from a series of accepted policies, accrual-based earnings management happens (Dechow and
Skinner, 2000; Geert et al, 2015). The measure of discretionary accruals is indeed one of the
most common methods to detect possible accrual-based earnings management. It separates
the total accruals into discretionary and non-discretionary accruals. The concept of accruals
41
refers to accounts on financial statements that represent liabilities and non-cash-based assets
used in accrual-based accounting including payables, receivables, future tax liability and
future interest expense, etc (McLaney and Atrill, 2014). In order to distinguish the
discretionary and non-discretionary accruals, there are many economic models, like Healy
(1985), DeAngelo (1986), Jones (1991) and modified Jones (Dechow et al, 1995), etc.
Real earnings management is a comparatively new strategy of earnings management. When
managers desire to mislead at least some stockholders by real earnings management they alter
expenditures, revenue and production cost. According to Graham et al (2005), the
implementation of real earnings management is more expensive than accrual-based earnings
management. Different from accrual-based earnings management, real earnings management
directly influences the consequences of cash flows in the short-term and determinate
economic value in the long-term (Geert et al, 2015). Apart from that, accrual-based earnings
management is highly constrained by scrutiny from outsiders and the companies’ accounting
flexibility. In other words, real earnings management is not easily detected by the existing
auditing system and less subject to extensive controls and external monitoring by society.
Accrual-based earning management is done at the end of the financial year but real earnings
management can be exercised throughout the year (Zang ,2012). Therefore, some studies
suggest that due to the lower cost, accrual-based earnings management is more prevalent in
practices (Graham et al, 2005; Zang, 2012).
42
Table 3.1. Main Variable Definitions
Variables names Definition
DA Discretionary accruals measured by the Modified Jones Model.
RM_CFO The level of abnormal cash flows from operations.
RM_DE The level of abnormal discretionary expenses, which is the sum of administrative and sale expenses.
RM_PC The level of abnormal production costs, which is the sum of the costs of goods sold and the changes in inventories.
D_ACCURAL A dummy proxy of accrual-based earning management that is equal to one if both of DA1 and DA2 are above the industry-year median, and zero otherwise.
D_REAL A dummy proxy of real earnings management that is equal to one if the sum of reversed CFO, DE and PC is above the industry-year median, and zero otherwise.
D_CRISIS A dummy variable that is equal to one if the takeover happen between the years from 2008 to 2013, and zero otherwise.
TYPE_MA A dummy variable that is equal to one if the takeover is domestic, and zero otherwise.
MA_CRSIS An interaction term that D_CRISIS multiply the TYPE_MA.
LEVERAGE Non-current debt divided by the sum of non-current debt and equity.
MARKET_TO_BOOK Then market capitalization to common equity.
ROA Return on assets of the firm.
SIZE The logarithm of total assets.
RE_SIZE The deal amount of takeover divided by total assets.
INFLATION The logarithm of a country’s average percentage change in consumer prices
GDP/CAP The logarithm of the changes in gross domestic product per capita.
RF_RATE Risk free rate that is available in CSAMR from 2004 to 2013.
EX_RATE Exchange rate for Renminbi to dollars that is available in CSAMR from 2004 to 2013.
D_CASH A dummy variable that is given to one if the takeover is paid by cash, and zero otherwise.
D_INDUSTRY A dummy variable that is given to one if the acquirer and the target firm are in the same industry, and zero otherwise.
OPENNESS The ratio of the sum of export and imports to GDP.
STOCK RETURN Local stock market return that is available in CSAMR from 2004 to 2013.
MARKET CAPITALIZATION
Market capitalization as the percentage of GDP from 2004 to 2013.
43
Table 3.2. Summary statistics for different sample group (2004-2013)
Table 3.2 Panel A(Full sample) Summary statisticsVariables Obs. Mean Median Std.Dev Min MaxDependent variablesDA1 1948 -0.009855 -0.015989 0.055059 -0.287567 0.296477DA2 1948 -0.009892 -0.015160 0.053708 -0.292847 0.295533RM_CFO 1948 0.061296 0.059482 0.057201 -0.157597 0.654208RM_DE 1948 -0.011068 -0.010065 0.009209 -0.208907 0.000903RM_PC 1948 0.063724 0.045983 0.075366 -0.119765 1.167780D_ACCRUAL 1948 0.974846 1.000000 0.156633 0.000000 1.000000D_REAL 1948 0.597023 1.000000 0.490622 0.000000 1.000000Independent variables 0.013495 -0.003433MA_CRISIS 1948 0.523101 0.000000 0.499594 0.000000 1.000000DUMMY_CRISIS 1948 0.555441 0.000000 0.497044 0.000000 1.000000TYPE_MA 1948 0.954825 1.000000 0.207740 0.000000 1.000000Control variablesLEVERAGE 1948 0.170457 0.126123 0.370819 -13.406589 3.030547MTB 1948 1.609264 1.119482 1.811544 0.105211 32.792261ROA 1948 0.038516 0.032121 0.063262 -0.585995 0.713431SIZE 1948 9.560288 9.500745 0.529790 7.885456 11.937756RELATIVE_SIZE 1948 0.169783 0.040033 2.674010 -73.155581 26.518870DUMMY_INDUSTRY 1948 0.671803 1.000000 0.469678 0.000000 1.000000DUMMY_CASH 1948 0.882383 1.000000 0.322237 0.000000 1.000000INFLATION 10 3.182000 3.325000 1.947360 -0.683000 5.900000GDP/CAP 10 3.532058 3.579841 0.205258 3.175570 3.844595RISK_FREE RATE 10 3.338470 3.511667 1.168833 1.585833 5.139167EX_RATE 10 0.141240 0.143900 0.013639 0.120800 0.161500Note: See Table 1 for variable definitions.
44
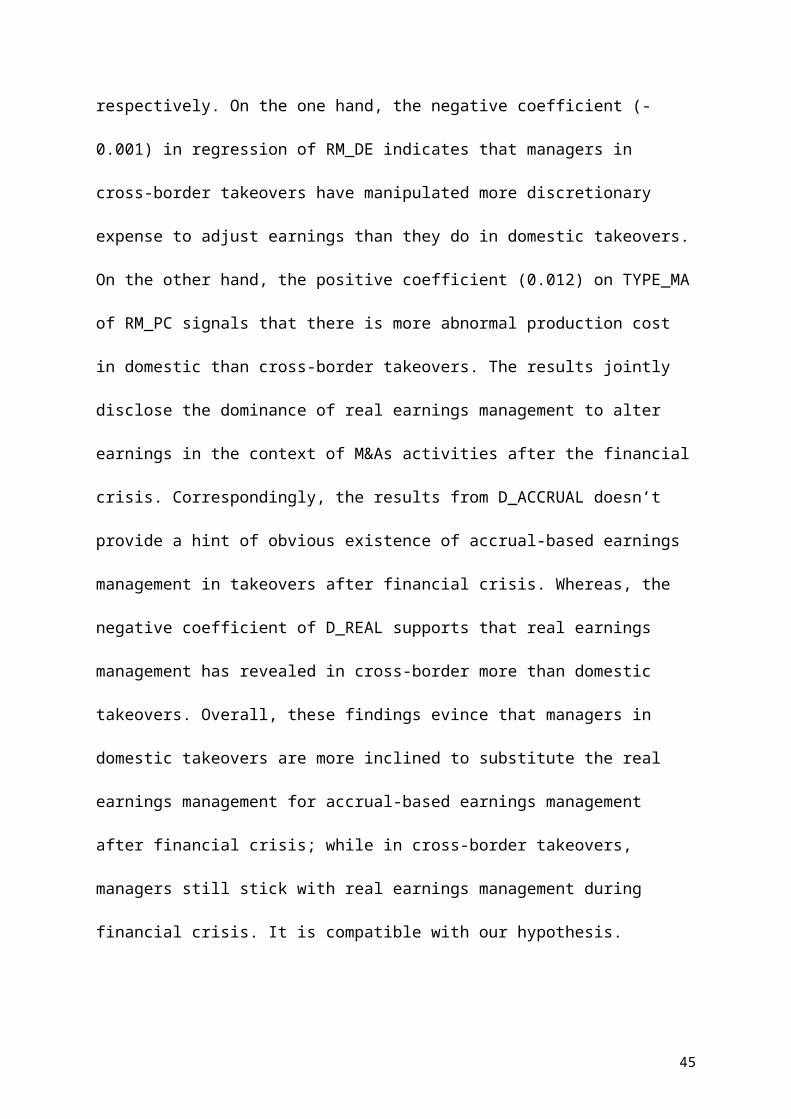
Table 3.2 Panel B (Domestic) Summary statisticsVariables Obs. Mean Median Std.Dev Min MaxDependent variablesDA1 1860 -0.009874 -0.016312 0.055148 -0.287567 0.296477DA2 1860 -0.009870 -0.015602 0.053703 -0.292847 0.295533RM_CFO 1860 0.061025 0.059581 0.057046 -0.157597 0.654208RM_DE 1860 -0.011077 -0.010054 0.009301 -0.208907 0.000903RM_PC 1860 0.063942 0.045946 0.076407 -0.119765 1.167780D_ACCRUAL 1860 0.974194 1.000000 0.158600 0.000000 1.000000D_REAL 1860 0.594624 1.000000 0.491097 0.000000 1.000000Independent variablesMA_CRISIS 1860 0.547849 1.000000 0.150291 0.000000 1.000000DUMMY_CRISIS 1860 0.547849 1.000000 0.500284 0.000000 1.000000TYPE_MA 1860 1.000000 1.000000 0.000000 1.000000 1.000000Control variablesLEVERAGE 1860 0.171524 0.126723 0.378102 -13.406589 3.030547MTB 1860 1.603199 1.119482 1.793197 0.105211 32.792261ROA 1860 0.037851 0.031722 0.063313 -0.585995 0.713431SIZE 1860 9.554116 9.497705 0.530252 7.885456 11.937756RELATIVE_SIZE 1860 0.171338 0.040976 2.734328 -73.155581 26.518870DUMMY_INDUSTRY 1860 0.674018 1.000000 0.468867 0.000000 1.000000DUMMY_CASH 1860 0.880581 1.000000 0.324368 0.000000 1.000000INFLATION 10 3.182000 3.325000 1.947360 -0.683000 5.900000GDP/CAP 10 3.532058 3.579841 0.205258 3.175570 3.844595RISK_FREE RATE 10 3.338470 3.511667 1.168833 1.585833 5.139167EX_RATE 10 0.141240 0.143900 0.013639 0.120800 0.161500Note: See Table 1 for variable definitions.
45
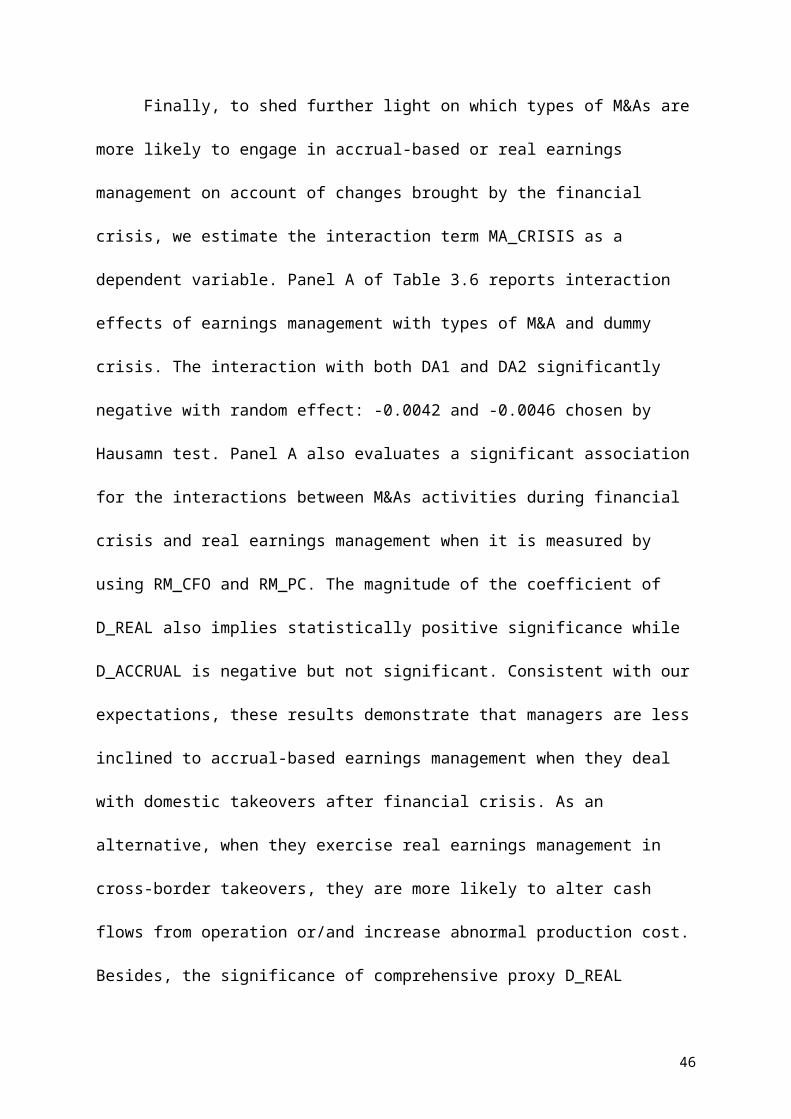
Table 3.2 Panel C (Cross-border) Summary statisticsVariables Obs. Mean Median Std.Dev Min MaxDependent variablesDA1 88 -0.009458 -0.009952 0.053439 -0.163540 0.250071DA2 88 -0.010353 -0.011856 0.054122 -0.166736 0.252278RM_CFO 88 0.067020 0.058793 0.060427 -0.074123 0.376541RM_DE 88 -0.010868 -0.010323 0.007039 -0.044296 -0.000889RM_PC 88 0.059102 0.051292 0.048457 0.004088 0.225316D_ACCRUAL 88 0.988636 1.000000 0.106600 0.000000 1.000000D_REAL 88 0.647727 1.000000 0.480416 0.000000 1.000000Independent variablesMA_CRISIS 88 0.000000 0.000000 0.000000 0.000000 0.000000DUMMY_CRISIS 88 0.715909 1.000000 0.453565 0.000000 1.000000TYPE_MA 88 0.000000 0.000000 0.000000 0.000000 0.000000Control variablesLEVERAGE 88 0.147932 0.088807 0.148577 0.000043 0.682427MTB 88 1.737382 1.115887 2.171271 0.303743 15.732670ROA 88 0.052559 0.043333 0.060842 -0.077541 0.308747SIZE 88 9.690652 9.624070 0.505426 8.884869 10.821647RELATIVE_SIZE 88 0.136945 0.023629 0.514346 0.000000 4.713249DUMMY_INDUSTRY 88 0.625000 1.000000 0.486897 0.000000 1.000000DUMMY_CASH 88 0.920455 1.000000 0.272139 0.000000 1.000000INFLATION 10 3.182000 3.325000 1.947360 -0.683000 5.900000GDP/CAP 10 3.532058 3.579841 0.205258 3.175570 3.844595RISK_FREE RATE 10 3.338470 3.511667 1.168833 1.585833 5.139167EX_RATE 10 0.141240 0.143900 0.013639 0.120800 0.161500Note: See Table 1 for variable definitions.
46
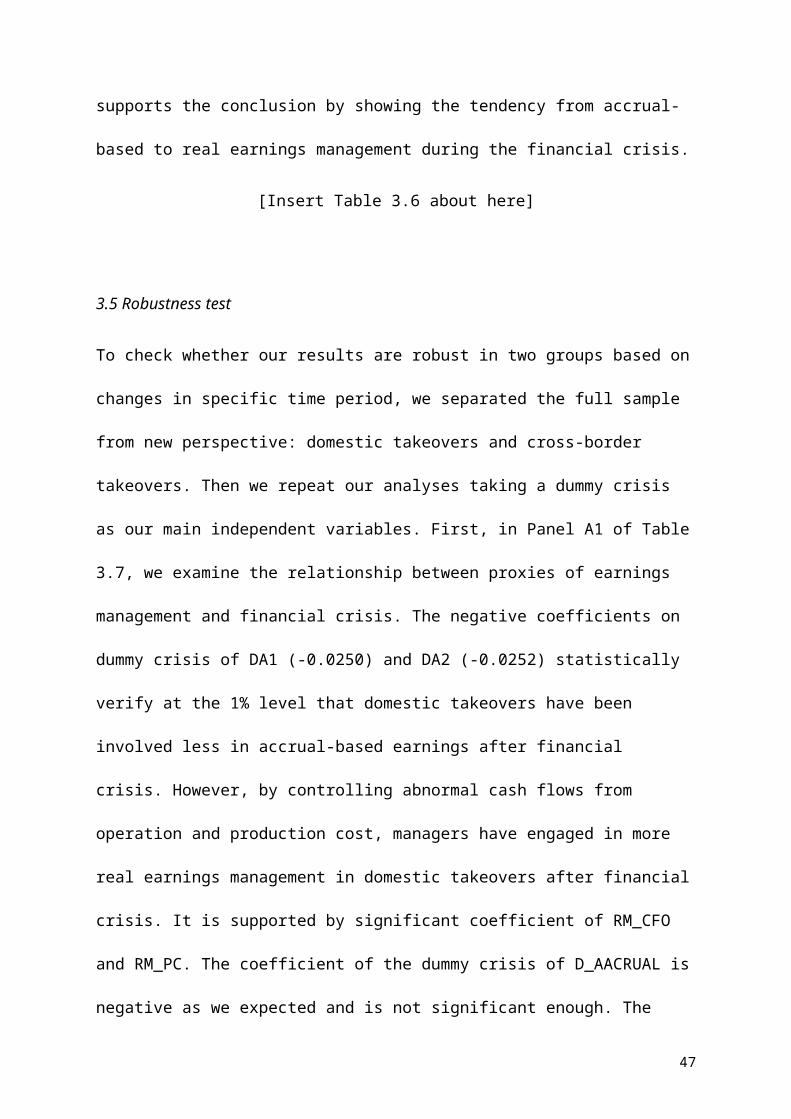
Table 3.3. Pearson correlations with main variables
Table 3.3 Panel A (Full sample) Pearson correlations for dependent variables 1 2 3 4 5 6 71. DA1 12. DA2 0.974113*** 13. RM_CFO -0.429793*** -0.470032*** 14. RM_DE 0.094429*** 0.098235*** -0.240268*** 15. RM_PC 0.064791*** 0.04304** 0.220591*** -0.273126*** 16. D_ACCRUAL -0.003317 0.031644 -0.099281*** 0.002912 -0.029859 17. D_REAL 0.31593*** 0.328243*** -0.342371*** -0.026101 0.43253 -0.145377*** 1*** and ** indicate statistical significance at the 1 percent level and 5 percent level (two-tailed)See Table 1 for variable definitions.
Table 3.3 Panel B (Domestic sample) Pearson correlations for dependent variables 1 2 3 4 5 6 71. DA1 12. DA2 0.973314*** 13. RM_CFO -0.424026*** -0.464749*** 14. RM_DE 0.09514*** 0.09894*** -0.242456*** 15. RM_PC 0.069938*** 0.048358** 0.221829*** -0.280285*** 16. D_ACCRUAL -0.003023 0.031671 -0.103101*** 0.006529 -0.031713 17. D_REAL 0.312962*** 0.325223*** -0.338775*** -0.036971 0.433385 0.086619*** 1*** and ** indicate statistical significance at the 1 percent level and 5 percent level (two-tailed)
47
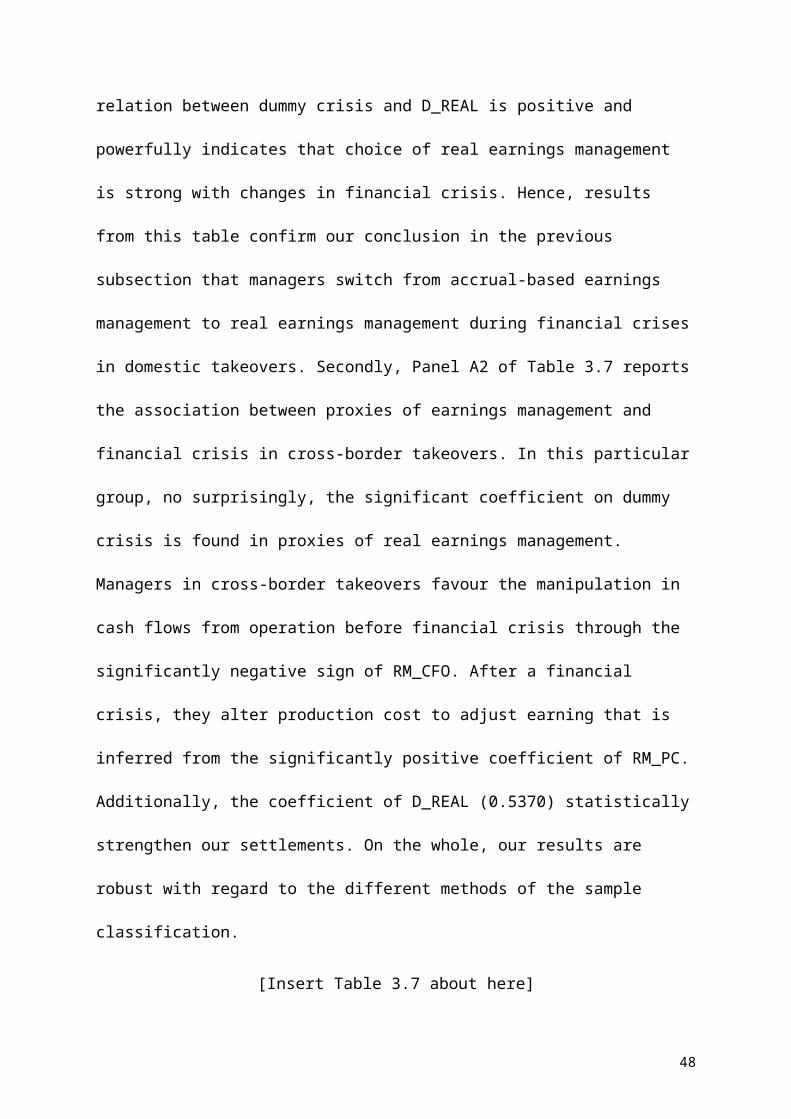
See Table 1 for variable definitions.
Table 3.3 Panel C Cross-border sample) Pearson correlations for dependent variables 1 2 3 4 5 6 71. DA1 12. DA2 0.992434*** 13. RM_CFO -0.554441*** -0.577838*** 14. RM_DE 0.07633147 0.082700354 -0.19965** 15. RM_PC -0.107457*** -0.130923** 0.22185** 0.04305398 16. D_ACCRUAL -0.014223254 0.034700506 -0.008997296 -0.15287075 0.0756631 17. D_REAL 0.383915*** 0.396678*** -0.431768*** 0.283412*** 0.459042*** 0.088584 1*** and ** indicate statistical significance at the 1 percent level and 5 percent level (two-tailed)See Table 1 for variable definitions.
Table 3.4. Multilevel Probit regression with TYPE_MA as dependent variables
Table 3.4 Panel A. Probit regression with TYPE_MA as dependent variablesDependent variable TYPE_MA Z-Statistic Prob. Marginal effectDUMMY_CRISIS -0.40577 -3.53659 0.0004 -0.03781INFLATION -6.63653 -0.73328 0.46340 -0.61845RISKFREE -0.15547 -1.26241 0.20680 -0.01449
48
C 15.76783 0.87553 0.38130
McFadden R-squared 0.022961Obs 1948 See Table 1 for variables definitions.
Table 3.5. Multilevel linear regression with all earnings management measures with fixed and random effect
Time period:2004-2007, before crisisModel: OLS with fixed effect
Table 3.5 Panel A1. Multilevel linear regression with DA1, DA2, RM_CFO, RM_DE, RM_PC as dependent variablesDependent variable DA1 DA2 RM_CFO RM_DE RM_PC D_ACCRUAL D_REALTYPE_MA 0.068359*** 0.063516*** -0.03881** -0.000271 0.019386 0.011698** -0.291418**DUMMY_CASH 0.005643 0.008779 -0.015479 -0.000232 0.009072 -0.026596 0.17529**DUMMY_INDUSTRY 0.001909 0.002083 -0.010006 -0.000118 0.005833 -0.021258 -0.013734EXCHANGE_RATE -1.342006 -1.609685 0.135389 -0.138711 -1.937881*** -10.29804*** -92.03661***GDP_CAP 0.176434* 0.19026** -0.014577 0.008163* 0.16606*** 0.622269 6.393565***LEVERAGE 0.011095 0.014862 -0.001475 -0.002833 -0.006462 0.024082 0.275951MTB 0.005171* 0.005618** -0.001131 -0.000332** 0.00057 -0.007686 0.026847RELATIVE_SIZE -0.002009 -0.001913 -0.000408 -0.0000203 0.000902 0.001795 -0.001539ROA -0.094829 -0.106738 0.096888* 0.002284 0.015778 0.66605*** -0.214579SIZE -0.02371** -0.013841 0.013682 0.001107 -0.080415*** 0.063206** -0.391834***Constant -0.283641* -0.38707** 0.018268 -0.029174** 0.500948*** -0.332655 -5.809843***
Adjusted R2 0.096874 0.106662 0.133564 0.0175571 0.0349953 0.0145039 0.0299638Obs 621 621 621 621 621 621 621
49
***, ** and * indicate statistical significance at the 1 percent level and 5 percent level, 10 percent level (two-tailed).See Table 1 for variable definitions.
Time period:2004-2007, before crisis
Model: OLS with random effect
Table 3.5 Panel A2. Multilevel linear regression with DA1, DA2, RM_CFO, RM_DE, RM_PC as dependent variables
Dependent variable DA1 DA2 RM_CFO RM_DE RM_PC D_ACCRUAL D_REAL
TYPE_MA 0.026828*** 0.029159*** -0.037795** 0.000618 -0.003938 0.024269** -0.079302**
DUMMY_CASH 0.000619 0.002536 -0.00222 -0.000203 0.01002** -0.019574 0.093094***
DUMMY_INDUSTRY -0.001523 -0.001517 0.000932 0.000207 -0.005967 0.000175 -0.023486
EXCHANGE_RATE -3.218688*** -3.181281*** 0.573284 -0.130333** -13.83527 -7.172484*** -105.5307***
GDP_CAP 0.295649*** 0.291127*** -0.026829 0.007885* 0.878106*** 0.407057*** 6.781622
LEVERAGE -0.00359 -0.002604 0.009365 -0.000671 0.001394*** 0.018702 0.113372
MTB 0.001081 0.00155 -0.001064 -0.0000304 -0.001754* -0.002644 0.008249
RELATIVE_SIZE -0.00077 -0.000684 -0.000512 0.0000631 -0.000761 -0.000272 -0.005761
ROA -0.0388 -0.055836* 0.033187* -0.000876 -0.001304 0.206294*** -0.153261
SIZE -0.006816 -0.00355 -0.000203 0.000499 -0.011565*** 0.015788 -0.065531*
C -0.545185*** -0.569852*** 0.113336 -0.025413*** -0.982679*** 0.430335* -8.081716***
Adjusted R2 0.064238 0.058003 0.017612 0.0966 0.0327141 0.014688 0.0275731
Obs 621 621 621 621 621 621 621
***, ** and * indicate statistical significance at the 1 percent level and 5 percent level, 10 percent level (two-tailed).
50
See Table 1 for variable definitions.
Table 3.5 Panel B1. Multilevel linear regression with DA1, DA2, RM_CFO, RM_DE, RM_PC as dependent variables
Dependent variable DA1 DA2 RM_CFO RM_DE RM_PC D_ACCRUAL D_REAL
TYPE_MA 0.00741 0.00641 0.011496 -0.002888* 0.019386** -0.000543 -0.029696*
DUMMY_CASH -0.006122 -0.007997 -0.002558 -0.000215 0.009072 -0.013117 -0.042336
DUMMY_INDUSTRY 0.003048 0.003647 -0.001221 0.001609* 0.005833 0.006613 0.0711*
EXCHANGE_RATE -14.14821*** -14.15058*** 6.557345*** -2.357696*** -1.937881 4.583898** -93.45614***
GDP_CAP 0.941688*** 0.944828*** -0.516399*** 0.149099*** 0.16606 -0.41716 6.245161***
LEVERAGE -0.024833 -0.02096 0.011357 -0.008308* -0.006462 0.015681 -0.152163
MTB -0.002734 -0.002294 0.000381 0.001358* 0.00057 -0.00352 0.031486
RELATIVE_SIZE -0.0000199 -0.00000000872*** 0.001325 0.000156 0.000902 0.0000099 0.015746
ROA -0.110398* -0.109536* 0.080802 -0.009766 0.015778 -0.113688 0.022049
SIZE -0.011365 -0.008925 -0.045182 0.006742 -0.080415** 0.12141** -0.093927
C -1.212815*** -1.24703*** 1.396372*** -0.266314*** 0.500948* 0.656768* -7.252105***
Adjusted R2 0.070668 0.077473 0.134453 0.0331931 0.0349953 0.0120501 0.092674
Obs 1327 1327 1327 1327 1327 1327 1327
***, ** and * indicate statistical significance at the 1 percent level and 5 percent level, 10 percent level (two-tailed).
See Table 1 for variable definitions.
51
Table 3.5 Panel B2. Multilevel linear regression with DA1, DA2, RM_CFO, RM_DE, RM_PC as dependent variables
Dependent variable DA1 DA2 RM_CFO RM_DE RM_PC D_ACCRUAL D_REAL
TYPE_MA -0.006509 -0.005731 0.003626 -0.000957* 0.011905** -0.01387 -0.066717
DUMMY_CASH 0.002698 0.002726 -0.013429*** 0.0000879 -0.003086 0.014881 0.013508
DUMMY_INDUSTRY 0.001352 0.001136 0.001888 0.00058 -0.000596 0.009845 -0.019891
EXCHANGE_RATE 0.84264*** 0.841052*** 6.123992*** -2.454888*** -3.20475*** 0.589401 -88.37747***
GDP_CAP -12.35566*** -12.32086*** -0.516489*** 0.153298*** 0.149575** -0.091621 5.719982***
LEVERAGE -0.007928** -0.008019*** 0.00805** -0.000835 0.003201 0.003396 -0.013855
MTB 0.000208 0.000322 -0.000426 0.000415* -0.001383 0.005953* 0.004088
RELATIVE_SIZE 0.00068 0.000631 -0.000822 0.0000763 -0.001644 -0.001061 0.002638
ROA 0.006657 0.010188 0.029457 -0.001664 0.034615* -0.166478 -0.21626
SIZE 0.000464 0.001143 -0.001265 0.001248 0.00067 0.026569** -0.01874
C -1.241452*** -1.248398*** 1.057255*** -0.215391*** -0.004998 0.955204** -6.736251***
Adjusted R2 0.090699 0.093681 0.067091 0.057168 0.0895 0.0251 0.039106
Obs 1327 1327 1327 1327 1327 1327 1327
***, ** and * indicate statistical significance at the 1 percent level and 5 percent level, 10 percent level (two-tailed).
See Table 1 for variable definitions.
52
Table 3.6. Multilevel linear regression with all earnings management measures with fixed and random effect
Table 3.6 Panel A1. Multilevel linear regression with DA1, DA2, RM_CFO, RM_DE, RM_PC as dependent variables
Dependent variable DA1 DA2 RM_CFO RM_DE RM_PC D_ACCRUAL D_REAL
MA_CRISIS -0.010388* -0.010416* -0.01593** 0.002118 0.00883** -0.006224 0.048217*
DUMMY_CASH 0.00325 0.002121 -0.010565* -0.000019 0.004044 -0.021407 0.04404
DUMMY_INDUSTRY 0.000264 0.000575 -0.002327 0.000334 0.000681 -0.005346 0.03163
EXCHANGE_RATE-
6.490961***-
6.678384*** 1.443133-
0.750836***-
9.979292*** -3.941562-
95.57009***
GDP_CAP 0.427823*** 0.437431*** -0.137243** 0.043736*** 0.6737*** 0.223849 6.709793***
LEVERAGE -0.032808** -0.032957** 0.00725 -0.001238 -0.000977 0.023205 0.077099
MTB -0.000673** -0.0007140.004244**
* -0.000123 0.002666* 0.001596 0.01579
RELATIVE_SIZE 0.002113*** 0.002176*** -0.001898** 0.000139 -0.001196 0.000727 0.001932*
ROA -0.014904 -0.017175 0.000103 0.00054 -0.009075 0.189085** 0.21671
SIZE -0.009065* -0.003869 0.008938 0.000974 -0.014854* 0.038986**-
0.192953***
C-
0.517427***-
0.573505***0.250213**
*-
0.069518***-
0.773657*** 0.383509*-
7.867124***
53

Adjusted R2 0.030339 0.04445 0.08531 0.345131 0.33242 0.463429 0.15128
Obs 1948 1948 1948 1948 1948 1948 1948
***, ** and * indicate statistical significance at the 1 percent level and 5 percent level, 10 percent level (two-tailed).
See Table 1 for variable definitions.
Table 3.6 Panel A2. Multilevel linear regression with DA1, DA2, RM_CFO, RM_DE, RM_PC as dependent variables
Dependent variable DA1 DA2 RM_CFO RM_DE RM_PC D_ACCRUAL D_REAL
MA_CRISIS -0.004242* -0.00457** -0.007126** 0.002079 0.008428** -0.012667 0.012509
DUMMY_CASH 0.001147 0.002001-
0.009286*** 0.000223 0.002739 -0.000905 0.063605**
DUMMY_INDUSTRY 0.000266 0.000179 0.000983 0.000279 -0.002755 0.005898 -0.024437*
EXCHANGE_RATE-
6.225117***-
6.224224*** 2.264576***-
0.777733***-
11.00804*** -3.118497*-
98.75745***
GDP_CAP 0.423541*** 0.421671***-
0.168433*** 0.045442*** 0.730559*** 0.190203 6.819327***
LEVERAGE-
0.008517***-
0.008515*** 0.008633*** -0.000802 0.003965 0.005691 0.00162
MTB -0.000249 0.0000864 0.001003 0.0000458 -0.000108 0.001849 0.010124*
RELATIVE_SIZE 0.0000588 0.0000839 -0.000789* 0.0000894 -0.001335** -0.000609 -0.001154
ROA -0.001646 -0.008533 0.022612 0.001662 0.000693 0.019135 -0.267382
SIZE -0.002593 -0.000819 0.001526 0.00082* -0.002977 0.020957*** -0.026746
C-
0.601399*** -0.61305*** 0.320273***-
0.070803*** -0.93456*** 0.545367***-
9.303975***
54
Adjusted R2 0.041923 0.044093 0.012249 0.016725 0.069889 0.04459 0.157649
Obs 1948 1948 1948 1948 1948 1948 1948
***, ** and * indicate statistical significance at the 1 percent level and 5 percent level, 10 percent level (two-tailed).
See Table 1 for variable definitions.
Table 3.7 Panel A1. Multilevel linear regression with DA1, DA2, RM_CFO, RM_DE, RM_PC as dependent variables
Dependent variable DA1 DA2 RM_CFO RM_DE RM_PC D_ACCRUAL D_REAL
DUMMY_CRISIS -0.025006*** -0.025205*** -0.019618*** 0.000116 0.039131*** -0.014478 0.245867***
DUMMY_CASH 0.002453 0.003371 -0.010551** 0.000321 0.000936 -0.000994 0.051602
DUMMY_INDUSTRY 0.001001 0.000893 0.000185 0.000111 -0.003955 0.007798 -0.011587
EXCHANGE_RATE -5.396207*** -5.375722*** 2.547622*** -0.59348*** -11.29627*** -4.905334** -103.9912***
GDP_CAP 0.426844*** 0.424762*** -0.211388*** 0.037179*** 0.686523*** 0.254482* 6.674947***
LEVERAGE -0.007622** -0.007579** 0.008212** -0.000736 0.003282 0.005056 -0.00325
MTB 0.000123 0.000467 0.000668 0.0000927 -0.001038 0.001454 0.00376
RELATIVE_SIZE -0.0000326 -0.00000318 -0.000706 0.0000898 -0.001366*** -0.00058 -0.000485
ROA -0.0104 -0.018503 0.030146 0.00117 0.010187 0.018984 -0.213989*
SIZE -0.002392 -0.000623 0.000432 0.000504 -0.001883 0.019589** -0.034329***
C -0.71942*** -0.732743*** 0.438542*** -0.063579*** -0.759602*** 0.568776*** -8.084812
Adjusted R2 0.058535 0.062065 0.025214 0.012228 0.086462 0.09774 0.177821
Obs 1860 1860 1860 1860 1860 1860 1860
55

***, ** and * indicate statistical significance at the 1 percent level and 5 percent level, 10 percent level (two-tailed).
See Table 1 for variable definitions.
Table 3.7Panel A2. Multilevel linear regression with DA1, DA2, RM_CFO, RM_DE, RM_PC as dependent variables
Dependent variable DA1 DA2 RM_CFO RM_DE RM_PC D_ACCRUAL D_REAL
DUMMY_CRISIS 0.051843 0.053588 -0.050677** 0.003251 0.059331*** -0.007191 0.53704***
DUMMY_CASH -0.017974 -0.018621 0.016048 -0.001671 -0.007029 -0.019697 -0.211879
DUMMY_INDUSTRY -0.026793*** -0.027478** 0.03552*** 0.001361 0.010672** -0.017329 -0.216008**
EXCHANGE_RATE 2.273331 3.04711 0.326132 -0.307448 -9.158955* 0.821103 -33.85718
GDP_CAP -0.189056 -0.245473* -0.010293 0.009767 0.441976 -0.09083 1.751333
LEVERAGE -0.070592* -0.074492* 0.086893* -0.00933* 0.009004 0.008442 -0.435588*
MTB 0.005165* 0.00551** -0.002727 0.0000974 -0.000744 0.000713 0.043888
RELATIVE_SIZE 0.026331** 0.024601 -0.015893 0.001376 -0.003361 0.004094 -0.039736
ROA -0.084752 -0.067976 0.113539 -0.006079 0.023936 0.10077 -0.726289
SIZE 0.01543* 0.018029* 0.002079 0.004049** -0.014854* 0.03389* 0.003308
C 0.189696 0.253018 0.023204 -0.040195 -0.086567 0.89461 -0.744839
Adjusted R2 0.117227 0.122614 0.119364 0.0721 0.189497 0.038896 0.177171
Obs 88 88 88 88 88 88 88
***, ** and * indicate statistical significance at the 1 percent level and 5 percent level, 10 percent level (two-tailed).
See Table 1 for variable definitions.
56

Table 3.8 Panel A1. Multilevel linear regression with DA1, DA2, RM_CFO, RM_DE, RM_PC as dependent variables
Dependent variable DA1 DA2 RM_CFO RM_DE RM_PC D_ACCRUAL D_REAL
TYPE_MA 0.0259356*** 0.0281242***-
0.036746*** 0.000511 -0.0041831 0.025744**-
0.0776154**
Leverage -0.0042384 -0.0032004 0.0108942 -0.0006516 0.0006714 0.0207558* 0.1111323
ROA -0.0388109* -0.0547021* 0.0305616* -0.0012848 -0.0021647 0.1997481-
0.1510476**
MTB 0.0010088 0.0014579 -0.0010042* -0.000016 -0.0017362* -0.0025986 0.0081325
Size -0.0064213* -0.0031591 -0.0012682 0.0005298* -0.0108738*** 0.015112* -0.0639764
RE_SIZE -0.0007578 -0.0006841 -0.0005236 0.0000723* -0.0007873* -0.0002981 -0.0058217
Dummy_CASH 0.0004177 0.0022553 -0.0009737 -0.000263 0.0103175** -0.0189943** 0.092314
Dummy_Industry -0.0017853 -0.0017694 0.0018774 0.0002347 -0.0059898* 0.0023783 -0.0238199
GDPCAP 0.296948*** 0.2920264*** -0.0307679 0.0081499* 0.8775763*** 0.3830517*** 6.782115***
EX_RATE -3.237418*** -3.196283*** 0.6465726 -0.1351882** -13.83262*** -6.879388***-
105.5861***
Intercept -0.5493847*** -0.572976*** 0.1239305** -0.0258356*** -0.9877303*** 0.4788118*** -8.08772*
Adjusted R2 0.0637 0.0679 0.017 0.0108 0.3307 0.0248 0.283
Obs 621 621 621 621 621 621 621
***, ** and * indicate statistical significance at the 1 percent level and 5 percent level, 10 percent level (two-tailed).
See Table 1 for variable definitions.
57

Table 3.8 Panel A2. Multilevel linear regression with DA1, DA2, RM_CFO, RM_DE, RM_PC as dependent variables
Dependent variable DA1 DA2 RM_CFO RM_DE RM_PC D_ACCRUAL D_REAL
TYPE_MA -0.006509 -0.0057312 -0.0029099 -0.02506*0.0099963*
* 0.0138702 -0.0667168*
Leverage -0.0079276** -0.0080186*** 0.0079884** -0.0007907* 0.0029751 0.003396 -0.0138555
ROA 0.0066568 0.0101883 0.0269052 -0.0005828 0.0365013 -0.1664783* -0.2162602
MTB 0.0002079 0.0003218 -0.0003325 0.000347* -0.0015608 0.005953* 0.0040885
Size 0.0004643 0.0011433 -0.0008866 0.0009115 0.0018308 0.026569** -0.0187405
RE_SIZE 0.0006796* 0.0006305 -0.000863* 0.0000853 -0.0018355* -0.0010605 0.0026379
Dummy_CASH 0.0026979 0.0027264 -0.0137518*** 0.0002876 -0.0048304 0.0148806 0.0135084
Dummy_Industry 0.0013523 0.0011361 0.0019006 0.0003037 -0.0017864 0.0098449 -0.0198905
GDPCAP 0.8426398*** 0.8410524*** -0.5191848*** 0.1556336*** 0.1574825* -0.091621 5.719982***
EX_RATE -12.35566*** -12.32086*** 6.192638*** -2.504169*** -3.332503* 0.5894006 -88.37747***
Intercept -1.241452*** -1.248398*** 1.053977*** -0.2138275*** -0.0222703 0.9552036*** -6.736251***
Adjusted R2 0.0991 0.1021 0.0559153 0.011375 0.0859307 0.0117 0.048
Obs 1327 1327 1327 1327 1327 1327 1327
***, ** and * indicate statistical significance at the 1 percent level and 5 percent level, 10 percent level (two-tailed).
See Table 1 for variable definitions.
58

Table 3.8 Panel B. Multilevel linear regression with DA1, DA2, RM_CFO, RM_DE, RM_PC as dependent variables
Dependent variable DA1 DA2 RM_CFO RM_DE RM_PC D_ACCRUAL D_REAL
MA_Crisis 0.004242** 0.0045696** -0.006157** 0.0023494 0.0080187** -0.0126667 0.0125086*
Leverage-
0.0085172***-
0.0085153*** 0.0089053*** -0.0008451 0.0044642 0.0056907 0.0016196
ROA -0.0016455 -0.0085335 0.024179 0.0013633 0.0006025 0.0191354 -0.267382*
MTB -0.0002489 0.0000864 0.0009573 0.0000635 -0.0003424 0.0018486 0.0101237*
Size -0.0025932 -0.0008191 0.0013953 0.000604 -0.0016781 0.0209567*** -0.0267462
RE_SIZE 0.0000588 0.0000839 -0.0007737 0.000089-
0.0014638*** -0.0006092 -0.0011539
Dummy_CASH 0.0011474 0.0020015 -0.0089401** 0.0003511 0.0030112 -0.0009049 0.0636048**
Dummy_Industry 0.0002663 0.0001792 0.0011677 0.0001951 -0.0037896 0.0058982 -0.0244365
GDPCAP 0.4235409*** 0.4216711***-
0.1753996*** 0.0485216*** 0.7454665*** 0.1902026 6.819327***
EX_RATE -6.225117*** -6.224224*** 2.401134***-
0.8290332*** -11.23673*** -3.118497-
98.75745***_cons -
0.6013986***-
0.6130503***0.327038*** -
0.0725643***-0.966605*** 0.5453673*** -
9.303975***
Adjusted R2 0.0538959 0.0525137 0.0568676 0.091332 0.0727759 0.096 0.162
Obs 1948 1948 1948 1948 1948 1948 1948
59

***, ** and * indicate statistical significance at the 1 percent level and 5 percent level, 10 percent level (two-tailed).
See Table 1 for variable definitions.
Table 8 Panel C. Multilevel regression with TYPE_MA and MA_CRISIS as dependent variables
Dependent variable TYPE_MA MA_CRISS Openness 0.1682517*** -4.77757***stock return 0.0200454** -0.3675304***market capitalization -0.0361469** 0.7423295***C 0.8766031*** 2.937075***
F-statistic 42.44779 1790.922Adjust-R square 0.22961 0.7343Obs 1948 1948 *** and ** indicate statistical significance at the 1 percent level and 5 percent level (two-tailed).
See Table 1 for variables definitions.
60

61

Figure 3.1. The amount of M&As activities from 2004 to 2013
Note: Sample means the all M&As activities from 2004 to 2013. SA DO means domestic M&As activities. SA CRO means cross-border activities.
Figure 3.2. The tendency of M&As activities from 2004 to 2013.
Note: Sample means the all M&As activities from 2004 to 2013. SA DO means domestic M&As activities. SA CRO means cross-border activities.
0
50
100
150
200
250
2004 2005 2006 2007 2008 2009 2010 2011 2012 2013
SAMPLE SA DO SA CRO
0
50
100
150
200
250
2004 2005 2006 2007 2008 2009 2010 2011 2012 2013
SA CRO SA DO SAMPLE
62